Article

Smart City Ranking System: A Supporting Tool to Manage Migration Trends for Australian Cities

by
Muhammad Atiq Ur Rehman Tariq
1,2,*,
Maha Hussein
1 and
Nitin Muttil
1,2,*
1
College of Engineering and Science, Victoria University, Melbourne, VIC 8001, Australia
2
Institute for Sustainable Industries & Livable Cities, Victoria University, P.O. Box 14428, Melbourne, VIC 8001, Australia
*
Authors to whom correspondence should be addressed.
Infrastructures 2021, 6(3), 37; https://doi.org/10.3390/infrastructures6030037
Submission received: 9 February 2021 / Revised: 1 March 2021 / Accepted: 2 March 2021 / Published: 8 March 2021
(This article belongs to the Special Issue Smart, Sustainable and Resilient Infrastructures)

Abstract

:
A key driver of Australia’s economic development is through promoting migration. A strong bottleneck to achieve the targets is a disproportional concentration of population in the metropolitan cities. To avoid congestion in these cities, emphasis is being given at the government level to promote the regional cities. With different city ranking systems, this study tries to identify linkage between the city ranking and people’s preference to live there. The proposed ranking system uses six components, namely, economy, mobility, environment, people, living, and governance. A comparison is done between the ranking systems by first assigning the same weightage to the six components and then assigning different weightages based on people’s preferences. This study considered 112 Australian cities, which were ranked by considering their performance based on the non-weighted and weighted parameters. Analytical Hierarchy Process is then used to assign the priorities/preferences of the components, factors, and indicators. The study also incorporates clustering technique to address the issue of missing data/information that is a typical problem with small cities where missing data is a common issue. The results of the comparison demonstrate that assigning weightage to ranking parameters makes the city ranking closer to the preference of people to live in a city. It is also recommended that the city ranking system and urban governance should have closer connection to each other. The lowest performing city ranking parameter should be given higher preferences in urban management and development plans.

Graphical Abstract

1. Introduction

The world population is expected to double with 70% of the population living in cities by 2050 [1,2]. As urbanization continues to grow, the demand for improvements in the cities services increases to accommodate for these predicted urban growths. Through the concept of developing smarter cities, the concern of urbanization can be addressed as the factors covered by smarty cities, ensures a sustainable urban development [3,4,5]. It can be concluded that population increase creates opportunities, yet challenges will also be faced if not prepared for it correctly. Cities are not just a place to live in and work, they are “area of emotional attachment” as each city has their own “personalities”, “traditions”, and “attractions” [6]. Therefore, it can be concluded that the concept of urban sustainability and smart city have been a potential solution to solve the problems concerning urbanization [7].

1.1. The Concept of Smart Cities and Rankings

The definition of a Smart City has “no universally accepted definition” as it means “different things to different people”. Kuru et al. [8] indicate that the agreed definition of smart city is not available as there is no “best formula” to transform each city into a smart city [2,8,9,10]. The general concept of Smart Cities seems to be a simple one, however it is far from the actual definition [11]. The term “smart” is commonly used for marketing purposes to associate devices with terms like user-friendly and user perspective-centered [12,13,14]. Although, the concept of Smart City is still developing, the idea has experienced much debate as there are many ways to interpret a Smart City [15,16]. It can be referred to as a smart technology that increases quality of life (QoL) between the lives and the environment of cities [8,17]. The smart city concept has gained “popularity” recently as cities are starting to use “digital technologies and data” to implement a smarter city [18]. The idea of creating a smarter city involves development in the key factors including but not limited to, energy, water, transportation, public health and safety and other key services [19]. As each city aim to improve by imposing an innovative project, its success relies on the stakeholders to contribute and make these changes effective.
The “smart city” concept is not a recent development. It made its first occurrence in mid-1800′s in the American West self-governing cities [20]. A hundred years ago, only 20% of the world’s population were living in urban areas [21]. This percentage was only 34% in 1960, and was 55% by 2018, and by the middle of the 21st century it is anticipated to increase to 70% [1,21,22,23]. In the 1990s, it then became a concept of “smart growth”, mainly focusing on the transport, mobility, and planning factors [24,25]. By the 21st century, smart cities began to gain a “serious interest” by governments across the world, mainly due to the new innovative technologies [9,26]. The concept of “smart city” become generally accepted in 2009 when introduced by IBM, which has also helped the promotion of sustainable development [8,27].
As technology is constantly improving the implantation of a new ranking system will help smaller cities to identify their areas of improvement. By comparing cities on a smaller scale, it allows each city to see how they perform within their major city. This become more effective, as improvement can be made on smaller scales across the major city, which will have a higher impact on the major cities’ rankings. Whilst only having performed best in one factor, cities claim themselves to be “smart”. The significance of such ranking system allows for each smaller city to see how they rank according to other smaller cities nearby. By being able to see each cities strength and weakness, cities can make changes accordingly to improve and perform their best.

1.2. Australian Regional Cities

Australia is suffering from disproportionate population concentrations and vast distances [28]. The division between metropolitan and regional areas is causing societal, economic, and political issues [29,30]. Not only the internal migration but the immigrants from the other countries prefer to settle in metropolitan cities [31]. The high concentration of population in two of Australian cities, Sydney and Melbourne, is causing many administrative issues for Australian government [32,33,34,35]. These two cities are also the main hotspot for tourism. Australia is consisting of seven states/territory namely New South Wales (NSW), Queensland (QLD), South Australia (SA), Tasmania (TAS), Victoria (VIC) and Western Australia (WA), and the Northern Territory (NT) plus the Australian Capital Territory (ACT). Australian population is distributed extremely disproportional. For example, the populations of either of cities (Sydney and Melbourne) is more than the total population in all other states excluding the QLD that has almost same population as in Melbourne. The same disproportion of population can be observed within all states between their metropolitan cities (regional/state capital city and surrounding cities) and the remaining (regional) areas/cities.
The main reason for population increases in Australia is migration of people from around the globe. Migration may occur for many reasons which may depend on a positive or negative outcome to a person’s life. Parr concluded that internal migration mainly occurs within Australia due to life events such as post-school education or employment [36]. These are also linked to family and friends as they are what make a place “feel like home”. Health facilities in rural areas are inferior in quality [37,38]. Health and amenities are the main reasons for old age population to move to Victorian and New South Wales regional areas [39]. Same is the case of natural hazards, where communities are more prone to these hazards due to inadequate communication and infrastructure setups [40]. These regional rural areas suffer the food security issues as well [41].
Tourism and the proximity of the areas to coast and metropolitan cities are effective factors to achieve internal migration gains [42]. Argent et al. concluded that creativity and amenity are the strong factors to trigger internal migration but the employment is far stronger than these [43]. Due to the discussed factors, various studies have supported the fact that the young population tends to move to the capital cities [44,45].
Australian government is putting serious attempts for sustainable development of Australian cities. The government have initiated several incentives to promote population growth in regional areas. Australian government initiated “The Smart Cities and Suburbs Initiative 2019” with AUD 50 million funds to enhance the livability, competitiveness, and development of Australia’s cities and towns [46]. In addition to incentives, many marketing and promotional attempts to promote the Australian regional areas have also been observed over the time [47,48,49].
Human capital, which is not just the population but a set of skills, knowledge, capabilities, and the productive attributes embodied in people [50], is the main focus of regional development in addition to the services [44]. This always for ways to create new and improve existing services [51,52]. The level of smart development is unbalanced in different cities, which makes it difficult to rank with those that are balanced [51]. As a plan to advance the smart city movement in Australia, Smart Cities Council have hosted an “Australian Smart Cities Awards” to recognize and encourage more smarter cities in Australia. Some of the improvements included free public Wi-Fi; training 3500 students in coding; connecting business to high-speed, high-capability networks; introducing smart bin and water meters, parking and sensors to monitor wildlife and waterways to create a more livable city, etc. [53].

1.3. Research Questions

Development of regional smart cities is a major challenge for the Australian government. Narrow downing the gap between a typical smart city definition and an attractive destination to live is significant. The task becomes even difficult when these small regional cities are lacking the data for the ranking purpose. The presented research targets to identify the effectiveness of smart city ranking system and preferred city ranking system in relation to develop and promote the regional areas. The research addresses the following concern:
“Whether the smart city/preferred city ranking processes can be considered as an effective indicator for human capital attraction within Australian context?”

2. Literature Review

Due to the “dramatically” changing population of Australia, Graeme [32] suggested for information technology development to be made, which will “tie people and industry” less to the major metropolitan parts of Australia. There is no doubt a link exists between what city people prefer to live in and how smart that certain city is. Anthopoulos and Fitsilis claimed that a competition between cities appears to transit to a smart competition with the modern developments [54]. Rolfe et al. [44] identified the high salaries as an effective motivational factor for the workers to work in regional areas.

2.1. Different Ranking Systems

A number of attempts have been made to rank cities based on different parameters, amongst them the most popular ones are “competitiveness cities”, “livable cities”, “sustainable cities”, global cities” and “intelligent cites”, etc. [6,21,55,56,57,58]. These attempts cover “smart economy”, “smart mobility”, “smart environment”, “smart people”, “smart living”, and “smart governance” [24,59,60,61]. Most recent concept of ranking is the “Global Power City Index” by Memorial Foundation. The Foundation has published ranking the major cities of the world based on their “magnetism or comprehensive power to attract people, capital, and enterprises from around the world” every year since 2008 [56]. The multidimensional ranking system is based on the functions like economy, research and development, cultural interaction, livability, environment, and accessibility [56]. Lin et al. [62] did a reliability analysis to test the reliability of current ranking system. Similarly, a comparative study between three ranking models was performed by Benamrou et al. [63]. Wu [57] developed an “intelligent ranking” system for Chinese cities. Due to the difficulty and variety of living standards, the research and development on “livable cities” has attained much attention [55]. The Arcadis view city selection is not based on the “elite cities”, rather it creates opportunity for cities to make development on the goal for a more sustainable city [6].
Each ranking system has a variety of factors to rank a city. Intelligent cities use the indicators Environment and Urbanism, Governance and Public Service, Economy, and Industries, Informatization and Innovation Human Resource [57]. Livable ranking system access cities based on safety, economy, environment, education, health, transportation, recreation, population density and public utility [55]. Sustainable cities index uses the factors people, planet, and profit [6]. Mohanty et al. used components like smart citizen, smart infrastructure, smart building, smart transportation, smart energy, smart health care, smart technology, smart governance, and smart citizen [61].

2.2. Choice of Indicators and Weightages

There are currently different concepts other than smart cites, which are used to rank cities based on various factors. The choice of indicators must be corelated to “city’s problems” for an easier reading of how cities rank when compared to others [58,64]. Such as studying the effect of energy and waste producers, air pollution, population growth, and livability conditions though a “well-balanced, integrated and socially equal communities” and job opportunities [64,65,66,67]. Batten ranked 50 cities to compare their environmental impact and financial stability [6]. The economist in its report ranked 120 cities for the years 2012–2025 by comparing their competitiveness mainly based on business, environment and the ability to attract talent and visitors [21]. Similarly, the global power city index, ranks 48 major cities based on their “comprehensive power to attract people, capital, and enterprises” [56]. Worawej et al. [55] used a slightly different ranking approach by focusing on a single median class city instead of multiple cities. In the economist ranking system, eight factors are assessed; economic strength, physical capital, financial maturity, institutional character, social and cultural character, human capital, environment and natural hazards, and global appeal [21]. The importance of each factor was weighted by a percentage ranging from 5% to 30%. Sassen selected multiple indicators for global economic cities [68].
There are a number of models that evaluate a smart city at present, which identifies each city “smartness level and increase their competitiveness”, which becomes “very important” for stakeholders [62,63]. The consistency of these systems is important to avoid “unreliable” studies which may affect the future development [62]. The comparison of cities may seem beneficial for tourism; however, this is not the case for all included cities without an accurate analysis of each city’s differences [69]. As a result of these ranking system, cities only utilize the results in favor of their city and disregard the results that show their weaknesses.
Oversimplification may occur when assigning same weightage to six components (economy, mobility, environment, people, living, and governance) of a smart city as it may not identify the real preferred cities. Yadav et al. [70] concluded that applying an equal weightage “was not justifiable logically” for decision making process. Similarly, Bernardon et al. [71] were able to identify the option that were best fit for remote controlled switches, whereas Yadav et al. concluded that the technique gives a “more optimistic value”. In case of smart city ranking, a weightage metric should be done as just adding up the measure will not produce meaningful data to represent the overall performance of cities [72].
According to Xiangrui et al. [73], the Analytical Hierarchy Process (AHP) can be used for both prioritization and ranking the indicators. By proceeding with the technique of AHP, each component/indictor will result in a weightage value assigned to identify its importance amongst the rest. An in-depth analysis was performed by Nripendra et al. [74] to weight the factors in terms of importance using the Analytic Hierarchy Process (AHP) technique. The results show that amongst the six selected barriers, governance is the most significant, followed by economic, technology, social, environmental, legal, and ethical. A similar approach was done by Wang and Chi [75], following AHP as well as gaining 16 expert options to rank the criteria. However, slightly different results were observed, which presents economy on top, followed by society, environment, mobility, and energy.
Due to the ability of AHP to provide more convincing results. Our case studies compare the two ranking systems with and without assigning weightages for appropriate decision making to obtain the final smart score.

2.3. Missing Data Issue for Small Cities

The ranking systems established so far, involve extensive analysis of data to assess the performance of cities. When developing a ranking system for smaller cities a large amount of data is required for best results [52]. However, due to this large amount of data needed, it may be difficult to source as not all data may be available. Which therefore may limit the number of indicators that can be used to rank cities. The limitation of data was also questioned by Leye et al. as the collection of data is essential for systems to be developed [51]. That makes the availability, reliance, and accuracy of data as a pivotal factor in smart city ranking system. With the high reliance of data needed for each city, the collection of this information may seem unreliable due to the “careless annotation or malicious data” of the sources [76]. As a result, this limits the number of cities and indicators used for the ranking system. A usual challenge that may occur is only partial ranking can be found [77]. As a strategy to overcome the lack and unreliability of data, it is recommended that a large scale of data should be collected and integrated [51].
A clustering technique a simple approach but there is no single clustering method that works universally well in all contexts. The idea of clustering involves grouping similar data set which can then be used to address the missing vales [78]. A simple type of clustering is “imputation” where missing values are either replaces with zero or average values of row/column [78,79,80].

3. Smart City Ranking of Australian Regional Cities

Based on extensive research and discussion mentioned above, the final detailed methodology has been developed as part of this study. The methodology has been developed with a wide range of cities covering Australia wide. The process of indicators selection has been established to ensure as many indicators are considered with the limitation of data available for Australian regional cities. The anticipated results for this study should present the areas for improvements are for each city. The methodology developed can be divided into the following steps:
  • Ranking criteria;
  • City selection;
  • Data collection;
  • Data processing;
  • City ranking scores;
  • Analysis.
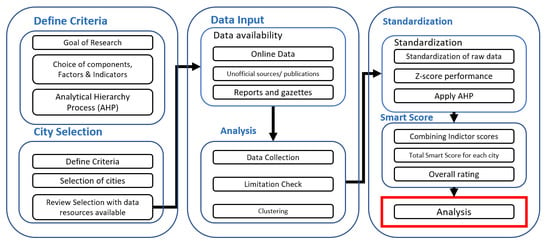
The flow process of the methodology is shown in Figure 1.

3.1. Ranking Criteria

As discussed in Section 2.2 the ranking criteria depends on the aims of the ranking. This study aims at comparing two ranking systems, “Smart Cities” versus “Preferred Cities”. The goals of both ranking systems are described in the following section. However, same ranking parameters are used for ranking but with assigning priorities in case of preferred cities.

3.1.1. Ranking Goals

Smart cities ranking target to compare the performance of each city in every component of smart city aspect, e.g., economy, governance, environment, livability, mobility, and people. These components are assigned same weightage to calculate the smart score. Whereas the preferred cities ranking includes the preferences of people towards their choice of an ideal city to live. Not only the local authorities, but small and medium enterprises, corporations, utility providers and civil society groups develops the smart cities [81]. Therefore, the ranking perspective must include all aspects of cities’ functioning. The procedures to assign rankings are described in the following section.

3.1.2. Ranking Parameters

A smart city ranking may be significant for political decision making, organizational strategy planning, human resource management, and living choices [62]. As the number of ranking systems are increasing with time, each ranking system has different levels of components, which depends on the goals of the ranking system [61,77]. However, a common theme for smart cities includes society, economy, environment, and governance [61]. The smart city measuring parameters should be “carefully chosen” as these characterize cities to be identified though their strengths and weaknesses [77]. Based the types of indicators used, the outcomes of the ranking vary on a large scale. Following components are evaluated in presented research for both cases.
  • Governance is defined by the decision-making and public services of stakeholders. Being an essential component for smart city plan, it allows for citizens to keep the decision and implementation process clear.
  • Economy is a component that influences multiple factors to improve a city, including business life, faster ways to locate business services, participate in urban development, increase GDP, and creating jobs.
  • Environment is designed to improve the sustainability by considering clean energy, clean air, and clean waterfront. Conditions to contribute a smart environment is by decreasing the air pollution, water pollution, and CO2 emissions.
  • Livability is entailed to improve the lives of the people. It allows for people to have a better health care, safety, quality of housing, social cohesion, and other activities in society.
  • Mobility relates to the movement of people and good around the cities. Safe transportation system and ICT accessibility are essential to allow people to get from one place to another.
  • People are the ones who can create an economy, education system, and transportation. Though multiple indicators such as level of education, academic, and technical degrees and additional training, as well as the ability to communicate in multiple language for the social harmony of the society.
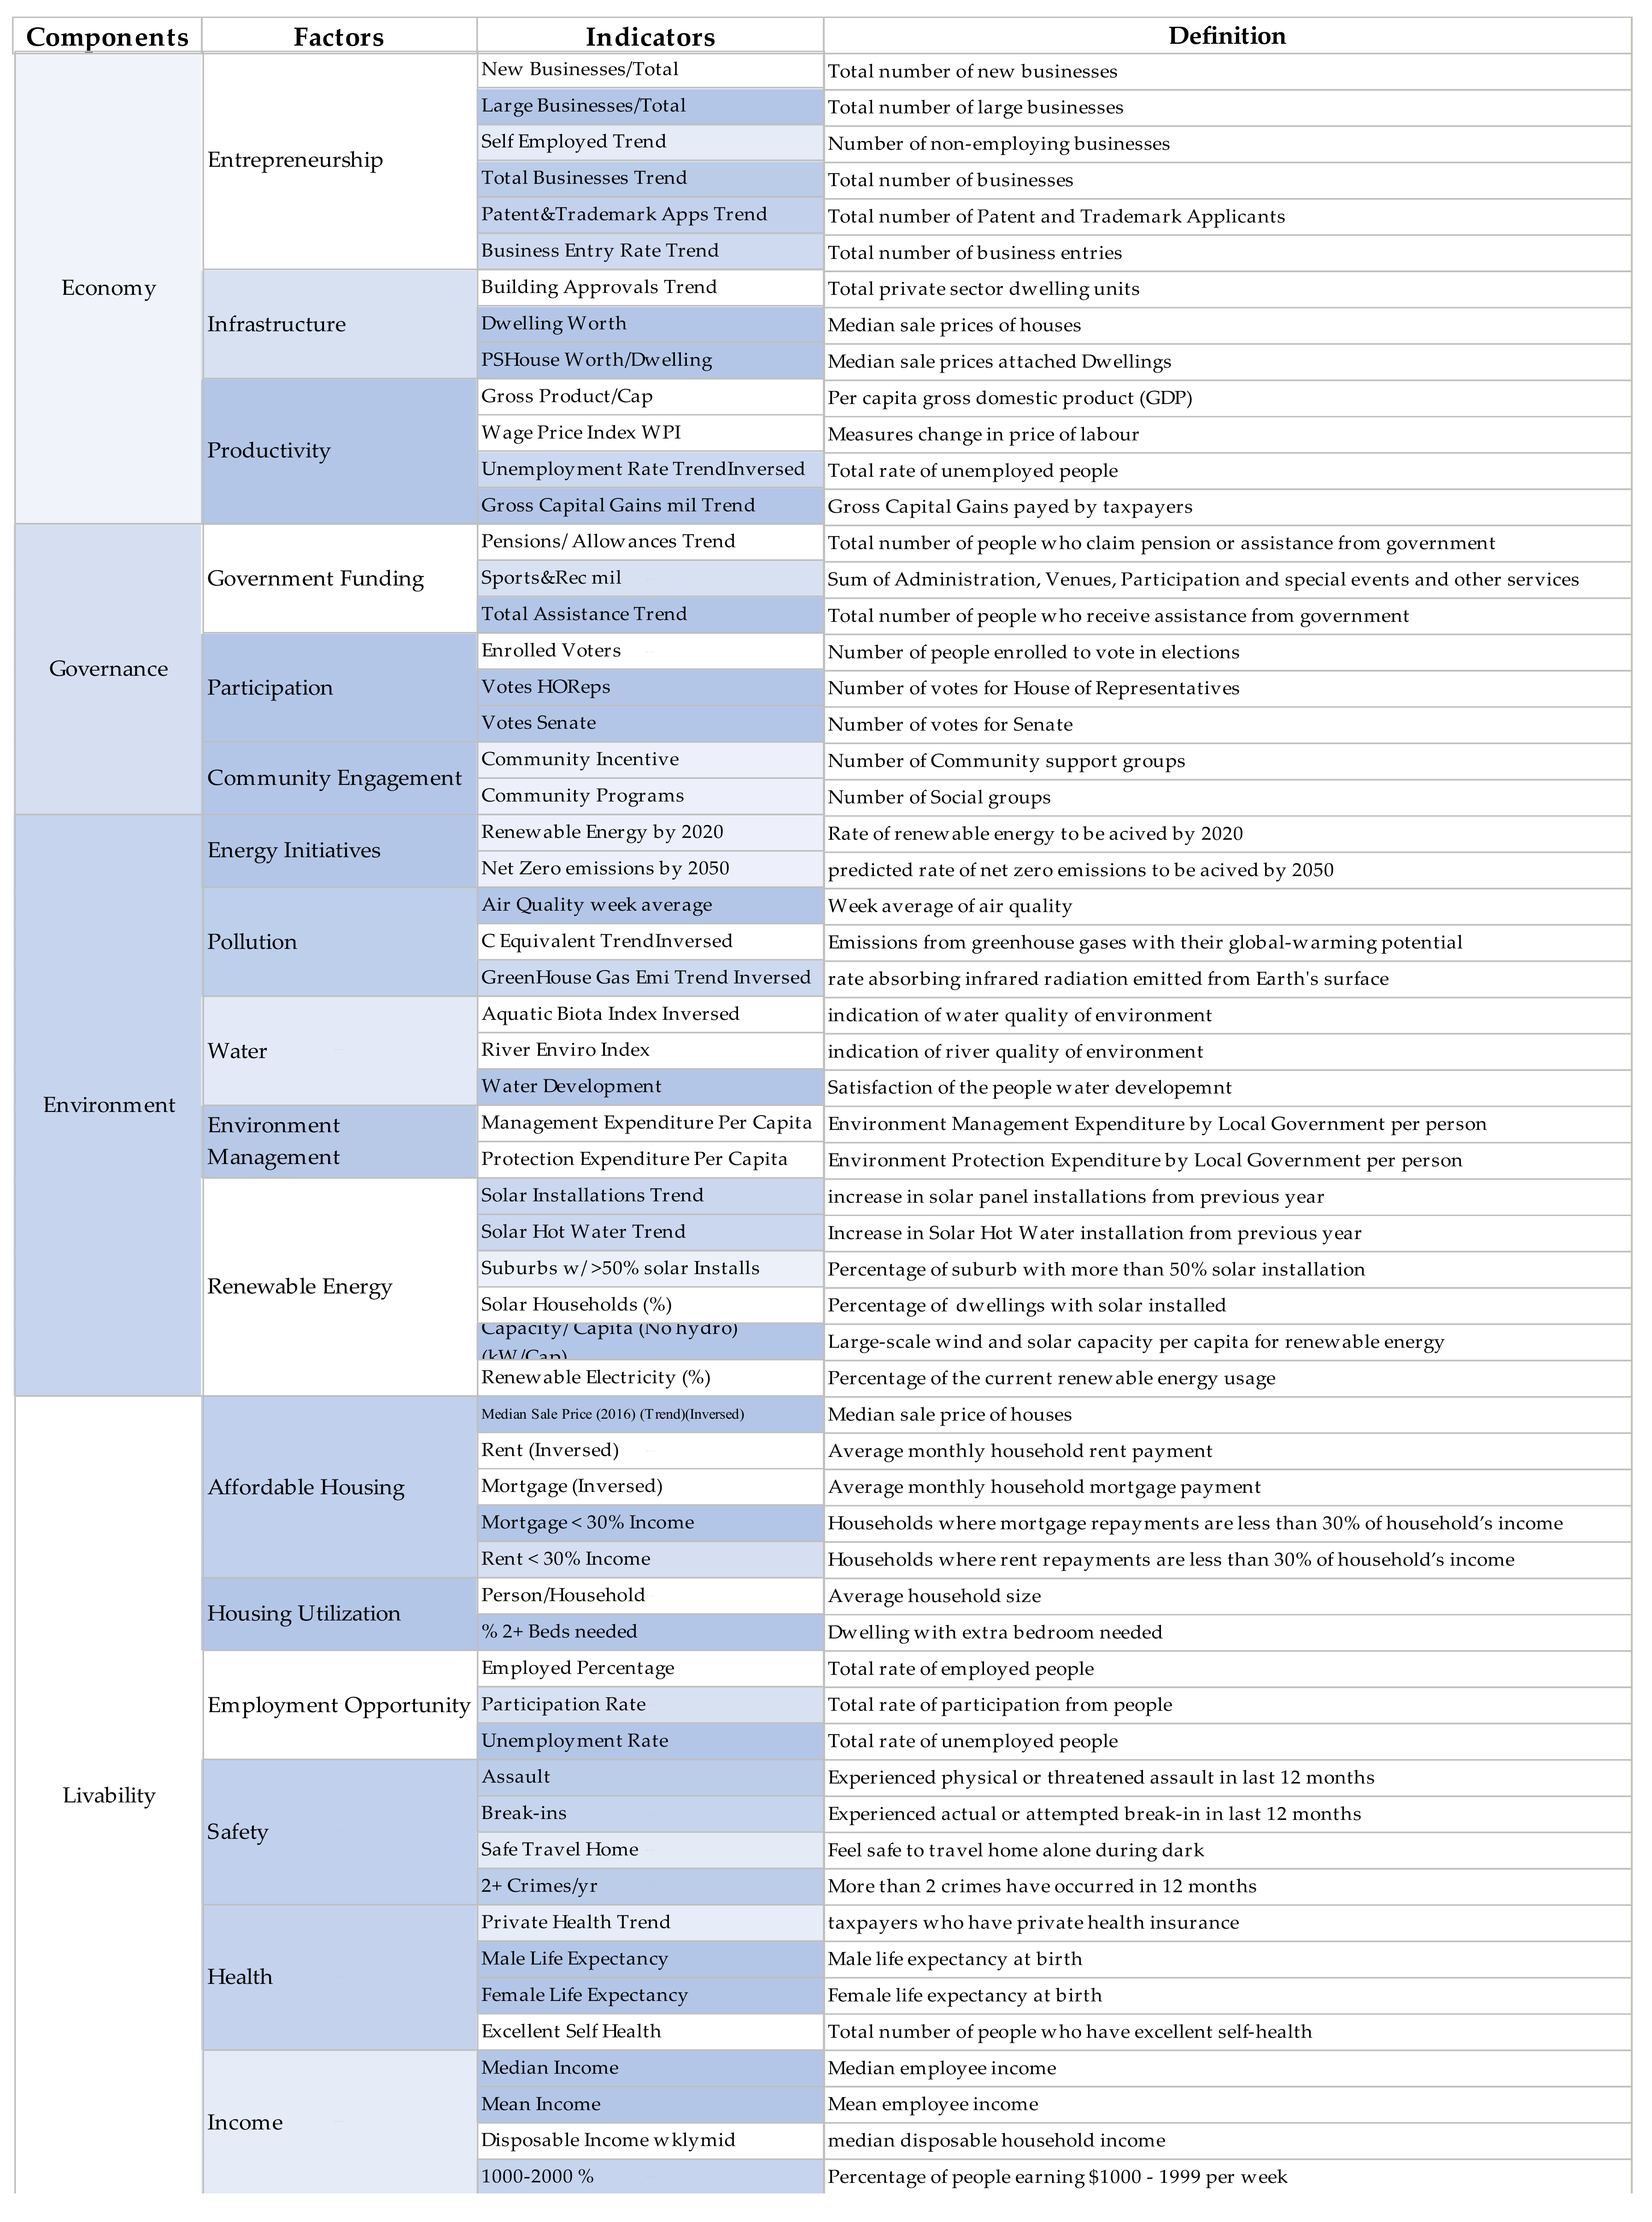
Details of components, factors, and indicators are presented in Figure 2. Along with weightages and brief definitions of indicators.

3.2. City Selection

The research aims at the ranking of Australian regional cities (refer Section 1.2). The selection of Australian regional cities was carried out from Significant Urban Area (SUA) list, which are defined and maintained by the Australian Bureau of Statistics [82]. Targeted areas are described as Statistical Area 2 as per the nomenclature of Australian Bureau of Statistics (ABS). For metropolitan cities (SA−3), only one represented SA−2 is selected for analysis to provide better presentation to regional cities. Table 1 represents the criteria selection for the regional cities to ensure accurate and consistent analysis of each city. Based on the criteria, 112 cities were selected for the ranking and comparison purpose.

3.3. Data Collection

Most of the data were collected from ABS trusted government website. Enormous efforts were required to develop error free database by removing errors and inconsistency in data. Common tasks for data included adjusting names and ensuring codes in Statistical Area 2 (SA−2) for consistency of results. The most recent data available were collected to provide the most up to data ranking system possible. Several indicators were difficult to find at a SA−2 coverage level. Where possible data for these cities were found at a coverage level of SA−3 or SA−4 however for those cities where neither SA−2 nor SA−3 was available the data of its “Greater Capital City Statistical Area” is used. Table 2 shows the various sources of data used for the ranking in presented research work, Table 3. shows the number of indicators used for each coverage level. Further detail about the data source is provided in Appendix A.

3.4. Data Processing

Once the data were collected and a database was developed for the further analysis, the missing values for few cities were identified. Clustering techniques was used to replace the missing values. Before performing AHP/Smart scoring, the data were standardized to carry out the further steps.

3.4.1. Imputation of Missing Data

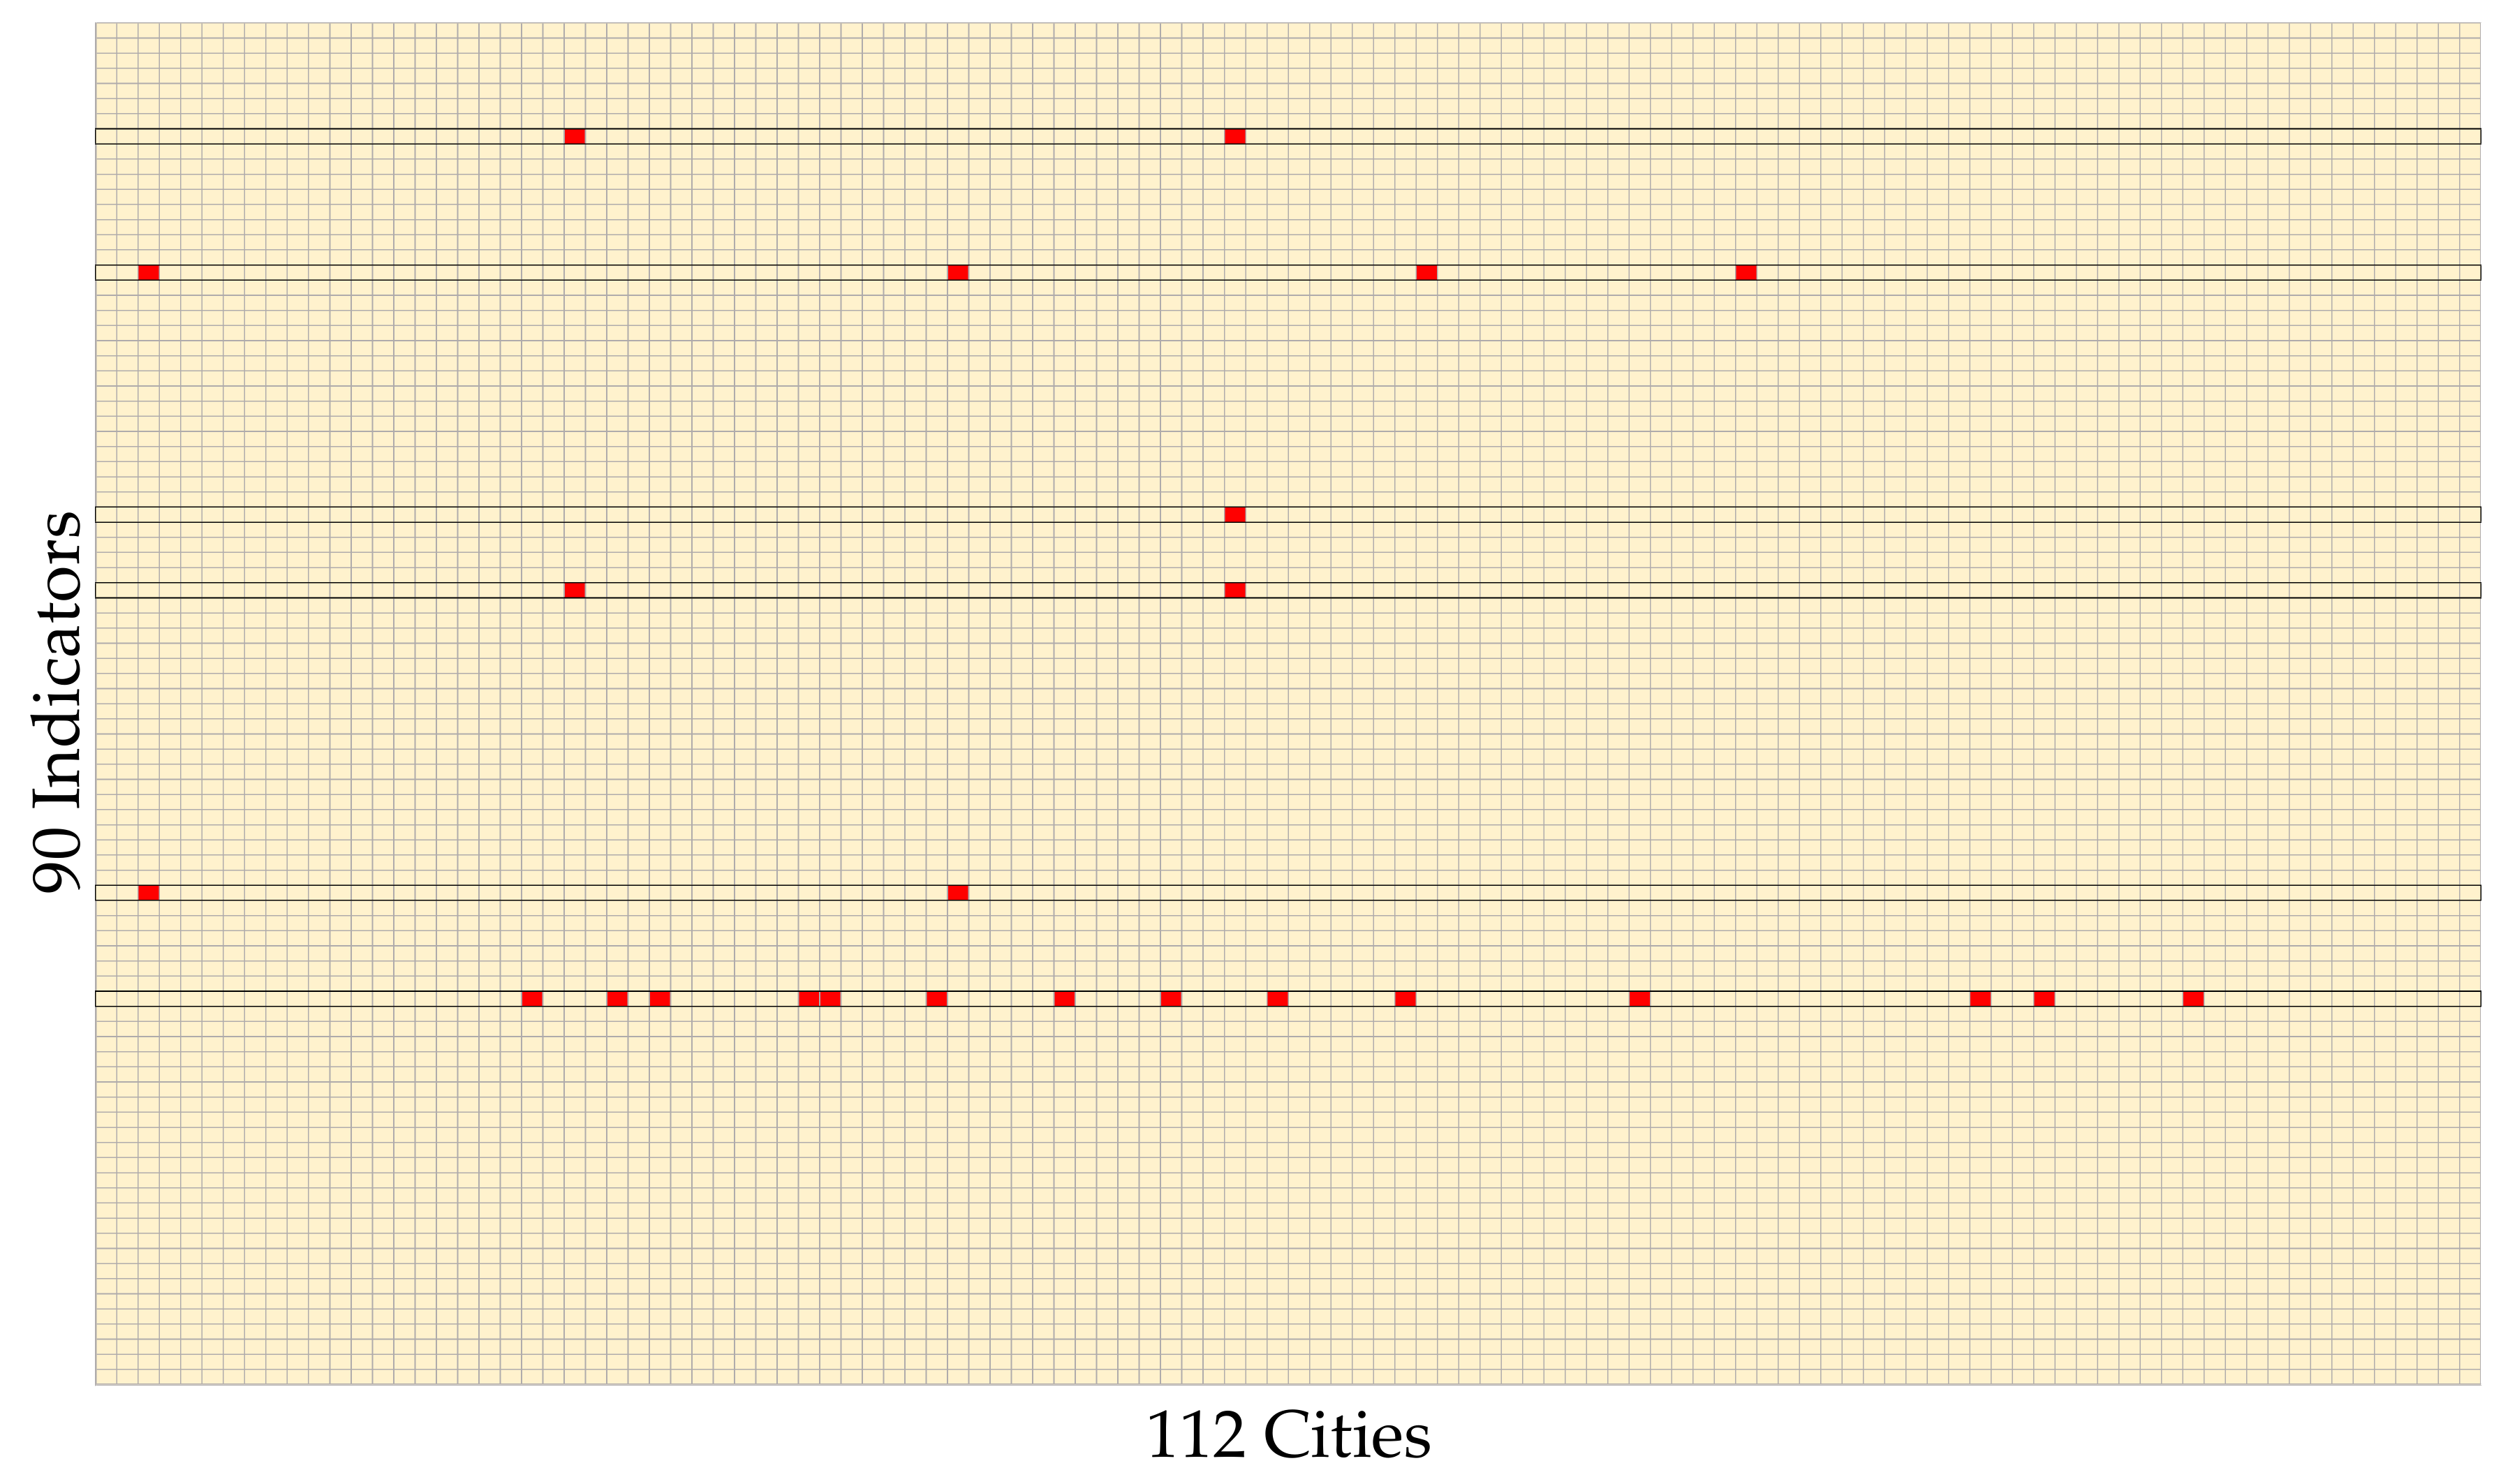
From a total of 10,080 data values, 26 values were identified as missing. Fortunately, the missing data are not great; however, these missing values still need to be replaced for having a full set of data to ensure reliability of scoring results. Figure 3 illustrates the data missing in the total data set. The missing values are represented with red boxes.
For the imputation of missing values, the first step involves the evaluation and temporarily removing the remaining data from the indicators with a missing value [83]. This allows the cities to be ranked with the equal data at the factor level. As a result, a total of six indicators scores are temporary removed for the comparison purposes (refer Figure 3). The next step involves clustering of similar behaving cities, where the indicators are grouped and treated to estimate a missing value. With missing indicator, the cities are grouped at factor level and are sorted in ascending/descending score order. This allowed to identify the cities with similar characteristics. The average value of similar performing cities can be used for the missing indicator of the target city. This process is repeated for each of the 26 missing values.

3.4.2. Data Standardization

Due to the range of different values of each indicator, performing standardization is inevitable. All indicator values are standardized using Equation (1), which transform each indicator into a score that allows for analysis despite the difference in units matrices. This involves standardizing indicators scores with an average value of 0 and standard deviation of 1. Using the values obtained though the AHP mentioned earlier, weightages are applied to these final values. This allows for the higher priority of components factors and indicators to have a higher percentage of the score and vice versa. A test is done ranking the cities based on the standardization scores alone and compared with the values with standardization with AHP. This allows for use to see if significant changes will be made to the ranking which will represent a better accuracy of results.
z =   x μ σ
Equation (1): Standardization of indicators using Z-Score
where:
  • z = Smart Score
  • x   = Output
  • μ   = Mean
  • σ = Standard Deviation

3.5. City Ranking Score

Once the data are standardized, these indicators are combined to calculate the factor scores and consequently average component score are estimated. The sum of all components for each city is presented as the final smart score for each of the 112 cities. City ranking is carried out under two approaches, one by assigning same weightage at the indicator, factor, and component levels and second with weightage assigned using AHP. As mentioned previously, the step of clustering has been performed to overcome the issue of missing values. The standardization of score along with AHP has allowed for data scores to be scored consistently according to the AHP weightages assigned.

Analytical Hierarchy Process (AHP)

As a result of this technique a weightage will be given which reparents the importance for each indictor within the data set. For the accuracy of the ranking system these weightages are used during the averaging stage to present a more desirable ranking for each city. Once the conceptual framework is developed and weightage hierarchy set up, the next step is to obtain the rulings about the pairwise priorities. Five participants were contacted to identify the relevant importance of indicators, factors, and components. To ensure more accuracy with this technique, the AHP is applied to each level which include components, factors, and indicators. Qualitative inputs from the participants were converted into equivalent importance score by averaging the score of participants. Table 4 represents the scale used for this comparison.
The next step is to determine the importance of each criteria against all other criteria using the intensity values from the Table 4. This task is performed by employing pairwise comparison. The process is repeated once at the components, six times at factor level and 26 times at indicator level. The algorithm used for the AHP is as follows:
c 1 c 2 c 3 c n A = c 1 c 2 c 3 c n 1 a 12 a 13 a 1 n 1 / a 12 1 a 23 a 2 n 1 / a 13 1 / a 23 1 a 3 n 1 / a 1 n 1 / a 2 n 1 / a 3 n 1
where c1, c2, c3, and cn represent the criteria for evaluation. Each value above the diagonal matrix of 1 are obtained from the scale. Result format of this matrix are shown below. This requires 33 of the above algorithms to be performed, where a weightage matrix is obtained from each in our case.
W =   c 1 c 2 c 3 c n w 1 w 2 w 3 w n

4. Performance Analysis

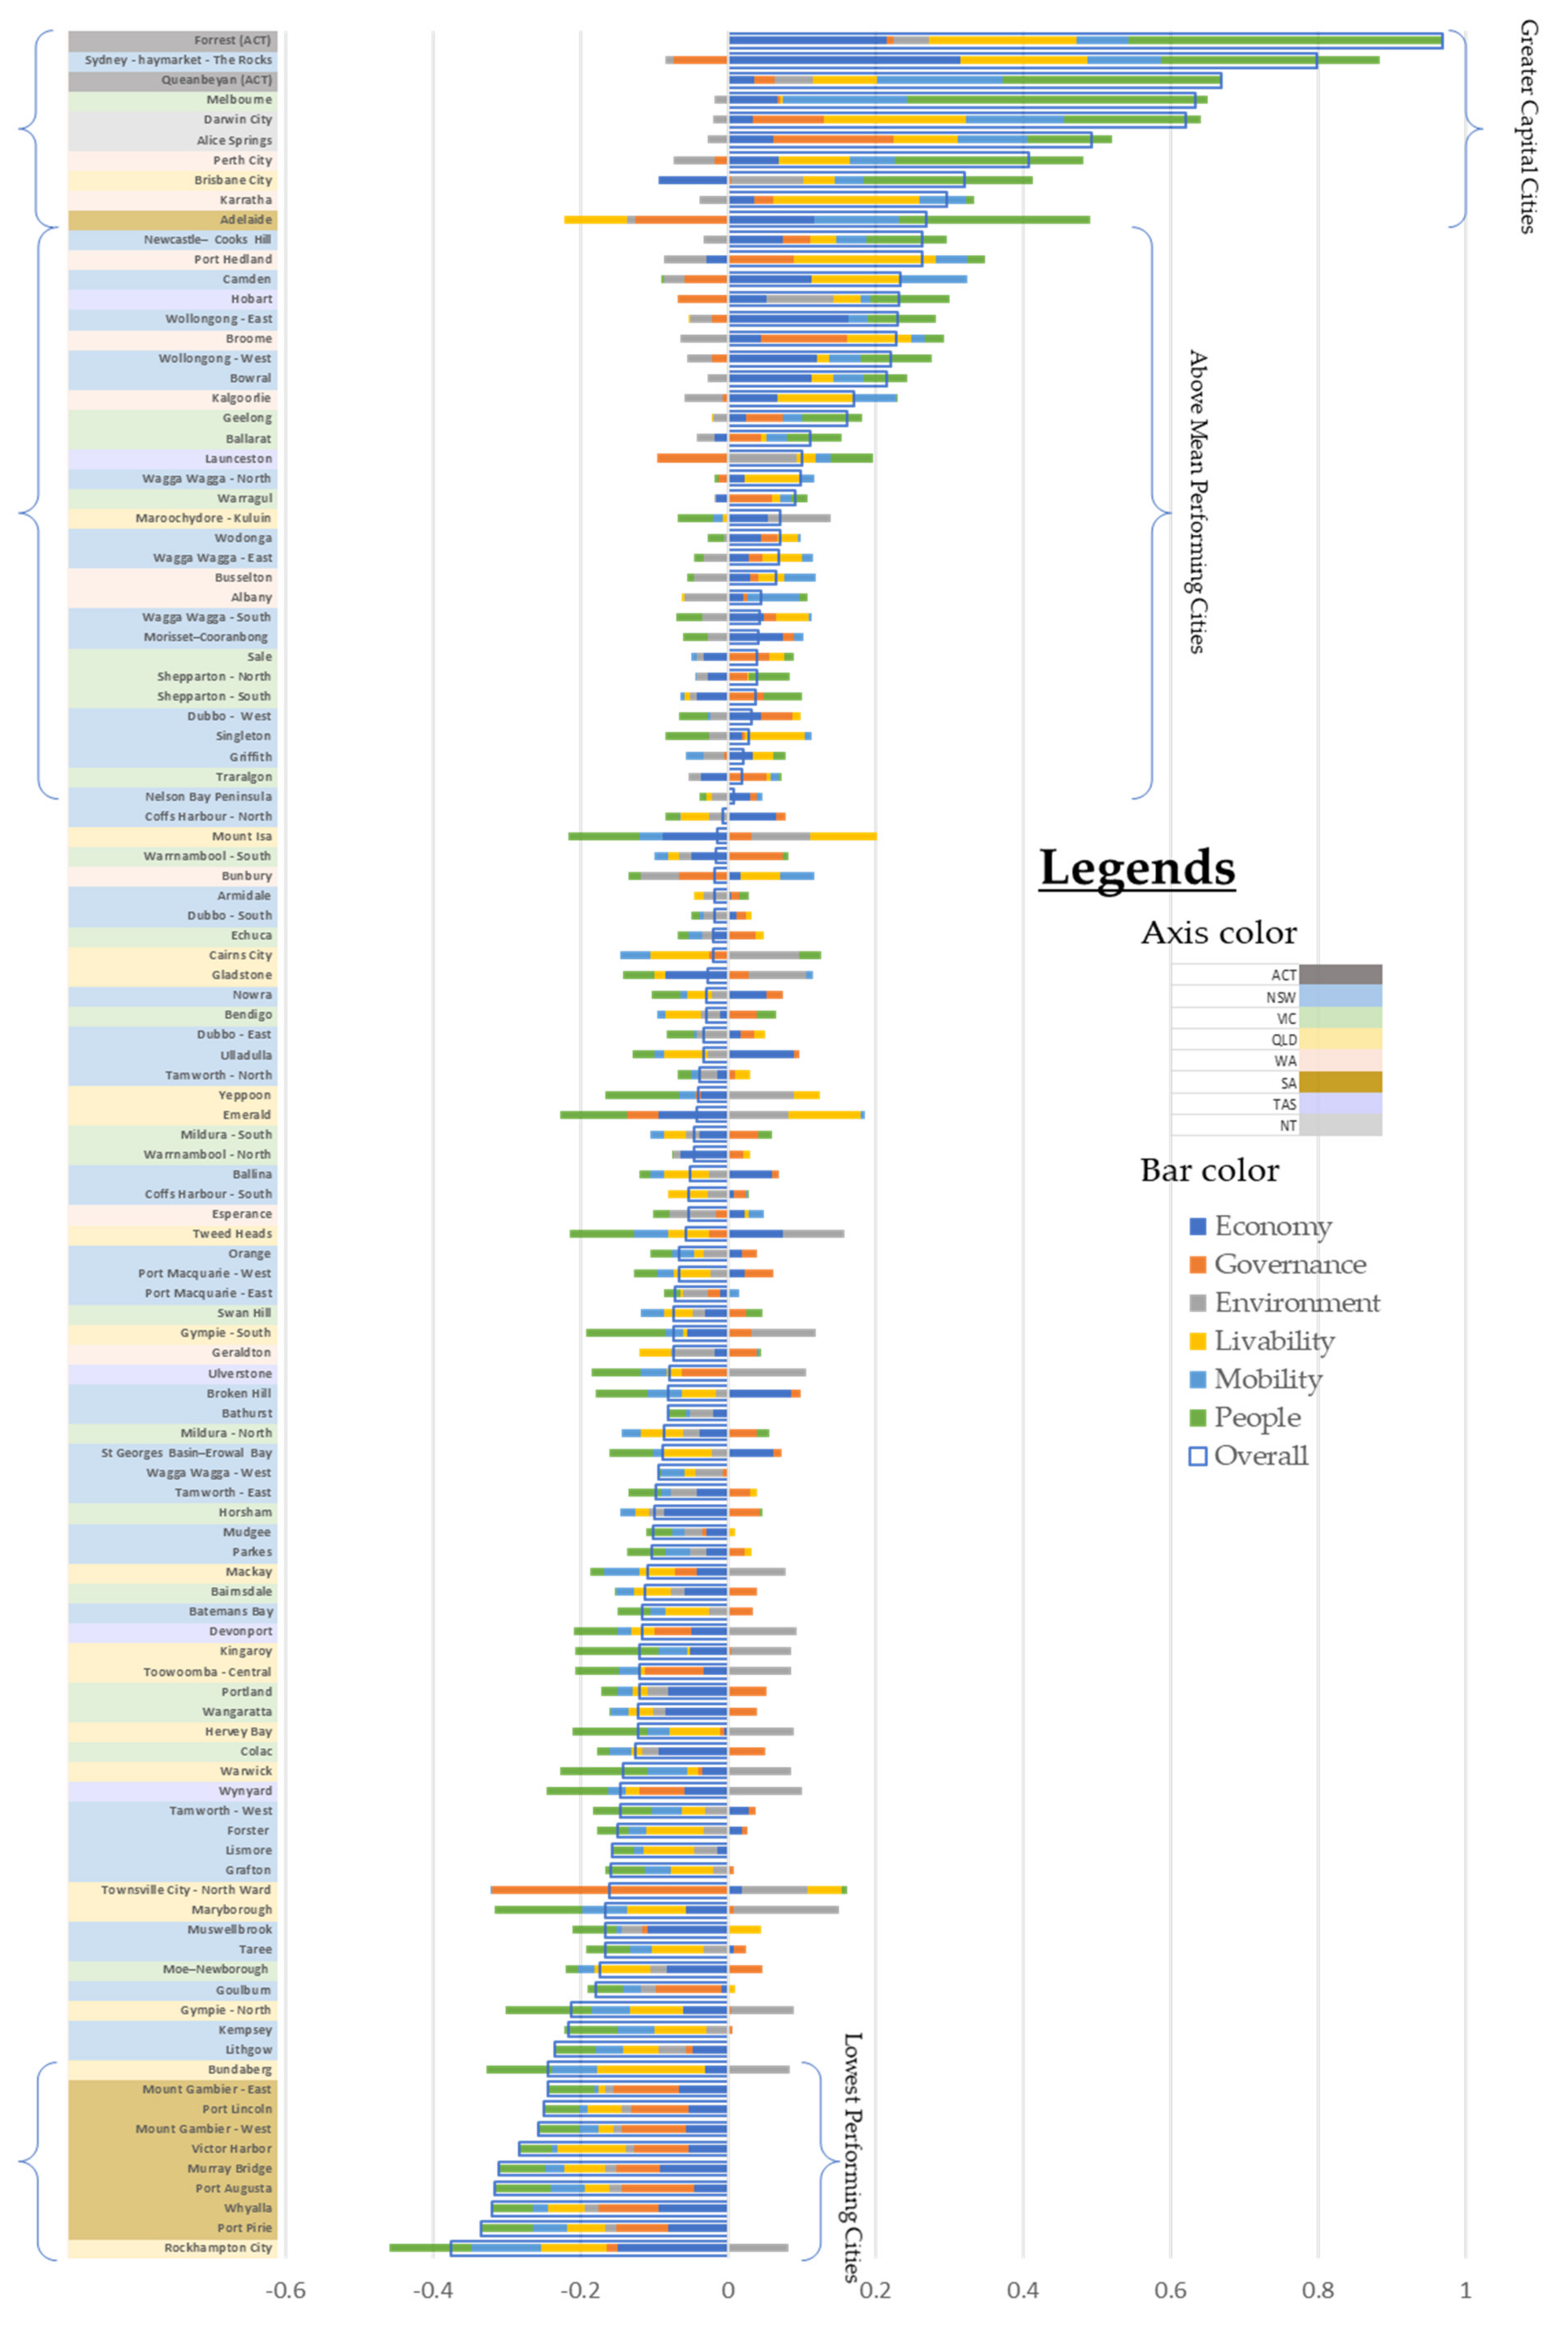
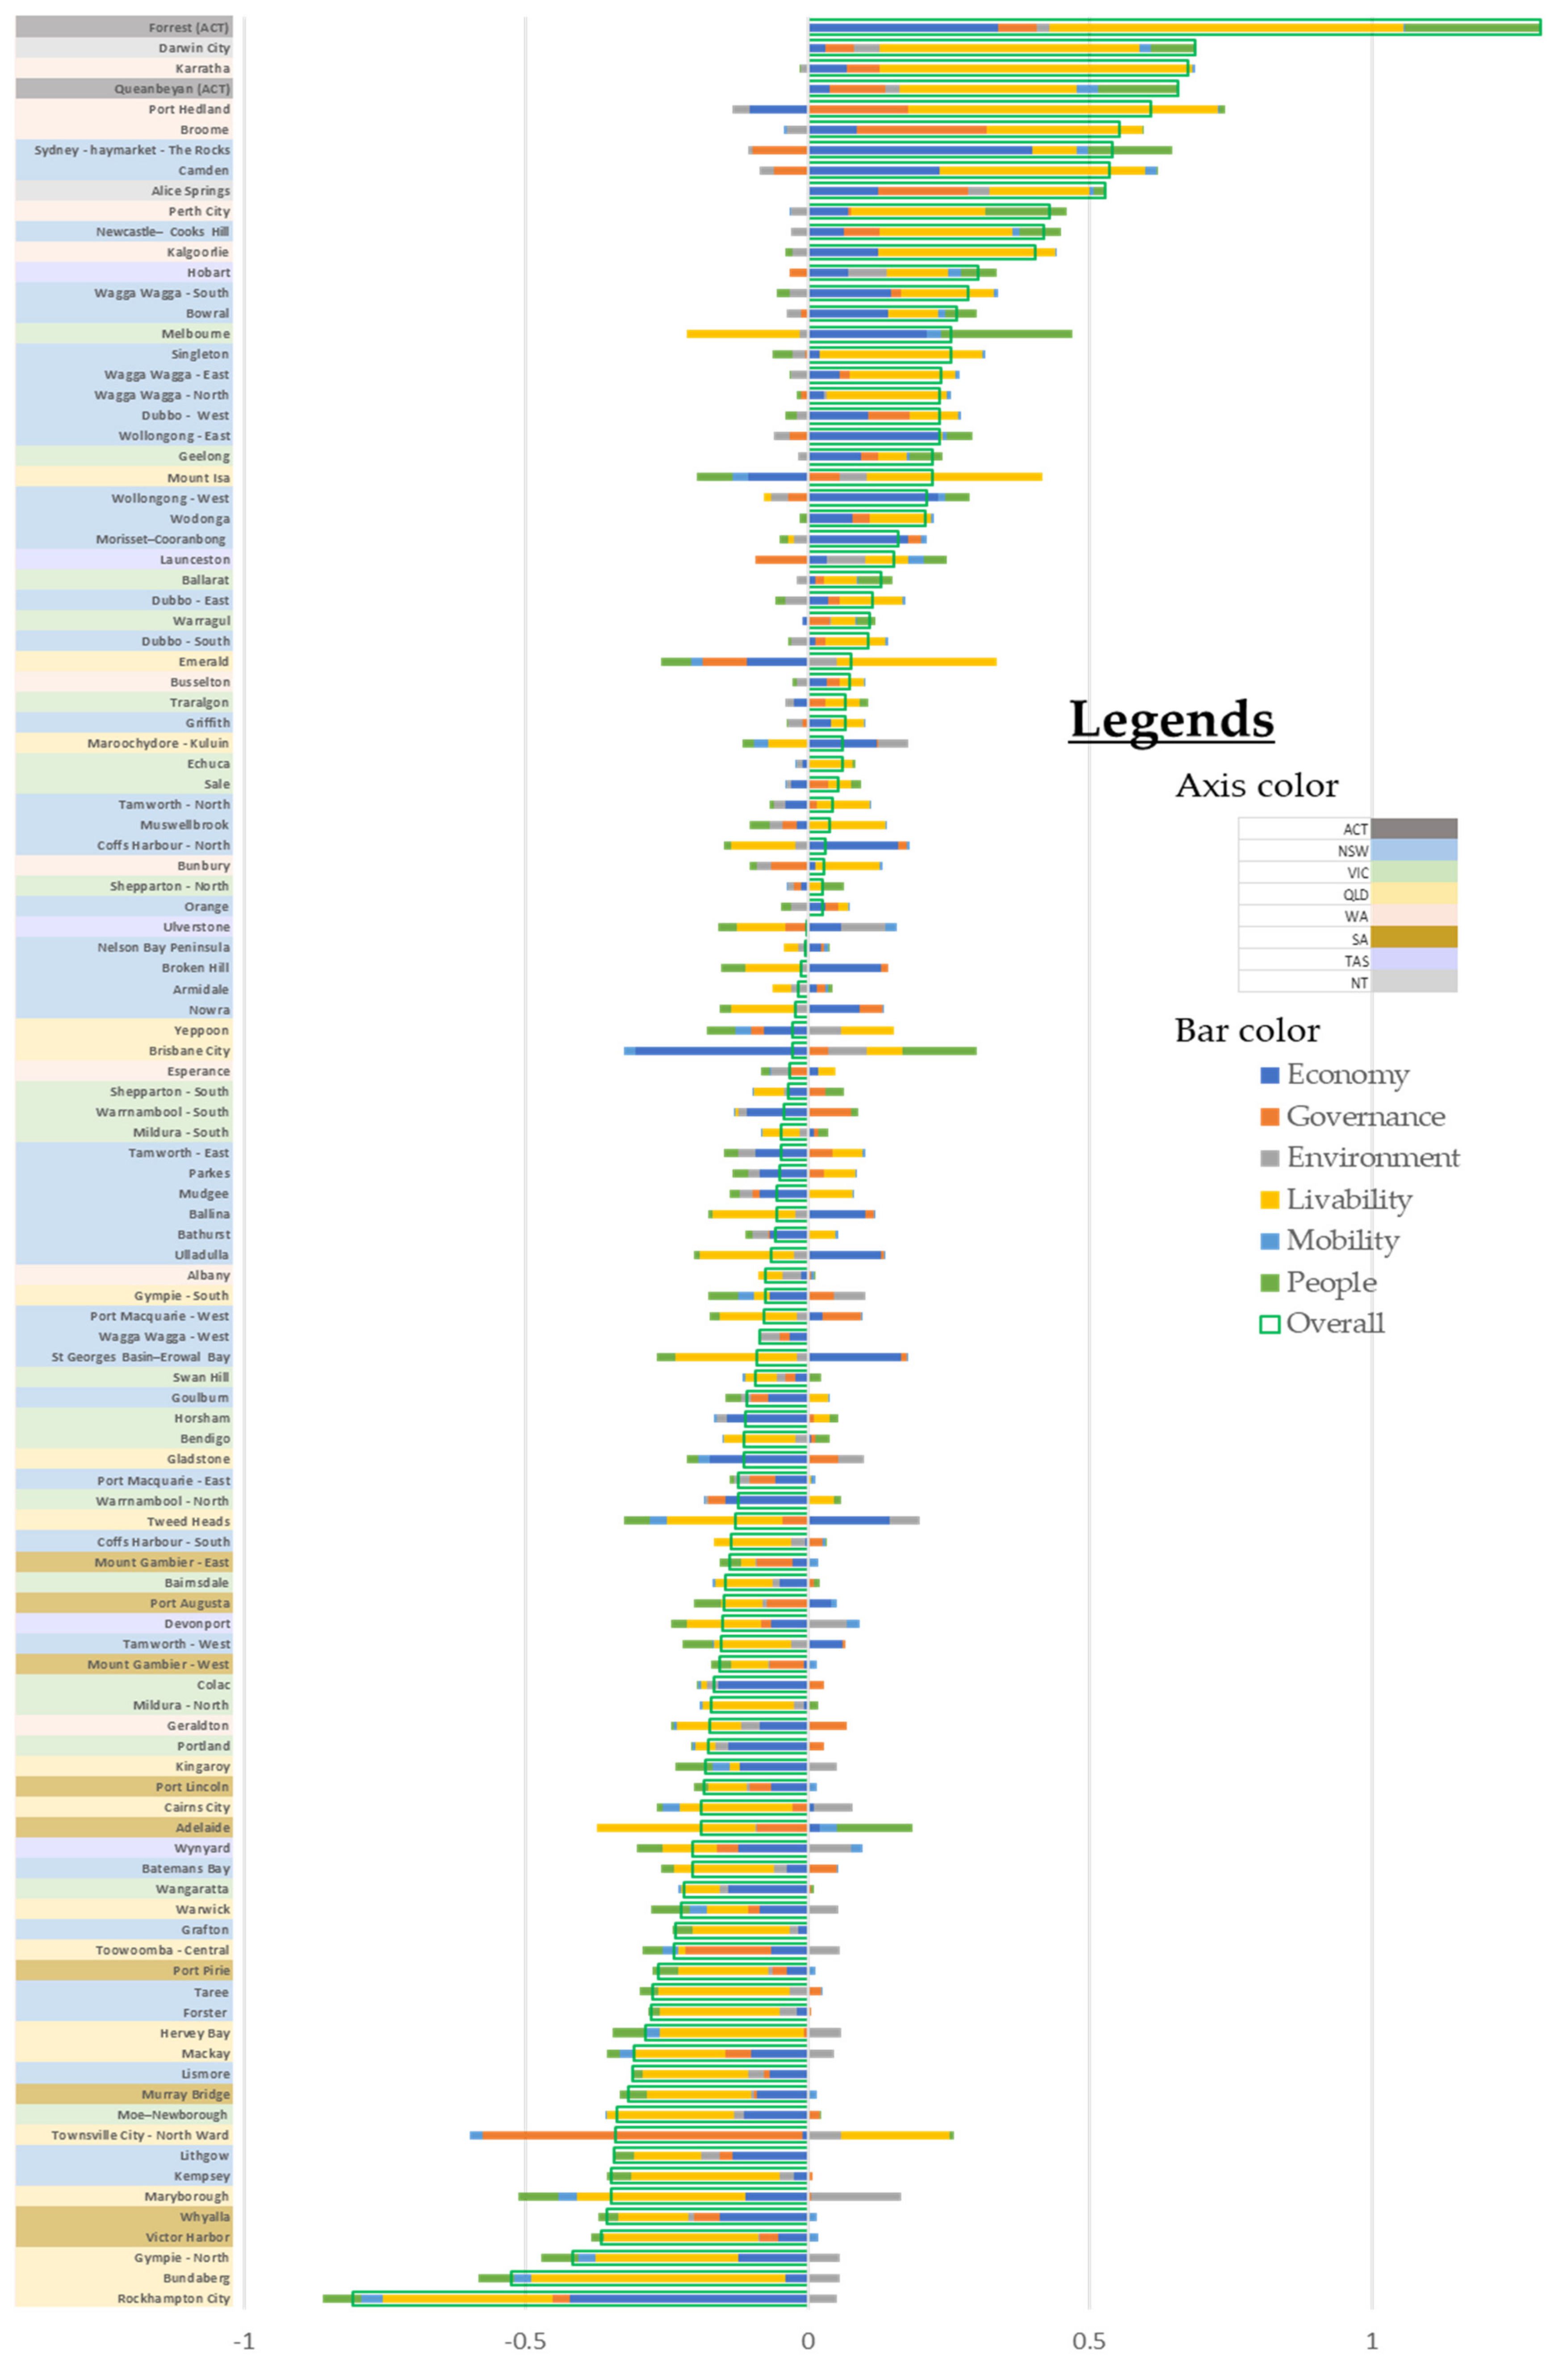
In the final outcomes, smart city ranking produced slightly different results than the one where preference weightages were applied through AHP. Figure 4 shows the smart ranking of cities in descending order whereas Figure 5 shows the preferred cities in descending order. The next section presents an in-depth discussion of the overall ranking of the cities.

4.1. Overall Performance

The overall results from Figure 4 and Figure 5 shows that the greater cities from all states are standing at the top being amongst the smartest cities of Australia. However, these cities also expressed exceptional higher scores as compared to other cities, which is evident from the skewness of both graphs that shows more cities below the average with negative score.
The other significant observation is the similar performance of various cities within a state. Following the greater cities, the group of cities that performed above the mean is mainly consisting of cities from NSW, Victoria, and Western Australia. In the same fashion, the worst 10 cities are from South Australia. Whereas Queensland’s and Tasmania’s cities performed quite fairly.
Figure 5 shows that assigning weightages to the indicators, factors, and components changed the results extensively. The maximum impact of preferences was observed for Adelaide, which scored among the top position for smart city ranking but secured 88th position among the preferred cities due to its poor performance in people and governance.
Another indicator of people’s preference is the number of cities qualified the selection criteria. NSW, VIC, QLD, and WA attracted more population and developed cities due to various economic, climatic, and supporting conditions.
Figure 6 demonstrate the growth rates of Australian states over the last decade. The overall growth rates are compared with the growth rates of capital cities with rest of the states’ cities. Population growth rate over Australia remain 14% for the last decade. Except for VIC, all other states show lower growth rates that shows the dominant growth rate of VIC. Whereas all regional areas expressed negative growth rates that shows the failure of even growth of Australian cities. Figure 6 closely match our results at the overall performance of cities of different states.

4.2. Performance at the Component Level

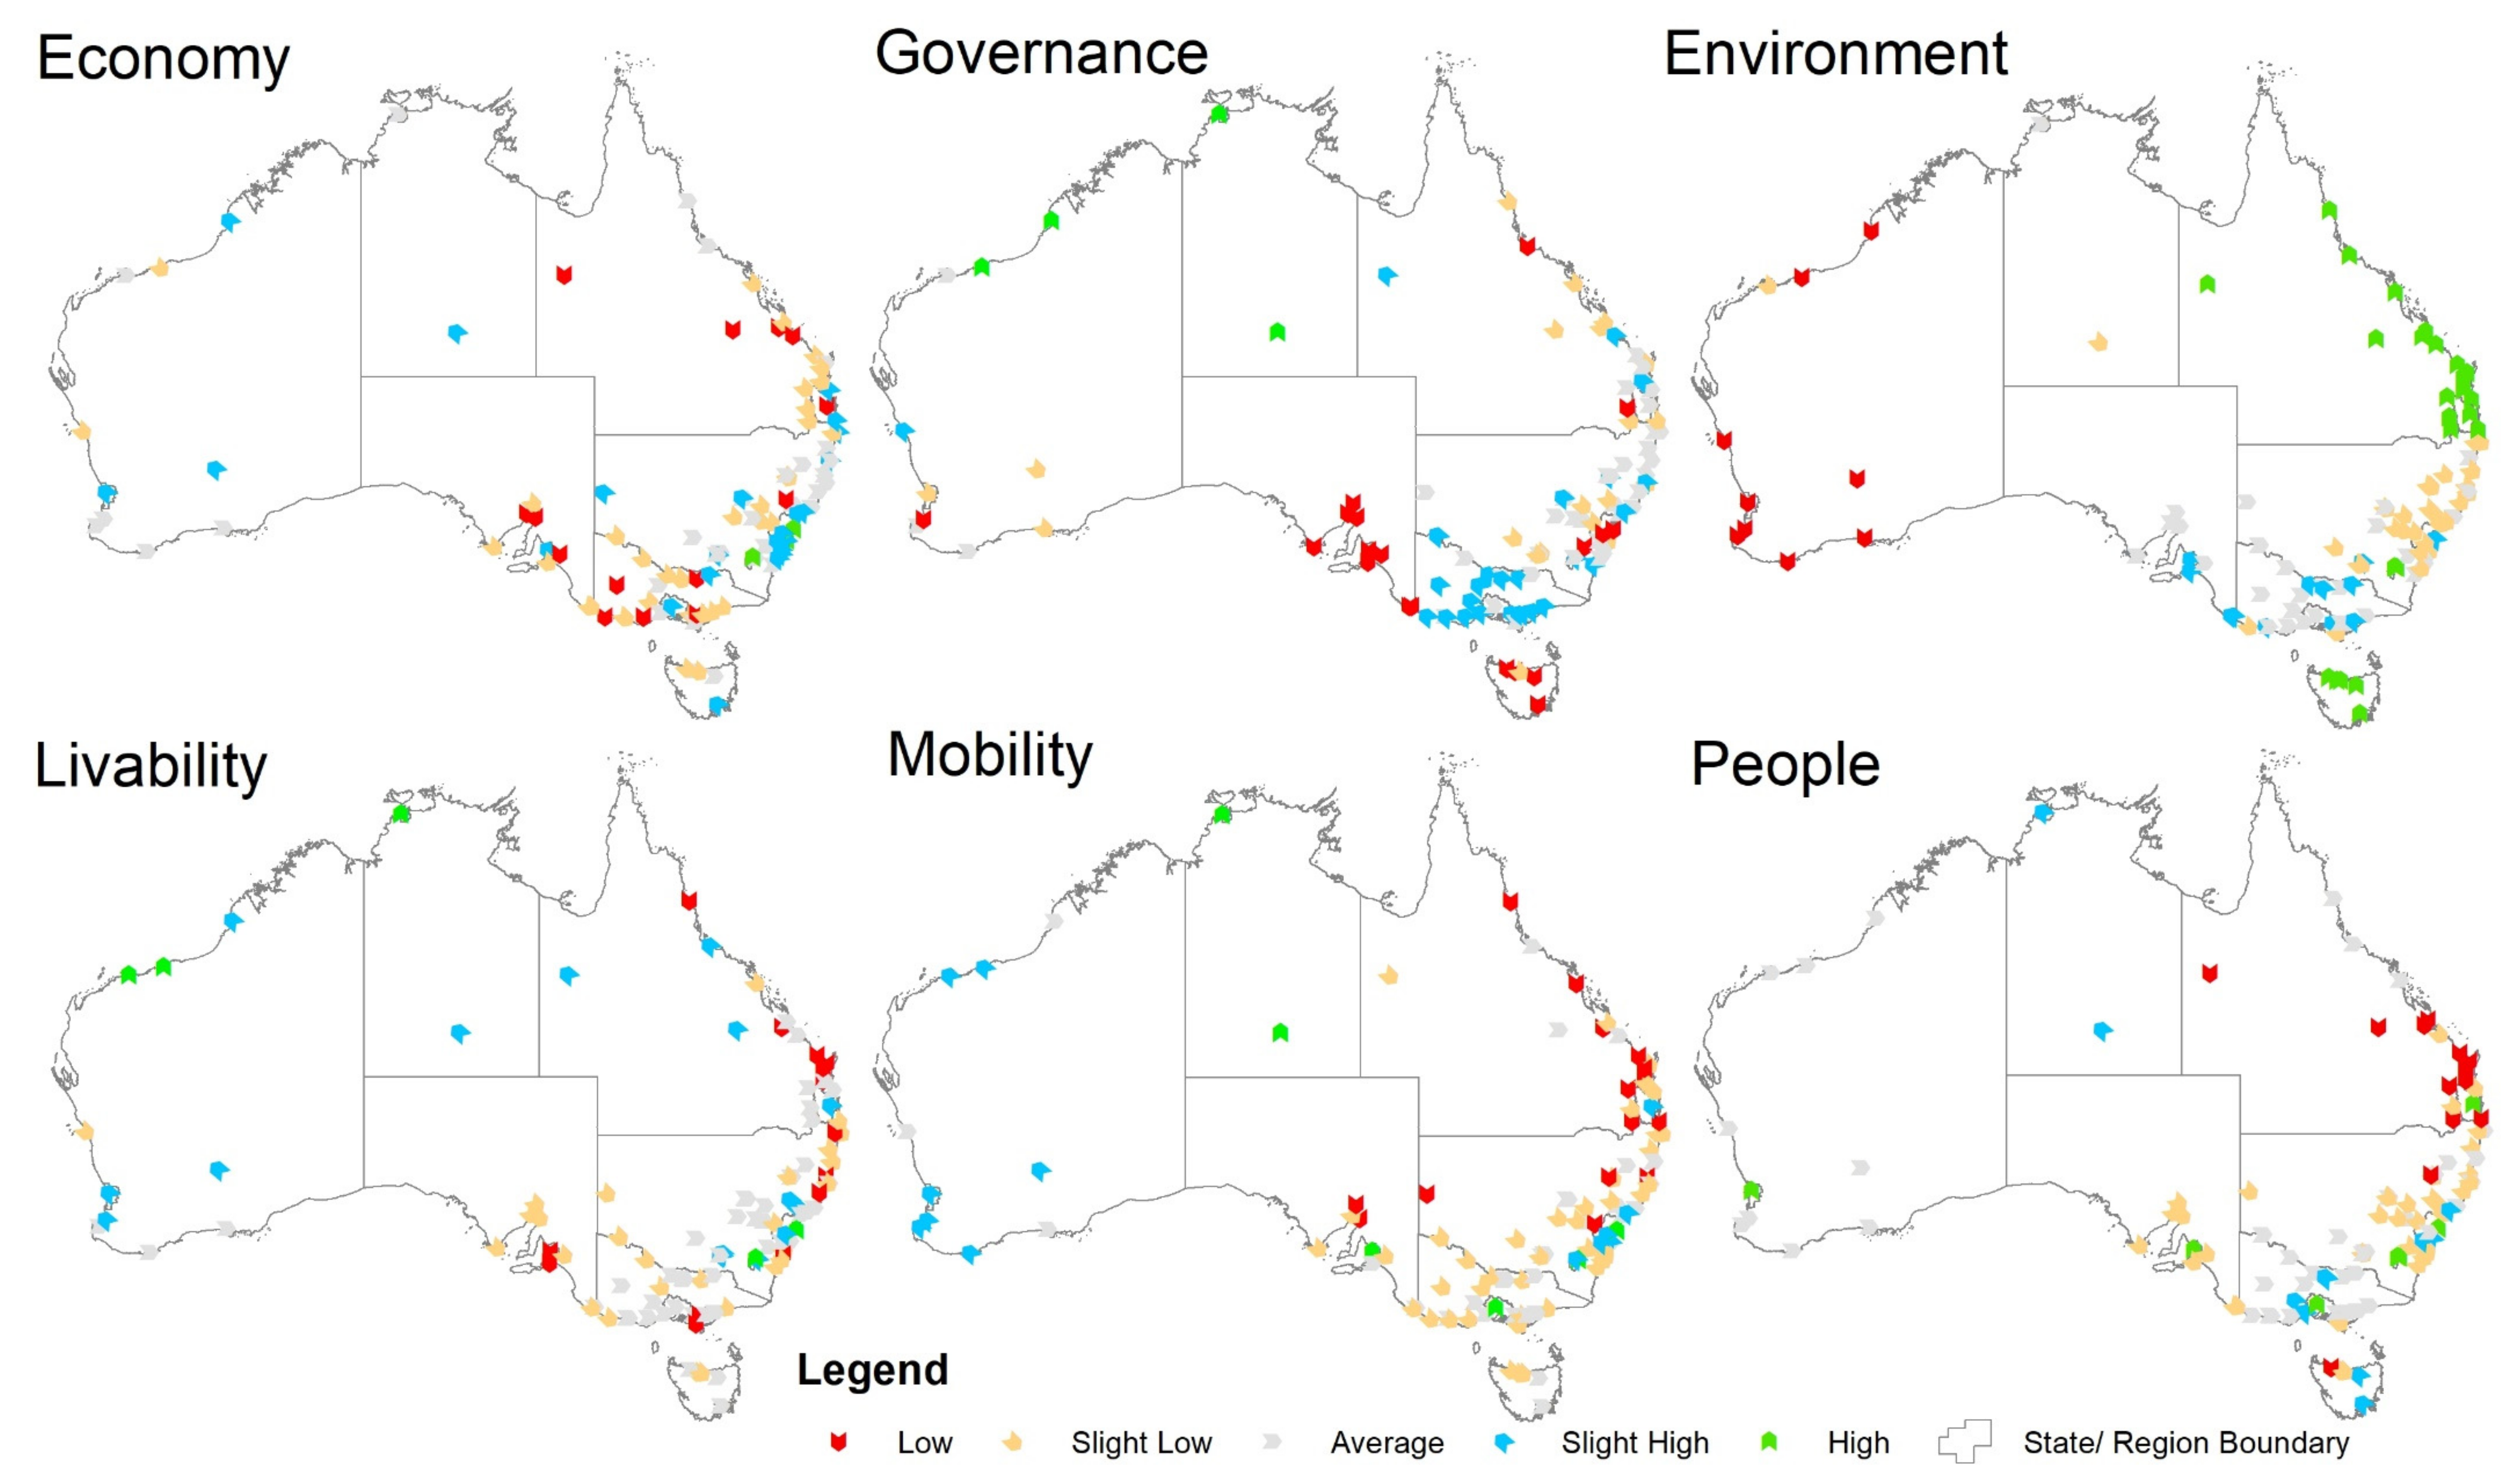
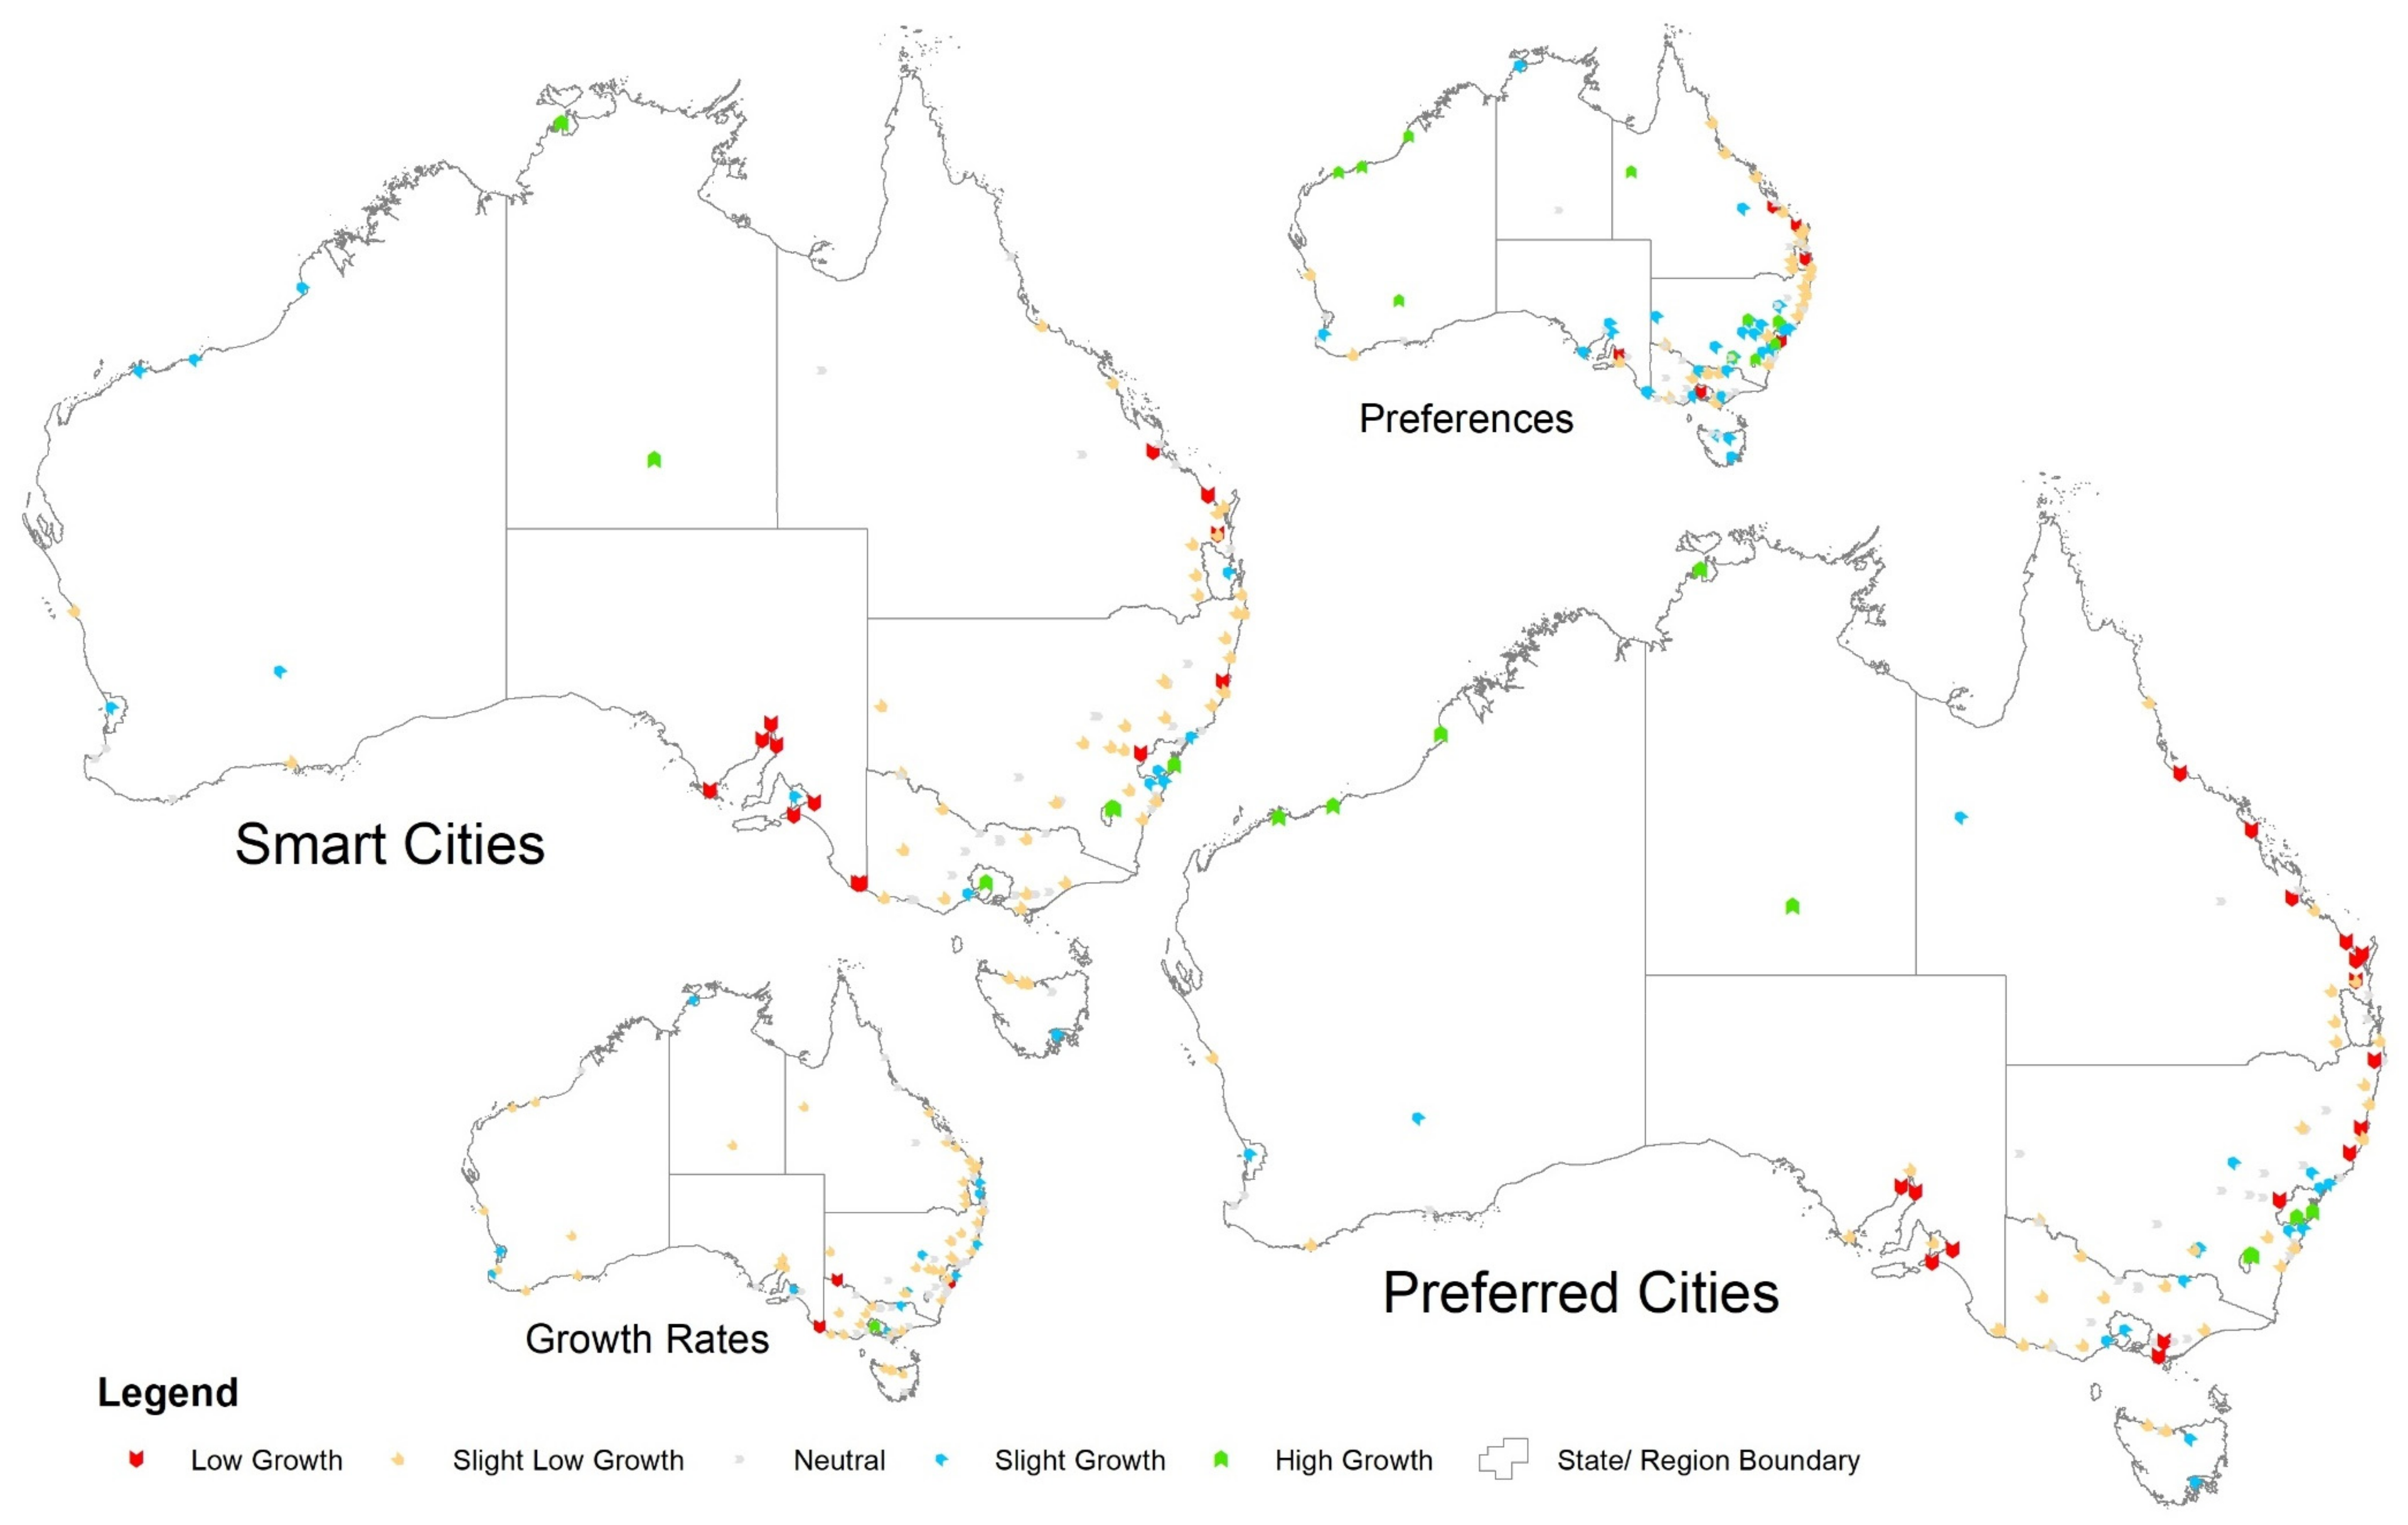
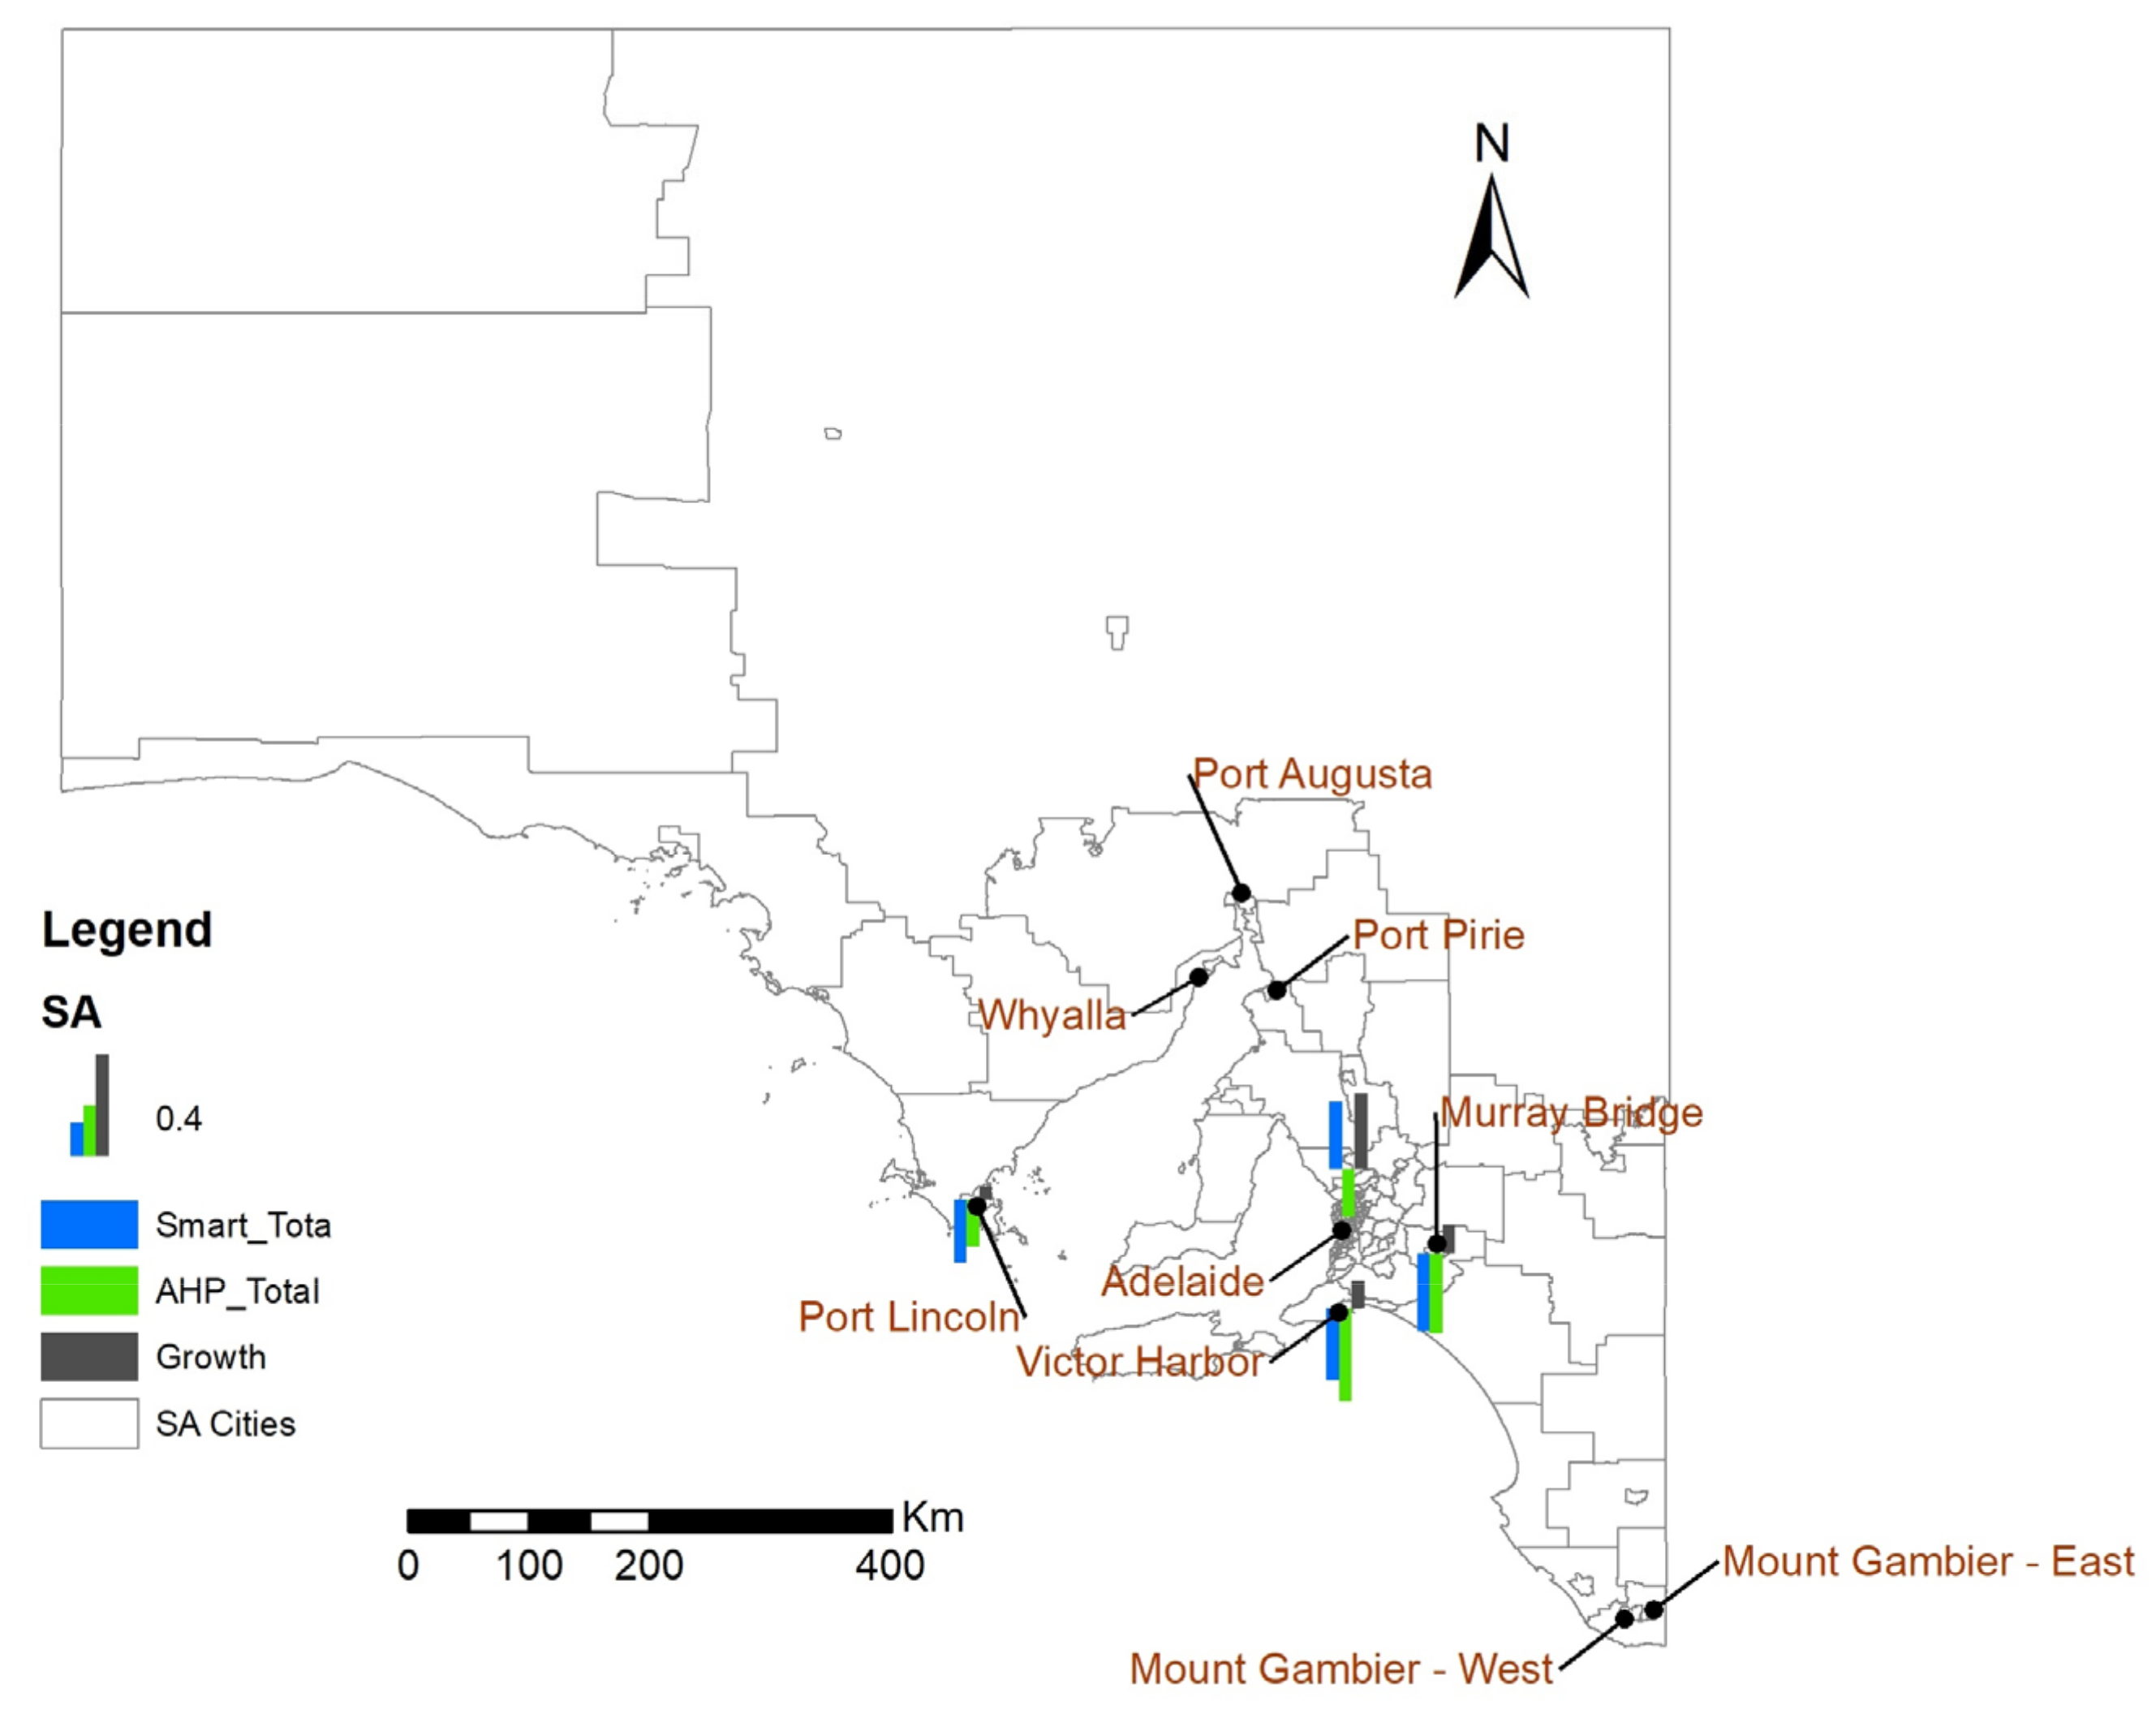
At the component level, some prominent trends are observed within different states. For example, almost all cities performed above the average or below the average in many of the components in different states. Figure 7 provides the performance of selected cities in all components, whereas Figure 8 provides their performance under preferred cities criteria. Figure 9 provides a comparison at the overall level.
Economy is the only component where all greater cities scored high. Majority of cities from NSW and SA performed better in economy component. Except for the greater cities in VIC, QLD, and SA, almost all regional cities underperformed. In preferred cities, SA is the state that performed overall slight poor or average. QLD and VIC also performed below the average for most of the cities in preferred cities.
SA performed exceptionally poor in governance component along with TAS having a similar behavior, whereas VIC and NT performed above average throughout the state. Remaining states expressed a mix behavior in different cities. All cities of TAS and SA performed average or below average in preferred city ranking.
All cities of Tasmania and QLD performed well above the average in environment component. All cities from WA performed among the worst followed by the poor performing cities in NSW and NT. A clear grouping of QLD, TAS, and NT for better performance and NSW, WA, VIC, and SA poor performing states clearly under preferred city ranking.
Livability is the component that expressed the highest correlations with the population growth and had the highest weightage in calculating the preferred cities ranking. SA and NT cities performed well for livability component. VIC is the worst performing state followed by TAS and QLD. WA and NT performed well, and SA performed poor under preferred city ranking.
NT and SA cities expressed satisfactory performance along with the greater cities (except Hobart) for mobility component. Excluding greater cities, QLD and SA cities performed poor or slight poor for mobility whereas all cities of TAS and VIC performed average or slight lower. QLD being the worst for all cities under preferred city ranking. VIC and WA also performed slight poor for all cities except Melbourne. All cities of TAS and SA performed well for mobility under preferred city ranking.
People component had outstanding score for greater cities of Sydney, Melbourne, Canberra, Brisbane, Perth, and Adelaide. VIC has a few cities with slight good and average score. WA has all cities with average score. QLD has average, slight low, and low scoring cities. NSW and TAS expressed a full range of behavior for their cities. People component had worst performance for all non-greater cities of QLD, WA, and SA under preferred city ranking.
Economy and environment almost behaved inverse to each other. Queensland, Victoria, and Tasmania performed better in Environment and were low performing in for economy, whereas the behavior of West Australia, NSW, and Northern Territory, was totally opposite by performing better in economy and poor in environment.

4.3. Detailed Analysis of States

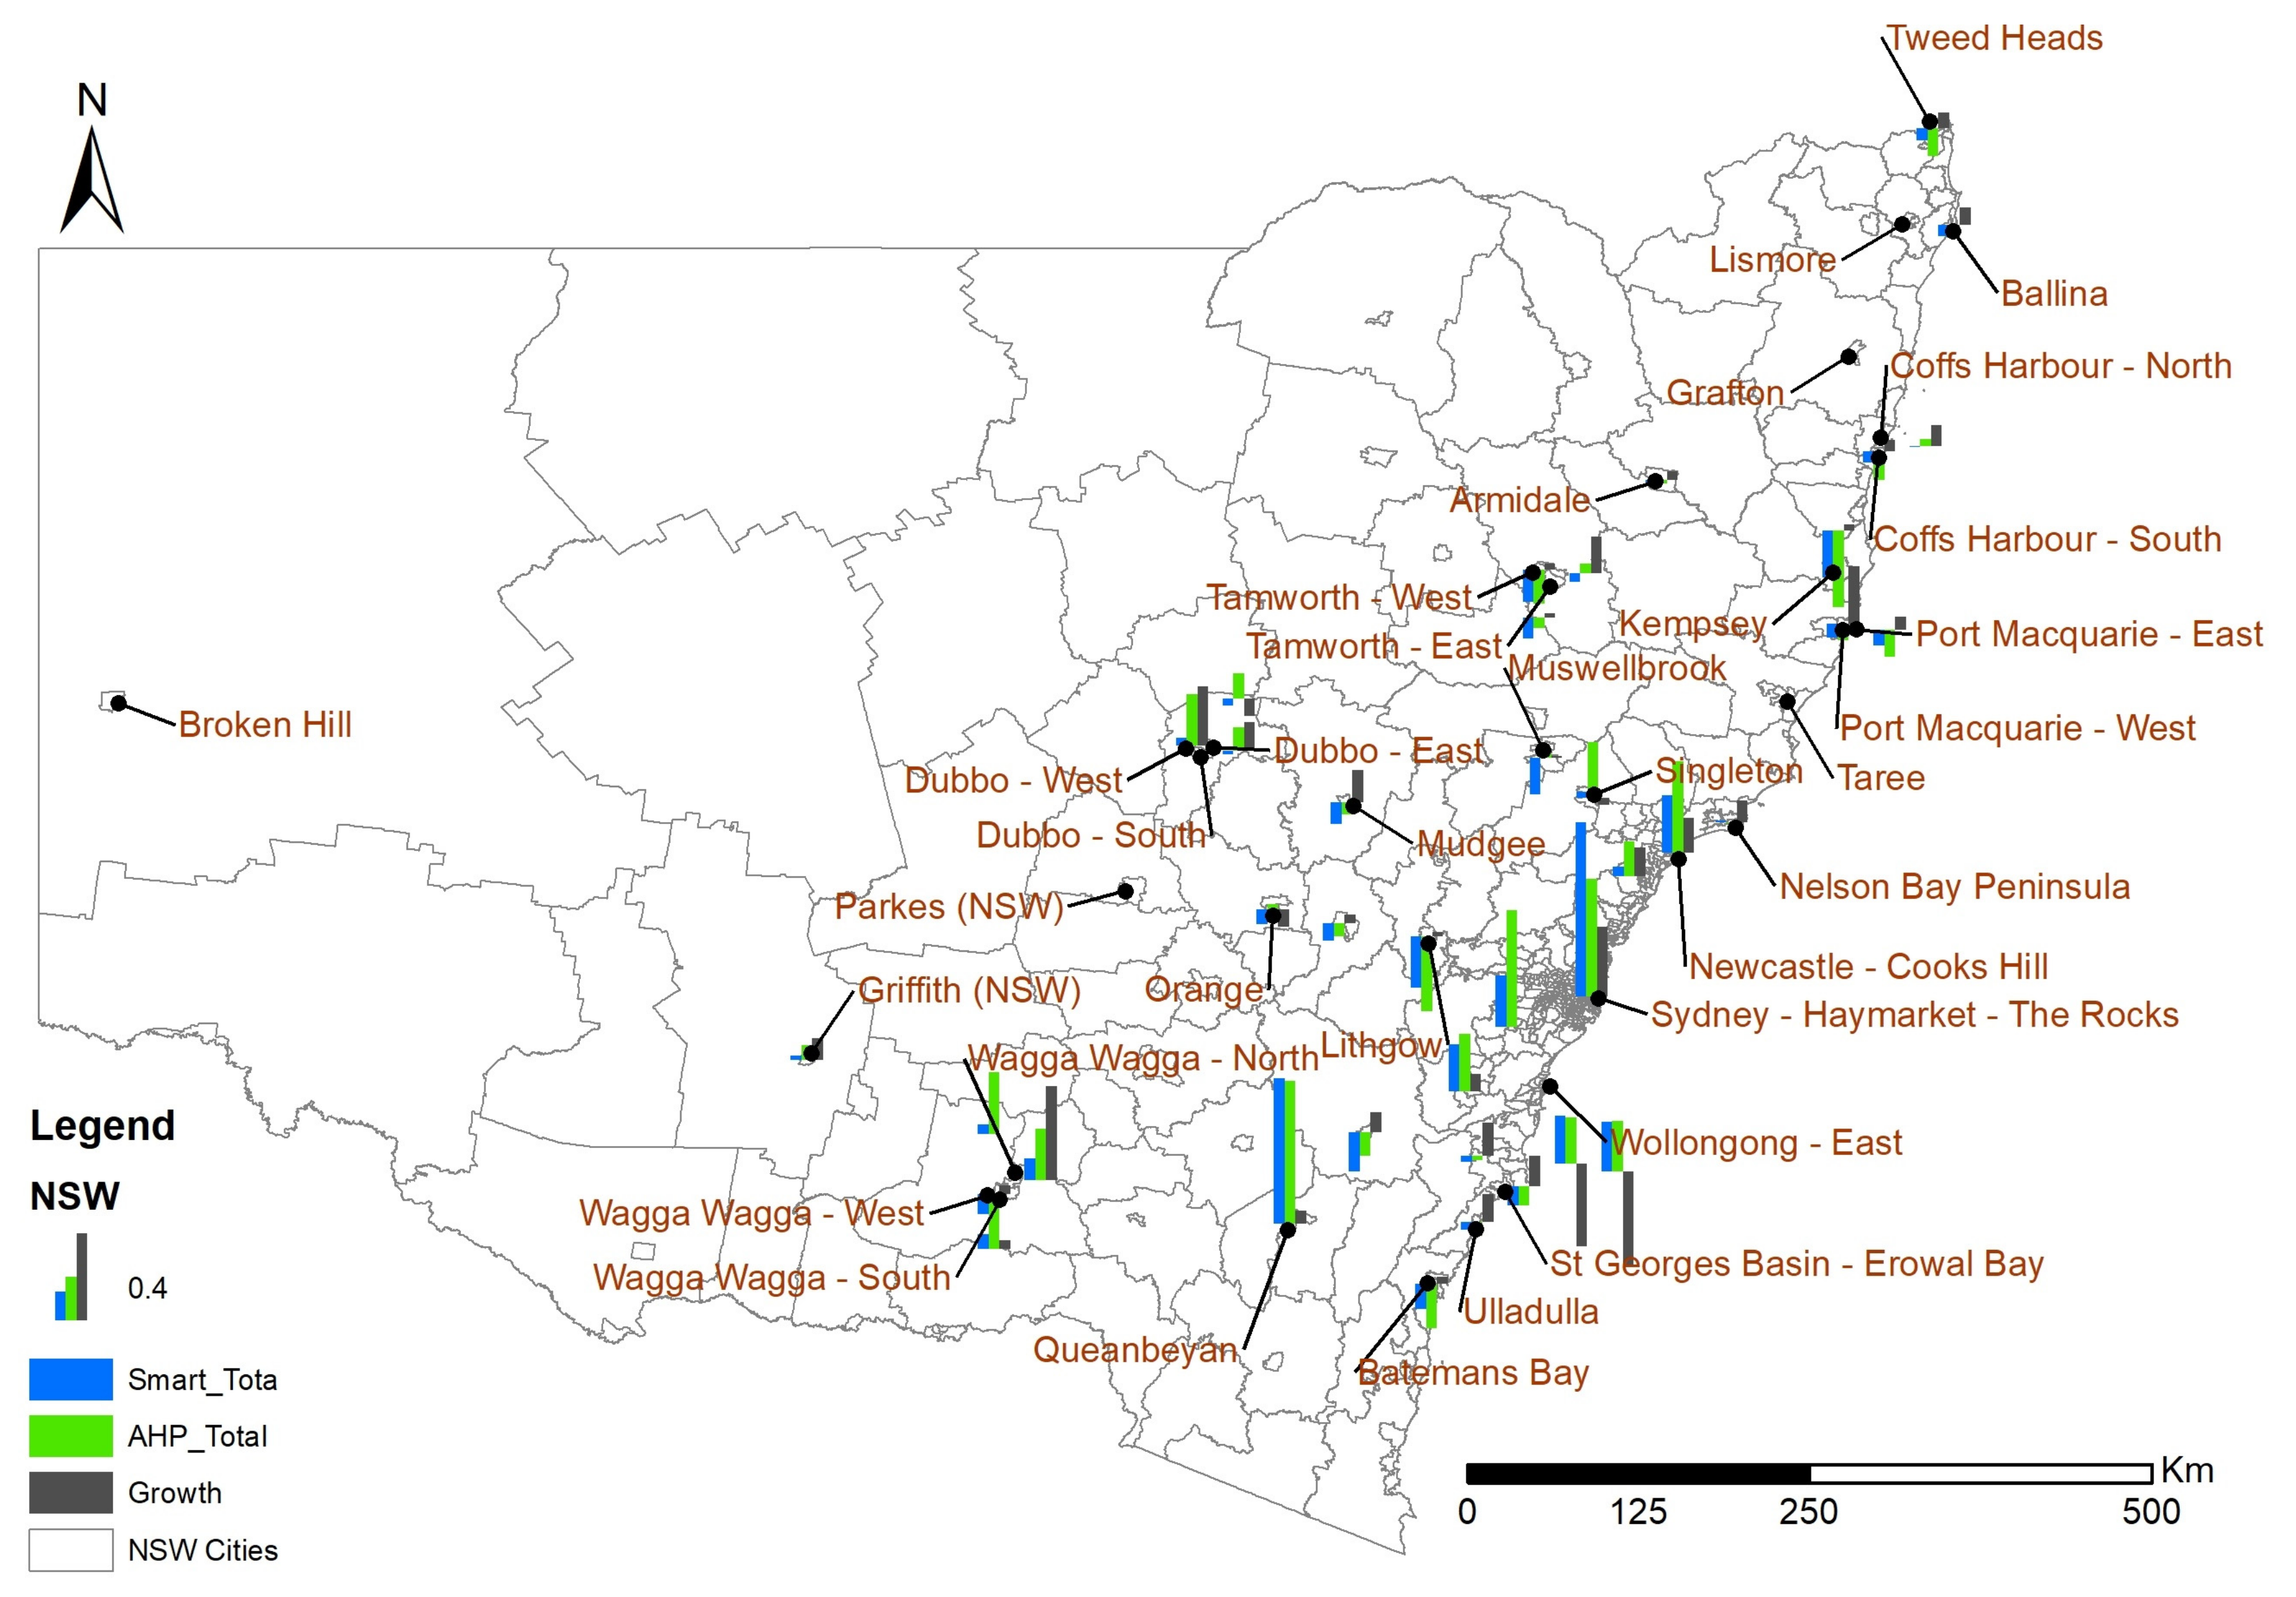
Following the city selection criteria, 44 cities were analyzed from New South Wales. Haymarket, from the Greater Sydney and Queanbeyan (adjacent to Canberra) remained outstanding for smart ranking scores. Other than the Wollongong (East and West), which might have migration towards Sydney, all cities in the NSW have observed an increase in population over the last decade. Figure 10 demonstrate the behavior of NSW’s cities.
In Victoria, the highest growth rate is observed in Melbourne that got the highest smart score (refer Figure 11). The performance of Melbourne is outlier Except for the Mildura, a border city with significant reduction in population, no city observed any significant growth or reduction in population. Newborough is the least smart and least preferred city in Victoria.
18 cities from the Queensland were evaluated. Except the Greater Brisbane and Maroochydore–Kuluin (part of Sunshine Coast), all 16 remaining cities performed below the average cities’ performance. The similar or even worse performance is observed for the population growth. The results are shown in Figure 12. Rockhampton city is not only the lowest smart scorer but lowest preferred city in Queensland but the lowest overall in Australia among the cities ranked in our study. This is the city that shows 16% reduction is population over the past decade.
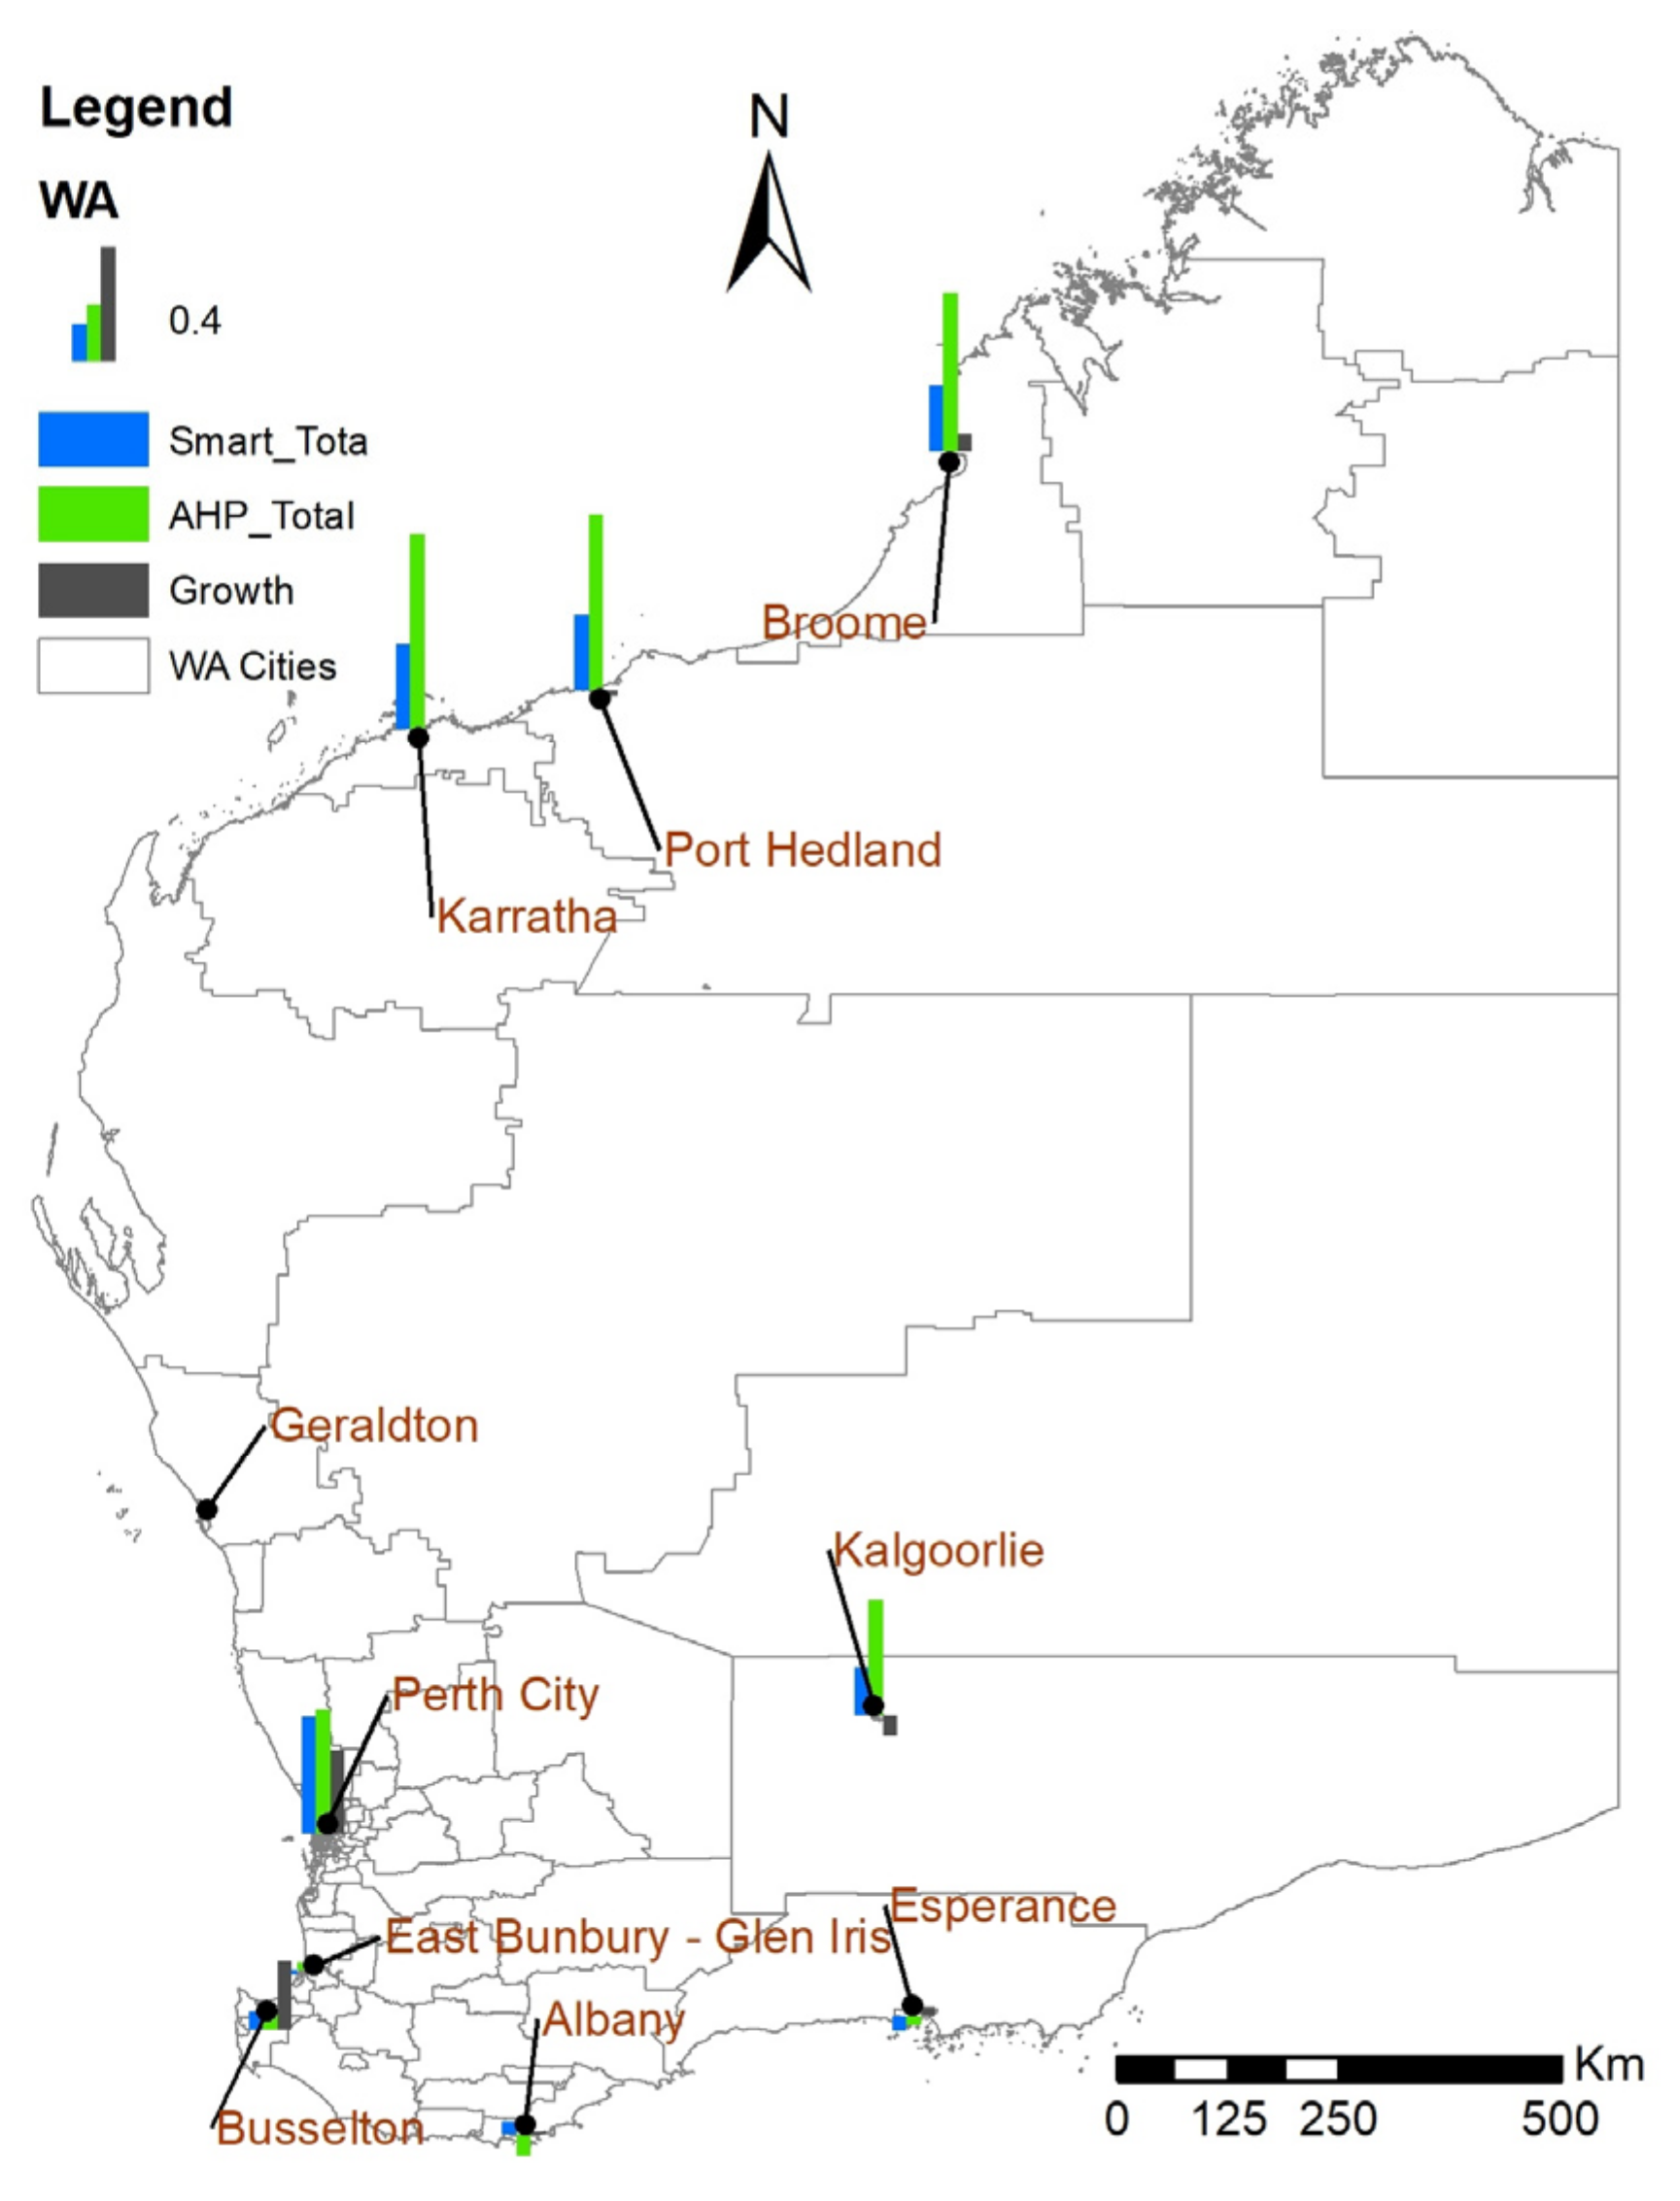
10 cities of Western Australia qualified the city selection criteria. As in all states, the greater city (Perth) performed as the smartest city and observed the highest growth rate in last decade. Other than Perth and Busselton, all other cities experienced around the average population growth. Figure 13 shows the performance of Western Australian cities.
South Australia had nine cities selected for ranking. Greater Adelaide remained the smartest city. All other cities performed below the average score. Figure 14 shows that growth rate of all cities in this state fluctuate around the average.
5 cities of Tasmania are analyzed. Hobart emerged as the smartest city followed by Launceston. Except Hobart, all other cities experienced below average growth rate. Figure 15 depicts the smart score, preferences, and growth rates of Tasmanian cities.

5. Conclusions and Recommendations

The comparison of smart score and preference score shows that the difference of development and facilities between the metropolitan cities and regional cities is huge. Government’s regional areas incentives are not affective and have not been producing positive results. The government must prioritize the development of regional cities to ensure an even development over the country and avoid concentration of human capitals in greater cities.
Performance analysis of different components reveals that in many cases, majority of the cities secure similar scores within a state. These similar trends within same state maybe because of the indicator data that are collected at SA−3, SA−4, or at the state level or these trends may reflect the policies and strategies of the state governments.
Smart city ranking and Preferred city ranking, both appeared to be effective in terms of evaluating the performance of a city. A Preferred city ranking appears more meaningful and effective. However, a more comprehensive and detailed Preferred city ranking is recommended to obtain more in-depth understanding of Preferred cities.
It was observed that the cities which secured better in environment, were not able to secure high smart scores. These cities do not perform considerably in economy as well. This trend advocates an emphasis on the sustainable development to avoid overstressing of a component over the other.
Smart scoring can be considered as a guideline for the development of a city and a region as well. As the smart city ranking considers almost all components of an area’s development. Another positive aspect of smart city ranking is that the ranking process is comparative, and the human capitals migrates based on comparative opportunities and facilities.
Developing a connection between the smartness of a city and its ability to attract human capital is relatively a new idea. The research has made an initial attempt and the hypothesis needs a long way to establish further strong correlations. A statistical approach was used in this research. Whereas physical-based modeling can be used to validate the results in the future. In addition to the smartness of a city, there are multiple other factors (e.g., climate, location, and geopolitical factors) and incentives that attract human capital. Therefore, these initial results of this research can be considered provisional owing to inherent uncertainties. It is recommended to include more factors under different scientific evaluation methods for more cities to develop more strong correlations in future studies.

Author Contributions

Conceptualization, M.A.U.R.T., M.H. and N.M.; Data curation, M.H.; Formal analysis, M.A.U.R.T. and M.H.; Investigation, M.A.U.R.T.; Methodology, M.A.U.R.T.; Project administration, M.A.U.R.T.; Resources, M.A.U.R.T.; Software, M.A.U.R.T. and M.H.; Supervision, M.A.U.R.T.; Validation, M.A.U.R.T.; Visualization, M.A.U.R.T.; Writing—original draft, M.A.U.R.T., M.H. and N.M.; Writing—review & editing, M.A.U.R.T. All authors have read and agreed to the published version of the manuscript.

Funding

This research received no external funding.

Conflicts of Interest

The authors declare no conflict of interest.

Appendix A

Table A1. Describing the data sources used in the research.
IndicatorsData Source
New Businesses/TotalGCCSAEconomy and Industry
Large Businesses/TotalGCCSAEconomy and Industry
Self Employed TrendGCCSAEconomy and Industry
Total Businesses TrendGCCSAEconomy and Industry
Patent & Trademark Apps Trend portal.aurin.org.auPatent applicants & Trademark applicants
Business Entry Rate TrendGCCSAEconomy and Industry
Building Approvals TrendGCCSAEconomy and Industry
Dwelling WorthGCCSAEconomy and Industry
PSHouse Worth/Dwelling GCCSAEconomy and Industry
Gross Product/Cap 41,020 Eco.IndicatorsTable 2
Wage Price Index WPI 41,021 Eco.IndicatorsTable 3
Unemployment Rate TrendInversedGCCSAEducation and Employment
Gross Capital Gains mil Trend portal.aurin.org.augcg reportd by taxpayers
Pensions/Allowances Trend GCCSAIncome
Sports&Rec mil 4147 Gov FundingPage 10
Total Assistance Trend GCCSAIncome
Enrolled Votersaec.gov.auActual enrollement
Votes HOReps 13,700 TrustTable 2
Votes Senate 13,700 TrustTable 2
Community Incentive Social SurveyTable 3.3 (A81)
Community Programs Social SurveyTable 3.3 (A112)
Renewable Energy byRenewable Energy By StatePage 6
Net Zero emissions byRenewable Energy By StatePage 6
Air Quality week averagebreezometer.combreezo meter
C Equivalent TrendInversed Australia ProgressTable 11
GreenHouse Gas Emi Trend Inversed 13,700 Sustain EnviroTable 1.2
Aquatic Biota Index Inversed 4614 Aus Enviro IssuePage 6
River Enviro Index 4614 Aus Enviro IssuePage 7
Water Development Australia ProgressTable 9
Expenditure Per Capita 46,110 Enviro ProtectionPage 11
Expenditure Per Capita 46,110 Enviro MgmtPage 18
Solar Installations Trend GCCSALand and Environment
Solar Hot Water Trend GCCSALand and Environment
Suburbs w/> 50% solar Installs Renewable Energy By StatePage 4
Solar Households pv-map.apvi.org.auMapping Australian Photovoltaic installations
Capacity/Capita No hydro kW/Cap Renewable Energy By StatePage 4
Renewable ElectricityRenewable Energy By StatePage 4
Median Sale Price Trend Inversed GCCSAEconomy and Industry
Rent InversedGCCSAFamily and Community
Mortgage InversedGCCSAFamily and Community
Mortgage <30% Income GCCSAFamily and Community
Rent < 30% Income GCCSAFamily and Community
Person/Household GCCSAFamily and Community
+ Beds needed GCCSAFamily and Community
Employed Percentage GCCSAEducation and Employment
Participation Rate GCCSAEducation and Employment
Unemployment Rate GCCSAEducation and Employment
Assault 41,020 OtherTable 2
Break-ins 41,020 OtherTable 2
Safe Travel HomeSocial SurveyA174
+ Crimes/yrSocial SurveyA187
Private Health TrendGCCSAHealth And Disbaility
Male Life Expectancy3302055001DO002_2017-2019 Life tablesTable 2.1
Female Life Expectancy 3302055001DO002_2017-2019 Life tablesTable 2.1
Excellent Self Health Social SurveyA133
Median Income GCCSAIncome
Mean Income GCCSAIncome
Disposable Income weekly mid portal.aurin.org.aumedian disposable household income synthetic estimates
1000–2000%GCCSAIncome
Train Network Each States Satisfaction In.Satisfaction Index
Bus Network Each States Satisfaction In.Satisfaction Index
Taxi Each States Satisfaction In.Satisfaction Index
Utilization to work/study ATTA—Transport by StateTable 2.2
Utilization outside of work/study ATTA—Transport by StateTable 2.7
Train-Tram to WorkGCCSAFamily and Community
Bus to WorkGCCSAFamily and Community
Roads 13,700 Built EnvironmentTable 1
Car Acc/, ppl Inverse 41,020 Health IndicatorTable 2
Car to WorkGCCSAFamily and Community
Population Density/kmGCCSAPopulation and People
Cars/pplGCCSAEconomy and Industry
Av Distance to Work/StudyGCCSAFamily and Community
Multiple to WorkGCCSAFamily and Community
Computer/Household 41020 OtherTable 2
Internet Connectivity GCCSAFamily and Community
Science/Technical Services GCCSAEconomy and Industry
Post School Qualified GCCSAEducation and Employment
BA DegreeGCCSAEducation and Employment
Above BA Degree Social SurveyA253
Managers GCCSAEducation and Employment
Professionals GCCSAEducation and Employment
Technicians GCCSAEducation and Employment
Languages Spoken GCCSAPopulation and People
Library Visits Social SurveyA122
Art and Museum Visits Social SurveyA122
Cultural Tolerance Social SurveyA154
Bike to work GCCSAFamily and Community
Walk to work GCCSAFamily and Community
Enrolled Voters 13,700 ParticipationTable 1
Organized Sport 41,020 Other Table 2

References

  1. Sun, H.S.Y.; Jara, A.J.; Bie, R. Internet of Things and Big Data Analytics for Smart and Connected Communities. IEEE Access 2016, 4, 766–773. [Google Scholar] [CrossRef]
  2. Prakash, A. Smart Cities Mission in India: Some definitions and considerations. Smart Sustain. Built Environ. 2019, 8, 322–337. [Google Scholar] [CrossRef]
  3. de Jong, S.J.M.; Schraven, D.; Zhan, C.; Weijnen, M. Sustainable-smart-resilient-low-carbon-eco-knowledge cities; Making sence of a multitude of concepts promoting sustainable urbanization. J. Clean. Prod. 2015, 109, 3–25. [Google Scholar] [CrossRef] [Green Version]
  4. Liotine, M.; Ramaprasad, A.; Syn, T. Managing a Smart City’s resilience to Ebola: An ontological framework. In Proceedings of the 2016 49th Hawaii International Conference on System Sciences (HICSS), Koloa, HI, USA, 5–8 January 2016. [Google Scholar]
  5. Pries-Heje, J.; Cranefield, J. Smart Leadership for Smart Cities: A Leadership Role Framework. Roskilde University 2018. Available online: https://forskning.ruc.dk/en/publications/smart-leadership-for-smart-cities-a-leadership-role-framework (accessed on 12 March 2020).
  6. Batten, J. Sustainable Cities Index 2015. Arcadis 2015. Available online: https://www.arcadis.com/media/E/F/B/%7BEFB74BBB-D788-42EF-A761-4807D69B6F70%7D9185R_Arcadis_whitepaper_2015.pdf (accessed on 12 March 2020).
  7. Wey, W.-M.; Ching, C.-H. The Application of Innovation and Catapult Research Techniques to Future Smart Cities Assessment Framework. In Proceedings of the 2018 International Conference on System Science and Engineering (ICSSE), Tokyo, Japan, 28–29 May 2018. [Google Scholar]
  8. Kuru, K.; Ansell, D. TCitySmartF: A Comprehensive Systematic Framework for Transforming Cities into Smart Cities. IEEE Access 2020. [Google Scholar] [CrossRef]
  9. Angelidou, M. Smart Cities: A Conjuncture of Four Forces; Elsevier Ltd.: Amsterdam, The Netherlands, 2015. [Google Scholar]
  10. Escolar, S.; Villanueva, F.J.; Santofimia, M.J.; Villa, D.; del Toro, X.; López, J.C. A Multiple-Attribute Decision Making-based approach for smart city rankings design. Elsevier 2018, 142, 42–55. [Google Scholar] [CrossRef]
  11. Guerra, M. What exactly is a smart city? Electron. Des. 2017, 19, 20. [Google Scholar]
  12. Pardo, N. Conceptualizing Smart City with Dimension of Technology, People and Institutions. In Proceedings of the 12th Annual International Digital Government Research Conference: Digital Government Innovation in Challenging Times, Atlanta, GA, USA, 12–15 June 2011. [Google Scholar]
  13. Albino, V.; Beradi, U.; Dangelico, R.M.; Berardi, U.; Dangelico, R.M. Smart Cities: Definitions, dimensions, performance, and initiatives. Urban Technol. 2015, 22, 3–21. [Google Scholar] [CrossRef]
  14. Allam, Z.; Newman, P. Redefining the Smart City: Culture, Metabolism and Governance. Smart Cities 2018, 1, 2. [Google Scholar] [CrossRef] [Green Version]
  15. Capeluto, I.G.; Ben-Avraham, O.; Isaac, O.B.-A.; Capeluto, G. Assessing the green potetial of existing buildings towards smart cities and districts. Indoor Built Environ. 2015, 25, 1124–1135. [Google Scholar] [CrossRef]
  16. Poole, S. The Guardian. 2014. Available online: https://www.theguardian.com/cities/2014/dec/17/truth-smart-city-destroy-democracy-urban-thinkers-buzzphrase (accessed on 12 March 2020).
  17. Yigitcanlar, T.; Kankanamge, N.; Vella, K. How Are Smart City Concepts and Technologies Perceived and Utilized? A Systematic Geo-Twitter Analysis of Smart Cities in Australia. J. Urban Technol. 2020, 1–20. [Google Scholar] [CrossRef]
  18. Damion, K.V.; Bunders, J. Problematizing data-driven urban practices: Insights from five Dutch ‘smart cities. Cities 2019, 93, 145–152. [Google Scholar]
  19. General Electronics; Smart City. 2015. Available online: http://www.gegridsolutions.com/alstomenergy/grid/microsites/grid/products-andservices/ (accessed on 12 March 2020).
  20. Yigitcanlar, T.; Kamruzzaman, M.; Buys, L.; Ioppolo, G.; Sabatini-Marques, J.; da Costa, E.M.; Yun, J.J. Understanding ‘smart cities’: Intertwining development drivers with desired outcomes in a multidimensional framework. Cities 2018, 145, 160. [Google Scholar]
  21. The Economist. Hotspot 2025, Benchmarking of the Future Competiveness of Cities; The Economist Intelligence Unit Limited: London, UK, 2013. [Google Scholar]
  22. Department of Economic and Social Affairs, Population Division. World Urbanization; Department of Economic and Social Affairs, Population Division: New York, NY, USA, 2019. [Google Scholar]
  23. Lopes, I.M.; Oliveira, P. Can a small city be considered a smart city? In Procedia Computer Science; Elsevier B.V.: Amsterdam, The Netherlands, 2017; Volume 121. [Google Scholar] [CrossRef]
  24. Herrschel, T. Competitiveness AND Sustainability: Can ‘Smart City Regionalism’ Square the Circle? Urban Stud. 2013, 50, 2332–2348. [Google Scholar] [CrossRef]
  25. Yigitcanlar, T.; Kamruzzaman, M. Smart Cities and Mobility: Does the Smartness of Australian Cities Lead to Sustainable Commuting Patterns? J. Urban Technol. 2019, 26. [Google Scholar] [CrossRef]
  26. Macke, J.; Casagrande, R.M.; Sarate, J.A.R.; Silva, K.A. Smart city and quality of life: Citizens’ perception in a Brazilian case study. J. Clean. Prod. 2018, 182, 717–726. [Google Scholar] [CrossRef]
  27. Palmisano, S.J. A Smarter Planet: The Next Leadership Agenda. IBM 2008, 6, 1–8. [Google Scholar]
  28. Graham, B.; Tennant, M.; Shiikha, Y.; Kruger, E. Distribution of Australian private dental practices: Contributing underlining sociodemographics in the maldistribution of the dental workforce. Aust. J. Prim. Health 2019, 25. [Google Scholar] [CrossRef]
  29. Daley, J.; Wood, D.; Chivers, C. Regional Patterns of Australia’s Economy and Population; Grattan Institute: Melbourne, Australian, 2017. [Google Scholar]
  30. Connell, J. Rural Change in Australia: Population, Economy, Environment; Routledge: Boca Raton, FL, USA, 2016. [Google Scholar]
  31. Hugo, G. Immigrant settlement outside of Australia’s capital cities. Popul. Space Place 2008, 14. [Google Scholar] [CrossRef]
  32. Hugo, G. Changing Patterns of Population Distribution in Australia. J. Popul. Res. 2002, 2001, 1–21. [Google Scholar]
  33. 3218.0—Regional Population Growth, Australia, 2016–2017. Available online: https://www.abs.gov.au/ausstats/[email protected]/Lookup/3218.0main+features952016-17 (accessed on 12 March 2020).
  34. C. Statistics, o=Commonwealth of Australia, and ou=Australian B. Of 2071.0-Census of Population and Housing: Reflecting Australia-Stories from the Census. ABS 2016. Available online: https://www.abs.gov.au/ausstats/[email protected]/Lookup/by%20Subject/2071.0~2016~Main%20Features~Aboriginal%20and%20Torres%20Strait%20islander%20Population%20Article~12 (accessed on 12 March 2020).
  35. Australian Demographic Statistics, June 2016. 2017. Available online: http://www.abs.gov.au/AUSSTATS/[email protected]/Lookup/3101.0Main+Features1Jun2016?OpenDocument (accessed on 12 March 2020).
  36. Parr, A. Understanding the motivations for return migration in Australia. Aust. Popul. Stud. 2019, 3. [Google Scholar] [CrossRef]
  37. Giles, L.C.; Halbert, J.A.; Gray, L.C.; Cameron, I.D.; Crotty, M. The distribution of health services for older people in Australia: Where does transition care fit? Aust. Health Rev. 2009, 33, 572–582. [Google Scholar] [CrossRef] [Green Version]
  38. Alam, K. Determinants of access to eHealth services in regional Australia. Int. J. Med. Inform. 2019, 131, 103960. [Google Scholar] [CrossRef]
  39. Borsellino, R. The changing migration patterns of the 65+ population in Australia, 1976–2016. Aust. Popul. Stud. 2020, 4. [Google Scholar] [CrossRef]
  40. Freeman, J.; Hancock, L. Energy and communication infrastructure for disaster resilience in rural and regional Australia. Reg. Stud. 2017, 51, 933–944. [Google Scholar] [CrossRef]
  41. wa Mungai, N.; Priestly, J.; Pawar, M. Food Insecurity in Regional Rural Australia. Aust. Soc. Work 2020, 73, 149–161. [Google Scholar] [CrossRef]
  42. Argent, N.; Tonts, M.; Jones, R.; Holmes, J. The Amenity Principle, Internal Migration, and Rural Development in Australia. Ann. Assoc. Am. Geogr. 2014, 104. [Google Scholar] [CrossRef]
  43. Argent, N.; Tonts, M.; Jones, R.; Holmes, J. A creativity-led rural renaissance? Amenity-led migration, the creative turn and the uneven development of rural Australia. Appl. Geogr. 2013, 44, 88–98. [Google Scholar] [CrossRef]
  44. Rolfe, J.; Kinnear, S.; Borg, D. Factors affecting population and workforce mobility in Australia: A future of declining regional affinity? Rural Soc. 2020, 29, 1–15. [Google Scholar] [CrossRef]
  45. Argent, N.; Walmsley, J. Rural youth migration trends in Australia: An overview of recent trends and two inland case studies. Geogr. Res. 2008, 46. [Google Scholar] [CrossRef]
  46. Hon, T.; Tudge, A.; The Department of Infrastructure, Transport, Regional Development and Communications. Smart Cities and Suburbs Program. Available online: https://www.infrastructure.gov.au/cities/smart-cities/ (accessed on 12 March 2020).
  47. McManus, P.; Connell, J. Putting places on the map? Marketing rural and regional Australia. J. Destin. Mark. Manag. 2014, 3, 105–113. [Google Scholar] [CrossRef]
  48. Anholt, S. Place branding: Is it marketing, or isn’t it? Place Brand. Public Dipl. 2008, 4, 1–6. [Google Scholar] [CrossRef]
  49. Anholt, S. Editorial: Should place brands be simple. Place Brand. Public Dipl. 2009, 5, 91–96. [Google Scholar] [CrossRef]
  50. Lenihan, H.; McGuirk, H.; Murphy, K.R. Driving innovation: Public policy and human capital. Res. Policy 2019, 48, 103791. [Google Scholar] [CrossRef]
  51. Wang, L.; Guo, B.; Yang, Q. Smart City Development with Urban Transfer Learning. IEEE 2018, 51, 32–41. [Google Scholar] [CrossRef]
  52. Garcia-Font, V.; Garrigues, C.; Rifa-Pous, H. Difficulties and challenges of Anomaly Detection in Smart Cities: A Labortory Analysis. Sensors 2018, 18, 3198. [Google Scholar] [CrossRef] [Green Version]
  53. O’Brien, J. 5 Australian Cities Battle for ‘Smart City’ Glory. CIO 2018. Available online: https://www.cio.com.au/article/646152/5-australian-cities-battle-smart-city-glory/ (accessed on 30 October 2018).
  54. Anthopoulos, L.G.; Fitsilis, P. Smart cities and their roles in city competition: A classification. Int. J. Electron. Gov. Res. 2014, 10. [Google Scholar] [CrossRef] [Green Version]
  55. Onnom, W.; Tripathi, N.; Nitivattanonon, V.; Ninsawat, S. Development of a Liveable City Index (LCI) Using Multi Criteria Geospatial Modelling for Medium Class Cities in Developing Countries. Sustainability 2018, 10, 520. [Google Scholar] [CrossRef] [Green Version]
  56. MORI Memorial Foundation. Global Power City IndeX. 2019. Available online: http://mori-m-foundation.or.jp/english/ius2/gpci2/index.shtml (accessed on 13 November 2020).
  57. Wu, Z. Intelligent City Evaluation System; Springer: Singapore, 2018. [Google Scholar]
  58. Tariq, M.A.U.R.; Faumatu, A.; Hussein, M.; Shahid, M.L.U.R.; Muttil, N. Smart City-Ranking of Major Australian Cities to Achieve a Smarter Future. Sustainability 2020, 12, 2797. [Google Scholar] [CrossRef] [Green Version]
  59. Giffinger, R.; Gudrun, H. Smart cities ranking: An effective instrument for the positioning of cities? ACE Archit. City Environ. 2010, 4, 7–25. [Google Scholar]
  60. Lee, J.H.; Phaal, R.; Lee, S.-H. An integrated service-device-technology roadmap for smart city development. Technol. Forecast. Soc. Chang. 2013, 80, 286–306. [Google Scholar] [CrossRef]
  61. Mohanty, S.; Choppali, U.; Kougianos, E. Everything you wanted to know about smart cities. IEEE 2016, 5, 60–70. [Google Scholar]
  62. Liu, F.; Shi, Y.; Chen, Z. Smart City Ranking Reliability Analysis. In Proceedings of the 2018 International Conference on Computational Science and Computational Intelligence (CSCI), Las Vegas, NV, USA, 13–15 December 2018. [Google Scholar]
  63. Benamrou, B.; Mohamed, B.; Bernoussi, A.-S.; Mustapha, O. Ranking models of smart cities. IEEE 2016, 51, 72–79. [Google Scholar]
  64. Munier, N. Methodology to select a set of urban sustainability indicators to measure the state of the city, and performance assessment. Ecol. Indic. 2011, 11, 1021–1026. [Google Scholar] [CrossRef]
  65. Klopp, J.M.; Petretta, D.L. The urban sustainable development goal: Indicators, complexity and the politics of measuring cities. Cities 2017, 63, 92–97. [Google Scholar] [CrossRef]
  66. Dias, D.; Amorim, J.H.; Sá, E.; Borrego, C.; Fontes, T.; Fernandes, P.; Pereira, S.R.; Bandeira, J.; Coelho, M.C.; Tchepel, O. Assessing the importance of transportation activity data for urban emission inventories. Transp. Res. Part D Transp. Environ. 2018, 62, 27–35. [Google Scholar] [CrossRef]
  67. Dizdaroglu, D. Developing micro-level urban ecosystem indicators for sustainability assessment. Environ. Impact Assess. Rev. 2015, 54, 119–124. [Google Scholar] [CrossRef]
  68. Sassen, S. The Global City: New York, London, Tokyo; Princeton, N.J., Ed.; Princeton University Press: Oxford, UK, 2001. [Google Scholar]
  69. Khan, N.U.; Wan, W.; Yu, S. Spatiotemporal Analysis of Tourists and Residents in Shanghai Based on Location-Based Social Network’s Data from Weibo. Int. J. Geo Infor. 2020, 9, 70. [Google Scholar] [CrossRef] [Green Version]
  70. Yadav, P.K.; Gupta, S.; Kumar, D. Machine performance index (MPI): A method to evaluate the performance of mining dumper. J. Mines Met. Fuels 2019, 67, 320–325. [Google Scholar]
  71. Bernardon, D.P.; Sperandio, M.; Garcia, V.J.; Canha, L.N.; Abaide, A.D.R.; Daza, E.F.B. AHP decision-making algorithm to allocate remotely controlled switches in distribution networks. IEEE Trans. Power Deliv. 2011, 26, 1884–1892. [Google Scholar] [CrossRef]
  72. McArthur, J.; Moonen, T. Liveable Cities Rankings: How a Global Enterprise Is Influencing Urban Change. 2019. Available online: https://theconversation.com/liveable-cities-rankings-how-a-global-enterprise-is-influencing-urban-change-113948 (accessed on 12 March 2020).
  73. Xiangrui, C.; Gang, K.; Tie, L.; Yi, P. Jie Ke versus AlphaGo: A ranking approach using decision making method for large-scale data with incomplete information. Eur. J. Oper. Res. 2017, 265, 239–247. [Google Scholar]
  74. Rana, N.P.; Luthra, S.; Mangla, S.K.; Islam, R.; Roderick, S.; Dwivedi, Y.K. Barriers to the Development of Smart Cities in Indian Context. Inf. Syst. Front. 2018, 21, 503–525. [Google Scholar] [CrossRef] [Green Version]
  75. Wang, X.; Chi, C. Global city indicator: Towards a holistic view of low carbon city dimensions. Energy Procedia 2016, 88, 168–175. [Google Scholar] [CrossRef] [Green Version]
  76. Zhao, Z.; Cerf, S.; Birke, R.; Robu, B.; Bouchenak, S.; Mokhtar, S.B.; Chen, L.Y. Robust Anomaly Detection on Unreliable Data. In Proceedings of the 2019 49th Annual IEEE/IFIP International Conference on Dependable Systems and Networks (DSN), Portland, OR, USA, 24–27 June 2019. [Google Scholar]
  77. Dopazo, E.; Martinez-Cespedes, M.L. Rank aggregation methods dealing with incomplete information applied to Smart Cities. In Proceedings of the 2015 IEEE International Conference on Fuzzy Systems (FUZZ-IEEE), Istanbul, Turkey, 2–5 August 2015. [Google Scholar]
  78. Chi, J.T.; Chi, E.C.; Baraniuk, R.G. k-POD: A Method for k-Means Clustering of Missing Data. Am. Stat. 2016, 70. [Google Scholar] [CrossRef] [Green Version]
  79. Souto, M.C.P.D.; Jaskowiak, P.A.; Costa, I.G. Impact of missing data imputation methods on gene expression clustering and classification. BMC Bioinform. 2015, 16, 1–9. [Google Scholar] [CrossRef] [PubMed] [Green Version]
  80. Boluki, S.; Dadaneh, S.Z.; Qian, X.; Dougherty, E.R. Optimal clustering with missing values. BMC Bioinform. 2019, 20, 1–10. [Google Scholar] [CrossRef] [PubMed] [Green Version]
  81. Carr, C. Inside Smart Cities—Place, Politics and Urban Innovation; Routledge: London, UK, 2019; Volume 55. [Google Scholar] [CrossRef]
  82. List of Cities in Australia by Population. Wikipedia. 2020. Available online: https://simple.wikipedia.org/wiki/List_of_cities_in_Australia_by_population (accessed on 12 November 2020).
  83. Wilson, S.E. Methods for Clustering Data with Missing Values. no. December, 2015. Master’s Thesis, Mathematical Institute Statistical Science for the Life and Behavioural Sciences, University of Leiden, Leiden, The Netherlands.
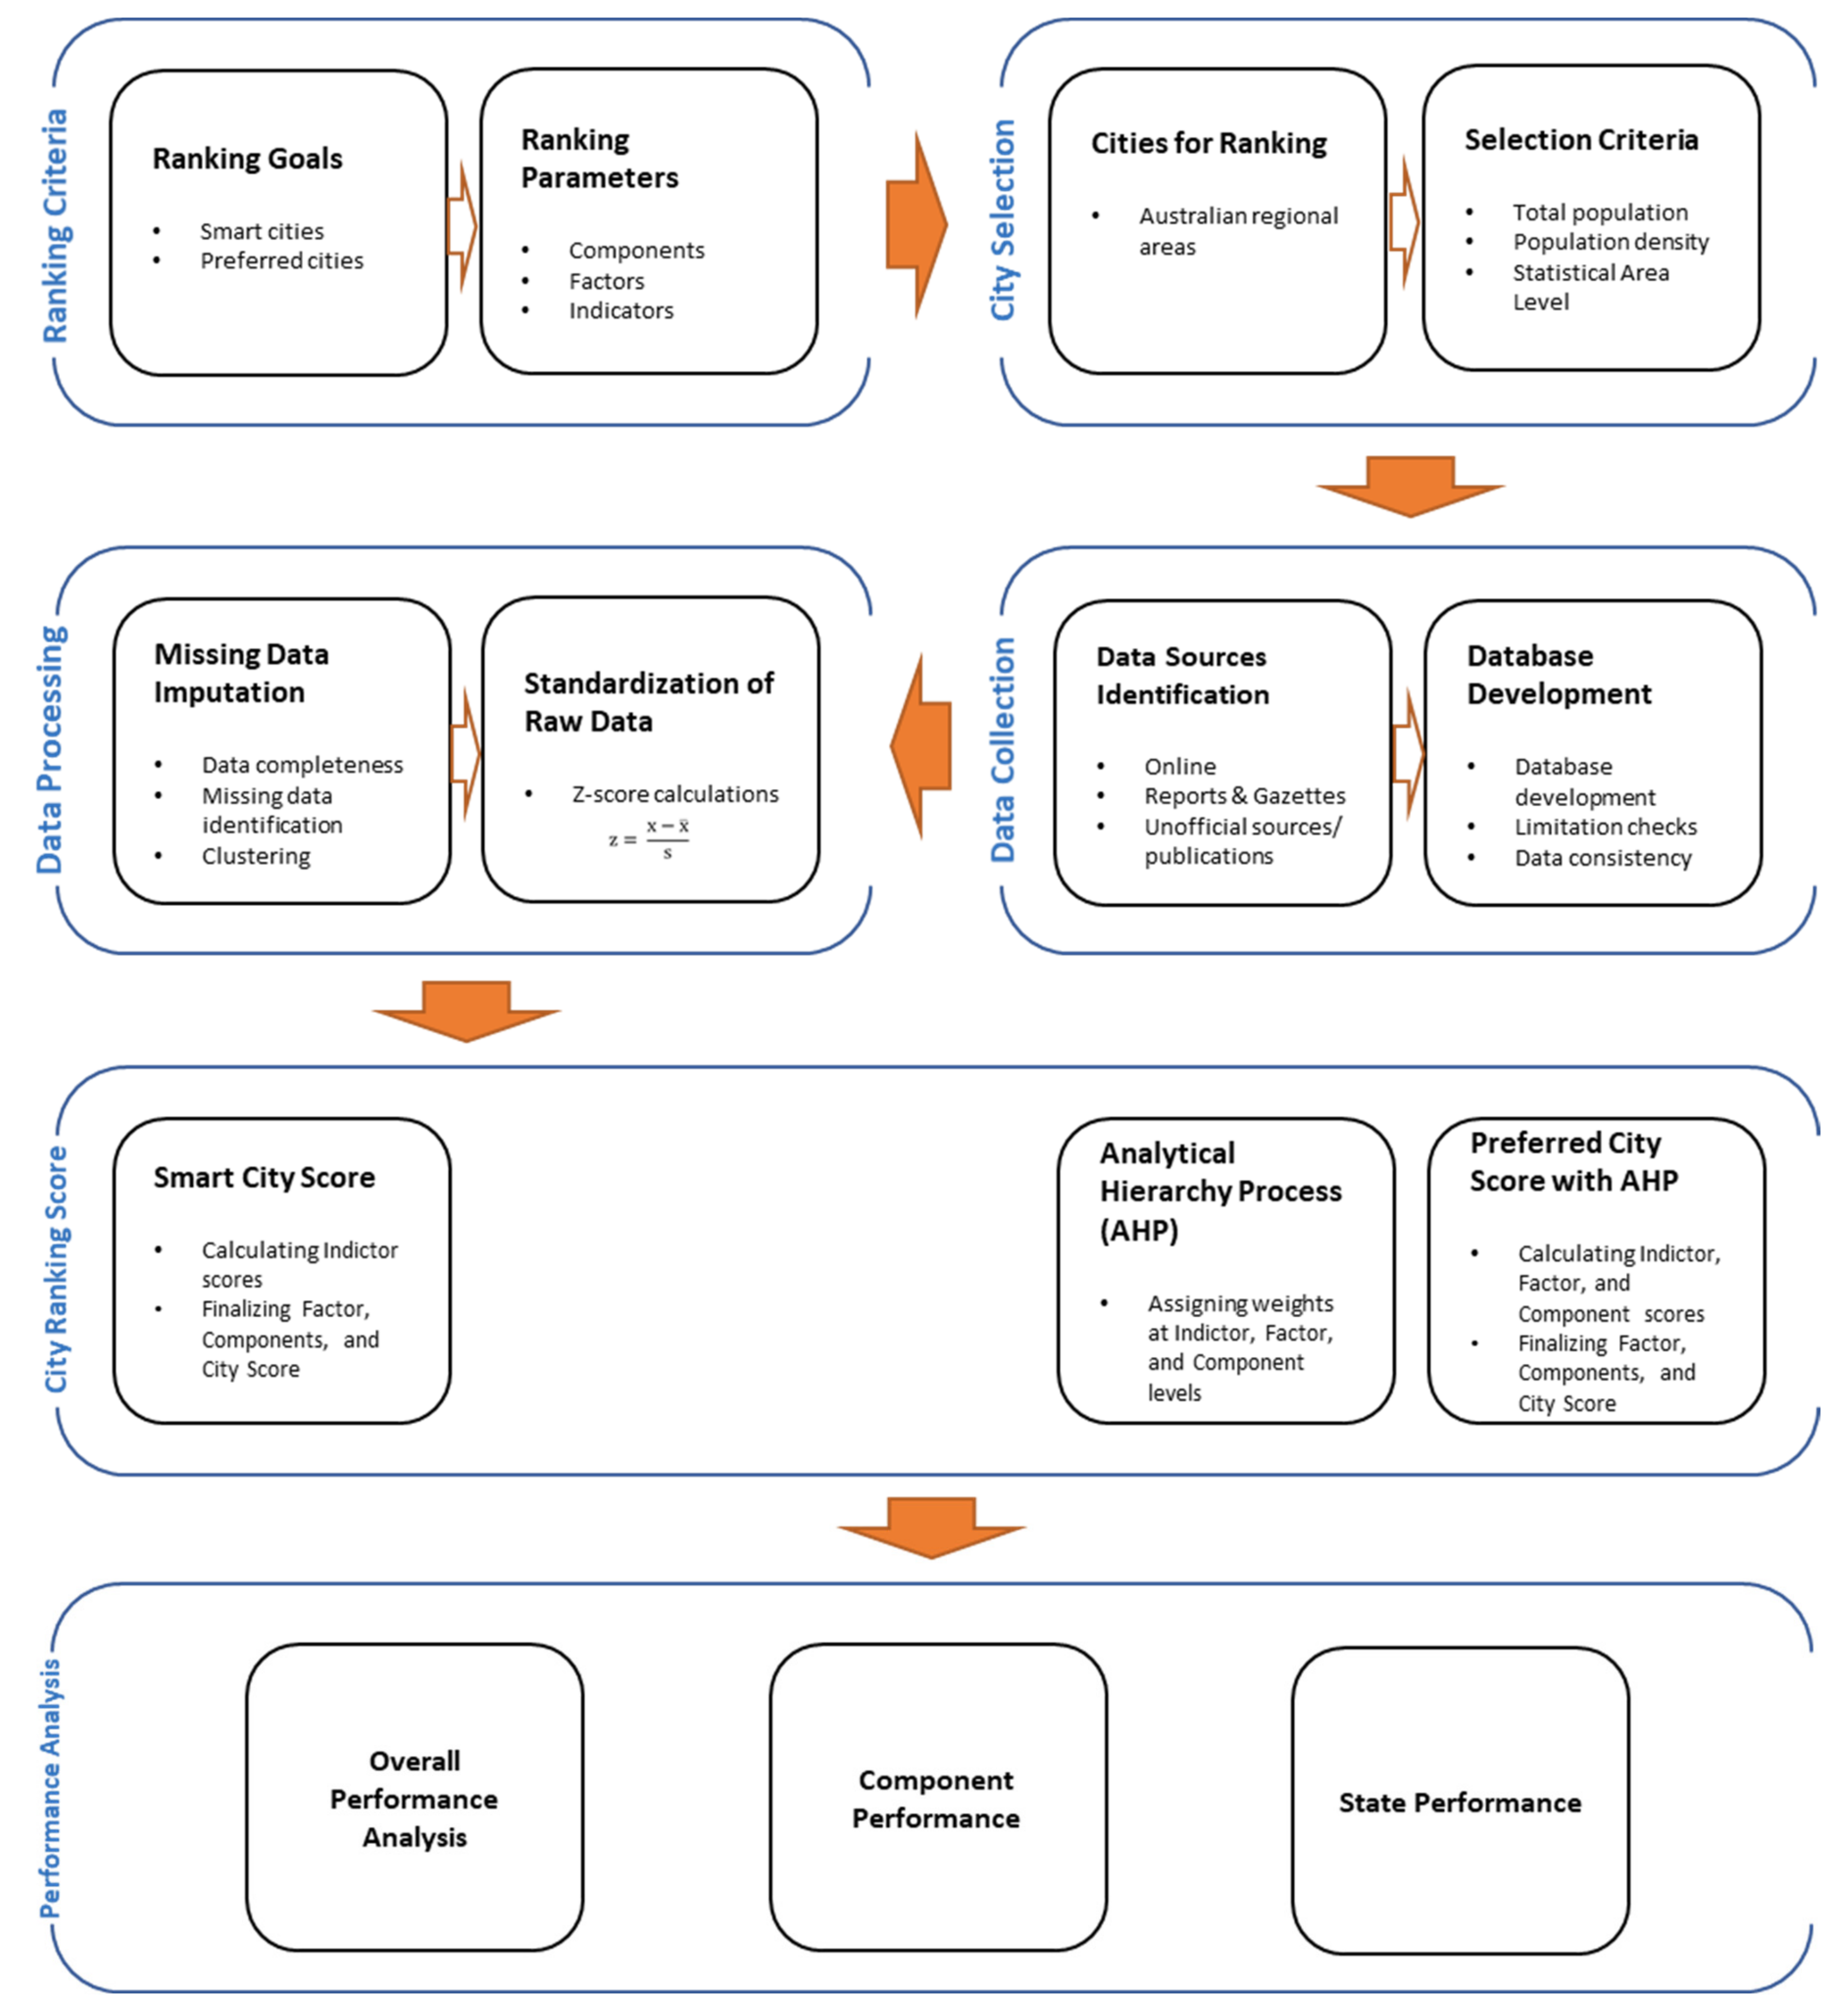
Figure 1. Schematic layout of defined methodology.
Infrastructures 06 00037 g001
Figure 2. Selection of Components, Factors, and Indicators for evaluation (AHP weightages applied at each level, shade intensity shows lower weightage).
Infrastructures 06 00037 g002aInfrastructures 06 00037 g002b
Figure 3. Missingness map showing the 26 missing values for 6 indicators.
Infrastructures 06 00037 g003
Figure 4. Smart score in descending order for 112 cities.
Infrastructures 06 00037 g004
Figure 5. Preferred Cities arranged in a descending order.
Infrastructures 06 00037 g005
Figure 6. Population growth rate of states, greater capitals, and rest of state areas over the last 10-years.
Infrastructures 06 00037 g006
Figure 7. Smart cities performance in each component.
Infrastructures 06 00037 g007
Figure 8. Preferred cities’ performance at the component level.
Infrastructures 06 00037 g008
Figure 9. A spatial distribution of Smart Cities and Preferred Cities with the preference weightages and growth rates of last 10-years (Not to the scale).
Infrastructures 06 00037 g009
Figure 10. Smart Score of 44 cities of NSW along with Preference Score and 10-year population growth.
Infrastructures 06 00037 g010
Figure 11. Performance of 23 cities of Victoria in terms of smart score, preference, and population growth.
Infrastructures 06 00037 g011
Figure 12. Smart city performance, Preference, and population growth of Queensland’s 18 cities.
Infrastructures 06 00037 g012
Figure 13. Smart and preferred city rankings of Western Australian 10 cities and the population growth rates.
Infrastructures 06 00037 g013
Figure 14. Smart and preferred city rankings of South Australian 9 cities and the population growth rates.
Infrastructures 06 00037 g014
Figure 15. Five smart cities of Tasmania with preference and growth rates.
Infrastructures 06 00037 g015
Table 1. Selection criteria for the comparison of Australian cities.
CriteriaDescriptionRange
1Total population >10,000 < 700,000
2Population density>50 person/km2
3Statistical Area LevelStatistical Area 2
4Limit on Greater CitiesNot more than one SA−2 from each greater city
Table 2. Data Source for analysis.
Type of DataCoverage Level
1410.0—Data by Region, 2013–2018Statistical Area 2
Disposable income 2011Statistical Area 2
Patent & Trademark Apps 2015–2016Statistical Area 3
Gross Capital Gains, 2015–2016Statistical Area 3
Life expectancy at birth 2017–2019Statistical Area 4
Greater Capital City StatisticsGreater Capital City Statistical Area
Table 3. Number of indicators from different coverage levels.
Number of IndicatorsCoverage Level Used
47Statistical Area 2
1Statistical Area 3
2Statistical Area 4
40Greater Capital City Statistical Area
90Total
Table 4. Scale used to represent the importance of various indicators, factors, and components considered in AHP.
Quantitative ImportanceQualitative Description
1/9Not important
1/7
1/5Less important
1/3
1Equally important
3Important
5
7Extremely important
9
Publisher’s Note: MDPI stays neutral with regard to jurisdictional claims in published maps and institutional affiliations.