Bridge Network Seismic Risk Assessment Using ShakeMap/HAZUS with Dynamic Traffic Modeling
Abstract
:1. Introduction
1.1. HAZUS, GIS-Based Seismic Hazard Assessment Software
1.2. Travel Time Loss Estimation with Dynamic Traffic Modeling
1.3. Objectives
- To develop the seismic hazard maps for scenario-based earthquake analysis.
- To analyze the structural integrity of the transportation network by employing graph theory.
- To simulate the dynamic traffic assignment for travel time loss purposes.
2. Literature Review
2.1. Seismic Risk Assessment
2.2. HAZUS International Adaptations, Seismic Risk Assessment Tools
3. Seismic Hazard Analysis of Northern Cyprus
3.1. Seismicity of Cyprus
3.2. Generating ShakeMap Data for HAZUS
3.3. Seismic Risk Assessment through Fragility Analysis of Bridges
4. The Transportation Network of Northern Cyprus
4.1. Network Reliability and Vulnerability
4.2. Topological Vulnerability Analysis Using Graph Theory
4.3. Structural Measures and Indices at Network Level
4.4. Structural Measures and Node and Edge Level
4.5. Link Performance Measures
Static vs. Dynamic Traffic Assignment
- (1)
- No user can reduce his/her path cost by switching routes, and
- (2)
- the route used between the OD pairs have equal and minimum cost (shortest path); the rest of the unused route has greater or equal cost compared to the used path cost.
4.6. Inventory and Traffic Data Collection
4.7. Dynamic Traffic Simulation
5. Seismic Risk Assessment of Northern Cyprus Transportation Network
5.1. Earthquake Scenarios
5.2. Structural Loss Estimation from ShakeMap Hazard Maps
5.3. Structural Loss Estimation from HAZUS Hazard Module
5.4. Estimation of Bridge Restoration Model
5.5. Post-Earthquake Network Reliability Indices
5.6. Post-Earthquake Structural Loss at Node and Edge Level
5.7. Travel Time Loss Estimation
5.8. Operational and Structural Loss Aggregation, Economic Analysis of Bridge Retrofitting
6. General Remarks and Limitations
- Developing a real-time seismic hazard and risk assessment.
- Initiating a localized hazard assessment of the critical regions. e.g., district of Lefke.
- Gathering a comprehensive transportation network data, including the road characteristics, travel time estimation and socioeconomic parameters taken from detailed surveys.
- Retrofitting vulnerable links and bridges as identified in this study.
- Providing detour links in the areas where the risk of bridge failure is high, especially in the district of Lefke where no detour links exist.
7. Future Work and Conclusions
Author Contributions
Funding
Data Availability Statement
Conflicts of Interest
References
- Little, R.G. Controlling Cascading Failure: Understanding the Vulnerabilities of Interconnected Infrastructures. J. Urban Technol. 2002, 9, 109–123. [Google Scholar] [CrossRef]
- Basöz, N.; Kiremidjian, A.S. Risk Assessment for Highway Transportation Systems. John, A.B., Ed.; Earthquake Engineering Center Technical Report 118, USA. 1996. Available online: http://purl.stanford.edu/fr998kq2251 (accessed on 27 July 2020).
- Tomaszewski, B. Geographic Information Systems (GIS) for Disaster Management, 1st ed.; Routledge: Boca Raton, FL, USA, 2014. [Google Scholar]
- Cheng, M.-Y.; Wu, Y.-W.; Chen, S.-J.; Weng, M.-C. Economic evaluation model for post-earthquake bridge repair/rehabilitation: Taiwan case studies. Autom. Constr. 2009, 18, 204–218. [Google Scholar] [CrossRef]
- Enke, D.L.; Tirasirichai, C.; Luna, R. Estimation of Earthquake Loss due to Bridge Damage in the St. Louis Metropolitan Area. II: Indirect Losses. Nat. Hazards Rev. 2008, 9, 12–19. [Google Scholar] [CrossRef]
- Shi, W.; Cheng, P.G.; Ko, J.M.; Liu, C. GIS-based bridge structural health monitoring and management system. In Proceedings of the Nondestructive Evaluation and Health Monitoring of Aerospace Materials and Civil Infrastructures, San Diego, CA, USA, 18 June 2002; Volume 4704, pp. 12–19. [Google Scholar] [CrossRef]
- Chiu, Y.C.; Bottom, J.; Mahut, M.; Paz, A.; Balakrishna, R.; Waller, S.; Hicks, J. Dynamic Traffic Assignment: A Primer; Transportation Research Board: Washington, DC, USA, 2011; Available online: https://onlinepubs.trb.org/onlinepubs/circulars/ec153.pdf (accessed on 19 July 2020).
- Kiremidjian, A.; Moore, J.; Fan, Y.Y.; Yazlali, O.; Basoz, N.; Williams, M. Seismic Risk Assessment of Transportation Network Systems. J. Earthq. Eng. 2007, 11, 371–382. [Google Scholar] [CrossRef]
- Barbat, A.H.; Carreño, M.L.; Pujades, L.G.; Lantada, N.; Cardona, O.D.; Marulanda, M.C. Seismic vulnerability and risk evaluation methods for urban areas. A review with application to a pilot area. Struct. Infrastruct. Eng. 2010, 6, 17–38. [Google Scholar] [CrossRef]
- Guo, A.; Liu, Z.; Li, S.; Li, H. Seismic performance assessment of highway bridge networks considering post-disaster traffic demand of a transportation system in emergency conditions. Struct. Infrastruct. Eng. 2017, 13, 1523–1537. [Google Scholar] [CrossRef]
- Zhou, Y.; Banerjee, S.; Shinozuka, M. Socio-economic effect of seismic retrofit of bridges for highway transportation networks: A pilot study. Struct. Infrastruct. Eng. 2010, 6, 145–157. [Google Scholar] [CrossRef]
- Kilanitis, I.; Sextos, A. Integrated seismic risk and resilience assessment of roadway networks in earthquake prone areas. Bull. Earthq. Eng. 2019, 17, 181–210. [Google Scholar] [CrossRef] [Green Version]
- Padgett, J.E.; Desroches, R.; Nilsson, E. Regional Seismic Risk Assessment of Bridge Network in Charleston, South Carolina. J. Earthq. Eng. 2010, 14, 918–933. [Google Scholar] [CrossRef]
- Chang, L.; Elnashai, A.S.; Spencer, B.F. Post-earthquake modelling of transportation networks. Struct. Infrastruct. Eng. 2012, 8, 893–911. [Google Scholar] [CrossRef]
- Luna, R.; Hoffman, D.; Lawrence, W.T. Estimation of Earthquake Loss due to Bridge Damage in the St. Louis Metropolitan Area. I: Direct Losses. Natural Hazards Review; American Society of Civil Engineers (ASCE): Reston, VA, USA, 2008; Volume 9, pp. 1–11. [Google Scholar] [CrossRef]
- Stergiou, E.C.; Kiremidjian, A.S. Risk assessment of transportation systems with network functionality losses. Struct. Infrastruct. Eng. 2010, 6, 111–125. [Google Scholar] [CrossRef]
- Shinozuka, M.; Murachi, Y.; Dong, X.; Zhou, Y.; Orlikowski, M.J. Effect of seismic retrofit of bridges on transportation networks. Earthq. Eng. Eng. Vib. 2003, 2, 169–179. [Google Scholar] [CrossRef] [Green Version]
- Codermatz, R.; Nicolich, R.; Slejko, D. Seismic risk assessments and GIS technology: Applications to infrastructures in the Friuli-Venezia Giulia region (NE Italy). Earthq. Eng. Struct. Dyn. 2003, 32, 1677–1690. [Google Scholar] [CrossRef]
- Rozelle, J.R. International Adaptation of the Hazus Earthquake Model Using Global Exposure Datasets. Master’s Thesis, University of Colorado, Denver, CO, USA, 2018. Available online: https://search.proquest.com/docview/2138380714/abstract/19F245120FBC497FPQ/1 (accessed on 22 June 2020).
- McGrath, H.; Stefanakis, E.; Nastev, M. Sensitivity analysis of flood damage estimates: A case study in Fredericton, New Brunswick. Int. J. Disaster Risk Reduct. 2015, 14, 379–387. [Google Scholar] [CrossRef]
- Fallah-Aliabadi, S.; Ostadtaghizadeh, A.; Ardalan, A.; Eskandari, M.; Fatemi, F.; Mirjalili, M.R.; Khazai, B. Risk analysis of hospitals using GIS and HAZUS: A case study of Yazd County, Iran. Int. J. Disaster Risk Reduct. 2020, 47, 101552. [Google Scholar] [CrossRef]
- Silva, V.; Crowley, H.; Pagani, M.; Monelli, D.; Pinho, R. Development of the OpenQuake engine, the Global Earthquake Model’s open-source software for seismic risk assessment. Nat. Hazards 2013, 72, 1409–1427. [Google Scholar] [CrossRef]
- Cagnan, Z.; Tanircan, G.B. Seismic hazard assessment for Cyprus. J. Seism. 2009, 14, 225–246. [Google Scholar] [CrossRef]
- Jena, R.; Pradhan, B.; Beydoun, G.; Al-Amri, A.; Sofyan, H. Seismic hazard and risk assessment: A review of state-of-the-art traditional and GIS models. Arab. J. Geosci. 2020, 13, 50. [Google Scholar] [CrossRef]
- Geological Survey Department Cyprus. Cyprus Broadband Seismological Network [Data set]. International Federation of Digital Seismograph Networks. 2013. Available online: https://www.fdsn.org/networks/detail/CQ/ (accessed on 1 August 2022). [CrossRef]
- Woessner, J.; Laurentiu, D.; Giardini, D.; Crowley, H.; Cotton, F.; Grünthal, G.; Valensise, G.; Arvidsson, R.; Basili, R.; Demircioglu, M.B.; et al. The 2013 European Seismic Hazard Model: Key components and results. Bull. Earthq. Eng. 2015, 13, 3553–3596. [Google Scholar] [CrossRef] [Green Version]
- Gross, J.L.; Phan, L.T. Implications for Earthquake Risk Reduction in the United States From the Kocaeli, Turkey, Earthquake of August 17, 1999. In ASCE World Structural Engineering Conference (USGS Circular 1193); USA; 2000; Volume 1193. Available online: https://www.nist.gov/publications/implications-earthquake-risk-reduction-united-states-kocaeli-turkey-earthquake-august (accessed on 14 July 2020).
- Barka, A.; Reilinger, R. Active tectonics of the Eastern Mediterranean region: Deduced from GPS, neotectonic and seismicity data. Ann. Geophys. 1997, 40, 2. [Google Scholar] [CrossRef]
- Boore, D.M.; Atkinson, G.M. Ground-Motion Prediction Equations for the Average Horizontal Component of PGA, PGV, and 5%-Damped PSA at Spectral Periods between 0.01s and 10.0s. Earthq. Spectra 2008, 24, 99–138. [Google Scholar] [CrossRef] [Green Version]
- Campbell, K.W.; Bozorgnia, Y. NGA-West2 Ground Motion Model for the Average Horizontal Components of PGA, PGV, and 5% Damped Linear Acceleration Response Spectra. Earthq. Spectra 2014, 30, 1087–1115. [Google Scholar] [CrossRef]
- Akkar, S.; Bommer, J.J. Empirical Equations for the Prediction of PGA, PGV, and Spectral Accelerations in Europe, the Mediterranean Region, and the Middle East. Seism. Res. Lett. 2010, 81, 195–206. [Google Scholar] [CrossRef] [Green Version]
- Cagnan, Z.; Yilmaz, O.; Yilmaz, T. Site Classification of Newly Deployed Strong Motion Stations in the Eastern Mediterranean. Presented at the 15th World Conference on Earthquake Engineering, Lisbon, Portugal, 24 September 2012. [Google Scholar]
- Nielson, B.G. Analytical Fragility Curves for Highway Bridges in Moderate Seismic Zones. Ph.D. Thesis, Georgia Institute of Technology, Atlanta, GA, USA, 2005. [Google Scholar]
- NIBS-FEMA. Hazus®–MH 2.1 Multi-Hazard Loss Estimation Methodology Technical Manual; Department of Homeland Security Federal Emergency Management Agency Mitigation Division: Washington, DC, USA, 2013. [Google Scholar]
- Mander, J.B.; Basöz, N. Seismic Fragility Curve Theory for Highway Bridges. In Optimizing Post-Earthquake Lifeline System Reliability; Seattle, WA, USA; 1999; pp. 31–40. Available online: https://cedb.asce.org/CEDBsearch/record.jsp?dockey=0118440 (accessed on 2 May 2019).
- Taylor, M.A.P.; D’Este, G.M. Transport Network Vulnerability: A Method for Diagnosis of Critical Locations in Transport Infrastructure Systems. In Critical Infrastructure: Reliability and Vulnerability; Murray, A.T., Grubesic, T.H., Eds.; Springer: Berlin/Heidelberg, Germany, 2007; pp. 9–30. [Google Scholar] [CrossRef]
- Bell, M.G.H.; Iida, Y. Transportation Network Analysis; Chichester; John Wiley & Sons: New York, NY, USA, 1997. [Google Scholar]
- Rodrigue, J.-P.; Comtois, C.; Slack, B. The geography of Transport Systems, 4th ed.; Routledge: London, UK; Taylor & Francis Group: New York, NY, USA, 2017. [Google Scholar]
- Gross, J.L.; Yellen, J.; Zhang, P. (Eds.) Handbook of Graph Theory, 2nd ed.; CRC Press, Taylor & Francis Group: Boca Raton, FL, USA, 2014. [Google Scholar]
- Kansky, K.; Danscoine, P. Measures of network structure. FLUX Cah. Sci. Int. Réseaux Territ. 1989, 5, 89–121. [Google Scholar] [CrossRef]
- Kansky, K.J. Structure of Transportation Networks: Relationships Between Network Geometry and Regional Characteristics; University of Chicago: Chicago, IL, USA, 1963. [Google Scholar]
- Mattsson, L.-G.; Jenelius, E. Vulnerability and resilience of transport systems—A discussion of recent research. Transp. Res. Part A Policy Pract. 2015, 81, 16–34. [Google Scholar] [CrossRef]
- Sevtsuk, A.; Mekonnen, M. Urban Network Analysis: A New Toolbox for Measuring City Form in ArcGIS. In Proceedings of the 2012 Symposium on Simulation for Architecture and Urban Design, San Diego, CA, USA, 26–30 March 2012. [Google Scholar]
- Okabe, A.; Okunuki, K. A Spatial Analysis along Networks, Version 4.1; SANET: Tokyo, Japa, 2017. [Google Scholar]
- Hagberg, A.; Swart, P.; Chult, D.S. Exploring Network Structure, Dynamics, and Function Using Networkx. In Proceedings of the SCIPY 08, Pasadena, CA, USA, 21 August 2008; Los Alamos National Lab. (LANL), Los Alamos, NM (United States), LA-UR-08-05495; LA-UR-08-5495. Available online: https://www.osti.gov/biblio/960616-exploring-network-structure-dynamics-function-using-networkx (accessed on 3 July 2020).
- Freeman, L.C. Centrality in social networks conceptual clarification. Soc. Netw. 1978, 1, 215–239. [Google Scholar] [CrossRef] [Green Version]
- Sevtsuk, A.; Mekonnen, M.; Kalvo, R. Urban Network AnalysisToolbox for ArcGIS 10/10.1/10.2 Help Manual V1.01; City Form Lab: Seattle, WA, USA, 2016. [Google Scholar]
- Handy, S.L.; A Niemeier, D. Measuring Accessibility: An Exploration of Issues and Alternatives. Environ. Plan. A: Econ. Space 1997, 29, 1175–1194. [Google Scholar] [CrossRef]
- Okabe, A.; Sugihara, K. Spatial Analysis along Networks: Statistical and Computational Methods; Wiley: Hoboken, NJ, USA, 2012. [Google Scholar]
- Okabe, A.; Satoh, T.; Sugihara, K. A kernel density estimation method for networks, its computational method and a GIS-based tool. Int. J. Geogr. Inf. Sci. 2009, 23, 7–32. [Google Scholar] [CrossRef]
- Benedek, J.; Ciobanu, S.M.; Man, T.-C. Hotspots and social background of urban traffic crashes: A case study in Cluj-Napoca (Romania). Accid. Anal. Prev. 2016, 87, 117–126. [Google Scholar] [CrossRef]
- Xie, Z.; Yan, J. Kernel Density Estimation of traffic accidents in a network space. Comput. Environ. Urban Syst. 2008, 32, 396–406. [Google Scholar] [CrossRef] [Green Version]
- U. B. of P. R. O. of P. U. P. Division. Traffic Assignment Manual for Application with a Large, High Speed Computer; US Department of Commerce: Washington, DC, USA, 1964. [Google Scholar]
- Duthie, J.C.; Nezamuddin, N.; Juri, N.R.; Rambha, T.; Melson, C.; Pool, C.M.; Boyles, S.; Waller, S.T.; Kumar, R. Investigating Regional Dynamic Traffic Assignment Modeling for Improved Bottleneck Analysis: Final Report; Technical Report FHWA/TX-13/0-6657-1; Center for Transportation Research, University of Texas: Austin, TX, USA, 2013. [Google Scholar]
- Tian, Z.; Lin, D.; Yin, K.; Zhou, X. Development of a Dynamic Traffic Assignment Model for Northern Nevada; NDOT Research Report 342-13–803; Center for Advanced Transportation Education and Research (CATER), University of Nevada: Reno, NV, USA, 2014. [Google Scholar]
- Zhou, X.; Taylor, J. DTALite: A queue-based mesoscopic traffic simulator for fast model evaluation and calibration. Cogent Eng. 2014, 1, 961345. [Google Scholar] [CrossRef]
- Lu, C.-C.; Mahmassani, H.S.; Zhou, X. Equivalent gap function-based reformulation and solution algorithm for the dynamic user equilibrium problem. Transp. Res. Part B Methodol. 2009, 43, 345–364. [Google Scholar] [CrossRef]
- Transportation Research Board, Highway Capacity Manual. A Guide for Multimodal Mobility Analysis, 6th ed.; Transportation Research Board: Washington, DC, USA, 2016. [Google Scholar]
- Dowling, R.G.; United States, American Association of State Highway and Transportation Officials, National Research Council (U.S.); National Cooperative Highway Research Program (Eds.) Planning Techniques to Estimate Speeds and Service Volumes for Planning Applications; Transportation Research Board, National Research Council: Washington, DC, USA; National Academy Press: Washington, DC, USA, 1997. [Google Scholar]
- Sloboden, J.; Lewis, J.; Alexiadis, V.; Chiu, Y.-C.; Nava, E. Traffic Analysis Toolbox Volume Xiv: Guidebook on the Utilization of Dynamic Traffic Assignment in Modeling; Federal Highway Administration. Office of Operations: Washington, DC, USA, 2012. [Google Scholar]
- Järv, O.; Ahas, R.; Saluveer, E.; Derudder, B.; Witlox, F. Mobile Phones in a Traffic Flow: A Geographical Perspective to Evening Rush Hour Traffic Analysis Using Call Detail Records. PLoS ONE 2012, 7, e49171. [Google Scholar] [CrossRef] [PubMed] [Green Version]
- Cornell, C.A.; Banon, H.; Shakal, A.F. Seismic motion and response prediction alternatives. Earthq. Eng. Struct. Dyn. 1979, 7, 295–315. [Google Scholar] [CrossRef]
- Wells, D.L.; Coppersmith, K.J. New empirical relationships among magnitude, rupture length, rupture width, rupture area, and surface displacement. Bull. Seismol. Soc. Am. 1994, 84, 974–1002. [Google Scholar]
- Ghasemi, S.H.; Lee, J.Y. Measuring Instantaneous Resilience of a Highway Bridge Subjected to Earthquake Events. Transp. Res. Rec. J. Transp. Res. Board 2021, 2675, 1681–1692. [Google Scholar] [CrossRef]
- Ghasemi, S.H.; Lee, J.Y. Reliability-based indicator for post-earthquake traffic flow capacity of a highway bridge. Struct. Saf. 2020, 89, 102039. [Google Scholar] [CrossRef]
- Dong, Y.; Frangopol, D.M.; Saydam, D. Sustainability of Highway Bridge Networks Under Seismic Hazard. J. Earthq. Eng. 2013, 18, 41–66. [Google Scholar] [CrossRef]
- Chang, S.E.; Shinozuka, M.; Moore, J.E. Probabilistic Earthquake Scenarios: Extending Risk Analysis Methodologies to Spatially Distributed Systems. Earthq. Spectra 2000, 16, 557–572. [Google Scholar] [CrossRef]
- Ozer, E.; Malekloo, A.; Ramadan, W.; Tran, T.T.X.; Di, X. Systemic reliability of bridge networks with mobile sensing-based model updating for postevent transportation decisions. Comput.-Aided Civ. Infrastruct. Eng. 2022, 12892. [Google Scholar] [CrossRef]
- Malekloo, A.; Ozer, E.; Al-Turjman, F. Combination of GIS and SHM in Prognosis and Diagnosis of Bridges in Earthquake-Prone Locations. In Smart Grid in IoT-Enabled Spaces, 1st ed.; CRC Press: Boca Raton, FL, USA, 2020; pp. 139–158. [Google Scholar] [CrossRef]
- Malekloo, A.; Ozer, E.; AlHamaydeh, M.; Girolami, M. Machine learning and structural health monitoring overview with emerging technology and high-dimensional data source highlights. Struct. Health Monit. 2021, 21, 1906–1955. [Google Scholar] [CrossRef]

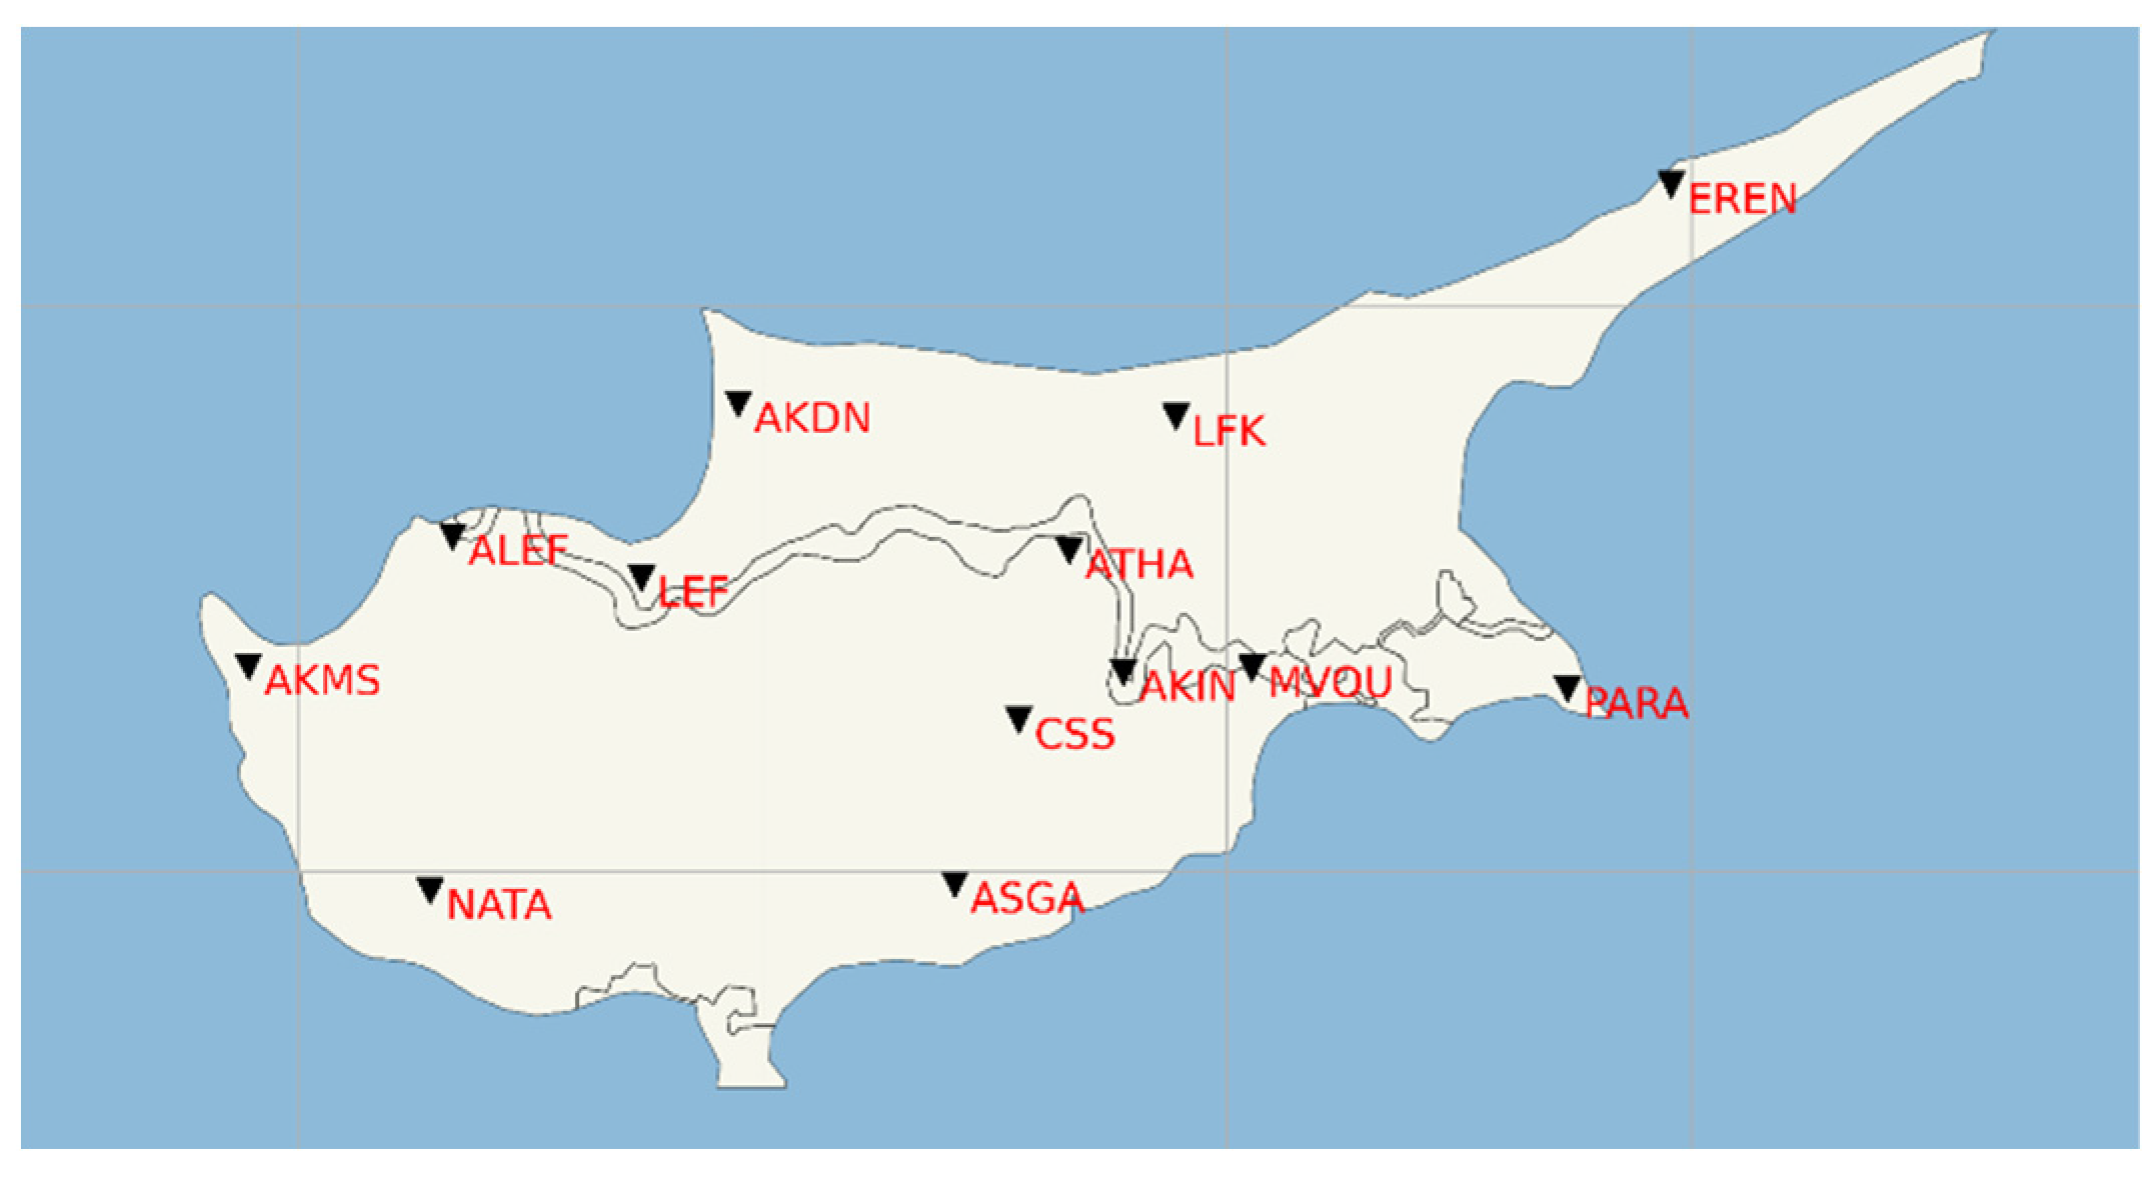


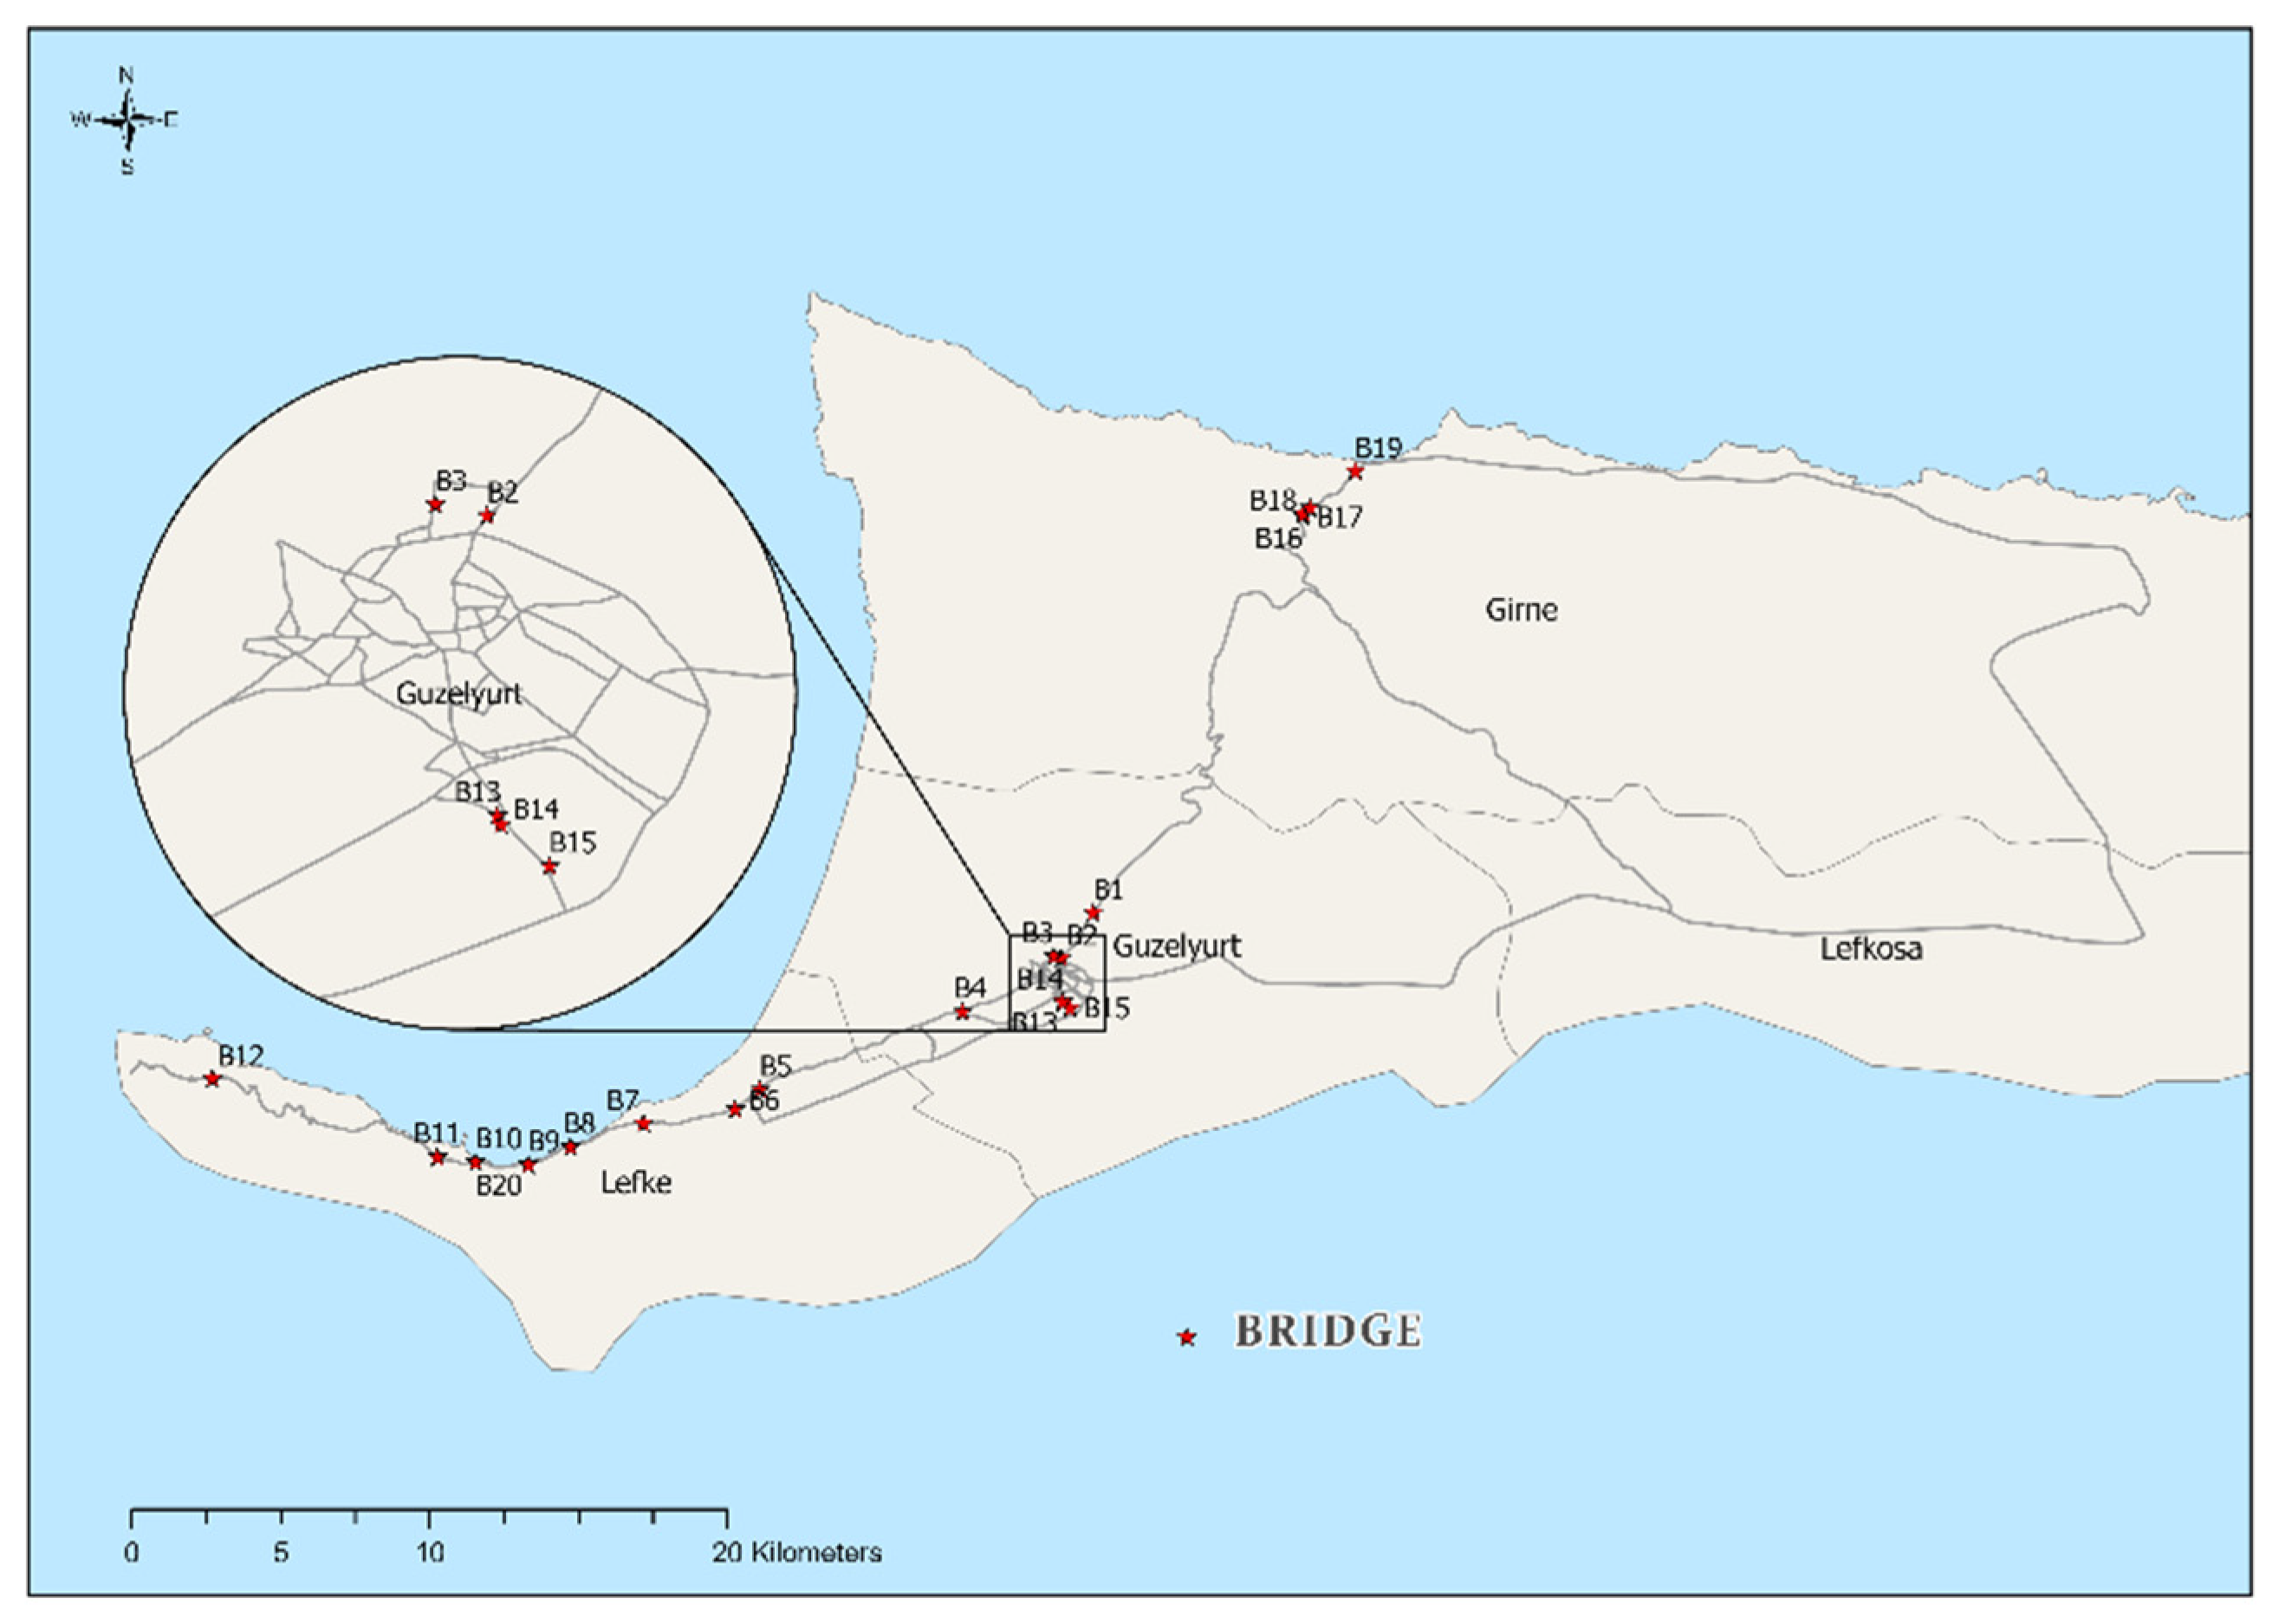
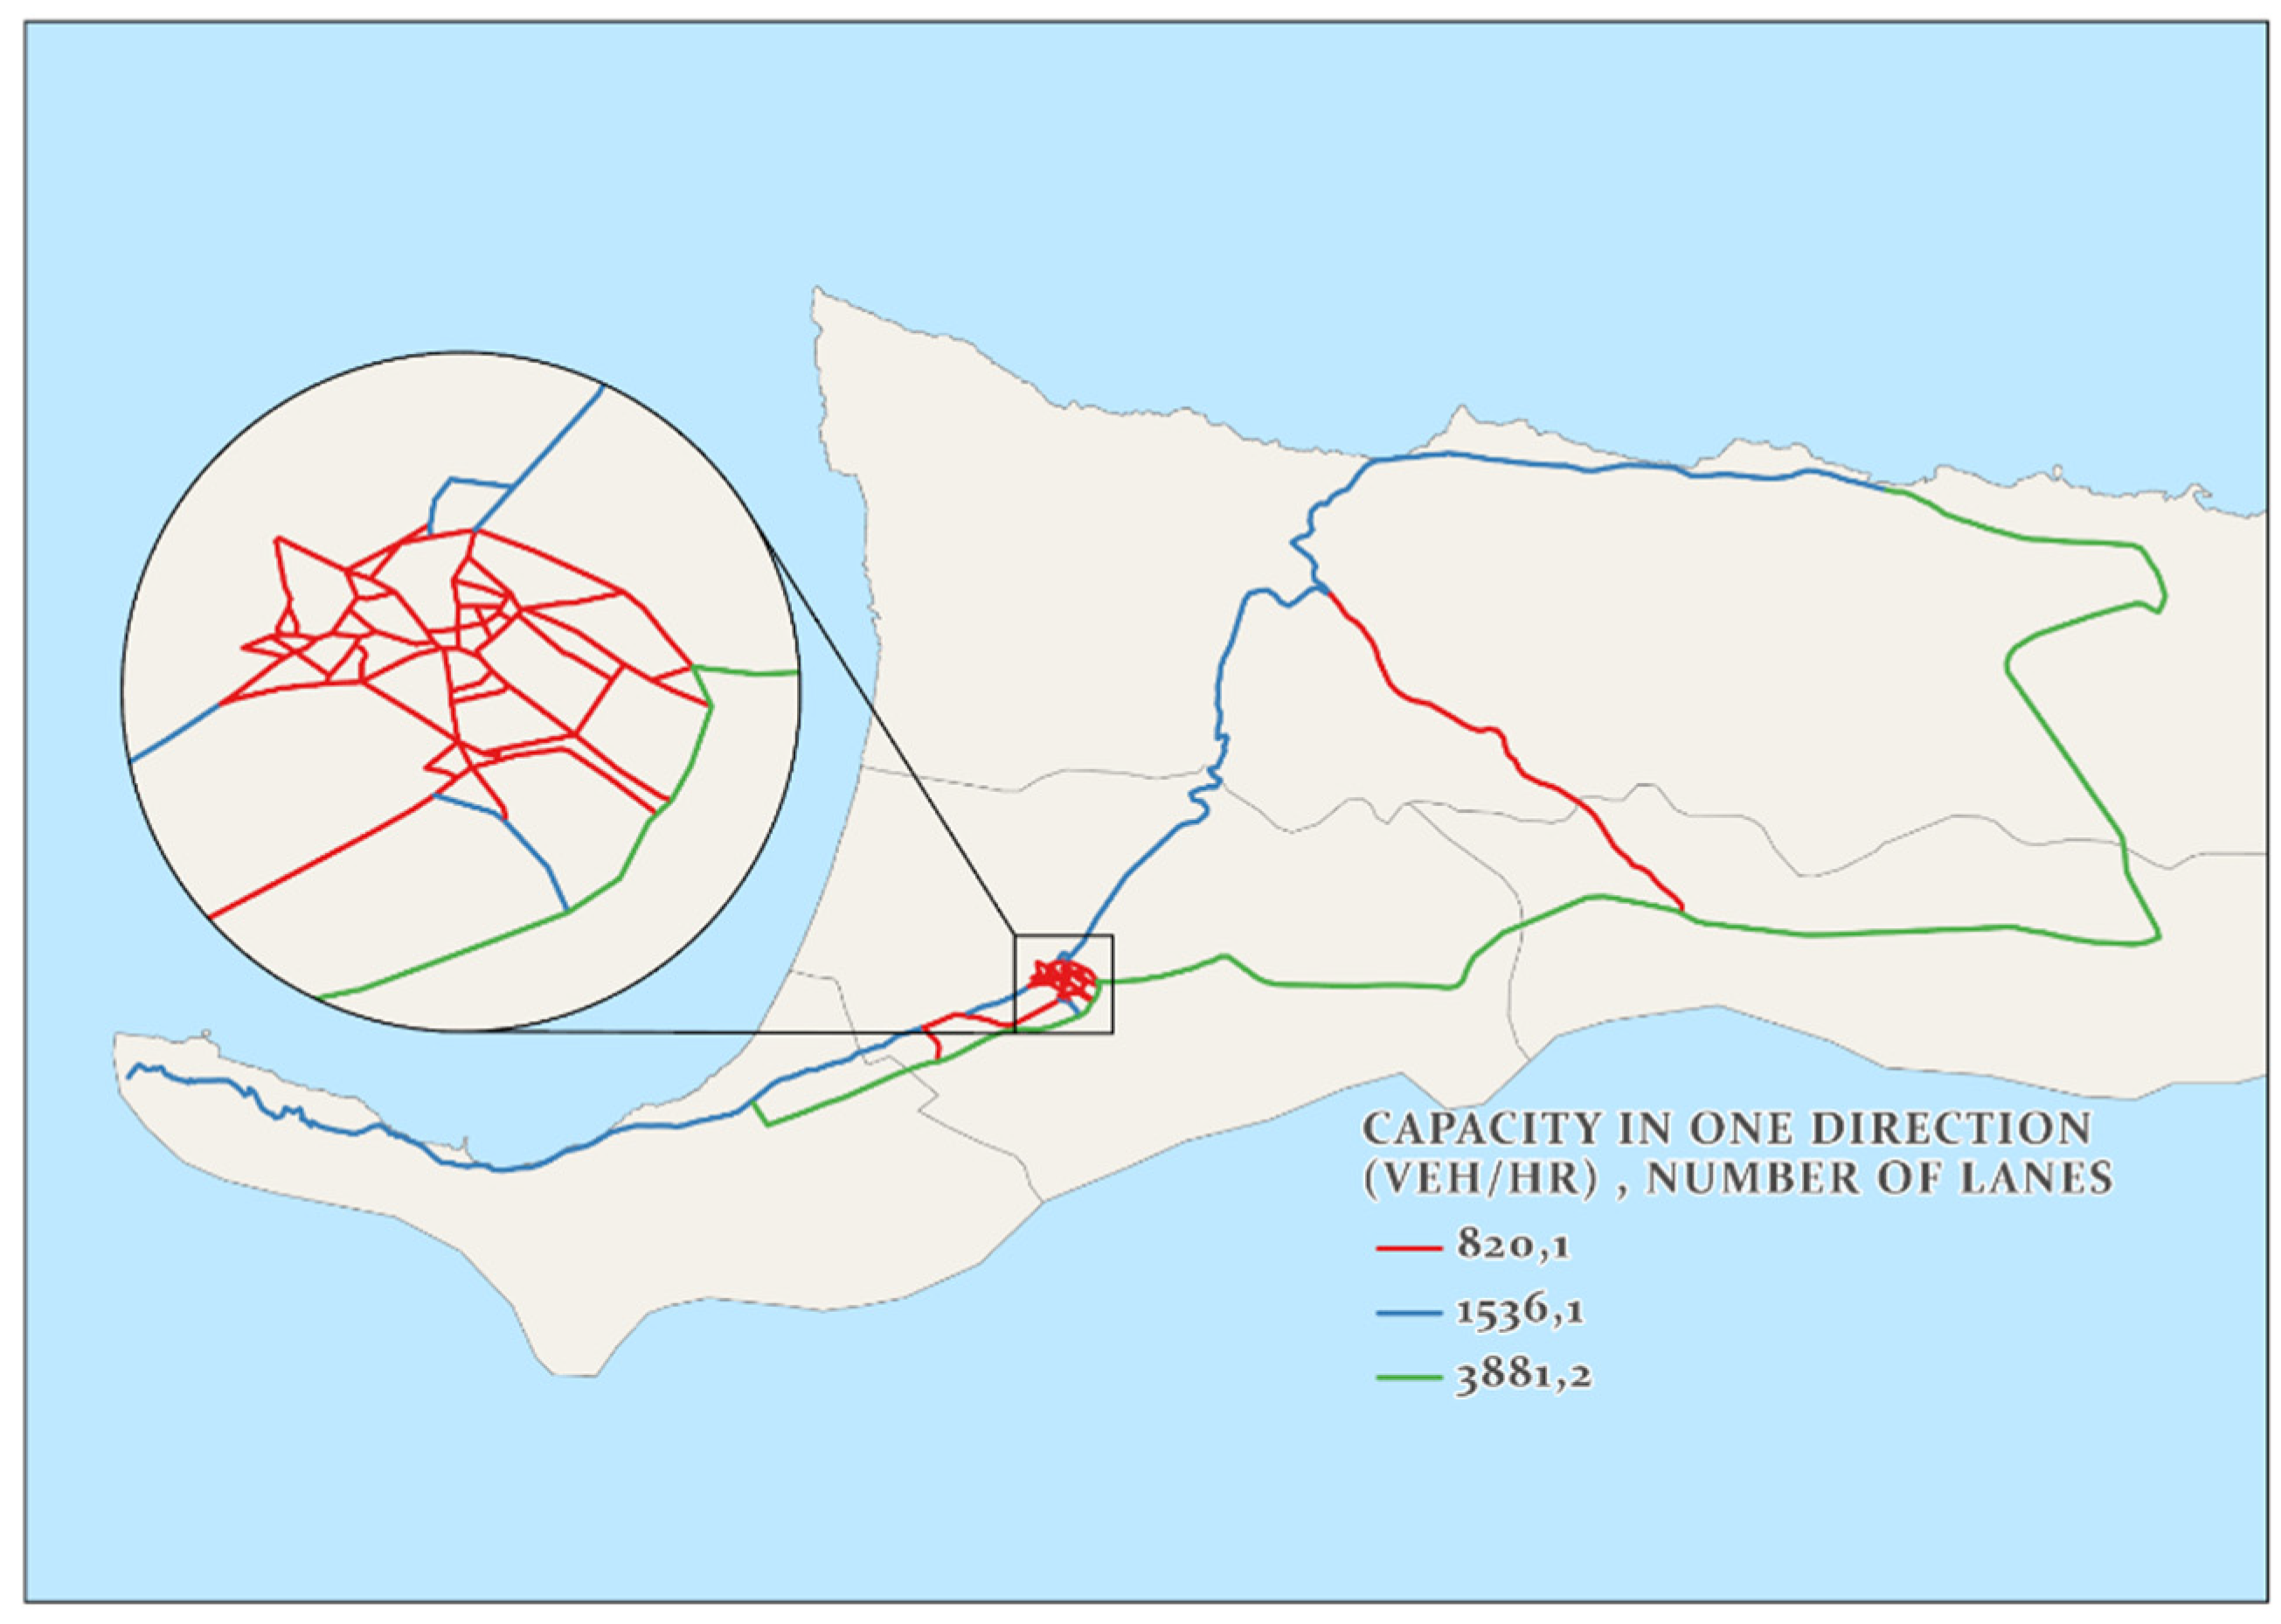


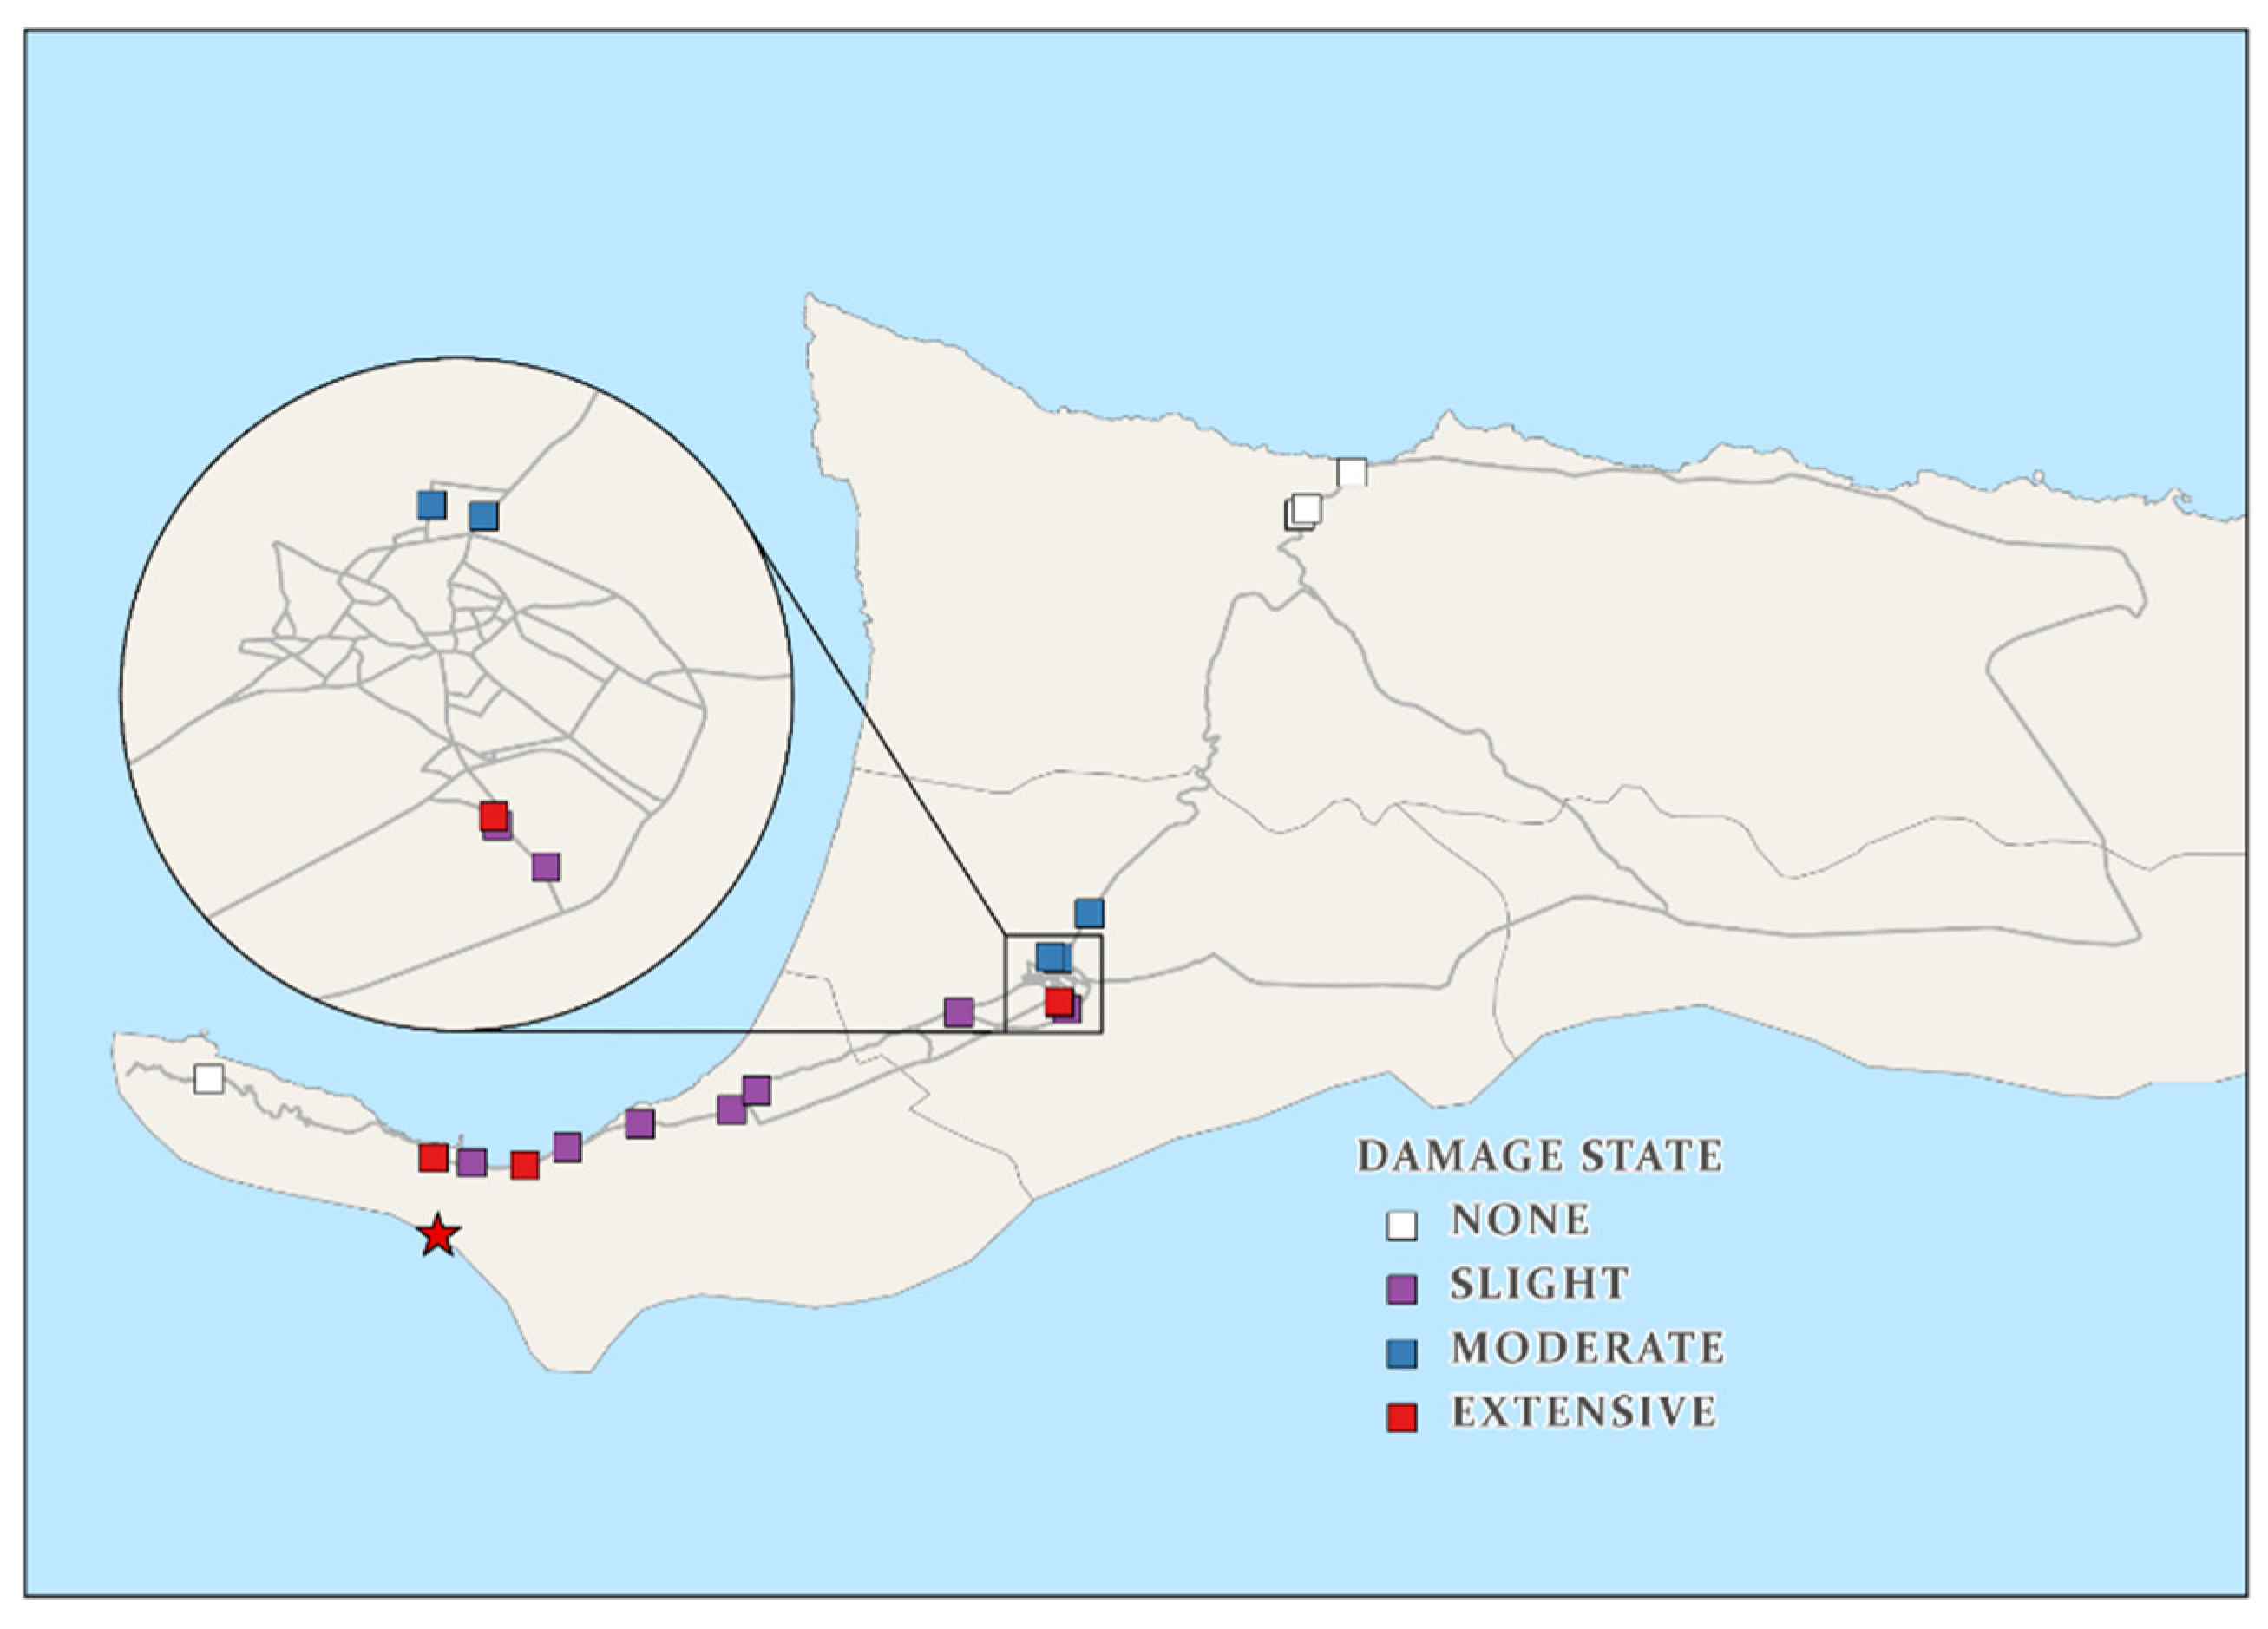
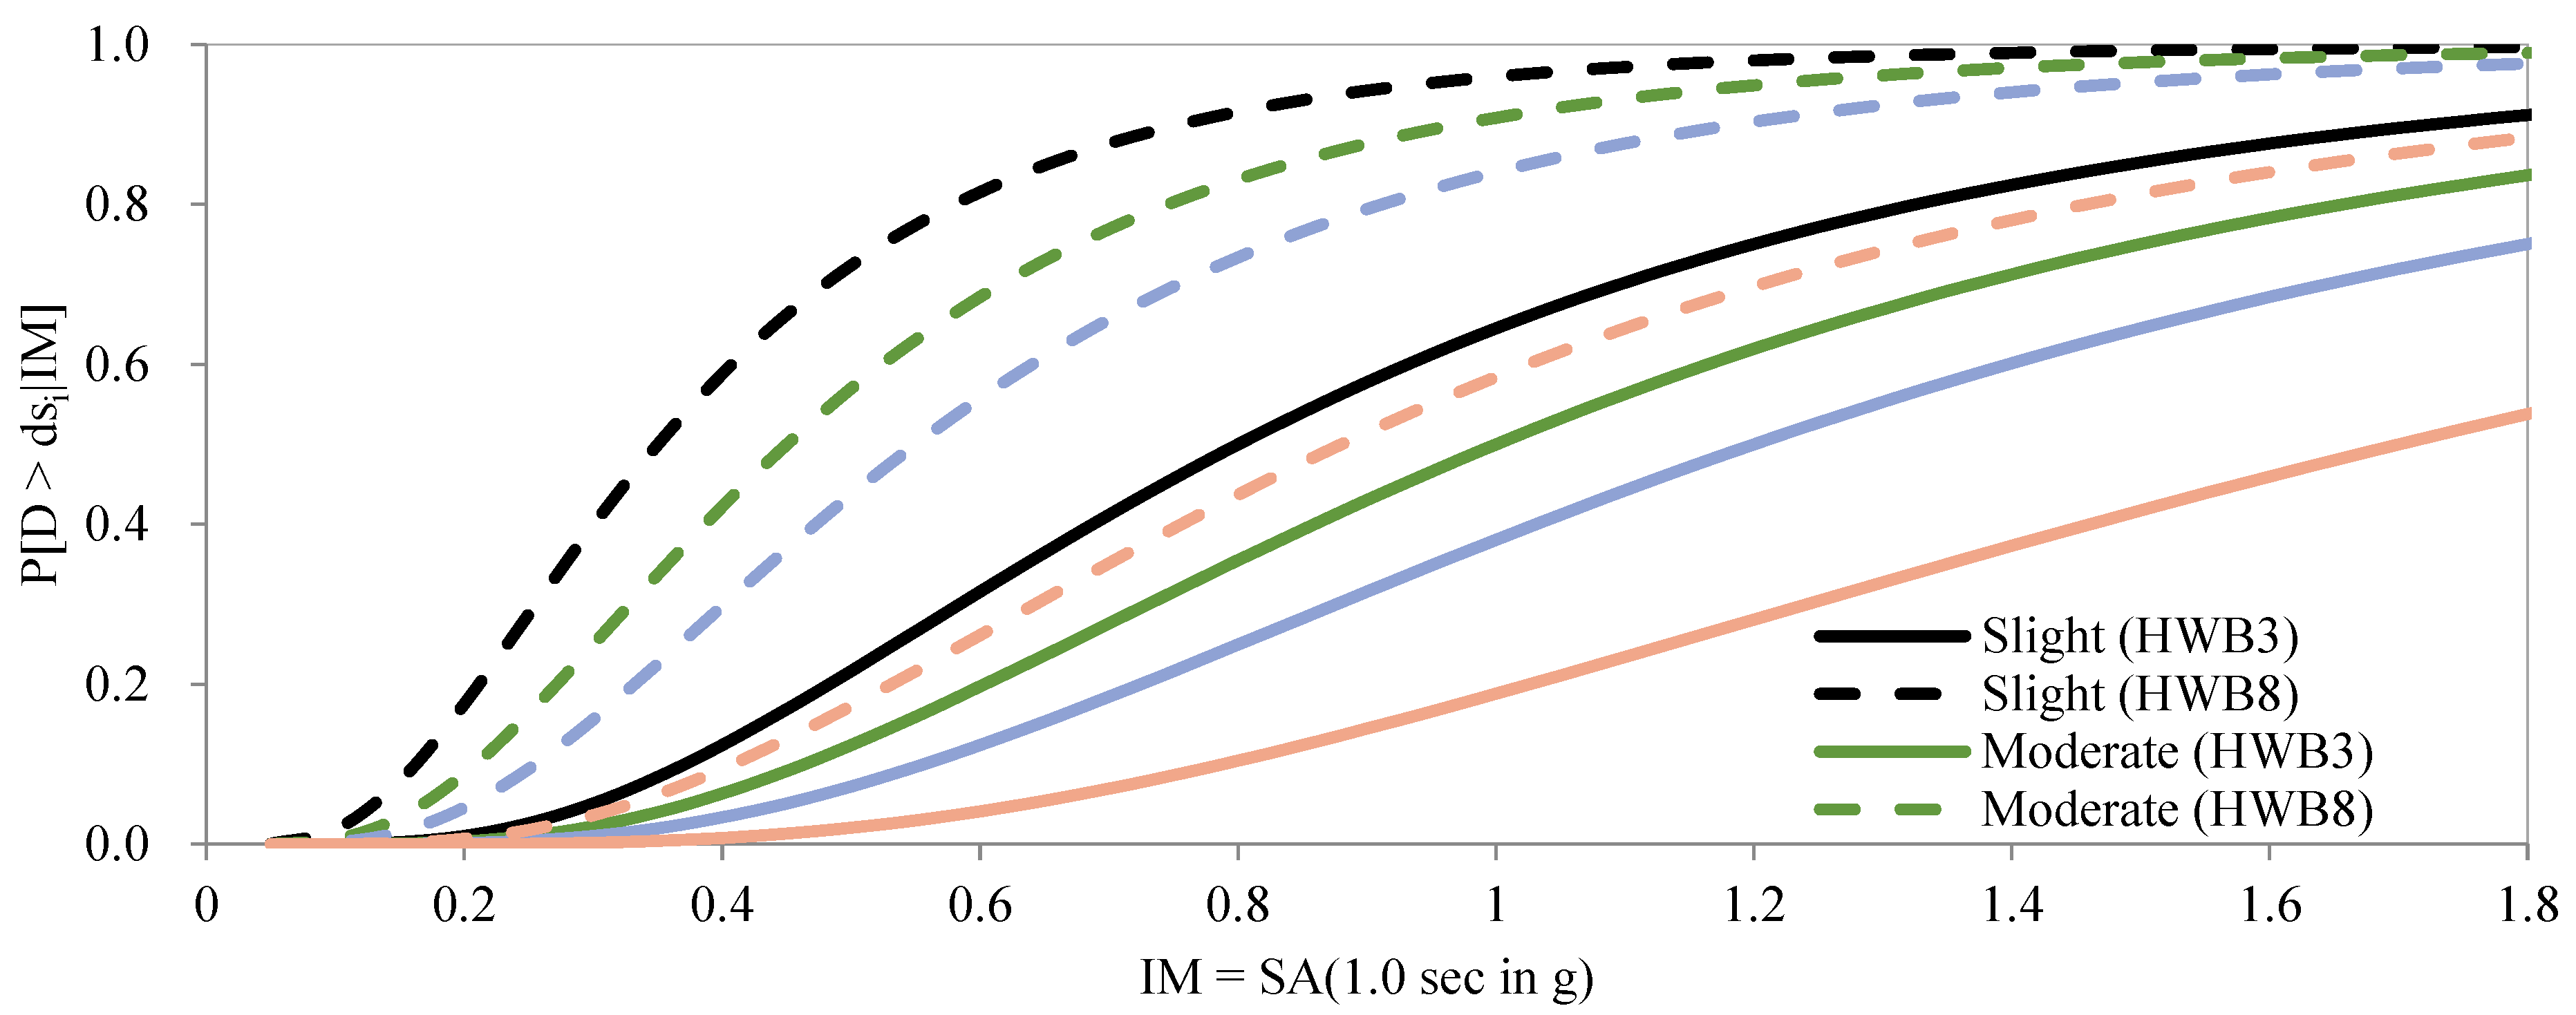
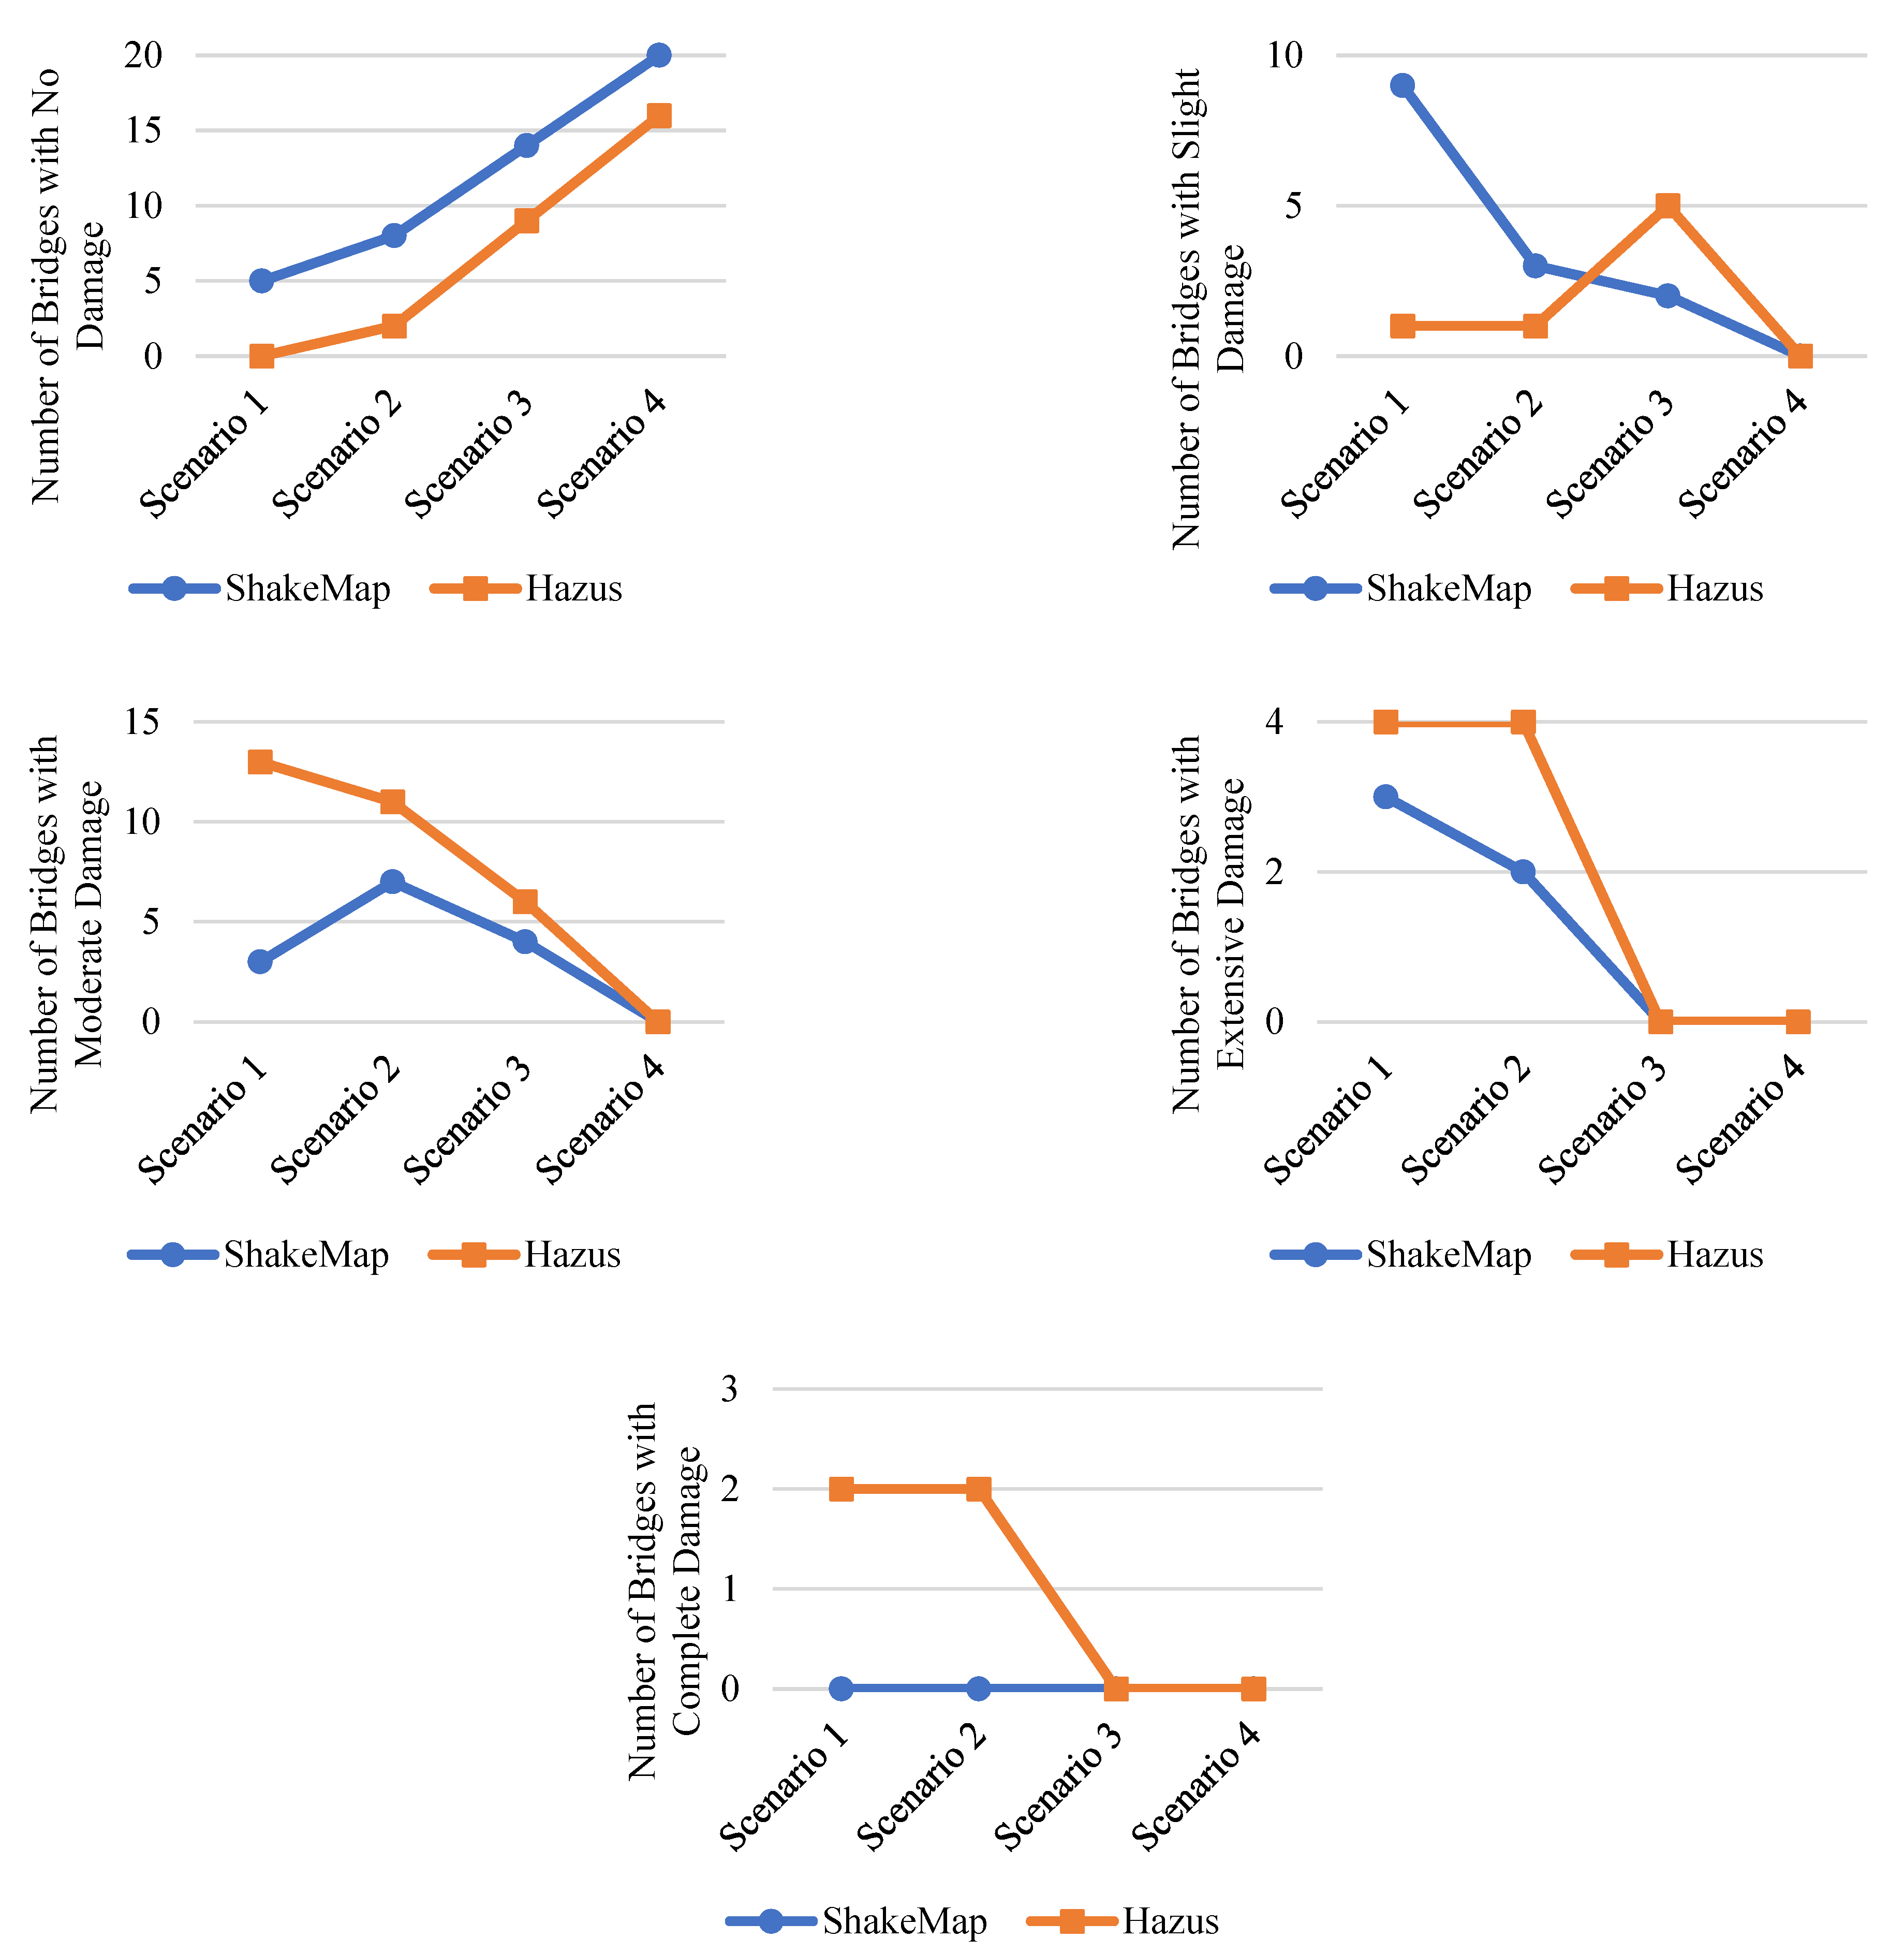

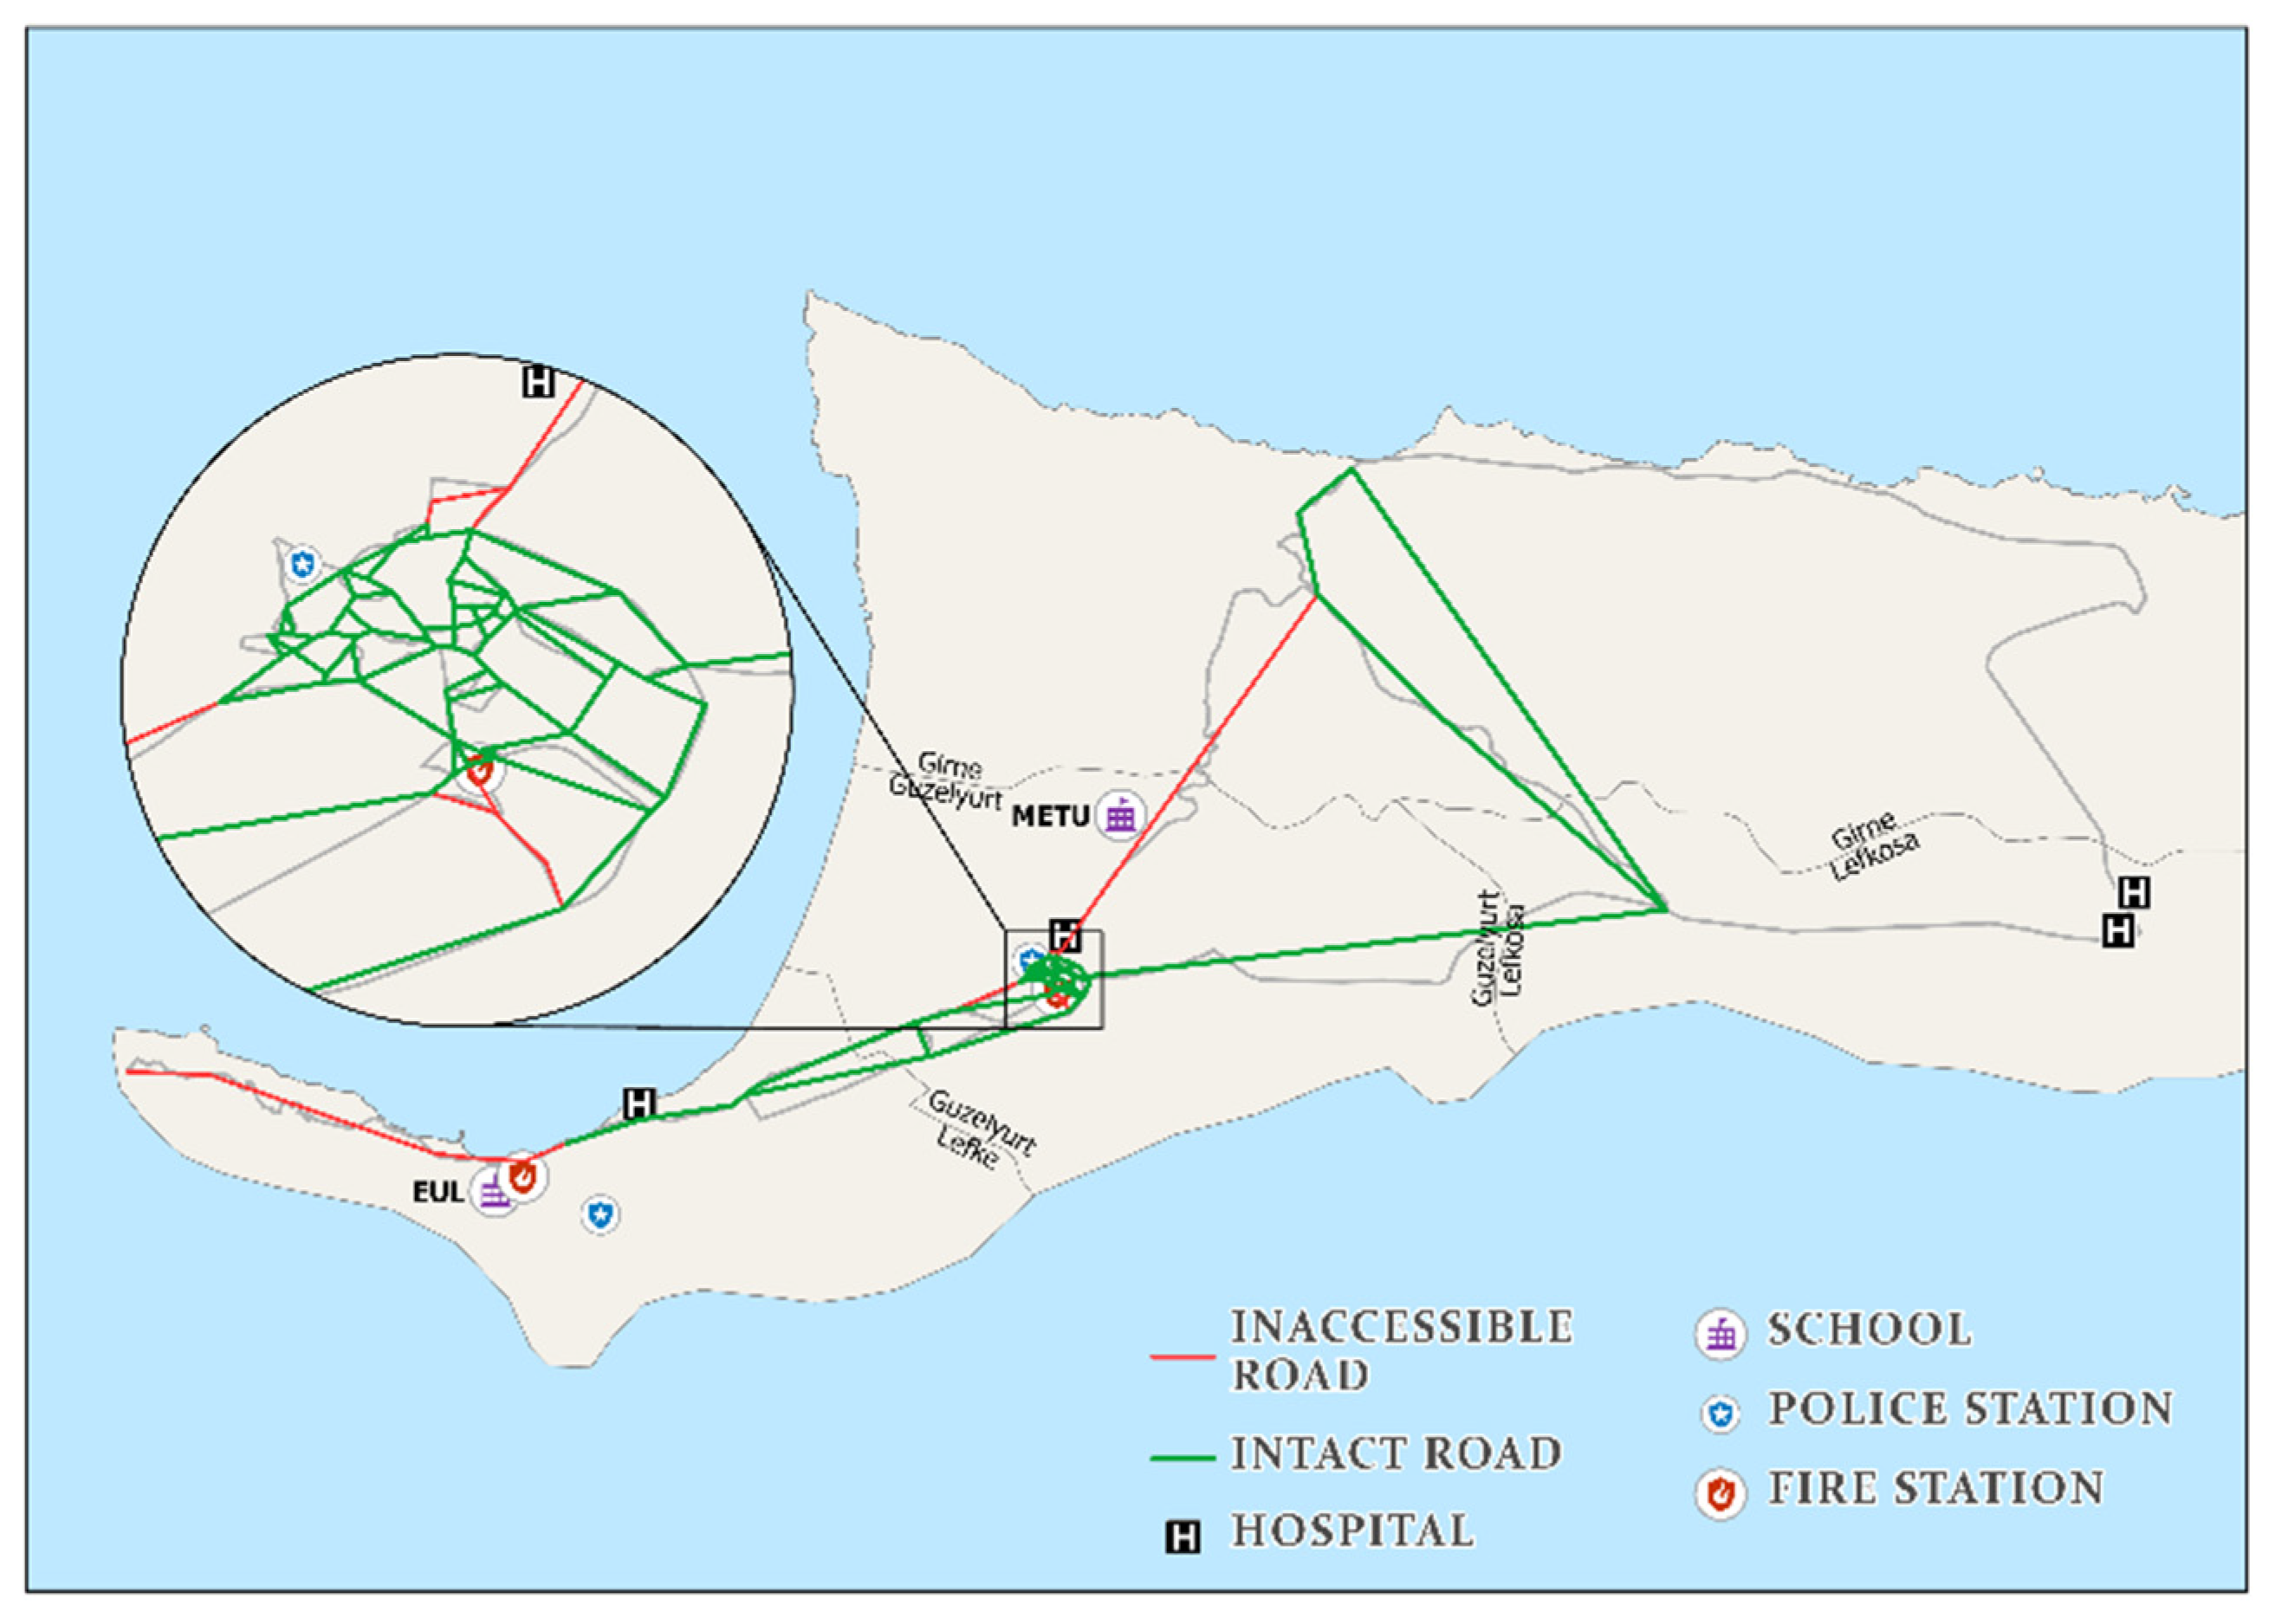

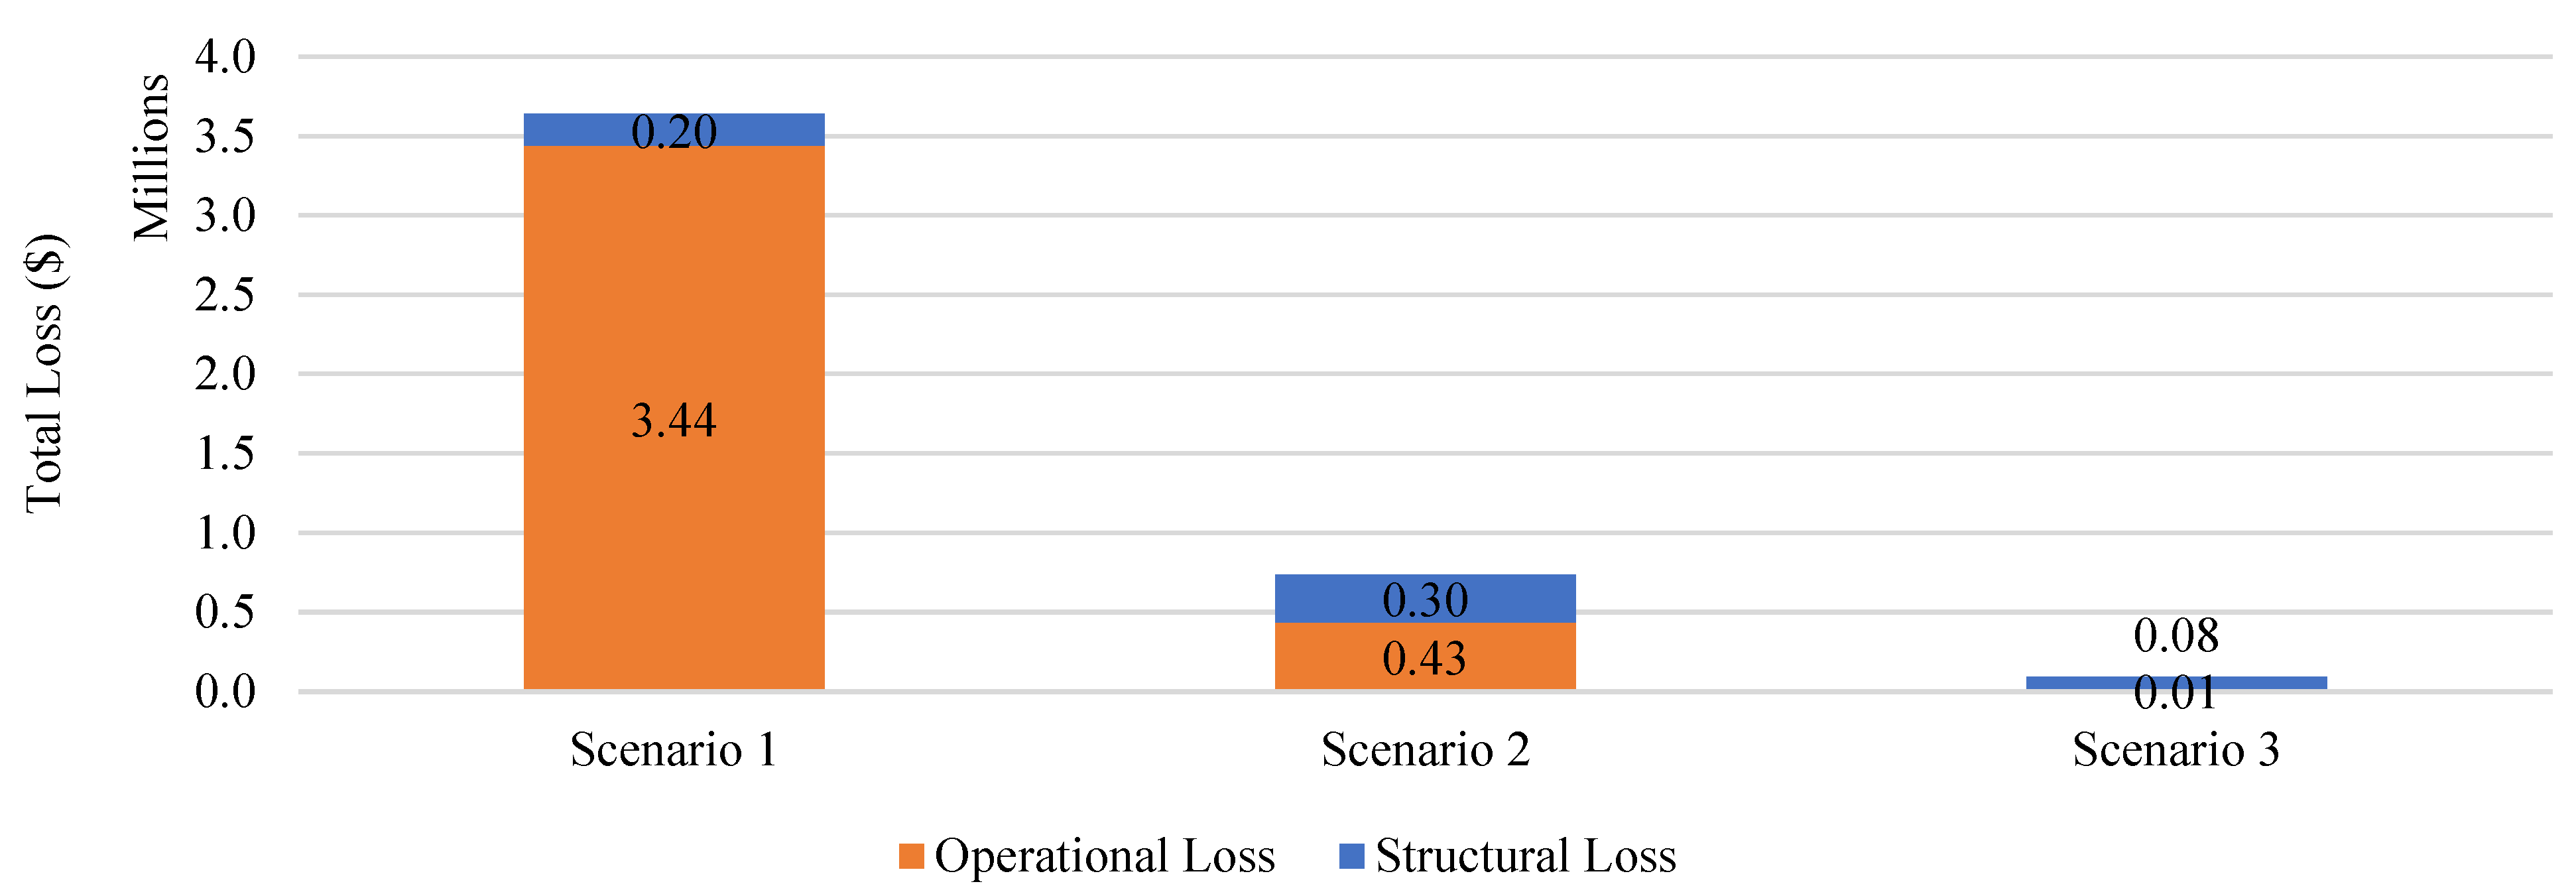


| HAZUS Damage State | Definition |
|---|---|
| : None | - |
| : Slight/Minor Damage | Minor cracking and spalling to the abutment, cracks in shear keys at abutments, minor spalling and cracks at hinges, minor spalling at the column (damage requires no more than cosmetic repair) or minor cracking to the deck. |
| : Moderate Damage | Any column experiencing moderate (shear cracks) cracking and spalling (column structurally still sound), moderate movement of the abutment (<2”), extensive cracking and spalling of shear keys, any connection having cracked shear keys or bent bolts, keeper bar failure without unseating, rocker bearing failure or moderate settlement of the approach. |
| : Extensive Damage | Any column degrading without collapse-shear failure (column structurally unsafe), significant residual movement at connections, or major settlement approach, vertical offset of the abutment, differential settlement at connections, shear key failure at abutments. |
| : Complete Damage | Any column collapsing and/or connection losing all bearing support, which may lead to imminent deck collapse, tilting of substructure due to foundation failure. |
| HAZUS Damage State | Best Estimate Damage Ratio (DR) | Range of Damage Ratios |
|---|---|---|
| None | 0.00 | 0.00 to 0.01 |
| Slight | 0.03 | 0.01 to 0.03 |
| Moderate | 0.08 | 0.03 to 0.15 |
| Extensive | 0.25 | 0.15 to 0.40 |
| Complete | 1.0 if n < 3 2/n if n ≥ 3 n = number of spans | 0.40 to 1.00 |
| Index | Results | Bound |
|---|---|---|
| 47 km | 0 to ∞ | |
| 37 | 0 to ∞ | |
| 0.19 | 0 to 1 | |
| 1.36 | 1 to 3 (2D planer Graph) | |
| 0.47 | 0 to 1 | |
| 0.93 km | 0 to ∞ | |
| 2.64 | 1 to ∞ |
| Bridge | 15-min Counting (veh/0.25 h) | PHV (veh/h) | PHF | AADT (veh/Day) | DDHV (veh/h/L) | |||
|---|---|---|---|---|---|---|---|---|
| 15′ | 30′ | 45′ | 60′ | |||||
| B1 | 89 | 100 | 81 | 103 | 373 | 0.91 | 3108 | 187 |
| B2 | 100 | 110 | 95 | 91 | 396 | 0.90 | 3300 | 198 |
| B3 | Negligible Traffic (Important Link) | - | 0.60 * | 500 * | 30 * | |||
| B4 | 48 | 45 | 34 | 32 | 159 | 0.83 | 1325 | 80 |
| B5 | 69 | 70 | 99 | 73 | 311 | 0.79 | 2592 | 160 |
| B6 | 113 | 145 | 137 | 127 | 522 | 0.90 | 4350 | 261 |
| B7 | 129 | 148 | 111 | 130 | 518 | 0.88 | 4317 | 259 |
| B8 | 101 | 108 | 125 | 115 | 449 | 0.90 | 3742 | 225 |
| B9 | 115 | 128 | 118 | 122 | 483 | 0.94 | 4025 | 242 |
| B10 | 68 | 72 | 61 | 59 | 260 | 0.90 | 2167 | 130 |
| B11 | 58 | 50 | 46 | 42 | 196 | 0.84 | 1633 | 98 |
| B12 | No Traffic | - | - | - | - | |||
| B13 | 80 | 74 | 70 | 81 | 305 | 0.94 | 2542 | 153 |
| B14 | Negligible Traffic | - | 0.60 * | 400 * | 12 * | |||
| B15 | 83 | 97 | 84 | 100 | 364 | 0.91 | 3033 | 182 |
| B16 | 44 | 65 | 35 | 41 | 185 | 0.71 | 1542 | 93 |
| B17 | 80 | 74 | 69 | 70 | 293 | 0.92 | 2442 | 147 |
| B18 | 71 | 82 | 65 | 75 | 293 | 0.89 | 2442 | 147 |
| B19 | 66 | 69 | 72 | 59 | 266 | 0.92 | 2217 | 133 |
| B20 | No Traffic | - | - | - | - | |||
| Highway Bridge Id (HAZUS) | Bridge Index Label | Bridge Class | Lat. | Long. | Num Spans | Max Span Length (m) | Length (m) | Width (m) | Skew Angle (°) | Pier Type | Abutment Type | Span Continuity | Material |
|---|---|---|---|---|---|---|---|---|---|---|---|---|---|
| KK000001 | B9 | HWB8 | 35.142 | 32.835 | 3 | 9 | 28 | 7 | 0 | PW | R | C | RC |
| KK000002 | B10 | HWB3 | 35.142 | 32.819 | 1 | 4 | 4 | 9 | 27 | - | S | C | RC |
| KK000003 | B20 | HWB28 | 35.142 | 32.819 | 1 | 3 | 3 | 4 | 0 | - | S | C | RC |
| KK000004 | B11 | HWB8 | 35.144 | 32.808 | 2 | 6 | 17 | 9 | 27 | PW | R | C | RC |
| KK000005 | B8 | HWB15 | 35.147 | 32.848 | 2 | 10 | 20 | 7 | 0 | PW | S | SS | Steel |
| KK000006 | B7 | HWB28 | 35.154 | 32.870 | 2 | 8 | 13 | 7 | 0 | PW | S | C | RC |
| KK000007 | B6 | HWB3 | 35.158 | 32.898 | 1 | 6 | 12 | 7 | 0 | PW | R | C | RC |
| KK000008 | B5 | HWB28 | 35.164 | 32.905 | 9 | 9 | 65 | 8 | 0 | PW | R | D | Masonry |
| KK000009 | B12 | HWB28 | 35.168 | 32.740 | 3 | 8 | 50 | 9 | 17 | PW | R | - | RC |
| KK000010 | B4 | HWB3 | 35.188 | 32.966 | 1 | 3.5 | 4.3 | 9 | 0 | - | R | C | RC |
| KK000011 | B15 | HWB3 | 35.189 | 32.999 | 1 | 5 | 5 | 7.2 | 50 | - | S | C | RC |
| KK000012 | B14 | HWB3 | 35.190 | 32.996 | 1 | 5 | 5 | 11 | 40 | - | R | C | RC |
| KK000013 | B13 | HWB8 | 35.191 | 32.996 | 2 | 4 | 8 | 12 | 31 | PW | R | SS | RC |
| KK000014 | B2 | HWB8 | 35.204 | 32.996 | 10 | 10 | 101 | 11.5 | 0 | PW | R | SS | RC |
| KK000015 | B3 | HWB8 | 35.204 | 32.994 | 8 | 3 | 26 | 13 | 20 | PW | R | C | RC |
| KK000016 | B1 | HWB8 | 35.217 | 33.006 | 2 | 6 | 13 | 10 | 0 | PW | R | SS | RC |
| KK000017 | B16 | HWB28 | 35.337 | 33.069 | 1 | 5 | 5 | 9 | 0 | - | R | C | RC |
| KK000018 | B17 | HWB28 | 35.338 | 33.069 | 1 | 6 | 6 | 8 | 0 | - | R | C | RC |
| KK000019 | B18 | HWB3 | 35.339 | 33.071 | 1 | 6 | 6 | 8 | 36 | - | R | C | RC |
| KK000020 | B19 | HWB3 | 35.350 | 33.085 | 1 | 5 | 6 | 8 | 34 | - | R | C | RC |
| Parameters | ShakeMap DSHA and HAZUS Arbitrary Event | ShakeMap | ||
|---|---|---|---|---|
| Scenario 1 | Scenario 2 | Scenario 3 | Scenario 4 | |
| District | Lefke | Guzelyurt | Girne | Guzelyurt |
| Coordinate | 35.121, 32.809 | 35.202, 32.976 | 35.330, 33.033 | 35.202, 32.976 |
| Magnitude | 7.4 | 7.0 | 6.5 | 5.5 |
| Bridge ID Number | Overall Damage | |||||||
|---|---|---|---|---|---|---|---|---|
| None | Slight | Moderate | Extensive | Complete | Mean Damage State | |||
| KK000001 | 0.321 | 0.161 | 0.132 | 0.206 | 0.181 | 0.188 | 0.219 | Extensive |
| KK000002 | 0.913 | 0.036 | 0.025 | 0.02 | 0.006 | 0.014 | 0.084 | Slight |
| KK000003 | 0.913 | 0.045 | 0.021 | 0.016 | 0.005 | 0.012 | 0.077 | Slight |
| KK000004 | 0.448 | 0.128 | 0.125 | 0.174 | 0.125 | 0.182 | 0.298 | Extensive |
| KK000005 | 0.939 | 0 | 0 | 0.047 | 0.015 | 0.027 | 0.129 | Slight |
| KK000006 | 0.893 | 0.054 | 0.026 | 0.021 | 0.006 | 0.015 | 0.084 | Slight |
| KK000007 | 0.856 | 0.068 | 0.035 | 0.031 | 0.01 | 0.023 | 0.106 | Slight |
| KK000008 | 0.854 | 0.069 | 0.035 | 0.031 | 0.011 | 0.015 | 0.048 | Slight |
| KK000009 | 0.94 | 0.031 | 0.015 | 0.011 | 0.003 | 0.007 | 0.045 | None |
| KK000010 | 0.906 | 0.048 | 0.022 | 0.018 | 0.005 | 0.013 | 0.077 | Slight |
| KK000011 | 0.922 | 0.001 | 0.035 | 0.032 | 0.011 | 0.022 | 0.111 | Slight |
| KK000012 | 0.922 | 0.02 | 0.028 | 0.024 | 0.007 | 0.016 | 0.091 | Slight |
| KK000013 | 0.516 | 0.113 | 0.117 | 0.154 | 0.099 | 0.150 | 0.274 | Extensive |
| KK000014 | 0.52 | 0.16 | 0.109 | 0.134 | 0.077 | 0.062 | 0.080 | Moderate |
| KK000015 | 0.527 | 0.141 | 0.111 | 0.139 | 0.082 | 0.068 | 0.087 | Moderate |
| KK000016 | 0.541 | 0.158 | 0.105 | 0.127 | 0.07 | 0.115 | 0.242 | Moderate |
| KK000017 | 0.996 | 0.003 | 0.001 | 0 | 0 | 0.000 | 0.003 | None |
| KK000018 | 0.993 | 0.005 | 0.001 | 0.001 | 0 | 0.000 | 0.009 | None |
| KK000019 | 0.993 | 0.003 | 0.002 | 0.001 | 0 | 0.001 | 0.009 | None |
| KK000020 | 0.998 | 0.001 | 0.001 | 0 | 0 | 0.000 | 0.003 | None |
| Bridge Type | None Damage State | Slight Damage State | ||||||
|---|---|---|---|---|---|---|---|---|
| Scenario 1 | Scenario 2 | Scenario 3 | Scenario 4 | Scenario 1 | Scenario 2 | Scenario 3 | Scenario 4 | |
| HWB3 | 2 | 3 | 7 | 8 | 5 | 1 | 1 | 0 |
| HWB8 | 0 | 0 | 1 | 5 | 0 | 0 | 0 | 0 |
| HWB15 | 0 | 0 | 1 | 1 | 1 | 1 | 0 | 0 |
| HWB28 | 3 | 5 | 5 | 6 | 3 | 1 | 1 | 0 |
| Total | 5 | 8 | 14 | 20 | 9 | 3 | 2 | 0 |
| Bridge Type | Moderate Damage State | Extensive Damage State | ||||||
| Scenario 1 | Scenario 2 | Scenario 3 | Scenario 4 | Scenario 1 | Scenario 2 | Scenario 3 | Scenario 4 | |
| HWB3 | 0 | 4 | 0 | 0 | 1 | 0 | 0 | 0 |
| HWB8 | 3 | 3 | 4 | 0 | 2 | 2 | 0 | 0 |
| HWB15 | 0 | 0 | 0 | 0 | 0 | 0 | 0 | 0 |
| HWB28 | 0 | 0 | 0 | 0 | 0 | 0 | 0 | 0 |
| Total | 3 | 7 | 4 | 0 | 3 | 2 | 0 | 0 |
| Bridge Class | Unit Area Replacement Cost ($/m2) |
|---|---|
| HWB3 | 850 |
| HWB8 | 960 |
| HWB15 | 1140 |
| HWB28 | 800 |
| Damage State | Days to Restore 100% Functionality (Days) | |
|---|---|---|
| Mean | Standard Deviation | |
| Slight | 0.6 | 0.6 |
| Moderate | 2.5 | 2.7 |
| Extensive | 75 | 42 |
| Complete | 230 | 110 |
| Index | Before | Scenario 1 | Scenario 2 | Scenario 3 | Scenario 4 |
|---|---|---|---|---|---|
| After (% Change) | After (% Change) | After (% Change) | After (% Change) | ||
| V | 98 | 90 (−8) | 86 (−12) | 93 (−5) | No Change |
| E | 134 | 121 (−10) | 117 (−13) | 126 (−6) | |
| L | 124 km | 99 km (−20) | 96 km (−23) | 109 km (−12) | |
| 47 km | 48 km (2) | 49 km (4) | 62 km (32) | ||
| 37 | 33 (−11) | 32 (−14) | 34 (−8) | ||
| 0.19 | 0.19 (0) | 0.19 (0) | 0.19 (0) | ||
| 1.36 | 1.36 (0) | 1.36 (0) | 1.35 (−1) | ||
| 0.47 | 0.46 (−2) | 0.46 (−2) | 0.46 (−2) | ||
| 0.93 km | 0.81 km (−13) | 0.82 km (−12) | 0.87 km (−6) | ||
| 2.64 | 2.1 (−20) | 1.95 (−26) | 1.75 (−34) |
| Index | Before | Scenario 1 | Scenario 2 | Scenario 3 | Scenario 4 |
|---|---|---|---|---|---|
| After (% Change) | After (% Change) | After (% Change) | After (% Change) | ||
| 4 | 4 (0) | 4 (0) | 4 (0) | No Change | |
| 2.73 | 2.75 (1) | 2.76 (1) | 2.71 (−1) | ||
| 1141 | 885 (−22) | 943 (−17) | 1017 (−11) | ||
| 428 | 340 (−20) | 333 (−22) | 397 (−7) | ||
| 904 | 703 (−22) | 694 (−23) | 842 (−7) | ||
| 284 | 222 (−22) | 217 (−24) | 266 (−6) | ||
| 13 | 13 (0) | 13 (0) | 13 (0) | ||
| 0.72 | 0.77 (7) | 0.71 (−1) | 0.7 (−3) | ||
| 24 | 23 (−3) | 23 (−4) | 23 (−3) | ||
| 12.9 | 13.1 (3) | 13.1 (2) | 12.6 (−2) | ||
| 2.77 | 2.33 (3) | 2.92 (29) | 2.33 (3) | ||
| 0.2 | 0.23 (15) | 0.23 (15) | 0.21 (5) |
| Damage State | Residual Capacity (%) | Free-Flow Speed (%) |
|---|---|---|
| None | 100 | 100 |
| Slight | 100 | 100 |
| Moderate | 50 | 50 |
| Extensive | 25 | 50 |
| Complete | 0 | 0 |
| Scenario No: | Total Travel Time (h) | Average Travel Time (min) | Total Travel Time Loss (h) |
|---|---|---|---|
| Base | 9248 | 29.02 | - |
| 1 | 12698 | 39.87 | 3450 |
| 2 | 9782 | 30.71 | 540 |
| 3 | 9368 | 29.41 | 126 |
| 4 | Same as base | ||
Publisher’s Note: MDPI stays neutral with regard to jurisdictional claims in published maps and institutional affiliations. |
© 2022 by the authors. Licensee MDPI, Basel, Switzerland. This article is an open access article distributed under the terms and conditions of the Creative Commons Attribution (CC BY) license (https://creativecommons.org/licenses/by/4.0/).
Share and Cite
Malekloo, A.; Ozer, E.; Ramadan, W. Bridge Network Seismic Risk Assessment Using ShakeMap/HAZUS with Dynamic Traffic Modeling. Infrastructures 2022, 7, 131. https://doi.org/10.3390/infrastructures7100131
Malekloo A, Ozer E, Ramadan W. Bridge Network Seismic Risk Assessment Using ShakeMap/HAZUS with Dynamic Traffic Modeling. Infrastructures. 2022; 7(10):131. https://doi.org/10.3390/infrastructures7100131
Chicago/Turabian StyleMalekloo, Arman, Ekin Ozer, and Wasim Ramadan. 2022. "Bridge Network Seismic Risk Assessment Using ShakeMap/HAZUS with Dynamic Traffic Modeling" Infrastructures 7, no. 10: 131. https://doi.org/10.3390/infrastructures7100131
APA StyleMalekloo, A., Ozer, E., & Ramadan, W. (2022). Bridge Network Seismic Risk Assessment Using ShakeMap/HAZUS with Dynamic Traffic Modeling. Infrastructures, 7(10), 131. https://doi.org/10.3390/infrastructures7100131


