Abstract
Previous studies have addressed railway turnouts (switches and crossings), but research on the performance of 1000 mm gauge turnouts is limited. At present, wooden sleeper structures are used at turnouts in Vietnam. However, these structures have many disadvantages in the operation process. This paper evaluates the performance of new prestressed bearer (PSB) for turnouts, designed for the 1000 mm gauge, to overcome the disadvantages of a wooden sleeper. Test samples of PSB were manufactured in the factory, and experiments were conducted in the laboratory according to European Standards to evaluate the PSB carrying capacity. The test results show that the proposed structure meets the carrying capacity under the standard test loads. In addition, the results of the static and fatigue tests of the bearers show a considerable reserve in the cross-section capacity. This means that the existing reserve can be used with a larger locomotive axle, and the bearer design can be optimized by arranging the prestressed strands and changing the bearer cross-section’s geometric dimensions. It is hoped that the proposed bearer design will be a viable alternative for designing railway turnouts.
1. Introduction
Bearers are one of the essential parts of turnouts (switches and crossings). Wooden sleepers were designed and manufactured for first-generation turnouts in high-speed railways in France. Then, the next generation used monoblock prestressed concrete sleepers at turnouts. Turnouts in Germany are mainly made of hinged concrete for high-speed railways, resulting in tracks with turnout slabs. Chinese turnouts use prestressed long concrete sleepers for high-speed railways. Embedded turnouts and turnout slabs are also used in China [1,2,3].
Some studies on turnouts have been conducted around the world. In 1998, Andersson and Dahlberg [4] studied the vertical dynamics of Swedish railway turnouts under a load of moving vehicles. The rails and sleepers were modelled with uniform Rayleigh–Timoshenko beam elements. The dynamic behaviour of the trains comprised discrete systems of masses, springs and dampers. The wheel–rail contact was modelled by using a non-linear Hertzian spring. In 2006, Kassa et al. [5] studied the dynamic interaction between train and railway turnout. Two alternative multi-body system models of the dynamic interaction between a train and a standard turnout design were developed. The first model was derived using commercial MBS software. The second model was based on a multi-body dynamic formulation, which could account for the structural flexibility of train and track components. In 2008, Kassa and Nielsen [6] conducted a stochastic analysis of the dynamic interaction between train and railway turnout. The analysis methods were integrated with a simulation model of the dynamic interaction between the train and the turnout. The influence of the input parameters’ random distributions on the statistical outputs of the wheel–rail contact forces, wear, and rolling contact fatigue was assessed using Latin hypercube sampling to generate several stochastic load realisations.
In 2009, Kassa and Nielsen [7] studied dynamic train–turnout interaction in an extended frequency range using a detailed model of the track dynamics. A time-domain solution method was proposed for the general three-dimensional dynamic interaction of the train and the turnout (switch and crossing) that accounted for excitation in an extended frequency range (up to several hundred Hz). In 2010, Rong-shan et al. [8] studied the longitudinal force computation theory and conducted experiments on a welded turnout on a bridge. A turnout–bridge–platform integration computation model was established, and the model was solved via the finite element method according to the characteristics of the force and displacement of the welded turnout on the bridge. Wang et al. [9] studied the law of wheel-set lateral displacement when a train passes a turnout at high speed. A wheel-set lateral displacement test system was developed using laser displacement sensors and a corresponding digital data collection system. The test system was verified through a field test focusing on turnout No. 18 of the Hefei–Nanjing high-speed railway in China. In 2013, Xu et al. [10] used a lateral force calculation model for switching and locking devices to optimise the design of a high-speed switching and locking device. The authors adopted a wheel–rail system with coupled dynamics using the finite element method. In 2017, Gao et al. [11] evaluated the compressive stress distribution in prestressed concrete and its effect on railroad crosstie design. A parametric study using three-dimensional (3D) finite-element modelling and laboratory experiments was performed to investigate the stress distribution below the rail seat and quantify the corresponding distribution angles in the prestressed concrete crosstie under static wheel loading. In 2018, Blanco-Saura et al. [12] studied the dynamic vehicle–track interaction in a railway turnout. The authors analysed the vertical dynamic response of a railway track subjected to traffic loads at a turnout, especially around the switch blades and the crossing nose. A numerical feedback interaction between a multi-body model of the vehicle and a 3D finite element model of the track was conducted to evaluate the effect of vehicle and track parameters on the vehicle–track dynamics. In 2020, Silva et al. [13] conducted experimental and numerical analyses of failure in prestressed concrete railway sleepers. The authors assessed the load-carrying capacity of prestressed concrete sleepers according to Brazilian and AREMA standards. A numerical study was carried out to evaluate the prestressed concrete sleepers’ load-carrying capacity using ABAQUS software.
Currently, prestressed concrete sleepers are commonly used worldwide [14]. However, due to historical characteristics in Vietnam, there are still many traditional 1000 mm gauge turnouts using wooden sleepers. Wooden sleepers have the disadvantages of easily rotting, short use time, monolithic wood, being easy to crack along the wood fiber, insufficient bearing capacity, and high cost.
A literature review shows that research studies on the performance of prestressed bearer structures for railway turnouts (1000 mm gauge) are lacking. Therefore, this paper proposes a new prestressed bearer structure for railway turnouts for implementation in Vietnam. The proposed bearer overcomes the disadvantages of the traditional wooden sleeper structures currently used in the country. The study methodology is shown in Figure 1. The study involves six tasks: (1) conduct a literature review, (2) develop the proposed bearer structure, (3) prepare test samples and determine design load, (4) conduct laboratory tests, (5) analyse test results, and (6) make recommendations about the carrying capacity of prestressed bearers for railway turnouts using the arrangement of prestressed strands and laboratory testing.
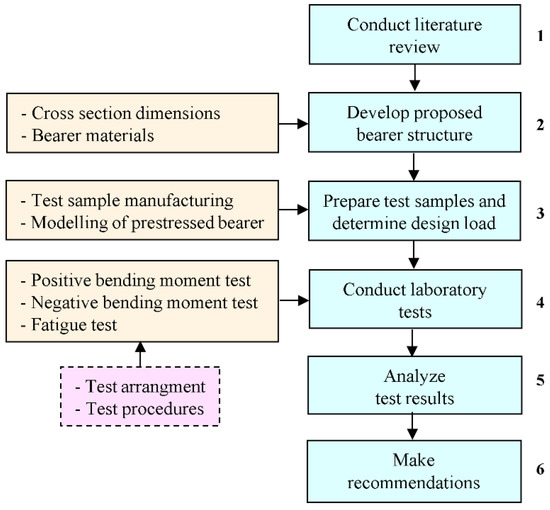
Figure 1.
Study methodology.
2. Proposed Bearer Structure
2.1. Cross-Section Dimensions
The cross-section of the prestressed bearer for turnouts is a rectangular section with 16 strands that are set apart, as shown in Figure 2. The cross-section is uniform throughout the bearer.
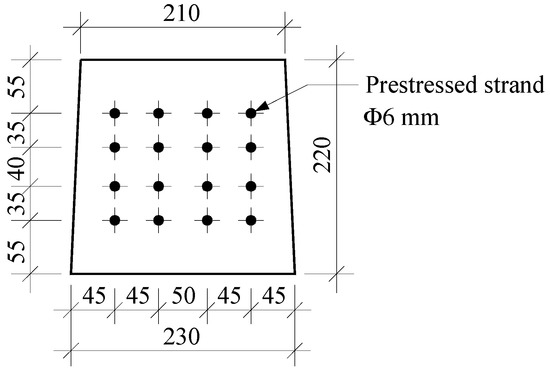
Figure 2.
Cross-section of the bearer (dimensions are in millimetres).
The total strand area, Ap, is given by
where n = number of strands and Aps = area of a single strand.
Ap = n.Aps,
The modulus of elasticity ratio of strand to concrete, ne, is given by
where Ep = modulus of elasticity of strand and Ecm = modulus of elasticity of concrete.
ne = Ep/Ecm,
The transformed area, At, is given by
where Ac = area of the concrete section.
At = Ac + (ne − 1).Ap,
The first moment about the bottom wire, St, is given by
where yc and yp = distances from the bearer bottom to the center of gravity of the concrete and the prestressed strands, respectively.
St = Ac.yc + (ne − 1).Ap.yp,
The distance of the centroidal axis of the transformed area from the bottom of bearer, yt, is given by (see Figure 3)
yt = St/At,
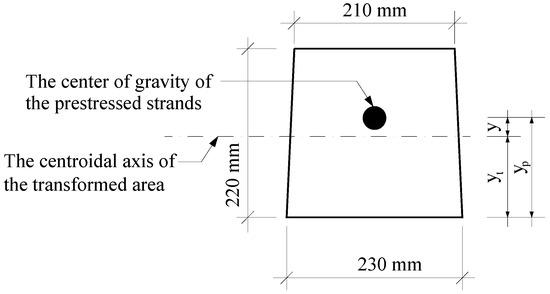
Figure 3.
Eccentricity of the centroid of the prestressed force of the bearer.
The eccentricity of the centroid of the prestressed force, y, is given by
y = yp − yt,
Using Equations (1)–(6), the respective parameters are calculated as Ap = 452 mm2, ne = 5.69, At = 50,524 mm2, St = 5,476,942 mm3, yt = 108.4 mm, and y = 1.6 mm. The dimensions of all variables for the cross-section are shown in Table 1.

Table 1.
Variables and dimensions of the bearer cross-section.
2.2. Bearer Materials
The properties of the bearer materials of the prestressed samples are presented in Standard JIS E 1201 [15] and UIC CODE 713 R [16]. The concrete and strand properties are shown in Table 2. The concrete properties include class, average compressive strength, and modulus elasticity. The strand properties include diameter, tensile strength, 0.1% absorption, and modulus of elasticity.
Table 2.
Material properties.
3. Test Sample Preparation and Design Load
3.1. Test Sample Manufacturing
The PSB test samples were manufactured in the factory of Construction Joint Stock Company No.6, Hanoi, Vietnam. A total of 35 prestressed bearers with lengths from 1.8 m to 3.4 m were manufactured for a set of turnouts for narrow gauge, as shown in Table 3.
Table 3.
Number of PSB for a set of turnouts for 1000 mm gauge.
The manufacturing sequence included the following steps [17]: (a) preparing the molds, (b) putting the hydraulic jack with anchors into a working position, (c) spreading the strands, (d) pre-tensioning of the strands, (e) producing the concrete and transporting it to the molds, (f) concreting into the molds, (g) compacting and curing the concrete, (h) removing the tension force and cutting the strands, and (i) removing the molds.
The manufacturing of the PSB samples in the factory is shown in Figure 4, and the produced samples are shown in Figure 5. The details of these activities follow:
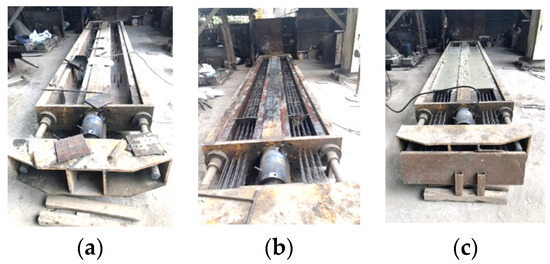
Figure 4.
Manufacturing of the PSB samples in the factory. (a) Preparing the molds; (b) Pre-tensioning of the strands; (c) Concreting into the molds.
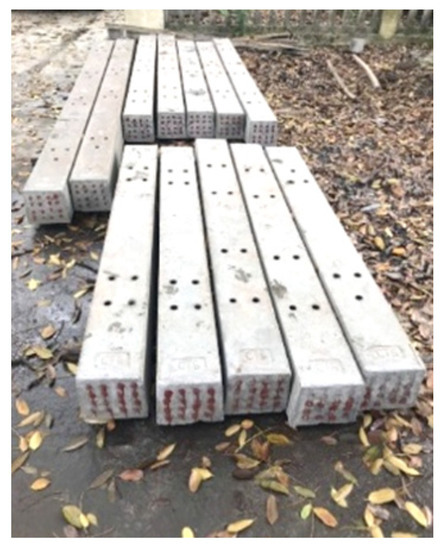
Figure 5.
Produced samples of PSB.
- The initial stage of bearer production was to create the ready molds. Steel molds were used in the casting of the bearers. The molds were made following the bearers’ shape and size requirements. The bearers were cast in steel molds that could be changed in length by the steel plates at both ends. First, the ready molds used for the casting of concrete were cleaned. Then, lubrication was performed on the inner sides of the molds to reduce or avoid sticky action of the concrete toward the molds.
- After cleaning and lubricating the molds, the strands were cut into the required shape and inserted into the molds. These strands were fixed at both ends using anchors. Then, the strands were tensioned with P0 = 530 kN using a hydraulic jack, and the anchors were tightened.
- The concrete was premixed and poured into the molds. Then, needle vibrators were used to compact the concrete properly and fill the required shape with an even mix distribution. When the concrete filled and began to overflow onto the mold’s surface, a table vibrator compactor was used to flatten the surface.
- After the completion of concrete casting, the molds with concrete were cured naturally for about 16–20 h. When the concrete reached the strength of 30.1 N/mm2, the tension force was removed, and the strands were cut. Then, the molds were carefully removed using machinery. The molds can be reused for manufacturing purposes. After being checked to ensure quality, the production samples were transferred to the yard with a 3-ton forklift.
3.2. Modelling of Narrow Prestressed Bearers
The design train load, also known as the dynamic support point force, is the force acting on the bearer that produces the design moment. In bending moment tests, the concrete bearer must withstand the design moment without forming cracks. The design train load configuration is shown in Figure 6. The dynamic rail seat load was calculated based on [18] as
where kp = 0.89, kv = 0.25, kd = 0.49, and kr = 1.35.
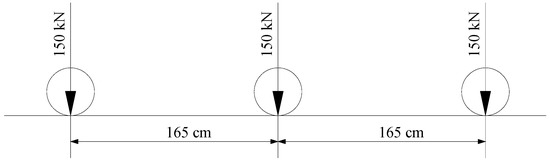
Figure 6.
Design train load.
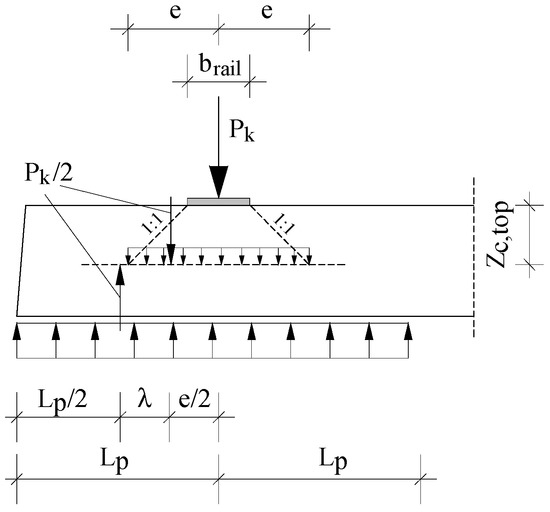
Figure 7.
Model of the load distribution in the bearer at the rail seat.
The load distribution in the bearer under the rail seat is given by
where brail = width of the rail foot (11.4 cm) and zc,top = distance from the inertia axis to the top surface of the bearer (11.16 cm). The length Lp is given by
where L = bearer length (200 cm) and c = rail seat centre spacing (107 cm).
The lever length of the resulting internal forces, λ, is given by:
The negative bending moments at the rail support and midspan section of the bearer are given by
where ki,c = 1.6.
The negative bending moment Mc,neg for a bearer is given by
The positive bending moment at the midspan of the bearer is given by
Using Equations (7)–(15), the respective parameters are calculated as Pk = 60.82 kN, Mk,r,pos = 721.12 kNcm, e = 16.86 cm, Lp = 46.50 cm, λ = 14.82 cm, Mk,r,neg = 504.79 kNcm, Mk,c,neg = 340.61 kNcm, Mc,neg = 212.88 kNcm, and Mk,c,pos = 340.61 kNcm.
4. Laboratory Testing
The bearers were tested in the Structures Laboratory at the University of Transport and Communications, Hanoi, Vietnam. The experiments involved three tests: a positive bending moment test, a negative bending moment test, and a fatigue test.
4.1. Test Arrangement
The arrangement for the static load tests of the positive and negative bending moments and the fatigue test is shown in Figure 8. For the positive bending moment, the test load was Fb, and the tests were conducted on two bearers (called PSB1 and PSB2). For the negative bending moment, the test load was Fbn, and the tests were conducted on two bearers (PSB3 and PSB4). For the fatigue test, the test load was Fb, and the test was conducted on one bearer (PSB5).
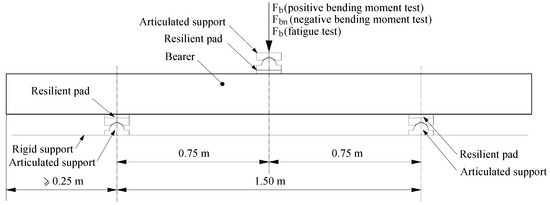
Figure 8.
Test arrangement for the positive and negative bending moment tests and fatigue test.
4.2. Test Procedures
4.2.1. Positive Bending Moment Test
The static test procedure is shown in Figure 9 for the positive bending moment. The factor kt1 is given by
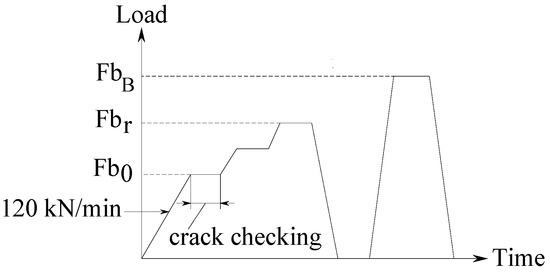
Figure 9.
Static test procedure for design approval test for the positive bending moment.
The positive bending moment after 28 days is given by
where fct,fl,t=28 days = 5.5 Mpa, fct,fl,fat = 3.0 Mpa, = 194.27 Mpa, = 68.15 Mpa, and Wc,bot = 1,887,780 mm3. The prestress losses in the concrete were calculated according to Eurocode 2 [19].
The acceptance criteria are (a) Fbr > kt1·Fb0 and (b) FbB > kb·Fb0, where kb is the impact coefficient for the positive static test, which is given by
Using Equations (16)–(19), the respective parameters are calculated as Fb0 = 20.60 kN, kt1 = 1.03, kt1·Fb0 = 21.30 kN, Mt,r,pos = 745.41 MPa, kb = 2.54, and kb·Fb0 = 52.41 kN.
4.2.2. Negative Bending Moment Test
The static test procedure is shown in Figure 10 for the negative bending moment.
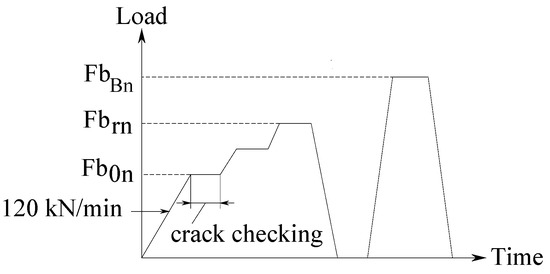
Figure 10.
Static test procedure for design approval test for the negative bending moments.
The factor kt2 is given by
The negative testing bending moment after 28 days is given by
where Wc,top is the modulus for the top (1,833,760 mm3).
The acceptance criteria are: (a) Fbrn > kt2·Fb0n and (b) FbBn > kbn·Fb0n, where kbn is the impact coefficient for the negative static test, which is given by
Using Equations (20)–(23), the respective parameters are calculated as Fb0n = 9.73 kN, kt2 = 1.07, kt2·Fb0n = 10.41 kN, Mt,c,neg = 364.19 MPa, kbn = 2.54, and kbn·Fb0n = 24.76 kN.
4.2.3. Fatigue Test
The maximum load for the fatigue test is Fmax = Fb0. The minimum load for the fatigue test, Fmin = Fbu, is given by
Fbu = 0.25 Fb0,
The frequency (f) was 8 Hz; an identical frequency was maintained throughout the test duration (2 million cycles). The fatigue test procedure is shown in Figure 11.
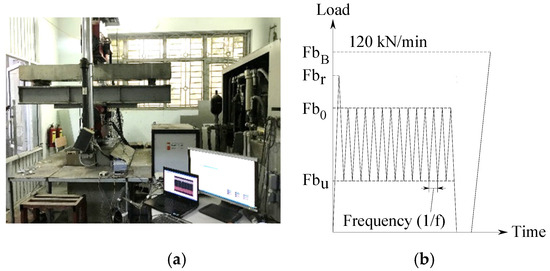
Figure 11.
Fatigue test setup. (a) Experimental setup; (b) Frequency and load.
The acceptance criteria after 2 million cycles are (a) crack width ≤0.1 mm when loaded at Fb0, (b) crack width ≤ 0.05 mm when unloaded, and (c) FbB > kbB·Fb0, where kbB is the impact coefficient for the fatigue test, which is given by
Using Equations (24) and (25), the respective parameters are calculated as Fbu = 5.15 kN, kbB = 2.54, and kbB·Fb0 = 52.41 kN.
For the fatigue test, this paper shows the details of the experimental tests using an LVDT (Linear Variable Differential Transformer) to measure the crack width in the centre of the bearer. Figure 12 shows the details of the LVDT installation at the bottom of the bearer.
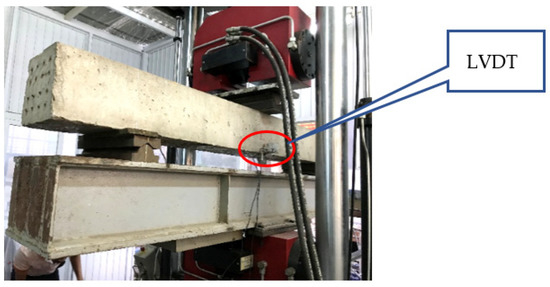
Figure 12.
LVDT setup.
5. Results
5.1. Results of Positive Bending Moment Test
The results of the static tests until the first crack appeared and the failure loads for the bearers are presented in Figure 13 and Table 4, respectively. The cracking loads for PSB1 and PSB2 were Fbr1 = 67.6 kN and Fbr2 = 70.1 kN, respectively. The corresponding failure loads were FbB1 = 164.03 kN and FbB2 = 150.54 kN, respectively.
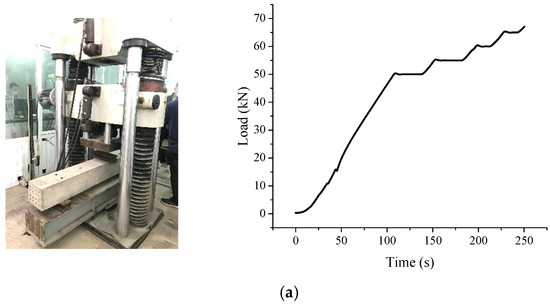
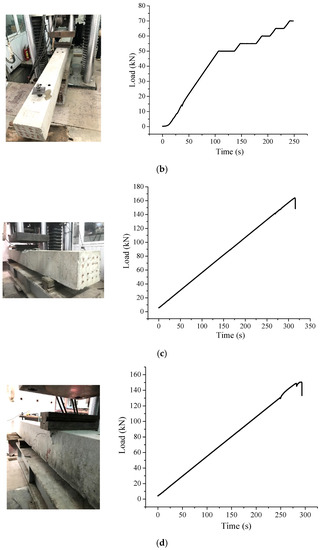
Figure 13.
Results of positive bending moment test. (a) Test load for first crack (PSB1); (b) Test load for first crack (PSB2); (c) Maximum test load (PSB1); (d) Maximum test load (PSB2).
Table 4.
Results of positive bending moment tests for PSB1 and PSB2.
5.2. Results of Negative Bending Moment Test
The results of static tests until the first crack appeared and the failure loads for the bearers are presented in Figure 14 and Table 5, respectively. The cracking loads for PSB3 and PSB4 were Fbrn3 = 90.4 kN and Fbrn4 = 80.0 kN, respectively. The corresponding failure loads were FbBn3 = 180.24 kN and FbBn4 = 159.25 kN, respectively.
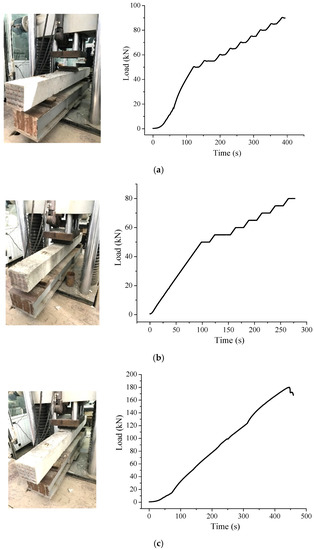
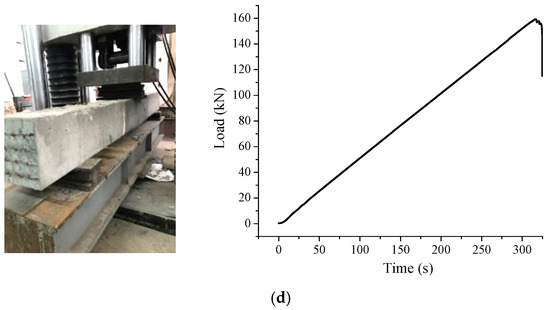
Figure 14.
Results of negative bending moment test. (a) Test load for first crack (PSB3); (b) Test load for first crack (PSB4); (c) Maximum test load (PSB3); (d) Maximum test load (PSB4).
Table 5.
Results of negative bending moment tests for PSB3 and PSB4.
5.3. Results of Fatigue Test
The results of tests until the first crack appeared and the failure load for PSB5 are presented in Figure 15. The cracking load for PSB5 was Fbr5 = 67.06 kN. This result was used to select the load amplitude in the fatigue test, ∆F = Fmax − Fmin = 15.45 kN. After fatigue testing over 2 million cycles with 15.45 kN load amplitude, the failure load for PSB5 was FbB5 = 146.83 kN. This value is greater than the design criteria for the failure load [FbB5] = kbB × Fb0 = 51.41 kN.
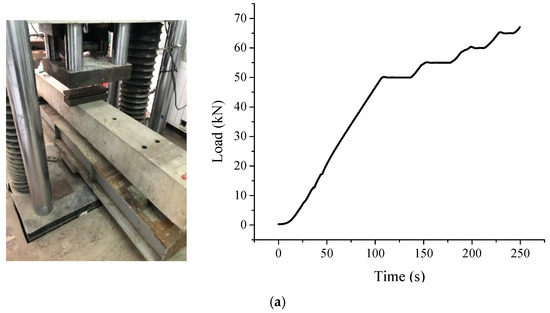
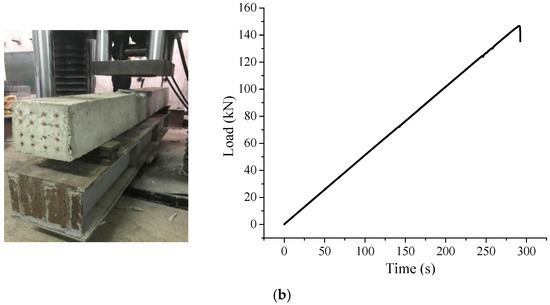
Figure 15.
Results of cracking and failure loads. (a) Test load for first crack (PSB5); (b) Maximum test load (PSB5).
The crack widths of bearer PSB5 at maximum and minimum loads are shown in Figure 16. Due to the high prestress and short testing span, the cracks were tiny. At the first cycle, the crack width at maximum load was 0.063 mm; it increased slowly up to 2 million cycles, and at 2 million cycles, the crack width reached 0.08 mm. For the minimum load, at the first cycle, the crack width was 0.022 mm; it increased slowly up to 2 million cycles, and at 2 million cycles, the crack width reached 0.03 mm. With the minimum load level, cracks developed slowly, while with the maximum load, cracks developed faster. However, the crack growth rate was linearly stable at both load levels.
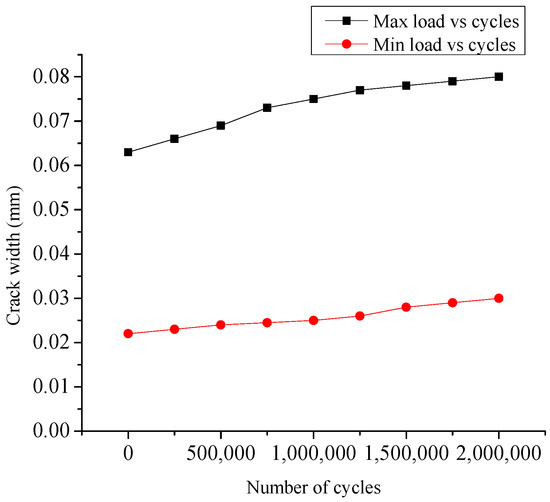
Figure 16.
Crack width versus number of cycles.
Figure 17 shows the relationships between crack width and load after 2 million cycles of the fatigue test. The crack width was 0.08 mm (≤0.1 mm) when loaded at Fb0 = 20.60 kN. In addition, the crack width was 0 (≤0.05 mm) when unloaded. These values satisfy the design criteria of the applicable standard [20].
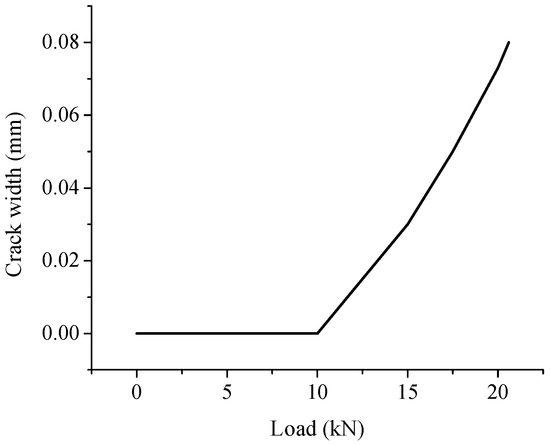
Figure 17.
Crack width versus load.
6. Discussion
The results of static testing of the bearers to determine the positive and negative design moments indicate that the obtained crack and failure loads significantly exceed the design criteria. This shows that the bearing capacity of the proposed bearers meets the static load requirements in the case of the positive and negative bending moments [20].
From Equation (6), due to the eccentricity of the centroid of the prestressed force, y = 0.16 cm. The values of cracking and failure loads for the positive bending moment tests are smaller than those for the negative bending moment tests. This result shows that the arrangement of the prestressed strands in the cross-section affects the bearing capacity of the bearers. The study results show that a reasonable arrangement of the strands plays a vital role in the design process of the prestressed bearers. The arrangement of the prestressed strands is likely to increase the load capacity and reduce the concrete’s cracking. If the prestressed strands’ tension force is high, along with the eccentricity of the centroid of the prestressed force, the concrete will be cracked at the tensile fiber. Therefore, to limit this phenomenon when designing, the prestressed strands are arranged so that the centroid’s eccentricity of the prestressed force y equals 0.
In addition, the failure load of the fatigue test for the proposed bearers far exceeds the requirements. The results of the fatigue load show that after 2 million cycles, the failure load (FbB5 = 146.83 kN) was smaller than the failure loads for the positive and negative bending moment tests (FbB1 = 164.03 kN, FbB2 = 150.54 kN, FbBn3 = 180.24 kN and FbBn4 = 159.25 kN). This indicates that when the bearers are subjected to fatigue loads, cumulative failure occurs in the prestressed bearers. This result is entirely consistent with the Miner law [21]. However, in this study, this process was slow, so the bearers’ fatigue load capacity can be regarded as infinite with a small amplitude.
The results of the static and fatigue tests show that the experimental values of the proposed bearers are much larger than the design criteria for the standards. This means that (1) the proposed design can be used with larger locomotive loads and (2) the cross-section can be optimised by reducing the number of prestressed strands and changing the geometric dimensions of the bearer’s cross-section.
Several studies have been conducted on the carrying capacity of prestressed concrete bearers for turnouts. However, a direct comparison of these studies’ crack and failure loads is not possible because these loads depend on several factors, such as the number of prestressed strands, the concrete cross-section area, the distance between articulated supports (AS), and the loading procedures. Nonetheless, a comparison could provide alternative solutions for designers to consider for implementation.
Table 6 compares the results of this study and two previous studies conducted in Brazil in 2020 and Serbia in 2014. First, let us compare the present study and the Serbian study by Curic et al. [22], which used the exact same distance between AS (1.5 m). The present study uses a 48,400 mm2 concrete section area and 16 prestressed strands, compared to 63,800 mm2 and 18 prestressed strands used in the Serbian study, representing increases of 32% and 13%, respectively. These increased cross-section elements resulted in 4% and 28% increases in the crack and failure loads, respectively. Thus, the present study provides an alternative design with fewer strands and a smaller concrete section area, resulting in lower crack and failure loads (although the design still has a substantial bearing-capacity reserve). The alternative designs in Table 6 will be helpful for different operating conditions of railway turnouts.
Table 6.
Comparison of results of the present study and previous studies.
7. Conclusions
This study proposed and evaluated a new structural type of bearer for turnouts in Vietnam (1000 mm gauge). Based on this study, the following comments are offered:
- Bearers for turnouts were manufactured in a factory and tested in the laboratory. Based on a detailed analysis of the static and fatigue test results and the requirements of the standards [20], the proposed bearers for turnouts meet the requirements set for assessing the behaviour of the tested bearers subjected to static and fatigue loads. These bearers can replace the wooden sleepers at turnouts.
- The results of static and fatigue tests of the bearers for turnouts show that there is a considerable reserve in the cross-section capacity, which means that the existing reserve can be used with a greater locomotive axle, and the bearer design can be optimized by arranging the prestressed strands and changing the geometric dimensions of the bearer cross-section.
- Concrete cracking due to the prestressed force can be limited by arranging the strands appropriately. The eccentricity of the centroid of the prestressed force should be close to zero.
- The new bearer minimises maintenance costs, provides longer service life, and is environmentally friendly compared with traditional wooden bearers. The concrete bearers are more durable (service life is up to 50 years, compared to 12–15 years for wooden bearers), more economical, easier to manufacture, and not susceptible to vermin attack, fire, or weather. It is expected that concrete bearers will dominate in Vietnam in the coming years.
- The new bearer structure proposed in this study was evaluated using only laboratory experiments. Future research will focus on evaluating the performance of the new bearer structure in the field to fully assess PSB behaviour.
Author Contributions
Conceptualization, T.A.D.; methodology, T.A.D.; formal analysis, T.A.D. and S.M.E.; investigation, T.A.D. and S.M.E.; resources, T.A.D.; data curation, T.A.D.; writing—original draft preparation, T.A.D. and S.M.E.; writing—review and editing, T.A.D. and S.M.E.; visualization, T.A.D. and S.M.E.; supervision, T.A.D. and S.M.E.; project administration, T.A.D.; funding acquisition, T.A.D. All authors have read and agreed to the published version of the manuscript.
Funding
This research was funded by the Ministry of Education and Training (MOET) under grant number B2022-GHA-07.
Data Availability Statement
The data that support the findings of this study are available from the Structures Laboratory at the University of Transport and Communications, Hanoi, Vietnam.
Conflicts of Interest
The authors declare no conflict of interest.
References
- Wang, P. Design of High-Speed Railway Turnout; Academic Press: Cambridge, MA, USA, 2015. [Google Scholar]
- Weiping, Y. Technical characteristics of French high-speed railway turnouts. China Railw. 2006, 8, 40–41. [Google Scholar]
- Weizhou, F. Major technical characteristics of high-speed turnout in France. J. Railw. Eng. Soc. 2009, 9, 18–35. [Google Scholar]
- Andersson, C.; Dahlberg, T. Wheel/rail impacts at a railway turnout crossing. Proc. Inst. Mech. Eng. Part F J. Rail Rapid Transit 1998, 212, 123–134. [Google Scholar] [CrossRef]
- Kassa, E.; Andersson, C.; Nielsen, J.C.O. Simulation of dynamic interaction between train and railway turnout. Veh. Syst. Dyn. 2006, 44, 247–258. [Google Scholar] [CrossRef]
- Kassa, E.; Nielsen, J.C.O. Stochastic analysis of dynamic interaction between train and railway turnout. Veh. Syst. Dyn. 2008, 46, 429–449. [Google Scholar] [CrossRef]
- Kassa, E.; Nielsen, J.C.O. Dynamic train-turnout interaction in an extended frequency range using a detailed model of track dynamics. J. Sound Vib. 2009, 320, 893–914. [Google Scholar] [CrossRef]
- Rong-shan, Y.; Xue-yi, L.; Ping, W. Research on longitudinal force computation theory and experiment of welded turnout on bridge. J. China Railw. Soc. 2010, 32, 135–142. [Google Scholar]
- Wang, P.; Chen, R.; Quan, S. Development and application of wheel-set lateral displacement test system in high speed railway turnout zone. Prz. Elektrothchniczny Electr. Rev. 2012, 88, 69–73. [Google Scholar]
- Xu, J.; Wang, P.; Chen, R.; Xu, H. Mechanical properties of high-speed turnout switching and locking device. J. Southwest Jiaotong Univ. 2013, 48, 702–707. [Google Scholar]
- Gao, Z.; Qian, Y.; Dersch, M.S.; Edwards, J.R. Compressive stress distribution in prestressed concrete and its effect on railroad crosstie design. Constr. Build. Mater. 2017, 151, 147–157. [Google Scholar] [CrossRef]
- Blanco-Saura, A.E.; Velarte-González, J.L.; Ribes-Llario, F.; Real-Herráiz, J.I. Study of the dynamic vehicle-track interaction in a railway turnout. Multibody Syst. Dyn. 2018, 43, 21–36. [Google Scholar] [CrossRef]
- Silva, R.; Silva, W.V.; Farias, J.Y.; Santos, M.A.A.; Neiva, L.O. Experimental and Numerical Analyses of the Failure of Prestressed Concrete Railway Sleepers. Materials 2020, 13, 1704. [Google Scholar] [CrossRef]
- Ferdous, W.; Manalo, A. Failures of mainline railway sleepers and suggested remedies—Review of current practice. Eng. Fail. Anal. 2014, 44, 17–35. [Google Scholar] [CrossRef]
- JIS E 1201; Japanese Industrial Standard: Prestressed concrete sleepers—Pretensioning type. Standard Japan: Tokyo, Japan, 1997.
- Code of International Union of Railways (UIC Code). Design of Monoblock Concrete Sleepers; UIC CODE 713 R.; UIC Code: Paris, France, 2004. [Google Scholar]
- Manufacturing Process of Vietnam. Concrete Sleepers and Bearers Manufacturing Process; Construction Joint Stock Company No.6: Hanoi, Vietnam, 2022. [Google Scholar]
- EN 13230–6; Railway Applications. Track. Concrete Sleepers and Bearers. Part 6: Design. CEN: Brussels, Belgium, 2016.
- EN 1992-1-1:2004; Eurocode 2: Design of Concrete Structures-Part 1-1: General Rules and Rules for Buildings. CEN: Brussels, Belgium, 2004.
- EN 13230–4; Railway Applications. Track. Concrete Sleepers and Bearers. Part 4: Prestressed Bearers for Switches and Crossings. CEN: Brussels, Belgium, 2016.
- Miner, M.A. Cumulative damage in fatigue. J. Appl. Mech. 1945, 12, 159–164. [Google Scholar] [CrossRef]
- Curíc, E.; Dreníc, D.; Grdíc, Z. Analysis of carrying capacity of concrete sleepers for switches and crossings under static and dynamic load. Građevinar 2014, 12, 1117–1124. [Google Scholar]
- ABNT NBR 11709; Concrete Sleepers—Design, Materials and Components. The Brazilian Association of Technical Standards: Rio de Janeiro, Brasil, 2015.


Publisher’s Note: MDPI stays neutral with regard to jurisdictional claims in published maps and institutional affiliations. |
© 2022 by the authors. Licensee MDPI, Basel, Switzerland. This article is an open access article distributed under the terms and conditions of the Creative Commons Attribution (CC BY) license (https://creativecommons.org/licenses/by/4.0/).