Article

Bio-Wastes as Aggregates for Eco-Efficient Boards and Panels: Screening Tests of Physical Properties and Bio-Susceptibility †

1
Department of Civil Engineering, NOVA, School of Science and Technology, NOVA University of Lisbon, 2829-516 Caparica, Portugal
2
National Laboratory for Civil Engineering, Avenida do Brasil 101, 1700-066 Lisbon, Portugal
3
CERIS, Civil Engineering Research and Innovation for Sustainability, IST, 1049-001 Lisbon, Portugal
4
Azorean Biodiversity Group (cE3c), University of the Azores, 9700-042 Angra do Heroísmo, Portugal
*
Author to whom correspondence should be addressed.
This paper is an extended version of our paper published in Cintura E., Nunes L. and Faria P., Characterization of agro-wastes to be used as aggregates for eco-efficient insulation boards. In Proceedings of the 2021 International Conference on Construction, Energy Environment & Sustainability (CEES), Coimbra, Portugal, 12–15 October 2021; ISBN: 978-989-54499-1-0.
Infrastructures 2022, 7(3), 26; https://doi.org/10.3390/infrastructures7030026
Submission received: 26 January 2022 / Revised: 18 February 2022 / Accepted: 20 February 2022 / Published: 22 February 2022

Abstract

:
Screening tests were developed or adapted from RILEM recommendations, standards and past studies, and carried out to characterize some agro-industrial wastes and to assess their feasibility as aggregates for eco-efficient building composites. Spent coffee grounds, grape and olive press waste and hazelnut shells were used, as well as maritime pine chips as control material. Particle size distribution, loose bulk density, thermal conductivity and hygroscopicity properties were analysed. The selected bio-wastes did not show good thermal insulation properties if compared with some bio-wastes already studied and used for thermal insulation composites. Values of loose bulk density and thermal conductivity were between 325.6–550.5 kg/m3 and 0.078–0.107 W/(m·K); moisture buffering values higher than 2.0 g/(m2·%RH). Biological susceptibility to mould and termites were also tested, using not yet standardized methods. The low resistance to biological attack confirms one of the greatest drawbacks of using bio-wastes for building products. However, final products properties may be changed by adding other materials, pre-treatments of the wastes and the production process.

1. Introduction

The global climate is changing as a consequence of human activity and the problem has become so serious that the European Commission is calling for a climate-neutral Europe by 2050 [1]. To reach such an ambitious goal, the strategic importance of the construction sector is clear. Indeed, the building industry is recognized to have a strong environmental impact for several reasons. Among them are energy consumption, production of solid waste and harmful gases, and the lack of insulation of the existing building stock, responsible for high energy losses [2,3,4]. The urgent need for more sustainable building practices is leading to increased research focused on the production, transport and use of building materials that can be shown to have a lower impact on the environment [5,6]. In this context, eco-friendly insulation materials and composites emerge as an interesting solution. They can reduce energy consumption, mitigate the production of harmful wastes, reduce the waste volumes to manage and passively control hygrothermal conditions, improving indoor air quality and comfort [7,8].
Nowadays, a significant amount of research focuses on the feasibility of using bio-wastes to produce several building materials, such as binders, mortars and concrete, plasters, masonry blocks, insulation boards, and coating panels. That is due to the large production of bio-wastes and their good potential in construction practices [9,10]. The use of bio-wastes can both lower production costs and encourage circular economy practices, as well as being an innovative method for waste disposal [5,11,12,13].
Several recent studies attempted to evaluate the feasibility of producing composite boards using bio-wastes. For example, Eschenhagen et al. [14] analysed boards made up of Miscanthus (Miscanthus spp.) fibres, sunflower (Helianthus annuus L.) stalks and natural binders (starch-based binder, wood glue made of casein and bone glue made of gelatine). Composites were obtained with a density of 190 kg/m3 (average value) and thermal conductivity between 0.057 W/(m·K) and 0.068 W/(m·K) for Miscanthus fibres, 280 kg/m3 and 0.065–0.077 W/(m·K) for sunflower stalks. Considering the reference value of 0.065 W/(m·K) as the maximum thermal conductivity of a good thermal insulator material [15], these bio-wastes showed potential for insulation boards production. Ali et al. [16] evaluated the possibility of making boards using wheat and agave straw bonded with corn starch. The resulting composites also showed good potential as insulating boards with thermal conductivity values of about 0.052 W/(m·K). Nunes et al. [17] produced cement-bonded particleboards replacing maritime pine (Pinus pinaster Ait.) chips with banana tree (Musa sp.) pseudostem waste. The researchers demonstrated that the increase in banana fibre content from 0% to 75% (by weight) reduced thickness swelling from 0.38% to 0.11%, improving dimensional stability.
Among the large number of past studies that considered bio-wastes for boards’ production, only a few detailed the properties of the bio-aggregates individually. Table 1 presents a summary of the particle size of bio-aggregates already used for boards’ production.
Particle size is one of the most studied properties of aggregates but remains unknown for many bio-wastes. The reported methods and experimental tests tend to focus on the composites [10]. The analysis of the bio-wastes should be further investigated since their characteristics will be certainly linked to the performance of the final products [28]. Knowing bio-wastes properties allows more conscious choices to be made to achieve the final requirements for the produced composites [29]. Along with the European Standards for aggregates in general, the Recommendations of RILEM Technical Committee 236-BBM “Bio-aggregate-based building materials” [30] have been widely used to study properties of bio-aggregates. For example, Page et al. [31] used them to characterize hemp shiv and flax fibres; Laborel-Préneron et al. [32] to analyse barley straw, hemp shiv and corn cob; Antunes et al. [33] to evaluate rice husk properties; Barbieri et al. [34] to study wheat husk. Using the same methods allows conforming the procedures and guarantees an easier comparison between different materials. However, complementary characterization may be important and further test procedures may be needed. As bio-based products are frequently vulnerable to biological deterioration, bio-susceptibility tests are a good example of this need.
Due to their organic composition, and factors like the presence of nutrients and microorganisms in the raw materials, as well as typical high hygroscopicity, bio-based wastes are often prone to biological deterioration [35,36]. Bio susceptibility is indeed recognised as one of the main drawbacks of bio-based building materials [37,38]. It can lead to modified properties and eventually to reduced durability. In particular, besides the obvious aesthetic impact, mould growth on interior applications can also lead to health risks for building users, namely respiratory diseases, such as asthma and allergic rhinitis [39]. Insect attack can also be a major cause of deterioration of building materials, thus worsening their performance. In the case of bio-based components and structures, subterranean termites represent the highest hazard in Mediterranean countries [40,41] and can be used as model organisms to evaluate susceptibility. The biological resistance of raw materials provides useful information and can help to forecast their impact on the final performance of composite materials. Thus, it is an important property that has to be considered to optimize the design of bio-based products.
Taking into consideration the previous information, this article reports the characterization of four bio-wastes analysed individually to determine their properties as raw materials: spent coffee grounds, grape press waste, olive press waste and hazelnut shells. Typically, spent coffee grounds are usually disposed of in landfills, used as composting and fermentation or as animal feed, such as olive and grape pomace [42,43]. Hazelnut shells are used for combustion and heating [44].
Maritime pine (Pinus pinaster Ait.) chips were considered as control material, as its characteristics are better known and recycling is frequent, namely from construction and demolition waste. These bio-wastes were chosen considering the referenced feasibility of using them as building materials and their world production, focusing on Euro-Mediterranean [10]. The use of local materials decreases the environmental impact derived from the transport and consumption phases and secures high availability. The results were compared with other bio-based materials already studied and used as aggregates (cork waste particles, corn cob particles, hemp shiv, and rice husk), namely for producing boards and panels. The potential of the analysed bio-wastes as aggregates for this type of composite production and, how to optimize their use, was discussed. This work also aims at both describing and discussing the methods to evaluate properties of bio-aggregates, some not so common, as the cases of bio-susceptibility tests, and reporting the obtained properties, comparing with literature whenever possible. The study reduces the gaps of knowledge found in literature and evaluates the feasibility of using complementary bio-wastes to produce composite boards and panels.

2. Materials and Methods

2.1. Materials

Spent coffee grounds were provided by the central bar of the National Laboratory of Civil Engineering (LNEC), Lisbon, Portugal. They are usually thrown away for waste disposal. They were air-dried at room temperature for 6 weeks over an absorbent paper, regularly stirred to improve the dry rate. Grapes and olive press wastes were provided by Esporão company located in Reguengos de Monsaraz, Portugal. They were spread over a plastic tarp for 7 and 10 weeks, respectively, to air dry and also regularly mixed to allow better ventilation. Olive press waste needed a longer drying period due to the initial high amount of liquid content that, according to the producer, depends on the olives’ quality of each season. Hazelnut shells were provided by Borges Agricultural & Industrial Nuts SA company, located in Reus, Spain. This bio-waste was used as received. Details on the cellulose, hemicellulose and lignin content of these bio-wastes have been described previously by Cintura et al. [10], such as their disposal and use.
To simulate recycled pine wood a maritime pine board, obtained from a local wood shop (Lisbon, Portugal), was cross cut and then shredded in a laminar mill five times to reach a chip dimension of less than 10 mm. Figure 1 shows the analysed materials and their colour scale according to the PANTONE Uncoated RGB scale [45].
After air drying, the materials were sampled as described by Amziane et al. [30], they were placed on a flat surface into a pile that was divided into quarters. Two parts were selected and further divided into quarters. This procedure was repeated until having enough material to carry out the laboratory tests. Sampling guarantees a better mixture of particles, avoiding the segregation between the coarser and finer ones.

2.2. Methods

Experimental tests were performed after drying the bio-wastes at 60 °C until a constant mass was reached (change in mass of less than 0.1% over 24 h), except for bio-susceptibility tests for which the bio-wastes were dried also at 103 °C for 24 h. Then, they were stabilised in a conditioning room (T = (20 ± 2) °C, (60 ± 5)% relative humidity (RH)), adapting the method proposed by Amziane et al. [30] to equilibrate at known laboratory conditions. All the laboratory tests were performed without pressing the bio-aggregates. Table 2 summarizes the tests performed, the samples and relevant references. Further details are presented in the following sections.

2.2.1. Particle Size Analysis, Loose Bulk Density and Thermal Conductivity

Grain size analysis was carried out using the mechanical sieves method, considering Amziane et al. [30], as mentioned in Table 2. Due to the different grain sizes of the studied materials, the apertures of the successive openings of the sieves covered a wide range (from 10 mm to 0.125 mm) in accordance with EN 933-2 [46]. The sieving time, not specified in the considered references, was 3.5 min. The particle size distribution curve was determined by considering the average values of the three samples.
Bio-wastes loose bulk density was calculated considering two different methods. The first one considered the method presented by Amziane et al. [30] and Laborel-Préneron et al. [32]. An empty cylindrical glass was weighed and then filled with the material until half the volume. The container was sealed and upend ten times and shaken to obtain a horizontal surface. The level of the material was marked. The material was removed, and the container was filled with water and weighed. The loose bulk density was determined by Equation (1). The average value of the three tested samples was considered significant when the coefficient of variation was less than 5%.
ρ Aggregate ( kg m 3 ) = m Aggregate m H 2 O ρ H 2 O
The second method, based on EN 1097-3 [47], consisted of calculating the ratio between the mass and the volume of the materials. A cylindrical container with a known volume (V) was weighted (m1), filled by dropping the material from a height of 40 cm, shaken to obtain a horizontal surface without compacting the material, and weighted again (m2). The loose bulk density was calculated by Equation (2).
ρ Aggregate ( kg m 3 ) = m 2 m 1 V
Measurements of thermal conductivity in building materials may be performed through steady-state methods or transient methods. In this work, a transient method was adopted, considering the method reported by Antunes et al. [33] and Liuzzi et al. [20], as reported in Table 2. The transient method offers several benefits [53,54], in particular the smaller dimension of the testing area. This allowed performing the measurement in different parts of the surface of each sample, indicated in Figure 2a. Bio-wastes’ thermal conductivity was measured by using an ISOMET 2104 Heat Transfer Analyser with a 60 mm diameter contact probe API 210412, ranging values between 0.04 and 0.30 W/(m·K). To evaluate the correlation between the thermal conductivity and RH, the samples were stabilised in a climatic chamber (Fitoclima 300 EDTU) at T = 23 °C, RH = 50%, then T = 23 °C, RH = 75%. When constant mass was reached (change in mass of less than 0.1% over 24 h), thermal conductivity was calculated, protecting the samples from the airflow during the measurement by a cover box (Figure 2b). To validate this method, mass was controlled before and after the test to guarantee a variation of less than 0.1%. The average value of the five measurements was considered significant if the coefficient of variation was less than 5%.

2.2.2. Water Absorption and Sorption/Desorption Properties

For the water absorption test, based on Amziane et al. [30] and Laborel-Préneron et al. [32], an empty permeable bag was put in water until reached complete wetting. Then it was put in a salad spinner, turned 100 times (approximatively two rotations/second) and tared. It was filled with 25 g of each of the bio-wastes (m0) and immersed in water. After one minute, the permeable bag with the waste was removed from the water, put in the salad spinner, turned 100 times again, and weighed. The permeable bag was put in the water again and this procedure was repeated after 1 min, 15 min, 4 h and then every 24 h until a constant mass was reached (change in mass less than 0.1% over 24 h). Water absorption was determined considering Equation (3), where mA is the wet mass.
W ( % ) = m A m 0 m 0 × 100
The average value of three tested samples of each material was considered significant when the coefficient of variation was less than 5%. By knowing the bulk density of the bio-wastes, it was possible to determine the ratio between the volume of the absorbed water and the volume of the considered bio-wastes. The water absorption of the bio-wastes allows making considerations about the influence they may have on the workability of future composites.
The hygroscopicity of the bio-wastes was determined by considering the moisture adsorption/desorption capacity in response to humidity variation through cyclic tests, as indicated in ISO 24353 [48]. The plastic boxes filled with the materials (open-top surface = A), were preconditioned at T = (23 ± 2) °C and RH = (63 ± 2)% in a climatic chamber (Fitoclima 1000) until constant mass was reached (change in mass of less than 0.1% over 24 h) and weighed (m0 = md(n−1)). Then they were conditioned at T = (23 ± 2) °C, RH = (75 ± 2)% for 12 h and weighed every 3 h (moisture sorption process, man), and at T = (23 ± 2) °C, RH = (50 ± 2)% for 12 h (moisture desorption process, mdn). The cyclic value of the moisture adsorption content, ρA,ac, and the moisture desorption content, ρA,dc, were calculated according to Equations (4) and (5) to determine the variation of moisture adsorbed/desorbed content over time.
ρ A , ac ( kg m 2 ) = m an m d ( n 1 ) A
ρ A , dc ( kg m 2 ) = m an m dn A
The moisture content difference between adsorption and desorption is calculated considering Equation (6).
ρ A , sc ( kg m 2 ) = ρ A , ac ρ A , dc
For easier comparison of the results with literature values, the moisture buffering value (MBV) was also calculated, adapting the method defined by Rode et al. [49]. MBV is the average value between MBV for the sorption phase (MBVa) calculated as reported in Equation (7), and MBV for the desorption phase (MBVd) calculated as reported in Equation (8). The last three cycles and the average values of each bio-waste was considered.
MBV a ( g / ( m ² · %   RH ) ) = m an m d ( n 1 ) A × ( RH high RH low )
MBV d ( g / ( m ² · %   RH ) ) = m an m dn A × ( RH high RH low )
In these equations, man (g) is the value of the mass at the end of the sorption phase, md(n1) is the value of the mass at the end of the desorption phase of the previous cycle, mdn is the value of the mass at the end of the desorption phase, A (m2) is the exposed surface, RHhigh is the highest value of RH (75%) and RHlow is the lowest one (50%, based on ISO 24353 [48], differently from Rode et al. [49]). The MBV of the analysed materials, calculated as described, can be compared with MBVs of literature even when calculated under different conditions. Indeed, the reference to RH variation included in the value makes the comparison easier [55].

2.2.3. Bio Susceptibility to Mould and Termites

To evaluate the bio-susceptibility to moulds, two different exposure methods were applied. Ten Petri dishes (diameter = 9 cm) were used for each bio-waste under test with five dishes containing 20 mL of culture media (4% malt, 2% agar). A similar amount of previously steam sterilized bio-wastes (approx. 13 mL) was added to each Petri dish and all plates were inoculated with 1 mL of a mixed spore suspension of Aspergillus niger and Penicillium funicullosum. The fungal strains used came from LNEC’ fungal collection.
The Petri dishes with culture media were left for four weeks at (22 ± 1) °C and (70 ± 5)% RH. Five Whatman n° 1 filter papers (diameter = 45 mm) were used as controls for this exposure method. The inoculated dishes without culture media were conditioned for the same time and at the same temperature but at 100% RH. For these, maritime pine chips were considered as reference material.
The samples were visually graded each week and mould growth was estimated considering the classification provided in Table 3. At the end of the four weeks, the samples were also visualized under a stereo microscope (Olympus SZX12) to confirm the grading results. Carrying out the bio susceptibility test with and without culture media allowed evaluating the materials both in favourable conditions for mould growth and as they are (raw materials).
For testing against subterranean termites, a protocol was developed following previous work [52]. Three Petri dishes (diameter = 9 cm) for each bio-waste were half filled with approx. 7 mL of the materials and on the other half similar amounts of moistened (25% w/w) Fontainebleau™ sand were placed. Groups of 50 termites (R. grassei) were then introduced on each Petri dish. The termites were field collected (Sesimbra, Portugal) and maintained at optimal conditions until required for testing but never more than two months.
All tested samples were left for four weeks at (24 ± 1) °C and (80 ± 5)% RH, constantly monitored to control both termites’ survival and mould growth. At the end of this period, the percentage of survival of the termites was evaluated and mould growth was qualitatively estimated. Because of the well-known durability of maritime pine, its chips were considered as controls to validate the test. A survival level lower than 50% would not be accepted [41]. Mould growth can have a limiting impact on termite survival and therefore was also closely followed.

3. Results and Discussion

3.1. Particle Size Analysis

Figure 3 shows the particle size distribution of the considered bio-wastes.
Spent coffee grounds have grain sizes much lower than the other selected bio-wastes and the control; thus, for insulation boards, they might play a better role as fine aggregates. The other bio-wastes present more similar characteristics (particle size of about 1–8 mm).
The comparison between the results and literature values reported in Table 1 allows evaluating if shredding the bio-wastes will be required in case of using them for boards’ production. The grain size of the analysed bio-wastes is in the range of the considered past studies, in which it varies between 0.25 mm and 80 mm. Therefore, shredding the bio-wastes to produce boards does not seem to be necessary. This guarantees a more sustainable practice since the bio-wastes can be used directly as they are as by-products. The shredding may be necessary in case of compressed panels’ production for which a finer grain size might be more adequate [17].
Collet [56] reported some past studies about the influence of aggregates’ grain size on the thermal properties of the composites. The results demonstrate that the finer are the particles, the higher is the thermal conductivity. Laborel-Préneron et al. [32] demonstrated that, in earth-straw composites, the shorter are the pieces of straw, the higher is the compressive strength. Future studies could deepen the influence of grain size on the properties of boards since it can affect physical and mechanical properties [17,18]. The influence of sieving time on the results of the grain size analysis of bio-aggregates could be further investigated, too. The test could be carried out considering several sieving times, evaluating the differences in the results and defining which guarantees the smallest deviation in the grains size distribution, as Martínez-García et al. [57] reported.

3.2. Loose Bulk Density and Thermal Conductivity

Table 4 reports the results of loose bulk density of the bio-wastes analysed by the two methods, comparing them with literature values.
Values of the considered bio-wastes have the same order of magnitude of literature ones. The main differences derive from different types and particle sizes that widely affects the values of loose bulk density [58]. Wood chips show the lowest values of loose bulk density, as expected. Grape press waste could be the best aggregate to produce thermal insulation boards since it has the lowest loose bulk density value between the bio-wastes.
Table 4. Measured loose bulk density of the analysed bio-wastes and comparison with literature values.
MaterialLoose Bulk Density (kg/m3)Literature Values (kg/m3)Reference
According to Amziane et al. [30] According to EN 1097-3 [47]
Grapes press waste343.88 ± 12.00325.60 ± 5.82105 ± 5 aWong et al. [18]
1449 ± 2 bDavid et al. [59]
1420 ± 3 cDavid et al. [59]
Hazelnut shells550.50 ± 19.53549.66 ± 11.92230Çöpür et al. [60]
Olive press waste449.43 ± 8.60427.32 ± 9.621251 dLiuzzi et al. [61]
616 edel Río Merino et al. [62]
Spent coffee grounds478.81 ± 5.40447.73 ± 5.13 380 ± 20 fMassaro Sousa and Ferreira [63]
Wood chips256.98 ± 8.10250.20 ± 4.59130 ± 2 gWong et al. [18]
a Particles of grapevine milled to a thickness of <1 mm particles; b Wine pomace; c Vine shoots; d Olive pruning waste; e Olive stone; f Grain sizes between 600 and 500 μm; g Commercial pine.
Considering the materials chosen for comparison, granular cork waste derived from cork panels, bottles cap manufacturing, cork industry (not expanded cork) showed values of about 150–160 kg/m3 [64]. For expanded cork granulate, Brás et al. [65] reported values of 112 kg/m3 and Nóvoa et al. [66] values of 220 kg/m3. For corn cob, Ansell et al. [58] obtained values of about 344–406 kg/m3. Laborel-Préneron et al. [32] evaluated corn cob and hemp shiv, achieving results of 497 kg/m3 and 153 kg/m3, respectively. For hemp shiv, Page et al. [31] reported values of 110 kg/m3. Antunes et al. [33] studied rice husk, reporting a loose bulk density of 85 kg/m3. The selected bio-wastes have a higher loose bulk density, except for corn cob evaluated by Laborel-Préneron et al. [32]. In this case, only hazelnut shells show higher values. Grape press waste has a loose bulk density closer to the one of corn cob evaluated by Ansell et al. [58].
Table 5 shows the values of thermal conductivity of the analysed bio-wastes. The thermal conductivity values are higher than the required to consider a material as thermal insulation, namely not lower than 0.065 W/(m·K) [15]. None of the tested bio-wastes can be classified as such. To produce boards with good thermal resistance using these bio-aggregates, it will be necessary to combine them with other materials with good thermal insulation properties or produce them in a way that air is entrapped within the composite in small volumes. Grape press waste has the lowest thermal conductivity, similar to one of the wood chips: it seems the most promising bio-aggregates to produce composites with good thermal insulation performance. Taking into account the correlation with loose bulk density, thermal conductivity values are in line with the expected since there is a direct proportionality [67]. Hazelnut shells have the worst thermal insulation behaviour (the highest thermal conductivity), having the highest loose bulk density; grape press wastes and maritime pine chips show the lowest values of thermal conductivity, having the lowest values of loose bulk density.
Considering the materials chosen for comparison, all the bio-wastes have higher values of thermal conductivity, except for the one of corn cob. However, the test conditions of temperature and RH are frequently not defined.
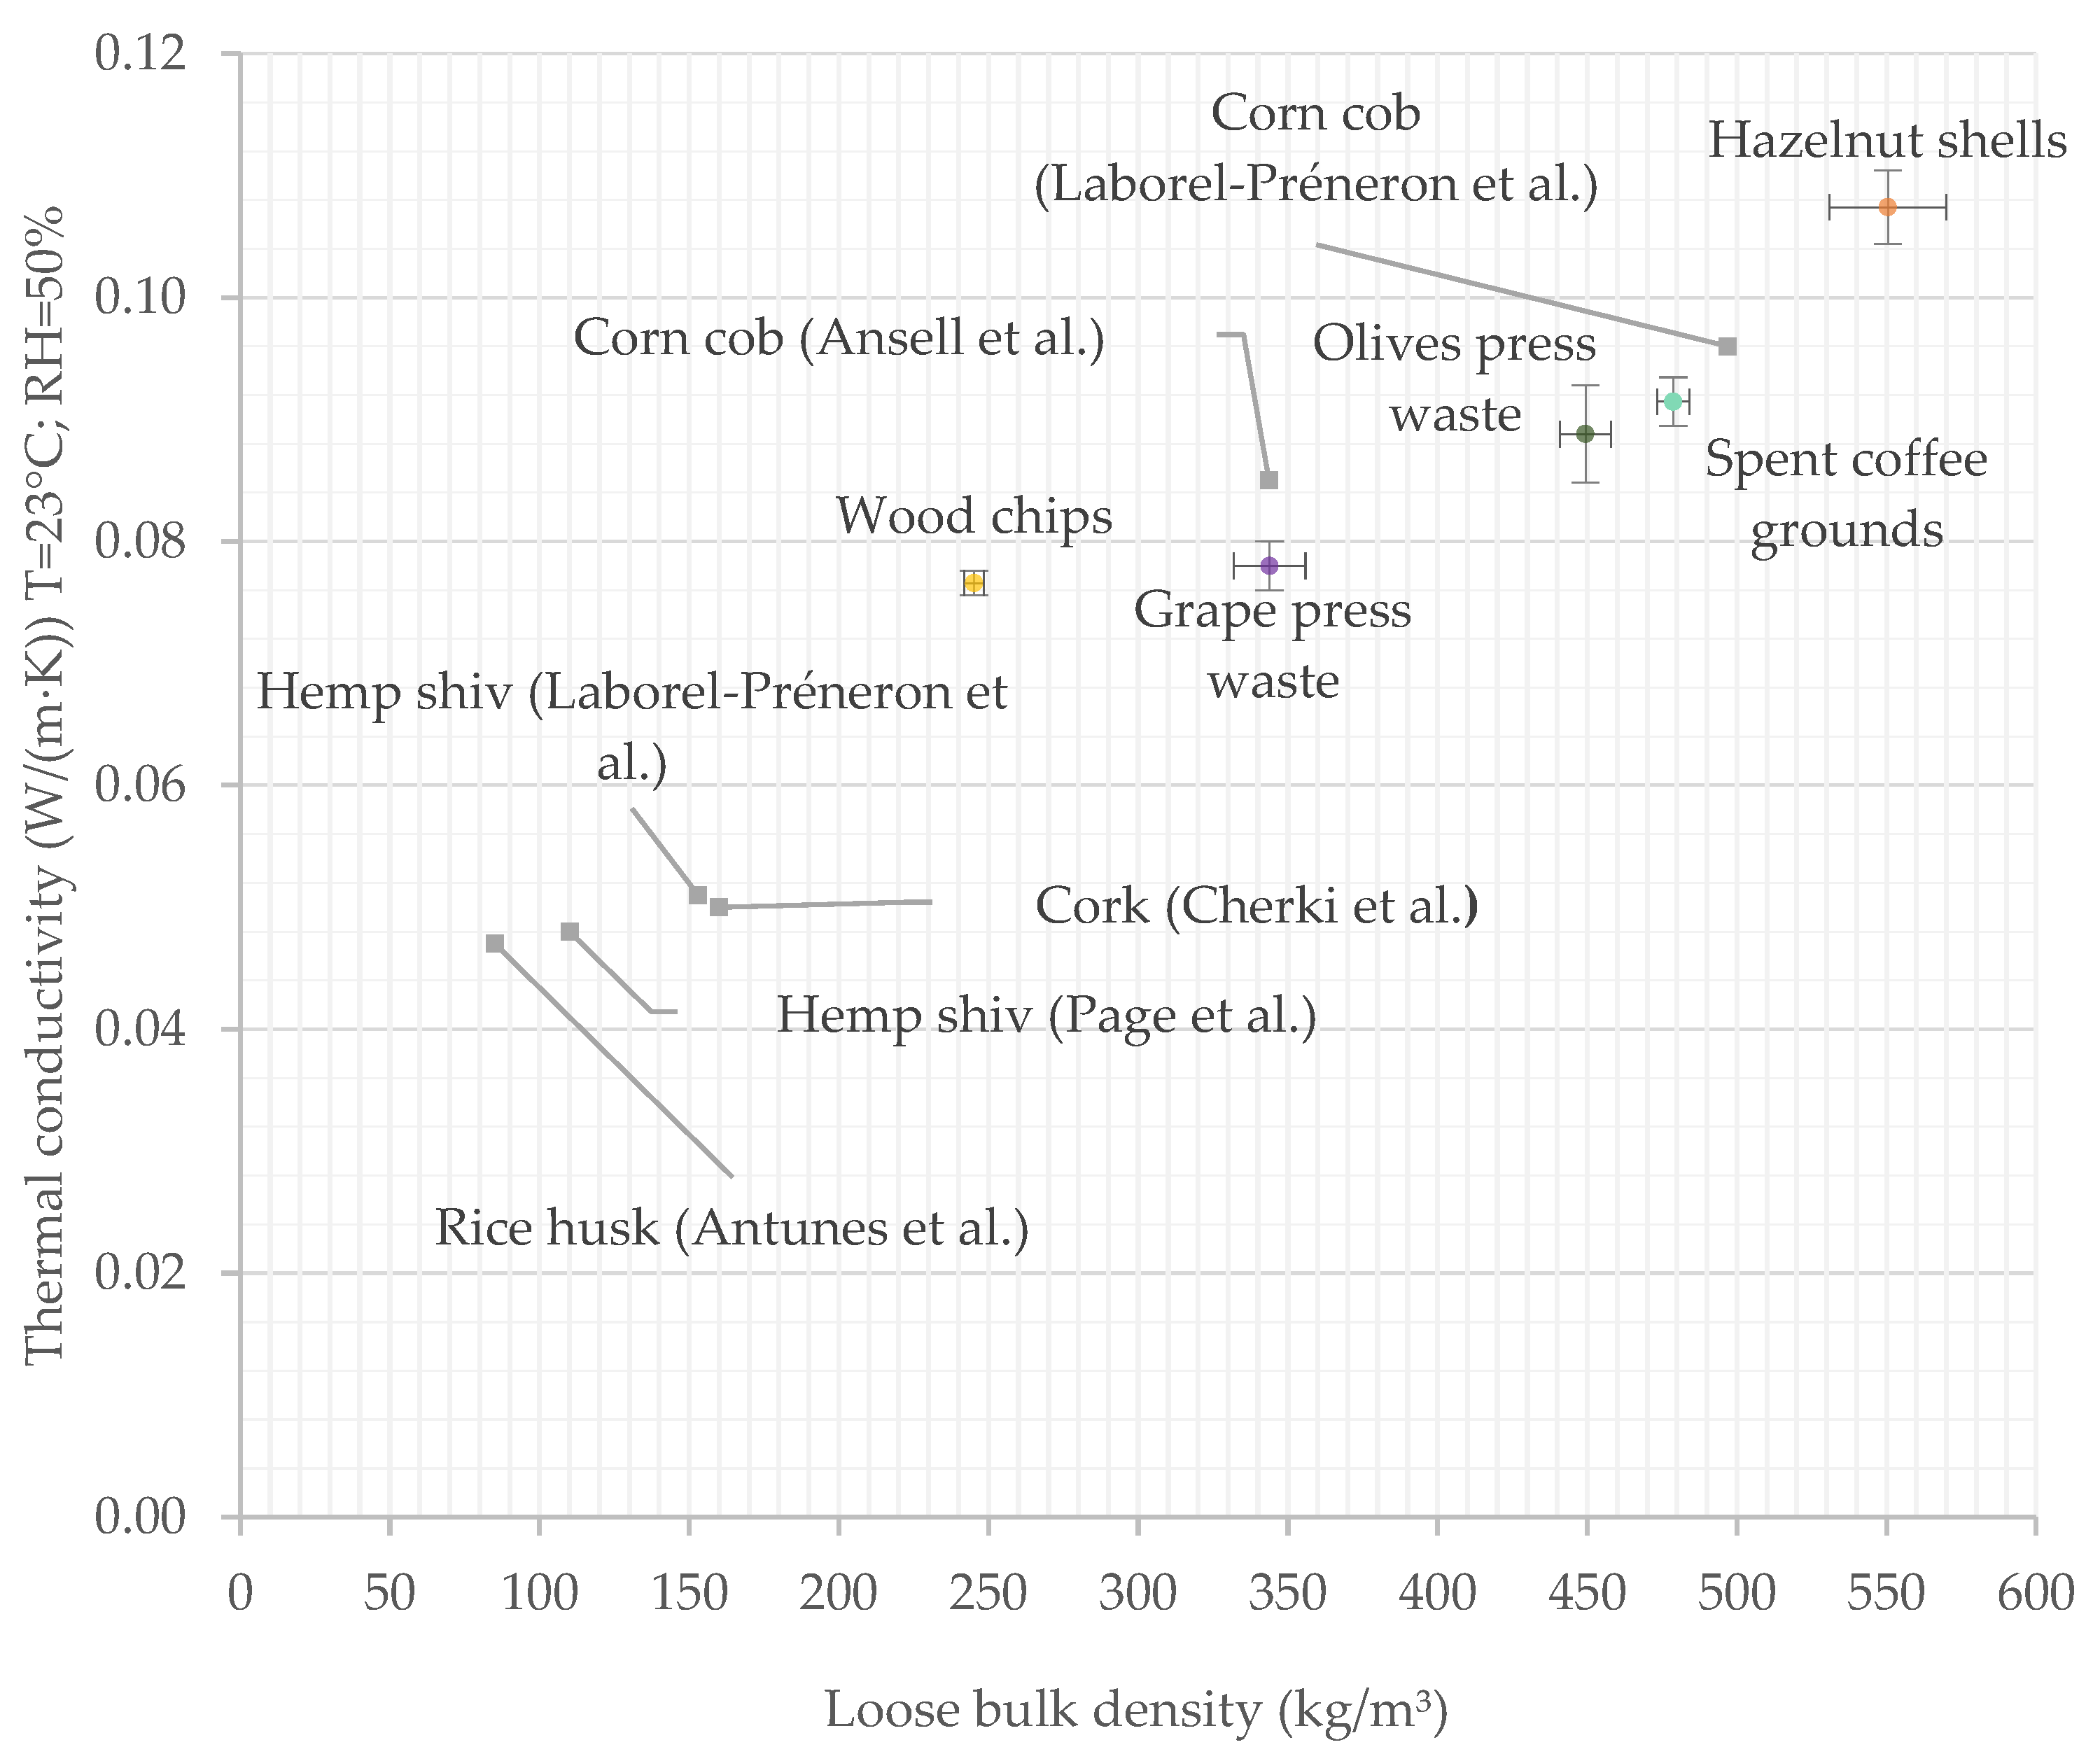
Figure 4 and Figure 5 show the correlations between thermal conductivity and RH, and between thermal conductivity and loose bulk density. As expected, the thermal conductivity increases proportionally to RH and the loose bulk density, for all tested bio-wastes. Figure 5 also reports the values of the materials chosen for comparison, being the lower thermal conductivity justified by lower loose bulk density.
Gomes et al. [70] and Cherki et al. [64] reported values of thermal conductivity of expanded granular cork of about 0.035–0.070 W/(m·K) and 0.049–0.050 W/(m·K), respectively. For hemp shiv, Laborel-Préneron et al. [32] reported values of 0.051 W/(m·K) while Page et al. [31] of 0.048 W/(m·K). Antunes et al. [33] evaluating rice husk achieved results of about 0.047 W/(m·K). Comparing with the results of Laborel-Préneron et al. [32], among the tested bio-wastes only hazelnut shells have a higher thermal conductivity than corn cob’s one (0.096 W/(m·K)). Considering the results of Ansell et al. [58], the thermal conductivity of corn cob (0.085 W/(m·K)) is higher than grape press waste and wood chips. Despite these results, the analysed bio-wastes may be used as bio-aggregates for insulation composite boards and panels’ production, if the composition and methods are able to improve the insulation performance.

3.3. Water Absorption and Sorption/Desorption Properties

Figure 6 reports the results of water absorption of the five studied bio-wastes considering the method proposed by Amziane et al. [30], and Table 6 presents the water absorption after 48 h.
Except for the spent coffee grounds, the analysed bio-wastes show a similar behaviour along time (Figure 6), starting to saturate after approx. 4 h of immersion, although with different levels of water absorption. Comparing with past studies [32,33], the correlation between water absorption and time is similar.
Regarding the absorption after 48 h (2880 min, Table 6), the different percentages can be observed. The results were compared with some literature ones determined by the same method [30]. Laborel-Préneron et al. [32] reported that water absorption after 48 h for corn cob is 123% and 380% for hemp shiv. Page et al. [31] obtained values of about 450% for hemp shiv. Antunes et al. [33] of about 300% for rice husk.
Values of water absorption of the analysed bio-waste are lower than in the literature. The discrepancy is probably caused by the considered method that could lead to differences in the results: the used permeable bags could be different, an eventual compaction of the materials during the permeable bag’s closing or inside the bags, as well as the compaction of the material during the absorbing phase and the manual rotation speed. To ensure a direct comparison between different materials, the method should be complemented. For example, the opening mesh of the permeable bag should be defined according to the grain size of the bio-aggregates, or the rotation time could be controlled automatically to avoid manual operation mistakes. Another important factor that could influence the water absorption capacity is the temperature of the water, as demonstrated by Bouasker et al. [71].
Most materials absorb a greater quantity of water during the first 24 h. Hazelnut shells show the lowest water saturation content. They achieved the lowest value of water absorption after 24 h (32.9 ± 2.6)%, followed by olive press waste (48.9 ± 1.6)%. Wood chips and grape press waste show the highest values of water absorption after the first 24 h ((101.9 ± 1.6)% and (88.0 ± 0.7)%, respectively).
Information about water absorption is extremely useful for future boards’ production in case of using a hydraulic matrix, as Laborel-Préneron et al. [32] reported. To better investigate this property, the ratio between the volume of absorbed water and the volume of the materials was calculated and its evolution with time is reported in Figure 7.
Supposing to produce boards or panels by wet methods and by defining the percentages of the components in volumes, with the same quantities of bio-wastes, composites with hazelnut shells should absorb less water. Composites with grape press waste will probably need more water for production than the others to obtain the same workability because more water will be absorbed by the bio-wastes. Figure 7 also shows that, differently from the evaluation of water absorption in terms of mass, wood chips show lower water absorption than grapes press waste. Again, the performance of spent coffee grounds differs greatly from the other bio-wastes. This one shows a slower water absorption: after 120 h it is still absorbing water and the constant mass is reached only after 10 days. The difference between spent coffee grounds and the other bio-wastes may depend on the different grain sizes but other characteristics of the coffee grounds may also have influence.
Figure 8 shows the variation in moisture adsorbed/desorbed content over time for the considered bio-wastes.
As Collet [56] and Romano et al. [72] reported, hygroscopicity properties widely affect the thermal behaviour of the composites and the control of the dynamic moisture changes. MBV values show the potential of bio-aggregates as hygric regulators [58]. For these reasons, the obtained results could anticipate some of the future properties of the boards.
Olive press waste achieved the highest values of moisture adsorption (ρA,ac between 0.114 kg/m2 and 0.116 kg/m2) and desorption content (ρA,ad between 0.104 kg/m2 and 0.113 kg/m2) during the four cycles. Wood chips and hazelnut shells reached the lowest values both in the sorption and desorption phases. Values of moisture sorption are between 0.076 kg/m2 and 0.080 kg/m2 for wood chips, between 0.078 kg/m2 and 0.083 kg/m2 for hazelnut shells. As for desorption, the values are between 0.074 kg/m2 and 0.078 kg/m2 and between 0.074 kg/m2 and 0.077 kg/m2, respectively.
Considering the moisture content difference between sorption and desorption, ρA,sc, values of grape press waste, olives press waste and wood chips are close to zero during the first cycle (between −0.001 kg/m2 and 0.001 kg/m2). Hence, these aggregates have similar sorption and desorption capacity. The first cycle shows not already stabilized bio-wastes moisture capacity. Except for wood chips and spent coffee grounds, sorption capacity is greater than desorption. During the second cycle, the bio-wastes sorption capacity improved. For all the bio-wastes, moisture adsorption content, ρA,ac, is greater than moisture desorption content, ρA,ad. After the first cycle, also for spent coffee grounds the moisture content difference is near to zero (maximum value of 0.001 kg/m2). Hazelnut shells showed the greatest moisture content difference for all the cycles (values between 0.004 kg/m2 and 0.006 kg/m2), with higher moisture sorption capacity than desorption.
However, the moisture content differences are very small for all the bio-wastes and during all cycles, less than 0.01 kg/m2. Furthermore, the measurement method (opening and closing of the climatic chamber) might have determined an error that has to be taken into consideration. As Romano et al. [72] reported, the difference between the bio-wastes might depend on a micro-capillary network formation that is created during water molecules sorption/desorption.
Table 7 reported MBV values [g/(m2·% RH)] and the classification provided by Rode et al. [49]: Negligible: MBV = 0.0–0.2; Limited: MBV = 0.2–0.5; Moderate: MBV = 0.5–1.0; Good: MBV = 1.0–2.0; Excellent: MBV ≥ 2.0. MBV. Values were calculated to allow a comparison between the bio-wastes and other already studied materials. Indeed, a gap in literature did not allow a comparison to be made between the variation in sorption/desorption content during time of the analysed materials and the ones considered for comparison evaluated by the same test.
Olive press waste showed the highest MBV, the wood chips and the hazelnut shells had the lowest ones. In composites’ production, olives press waste might guarantee a greater sorption/desorption capacity. They could therefore be the worst aggregates to produce thermal insulation boards, but the best ones in the case of indoor coating panels. Indeed, a high moisture buffering capacity can contribute to the passive control of the internal conditions and indoor air quality. However, these considerations should be verified: the performance of the composites widely varies depending on the complementary components (binders, additives) and the production method. Future studies should be devoted to determining the properties of these bio-wastes when combined with other materials to produce building composites. Overall, even in case of performances worse than the ones of typical composites, the use of bio-wastes replacing raw materials may offer a competitive and more sustainable solution than other common ones. Furthermore, it would be interesting to investigate the relationship between the bio-aggregates and composites’ properties.
According to Ansell et al. [58], a correlation of linear proportionality was expected between loose bulk density and MBV values for natural fibres. They showed that MBV increased with bulk density for hemp shiv, flax shiv, wheat straw and rape shiv. Holcroft and Shea [73] obtained different results considering hemp-lime: the lower the density, the higher the MBV. In the present study, the comparison between the materials does not allow defining a correlation between loose bulk density and MBV. MBV varies depending on other parameters too (e.g., grain size, chemical composition). Cintura et al. [10] reported chemical compositions of the analysed bio-wastes by considering past studies. The researchers accounted it as an important parameter that influences materials’ physical and mechanical features. They supposed that the selected bio-wastes may have good moisture buffering capacity, confirmed by the results of the present study.
Considering literature values of some of the materials chosen for comparison, corn cob showed values of 3.24 g/(m2·% RH) [58], higher only than hazelnut shells’ ones. Hemp shiv had values of about 2.09–2.53 g/(m2·% RH) [58], lower than the ones of all analysed bio-wastes. This demonstrates that the selected bio-wastes have good hygroscopicity behaviour. It might be a drawback for insulation boards production, even if, as anticipated, the performances will depend on the final compositions.

3.4. Bio Susceptibility to Mould and Termites

Figure 9 gives an idea of the mould growth over the five materials and the control when inoculated with culture media and after four weeks.
All the analysed bio-wastes with culture media are highly susceptible to mould attack, as expected. They reached the maximum value (4-contaminated surface more than 60%) during the second week of testing. The culture media contributes to the biological attack by increasing the sugar content available to the fungi. The controls (Figure 9f) demonstrated the validity of the test; all replicates reached grade 4 also on the second week of exposure.
Table 8 reports the results of weekly mould growth for the samples without culture media and Figure 10 shows the materials after four weeks of exposure.
Even without surrounding the culture media, all the analysed bio-wastes have a high susceptibility to mould. Differently from the previous results, the samples reached the maximum value during the third week of testing, confirming the higher susceptibility caused by culture media (Figure 9). The biological attack of the controls (Figure 10e) demonstrated the validity of the test: being wood chips, mould growth was expected. They were rated as 2.70 (contaminated surface between 30% and 60%) after four weeks, hence all the bio-wastes showed a lower biological resistance.
Hazelnut shells showed similar behaviour to control during the first week, being both rated as 0.4. Nonetheless, this bio-waste reached the maximum values at the end of testing as the others. Grape and olive press waste showed the lowest resistance to mould, being rated at 4 during the second week. Spent coffee grounds reached the maximum value during the third week. As previously anticipated, high hygroscopicity improves mould growth. Considering the results of water adsorption, they could be considered consistent with the bio susceptibility ones: olives and grapes press waste showed the highest moisture buffering capacity, hazelnut shells and wood chips the lowest one. However, considering only the correlation between hygroscopicity and biological attack is an oversimplification. Bio susceptibility depends also on many other factors such as materials’ composition, pH, surface properties, roughness, chemical and physical capabilities of mould species [51,74]. Mould growth could be further investigated since these laboratory tests aim at showing an initial assessment. The results confirm that, as bio-based materials, all the tested bio-wastes have a high susceptibility to mould.
Past research reported that caffeine improves the biological resistance of wood, lowering fungal growth. Kwaśniewska-Sip et al. [75] diluted caffeine into a water solution to treat Scots pine (Pinus sylvestris L.) samples; Šimůnková et al. [76] considered Norway spruce (Picea abies L. Karst.) samples. In both cases, caffeine solution improved wood’s biological resistance. Nevertheless, even if spent coffee grounds could be a source of chemicals that can moderate mould growth, they cannot be used to avoid the biological attack, as Barbero-López et al. [77] reported. Indeed, the raw material is known as a good material to allow mould growth [78,79], as confirmed also in the present study.
Table 9 reports the results related to the susceptibility to subterranean termites, considering the average value for each bio-waste. The survival rate of the maritime pine (higher than 50%) confirms the validity of the test. Figure 11 shows the samples after the four weeks.
The termites were able to consume all bio-wastes, though their ability to survive was highly influenced by both the available cellulose they could use and the fast development of moulds that they were not able to limit. The bio-waste with the highest amount of cellulose (grape press waste with small parts of grapevine) [10] was not surprisingly the most consumed by termites and the one that kept the highest survival rate of the termites during the test period. Hazelnut shells have better resistance to termites than wood chips, but they are not completely unaffected: 10.67% of the termites survived deteriorating a part of the material. Cintura et al. [10] reported that hazelnut shells have a cellulose content of about 22.90−34.60%. According to past studies, wood chips have a cellulose content of about 32.09–50.00% [80,81,82]. The results are in line with this information: termites probably fed on hazelnut shells, but the cellulose content, i.e., the necessary nutrients to survive, was not enough, hence they slowly died.
Termites’ survival for spent coffee grounds and olives press waste was rated at 0%, but these results cannot be considered as a demonstration of their best resistance to termites. Indeed, these materials also showed a high mould growth (Table 9 and Figure 11a,d) that could be the cause of termites’ mortality. Šimůnková et al. [76] investigated caffeine’s resistance from termites, applying a caffeine and water solution on wood and exposing the samples to Reticulitermes flavipes (Kollar). The results of their study demonstrated that caffeine improves the biological resistance of wood. Nevertheless, as previously anticipated, this cannot demonstrate good resistance to termites of spent coffee grounds. As Cintura et al. [10] reported, collecting information from several past studies, cellulose content in this bio-waste is between 8.60–52.42%. The range of variation is high, but spent coffee grounds have the lowest values when compared with the other considered bio-wastes. This information and the results of the present work cannot confirm a high termite resistance with spent coffee grounds, also due to the mould formation during the four weeks. Maybe this bio-waste could be used as a source of caffeine to apply on future eco-efficient boards/panels.

3.5. Comparison between Bio-Wastes and Wood Chips

As previously anticipated, maritime pine chips were considered as control material. Table 10 reports a comparison between the properties of the bio-wastes and wood chips, considering their use as thermal insulation materials. It shows which properties could be considered better (in green) or worse (in orange) than maritime pine ones for thermal insulation boards. The maximum/minimum values are highlighted with stronger shades of green/orange. When they are not highlighted, there is no difference between the considered bio-waste and wood chips. When they are highlighted in grey, more considerations have to be made. It is important to remind that this work presents some screening tests and properties of bio-aggregates. The performance of the final composites will widely depend on their composition and production method.
The analysed bio-wastes have higher values of loose bulk density and thermal conductivity than maritime pine chips. This may result in composites with worse thermal insulating performances than wood-based ones. A higher loose bulk density of the aggregates could be a drawback for thermal insulation boards’ production, a benefit in case of coating panels’. The values of absorption capacity after 48 h are lower for the selected bio-wastes; hence, they may secure a higher water resistance when used in composites. For MBV, the values are higher than wood chips’ ones, except for hazelnut shells. It seems that composites produced with the bio-wastes could have a higher contribution as moisture regulators than wood-based ones, guaranteeing better passive equilibrium of indoor humidity levels. This could be a benefit in case of internal coating panels’ production, and a drawback in case of external panels or thermal insulation boards. A high MBV could affect the durability of the building composites. In terms of bio-susceptibility, the analysed bio-wastes show low resistance to mould, as well as wood chips. For termites, the outcomes of spent coffee grounds and olive press waste cannot be considered as a demonstration of high resistance: they could result from mould growth. Hazelnut shells show better resistance to termites’ attacks than wood chips, but they are not completely unaffected. For eco-efficient building products, this drawback should be further investigated and solved.
The comparison between bio-wastes allows concluding that grape press waste is the most similar to maritime pine chips. It may be a good replacement of wood particles in future boards’ production, even if many other factors play an important role (e.g., binders, production phase, treatments).
The final performance of panels and boards produced with the studied bio-wastes will strongly depend on their composition. The selected binders could both moderate or increase the benefits or the drawbacks of using these bio-wastes as aggregates. For example, for a hydraulic matrix, the use of water could cause the degradation of the bio-wastes and increase mould growth. Differently, a binder with a pH higher than 10 could guarantee less vulnerability to biological attack [51]. The thermal insulation properties could be improved by using a binder that secures the bonding of the aggregates by leaving a porous network between them.
Furthermore, the use of additives and the mixture with other material may widely affect the properties of the final product. For example, citric acid can moderate biological susceptibility and water absorption [83,84,85]. Past studies reported that boric acid, lime and potassium benzoate moderate mould growth [37,86,87]. On the other hand, they might increase the values of bulk density and thermal conductivity.
Pre-treatments of the bio-wastes may influence their properties, as Antunes et al. [33] demonstrated. As for the production methods, the curing phases [88] may be important, depending on the binder matrix. A fast and ventilated drying environment for the curing of the final product could avoid mould growth. Finally, the production process may widely affect the final properties. For example, pressing the composites increases bulk density and mechanical resistance, while just moulding could guarantee boards with lower bulk density and better thermal insulation properties.
Future studies could further investigate how all these parameters can influence eco-efficient boards and panels’ performance.

4. Conclusions

This study investigated the properties of some bio-wastes (grape and olive press waste, hazelnut shells and spent coffee grounds), available in Euro-Mediterranean countries, to evaluate the feasibility of using them as aggregates for composite boards and panels. Maritime pine chips were considered as control, simulating recycled timber. Particle size distribution, loose bulk density, thermal conductivity, water absorption and hygroscopic properties were assessed, but particularly bio susceptibility to mould and termites was also analysed. From the results obtained, the following conclusions can be drawn:
  • Grain size analysis demonstrated that shredding these bio-wastes to produce insulation boards does not seem necessary. Spent coffee grounds differ from the other bio-wastes and, for composites’ production, they might be used as fine aggregates.
  • The selected bio-wastes do not show by themselves good thermal insulation characteristics. Combining them with other materials, pre-treatments or production processes could improve the thermal insulation performance of the final products.
  • The analysed bio-wastes have good hygroscopic behaviour, with high MBV, an advantage in case of the production of indoor coating boards to secure a passive control of indoor relative humidity and comfort.
  • For all bio-wastes, the results confirmed the high biological susceptibility to the tested organisms. This drawback must be further investigated and mitigated for composites’ production, namely by combining the bio-wastes with materials resistant to biological attack or by specific pre-treatments.
  • Using the recommendations of RILEM TC 236-BBM “Bio-aggregate-based building materials” to evaluate properties of bio-wastes, considered as raw materials, allows them to be analysed and guarantees a simple comparison between different ones. However, some additional details for testing should be included, as well as complementary insect and fungi bio-susceptibility tests.
The present study both describes laboratory tests to analyse bio-wastes properties and provides a preliminary assessment of the considered ones, filling gaps in the literature. Using the selected bio-wastes as aggregates may be a competitive and more sustainable solution than the use of the traditional aggregates. Future studies will deepen the feasibility of producing eco-efficient composites and evaluate the properties of boards or panels.

Author Contributions

Conceptualization, Methodology, Validation, Investigation, Formal analysis, Data Curation, Writing—Original Draft, Visualization, E.C.; Conceptualization, Methodology, Writing—Review & Editing, Supervision, Project administration, L.N.; Investigation, Methodology, M.D.; Conceptualization, Writing—Review & Editing, Supervision, Funding acquisition, P.F. All authors have read and agreed to the published version of the manuscript.

Funding

This research was funded by the Portuguese Foundation for Science and Technology (FCT- Fundação para a Ciência e a Tecnologia), with PhD grant PD/BD/150579/2020, as part of the Eco-Construction and Rehabilitation Program (EcoCoRe).

Data Availability Statement

Data are available from the corresponding author upon request.

Acknowledgments

The authors are grateful to the CERIS research unit (project UIDB/04625/2020). The authors also acknowledge the help provided by Bruno Esteves, Polytechnic Institute of Viseu, and Susana Filipe Barreiros, NOVA School of Science and Technology, NOVA University of Lisbon, for helping in providing some of the materials analysed in this work.

Conflicts of Interest

The authors declare no conflict of interest.

References

  1. Posani, M.; Veiga, M.D.R.; Peixoto de Freitas, V.; Kompatscher, K.; Schellen, H. Dynamic Hygrothermal Models for Monumental, Historic Buildings with HVAC Systems: Complexity shown through a case study. E3S Web Conf. 2020, 172, 15007. [Google Scholar] [CrossRef]
  2. Viel, M.; Collet, F.; Lanos, C. Development and characterization of thermal insulation materials from renewable resources. Constr. Build. Mater. 2019, 214, 685–697. [Google Scholar] [CrossRef]
  3. Nguyen, D.M.; Grillet, A.; Diep, T.M.H.; Bui, Q.; Woloszyn, M. Characterization of hygrothermal insulating biomaterials modified by inorganic adsorbents. Heat Mass Transf. 2020, 56, 2473–2485. [Google Scholar] [CrossRef]
  4. Hung Anh, L.D.; Pásztory, Z. An overview of factors influencing thermal conductivity of building insulation materials. J. Build. Eng. 2021, 44, 102604. [Google Scholar] [CrossRef]
  5. Binici, H.; Aksogan, O. Eco-friendly insulation material production with waste olive seeds, ground PVC and wood chips. J. Build. Eng. 2016, 5, 260–266. [Google Scholar] [CrossRef]
  6. Ntimugura, F.; Vinai, R.; Harper, A.; Walker, P. Mechanical, thermal, hygroscopic and acoustic properties of bio-aggregates—Lime and alkali—Activated insulating composite materials: A review of current status and prospects for miscanthus as an innovative resource in the South West of England. Sustain. Mater. Technol. 2020, 26, e00211. [Google Scholar] [CrossRef]
  7. Cetiner, I.; Shea, A.D. Wood waste as an alternative thermal insulation for buildings. Energy Build. 2018, 168, 374–384. [Google Scholar] [CrossRef]
  8. Cintura, E.; Gomes, M.I. Influence of Humidity on Environmental Sustainability, Air Quality and Occupant Health. World Acad. Sci. Eng. Technol. Int. J. Environ. Ecol. Eng. 2020, 14, 8–13. [Google Scholar] [CrossRef]
  9. De Azevedo, A.R.; Amin, M.; Hadzima-Nyarko, M.; Saad Agwa, I.; Zeyad, A.M.; Tayeh, B.A.; Adesina, A. Possibilities for the application of agro-industrial wastes in cementitious materials: A brief review of the Brazilian perspective. Clean. Mater. 2022, 3, 100040. [Google Scholar] [CrossRef]
  10. Cintura, E.; Nunes, L.; Esteves, B.; Faria, P. Agro-industrial wastes as building insulation materials: A review and challenges for Euro-Mediterranean countries. Ind. Crops Prod. 2021, 171, 113833. [Google Scholar] [CrossRef]
  11. Heniegal, A.M.; Ramadan, M.A.; Naguib, A.; Agwa, I.S. Study on properties of clay brick incorporating sludge of water treatment plant and agriculture waste. Case Stud. Constr. Mater. 2020, 13, e00397. [Google Scholar] [CrossRef]
  12. Priyadarshini, M.; Giri, J.P.; Patnaik, M. Variability in the compressive strength of non-conventional bricks containing agro and industrial waste. Case Stud. Constr. Mater. 2021, 14, e00506. [Google Scholar] [CrossRef]
  13. Mahieu, A.; Alix, S.; Leblanc, N. Properties of particleboards made of agricultural by-products with a classical binder or self-bound. Ind. Crops Prod. 2019, 130, 371–379. [Google Scholar] [CrossRef]
  14. Eschenhagen, A.; Raj, M.; Rodrigo, N.; Zamora, A.; Labonne, L.; Evon, P.; Welemane, H. Investigation of Miscanthus and Sunflower Stalk Fiber-Reinforced Composites for Insulation Applications. Adv. Civ. Eng. 2019, 2019, 1–7. [Google Scholar] [CrossRef]
  15. AFNOR NF P75-101:1983; Isolants Thermiques Destinés au Bâtiment—Définition. AFNOR: Paris, France, 1983.
  16. Ali, M.; Alabdulkarem, A.; Nuhait, A.; Al-Salem, K.; Almuzaiqer, R.; Bayaquob, O.; Salah, H.; Alsaggaf, A.; Algafri, Z. Thermal analyses of loose agave, wheat straw fibers and agave/wheat straw as new hybrid thermal insulating materials for buildings. J. Nat. Fibers 2020, 18, 2173–2188. [Google Scholar] [CrossRef]
  17. Nunes, L.; Cintura, E.; Parracha, J.L.; Fernandes, B.; Silva, V.; Faria, P. Cement-Bonded Particleboards with Banana Pseudostem Waste: Physical Performance and Bio-Susceptibility. Infrastructures 2021, 6, 86. [Google Scholar] [CrossRef]
  18. Wong, M.C.; Hendrikse, S.I.S.; Sherrell, P.C.; Ellis, A.V. Grapevine waste in sustainable hybrid particleboard production. Waste Manag. 2020, 118, 501–509. [Google Scholar] [CrossRef]
  19. Binici, H.; Aksogan, O.; Dıncer, A.; Luga, E.; Eken, M.; Isikaltun, O. The possibility of vermiculite, sunflower stalk and wheat stalk using for thermal insulation material production. Therm. Sci. Eng. Prog. 2020, 18, 100567. [Google Scholar] [CrossRef]
  20. Liuzzi, S.; Rubino, C.; Martellotta, F.; Stefanizzi, P.; Casavola, C.; Pappalettera, G. Characterization of biomass-based materials for building applications: The case of straw and olive tree waste. Ind. Crops Prod. 2020, 147, 112229. [Google Scholar] [CrossRef]
  21. Pavelek, M.; Adamová, T. Bio-waste thermal insulation panel for sustainable building construction in steady and unsteady-state conditions. Materials 2019, 12, 2004. [Google Scholar] [CrossRef] [Green Version]
  22. Mati-Baouche, N.; De Baynast, H.; Lebert, A.; Sun, S.; Lopez-Mingo, C.J.S.; Leclaire, P.; Michaud, P. Mechanical, thermal and acoustical characterizations of an insulating bio-based composite made from sunflower stalks particles and chitosan. Ind. Crops Prod. 2014, 58, 244–250. [Google Scholar] [CrossRef] [Green Version]
  23. Pásztory, Z.; Ronyecz Mohácsiné, I.; Börcsök, Z. Investigation of thermal insulation panels made of black locust tree bark. Constr. Build. Mater. 2017, 147, 733–735. [Google Scholar] [CrossRef]
  24. Binici, H.; Aksogan, O.; Demirhan, C. Mechanical, thermal and acoustical characterizations of an insulation composite made of bio-based materials. Sustain. Cities Soc. 2016, 20, 17–26. [Google Scholar] [CrossRef]
  25. Wang, C.G.; Zhang, S.G.; Wu, H. Performance of Cement Bonded Particleboards Made from Grapevine. Adv. Mater. Res. 2013, 631–632, 765–770. [Google Scholar] [CrossRef]
  26. Kusumah, S.S.; Umemura, K.; Yoshioka, K.; Miyafuji, H.; Kanayama, K. Utilization of sweet sorghum bagasse and citric acid for manufacturing of particleboard I: Effects of pre-drying treatment and citric acid content on the board properties. Ind. Crops Prod. 2016, 84, 34–42. [Google Scholar] [CrossRef] [Green Version]
  27. Buratti, C.; Belloni, E.; Lascaro, E.; Merli, F.; Ricciardi, P. Rice husk panels for building applications: Thermal, acoustic and environmental characterization and comparison with other innovative recycled waste materials. Constr. Build. Mater. 2018, 171, 338–349. [Google Scholar] [CrossRef]
  28. Viel, M.; Collet, F.; Lanos, C. Chemical and multi-physical characterization of agro-resources’ by-product as a possible raw building material. Ind. Crops Prod. 2018, 120, 214–237. [Google Scholar] [CrossRef]
  29. Cintura, E.; Nunes, L.; Faria, P. Characterization of agro-wastes to be used as aggregates for eco-efficient insulation boards. In Proceedings of the CEES 2021—International Conference on Construction, Energy, Environment and Sustainability, Coimbra, Portugal, 12–15 October 2021; ISBN 978-989-54499-1-0. [Google Scholar]
  30. Amziane, S.; Collet, F.; Lawrence, M.; Magniont, C.; Picandet, V.; Sonebi, M. Recommendation of the RILEM TC 236-BBM: Characterisation testing of hemp shiv to determine the initial water content, water absorption, dry density, particle size distribution and thermal conductivity. Mater. Struct. 2017, 50, 167. [Google Scholar] [CrossRef] [Green Version]
  31. Page, J.; Sonebi, M.; Amziane, S. Design and multi-physical properties of a new hybrid hemp-flax composite material. Constr. Build. Mater. 2017, 139, 502–512. [Google Scholar] [CrossRef] [Green Version]
  32. Laborel-Préneron, A.; Magniont, C.; Aubert, J.-E. Characterization of barley straw, hemp shiv and corn cob as resources for bioaggregate based building materials. Waste Biomass Valorization 2017, 9, 1095–1112. [Google Scholar] [CrossRef]
  33. Antunes, A.; Faria, P.; Silva, V.; Brás, A. Rice husk-earth based composites: A novel bio-based panel for buildings refurbishment. Constr. Build. Mater. 2019, 221, 99–108. [Google Scholar] [CrossRef]
  34. Barbieri, V.; Lassinantti Gualtieri, M.; Siligardi, C. Wheat husk: A renewable resource for bio-based building materials. Constr. Build. Mater. 2020, 251, 118909. [Google Scholar] [CrossRef]
  35. Gradeci, K.; Labonnote, N.; Time, B.; Köhler, J. Mould growth criteria and design avoidance approaches in wood-based materials—A systematic review. Constr. Build. Mater. 2017, 150, 77–88. [Google Scholar] [CrossRef]
  36. Tobon, A.M.; Andres, Y.; Locoge, N. Impacts of test methods on the assessment of insulation materials’ resistance against moulds. Build. Environ. 2020, 179, 106963. [Google Scholar] [CrossRef]
  37. Palumbo, M.; Lacasta, A.M.; Navarro, A.; Giraldo, M.P.; Lesar, B. Improvement of fire reaction and mould growth resistance of a new bio-based thermal insulation material. Constr. Build. Mater. 2017, 139, 531–539. [Google Scholar] [CrossRef] [Green Version]
  38. Viel, M.; Collet, F.; Lecieux, Y.; François, M.L.M.; Colson, V.; Lanos, C.; Hussain, A.; Lawrence, M. Resistance to mold development assessment of bio-based building materials. Compos. Part B Eng. 2019, 158, 406–418. [Google Scholar] [CrossRef]
  39. Ginestet, S.; Aschan-Leygonie, C.; Bayeux, T.; Keirsbulck, M. Mould in indoor environments: The role of heating, ventilation and fuel poverty. A French perspective. Build. Environ. 2020, 169, 106577. [Google Scholar] [CrossRef]
  40. Ewart, D.; Nunes, L.; De Troya, T.; Kutnik, M.; Dhang, P. Termites and a changing climate. In Climate Change Impacts on Urban Pests; Dhang, P., Ed.; CAB International: Wallingford, UK, 2016; pp. 80–94. [Google Scholar]
  41. Duarte, S.; Nunes, L.; Kržišnik, D.; Humar, M.; Jones, D. Influence of zwitterionic buffer effects with thermal modification treatments of wood on symbiotic protists in reticulitermes grassei clément. Insects 2021, 12, 139. [Google Scholar] [CrossRef]
  42. Echeverria, M.C.; Nuti, M. Valorisation of the Residues of Coffee Agro-industry: Perspectives and Limitations. Open Waste Manag. J. 2017, 10, 13–22. [Google Scholar] [CrossRef] [Green Version]
  43. Pedras, B.M.; Regalin, G.; Sá-Nogueira, I.; Simões, P.; Paiva, A.; Barreiros, S. Fractionation of red wine grape pomace by subcritical water extraction/hydrolysis. J. Supercrit. Fluids 2020, 160, 104793. [Google Scholar] [CrossRef]
  44. Demirer, H.; Kartal, İ.; Yıldırım, A.; Büyükkaya, K. The Utilisability of Ground Hazelnut Shell as Filler in Polypropylene Composites. Acta Phys. Pol. A 2018, 134, 254–256. [Google Scholar] [CrossRef]
  45. PANTONE Uncoated RGB Scale. Available online: https://www.ab-pulverlacke.de/pdf/sonderfarbton/pantone.pdf (accessed on 23 June 2021).
  46. EN 933-2; Tests for Geometrical Properties of Aggregates. Determination of Particle Size Distribution. Test Sieves, Nominal Size of Apertures. CEN: Brussels, Belgium, 2020.
  47. EN 1097-3; Tests for Mechanical and Physical Properties of Aggregates Part 3: Determination of Loose Bulk Density and Voids. CEN: Brussels, Belgium, 1998.
  48. ISO 24353; Hygrothermal Performance of Building Materials and Products—Determination of Moisture Adsorption/Desorption Properties in Response to Humidity Variation. International Organization for Standardization: Geneva, Switzerland, 2008.
  49. Rode, C.; Peuhkuri, R.H.; Mortensen, L.H.; Hansen, K.K.; Time, B.; Gustavsen, A.; Ojanen, T.; Ahonen, J.; Svennberg, K.; Arfvidsson, J.; et al. Moisture Buffering of Building Materials; (BYG Report No. R-127); Technical University of Denmark, Department of Civil Engineering: Lyngby, Denmark, 2005; ISBN 8778771951. [Google Scholar]
  50. ASTM D5590-17; Determining the Resistance of Paint Films and Related Coatings to Fungal Defacement by Accelerated Four-Week Agar Plate Assay. ASTM International: Pennsylvania, PA, USA, 2017.
  51. Parracha, J.L.; Borsoi, G.; Flores-Colen, I.; Veiga, R.; Nunes, L.; Dionísio, A.; Gomes, M.G.; Faria, P. Performance parameters of ETICS: Correlating water resistance, bio-susceptibility and surface properties. Constr. Build. Mater. 2021, 272, 121956. [Google Scholar] [CrossRef]
  52. Nunes, L.; Duarte, S. Termiticide Transmission Test. CEN/TC38/WG24 Round Robin Test; Test Report 007UPB2017; LNEC: Lisbon, Portugal, 2017; 6p. [Google Scholar]
  53. Posani, M.; Veiga, R.; de Freitas, V.P. Thermal mortar-based insulation solutions for historic walls: An extensive hygrothermal characterization of materials and systems. Constr. Build. Mater. 2022, 315, 125640. [Google Scholar] [CrossRef]
  54. Czajkowski, Ł.; Kocewicz, R.; Weres, J.; Olek, W. Estimation of Thermal Properties of Straw-Based Insulating Panels. Materials 2022, 15, 1073. [Google Scholar] [CrossRef]
  55. Ranesi, A.; Veiga, M.R.V.; Faria, P. Laboratory characterization of relative humidity dependent properties for plasters: A systematic review. Constr. Build. Mater. 2021, 304, 124595. [Google Scholar] [CrossRef]
  56. Collet, F. Hygric and thermal properties of bio-aggregate based building materials. In RILEM State-of-the-Art Reports; Springer: Dordrecht, The Netherlands, 2017; Volume 23, pp. 125–147. ISBN 9789402410310. [Google Scholar]
  57. Martínez-García, C.; González-Fonteboa, B.; Carro-López, D.; Pérez-Ordóñez, J.L. Mussel shells: A canning industry by-product converted into a bio-based insulation material. J. Clean. Prod. 2020, 269, 122343. [Google Scholar] [CrossRef]
  58. Ansell, M.P.; Lawrence, M.; Jiang, Y.; Shea, A.; Hussain, A.; Calabria-Holley, J.; Walker, P. Natural plant-based aggregates and bio-composite panels with low thermal conductivity and high hygrothermal efficiency for applications in construction. In Nonconventional and Vernacular Construction Materials; Elsevier: Sawston, UK, 2020; pp. 217–245. ISBN 9780081027042. [Google Scholar]
  59. David, G.; Vannini, M.; Sisti, L.; Marchese, P.; Celli, A.; Gontard, N.; Angellier-Coussy, H. Eco-Conversion of Two Winery Lignocellulosic Wastes into Fillers for Biocomposites: Vine Shoots and Wine Pomaces. Polymers 2020, 12, 1530. [Google Scholar] [CrossRef]
  60. Çöpür, Y.; Güler, C.; Akgül, M.; Taşçıoğlu, C. Some chemical properties of hazelnut husk and its suitability for particleboard production. Build. Environ. 2007, 42, 2568–2572. [Google Scholar] [CrossRef]
  61. Liuzzi, S.; Rubino, C.; Stefanizzi, P.; Petrella, A.; Boghetich, A.; Casavola, C.; Pappalettera, G. Hygrothermal properties of clayey plasters with olive fibers. Constr. Build. Mater. 2018, 158, 24–32. [Google Scholar] [CrossRef]
  62. Del Río Merino, M.; Guijarro Rodríguez, J.; Fernández Martínez, F.; Santa Cruz Astorqui, J. Viability of using olive stones as lightweight aggregate in construction mortars. Rev. Constr. 2017, 16, 431–438. [Google Scholar] [CrossRef] [Green Version]
  63. Massaro Sousa, L.; Ferreira, M.C. Spent coffee grounds as a renewable source of energy: An analysis of bulk powder flowability. Particuology 2019, 43, 92–100. [Google Scholar] [CrossRef]
  64. Cherki, A.; Remy, B.; Khabbazi, A.; Jannot, Y.; Baillis, D. Experimental thermal properties characterization of insulating cork—gypsum composite. Constr. Build. Mater. 2014, 54, 202–209. [Google Scholar] [CrossRef]
  65. Brás, A.; Leal, M.; Faria, P. Cement-cork mortars for thermal bridges correction. Comparison with cement-EPS mortars performance. Constr. Build. Mater. 2013, 49, 315–327. [Google Scholar] [CrossRef]
  66. Nóvoa, P.J.R.; Ribeiro, M.C.; Ferreira, A.J.; Marques, A. Mechanical characterization of lightweight polymer mortar modified with cork granulates. Compos. Sci. Technol. 2004, 64, 2197–2205. [Google Scholar] [CrossRef]
  67. Brouard, Y.; Belayachi, N.; Hoxha, D.; Ranganathan, N.; Méo, S. Mechanical and hygrothermal behavior of clay—Sunflower (Helianthus annuus) and rape straw (Brassica napus) plaster bio-composites for building insulation. Constr. Build. Mater. 2018, 161, 196–207. [Google Scholar] [CrossRef]
  68. Çuhadaroğlu, B. Thermal conductivity analysis of a briquette with additive hazelnut shells. Build. Environ. 2005, 40, 942–948. [Google Scholar] [CrossRef]
  69. Lachheb, A.; Allouhi, A.; El Marhoune, M.; Saadani, R.; Kousksou, T.; Jamil, A.; Rahmoune, M.; Oussouaddi, O. Thermal insulation improvement in construction materials by adding spent coffee grounds: An experimental and simulation study. J. Clean. Prod. 2019, 209, 1411–1419. [Google Scholar] [CrossRef]
  70. Gomes, M.G.; Flores-Colen, I.; Melo, H.; Soares, A. Physical performance of industrial and EPS and cork experimental thermal insulation renders. Constr. Build. Mater. 2019, 198, 786–795. [Google Scholar] [CrossRef]
  71. Bouasker, M.; Belayachi, N.; Hoxha, D.; Al-Mukhtar, M. Physical characterization of natural straw fibers as aggregates for construction materials applications. Materials 2014, 7, 3034–3048. [Google Scholar] [CrossRef] [Green Version]
  72. Romano, A.; Bras, A.; Grammatikos, S.; Shaw, A.; Riley, M. Dynamic behaviour of bio-based and recycled materials for indoor environmental comfort. Constr. Build. Mater. 2019, 211, 730–743. [Google Scholar] [CrossRef] [Green Version]
  73. Holcroft, N.; Shea, A. Effect of compaction on moisture buffering of hemp-lime insulation. First Int. Conf. Bio-Based Build. Mater. 2015, 33, 542–546. [Google Scholar]
  74. Stefanowski, B.K.; Curling, S.F.; Ormondroyd, G.A. A rapid screening method to determine the susceptibility of bio-based construction and insulation products to mould growth. Int. Biodeterior. Biodegrad. 2017, 116, 124–132. [Google Scholar] [CrossRef] [Green Version]
  75. Kwaśniewska-Sip, P.; Cofta, G.; Nowak, P.B. Resistance of fungal growth on Scots pine treated with caffeine. Int. Biodeterior. Biodegrad. 2018, 132, 178–184. [Google Scholar] [CrossRef]
  76. Šimůnková, K.; Reinprecht, L.; Nábělková, J.; Hýsek, Š.; Kindl, J.; Borůvka, V.; Lišková, T.; Šobotník, J.; Pánek, M. Caffeine—perspective natural biocide for wood protection against decaying fungi and termites. J. Clean. Prod. 2021, 304, 127110. [Google Scholar] [CrossRef]
  77. Barbero-López, A.; Ochoa-Retamero, A.; López-Gómez, Y.; Vilppo, T.; Venäläinen, M.; Lavola, A.; Julkunen-Tiitto, R.; Haapala, A. Activity of spent coffee ground cinnamates against wood-decaying fungi in vitro. BioResources 2018, 13, 6555–6564. [Google Scholar] [CrossRef]
  78. Andreola, F.; Borghi, A.; Pedrazzi, S.; Allesina, G.; Tartarini, P.; Lancellotti, I.; Barbieri, L. Spent coffee grounds in the production of lightweight clay ceramic aggregates in view of urban and agricultural sustainable development. Materials 2019, 12, 3581. [Google Scholar] [CrossRef] [Green Version]
  79. Murthy, P.S.; Madhava Naidu, M. Sustainable management of coffee industry by-products and value addition—A review. Resour. Conserv. Recycl. 2012, 66, 45–58. [Google Scholar] [CrossRef]
  80. Wang, X.; Li, H.; Cao, Y.; Tang, Q. Cellulose extraction from wood chip in an ionic liquid 1-allyl-3-methylimidazolium chloride (AmimCl). Bioresour. Technol. 2011, 102, 7959–7965. [Google Scholar] [CrossRef]
  81. Cotana, F.; Cavalaglio, G.; Gelosia, M.; Nicolini, A.; Coccia, V.; Petrozzi, A. Production of Bioethanol in a Second Generation Prototype from Pine Wood Chips. Energy Procedia 2014, 45, 42–51. [Google Scholar] [CrossRef] [Green Version]
  82. Karunanithy, C.; Muthukumarappan, K.; Gibbons, W.R. Extrusion Pretreatment of Pine Wood Chips. Appl. Biochem. Biotechnol. 2012, 167, 81–99. [Google Scholar] [CrossRef]
  83. Indrayani, Y.; Setyawati, D.; Munawar, S.S.; Umemura, K.; Yoshimura, T. Evaluation of Termite Resistance of Medium Density Fiberboard (MDF) Manufacture from Agricultural Fiber Bonded with Citric Acid. Procedia Environ. Sci. 2015, 28, 778–782. [Google Scholar] [CrossRef] [Green Version]
  84. Widyorini, R.; Umemura, K.; Isnan, R.; Putra, D.R.; Awaludin, A.; Prayitno, T.A. Manufacture and properties of citric acid-bonded particleboard made from bamboo materials. Eur. J. Wood Wood Prod. 2016, 74, 57–65. [Google Scholar] [CrossRef]
  85. Nataraj, D.; Sakkara, S.; Meenakshi, H.N.; Reddy, N. Properties and applications of citric acid crosslinked banana fibre-wheat gluten films. Ind. Crops Prod. 2018, 124, 265–272. [Google Scholar] [CrossRef]
  86. Santos, T.; Nunes, L.; Faria, P. Production of eco-efficient earth-based plasters: Influence of composition on physical performance and bio-susceptibility. J. Clean. Prod. 2017, 167, 55–67. [Google Scholar] [CrossRef] [Green Version]
  87. De Carvalho, P.S.; Nora, M.D.; da Rosa, L.C. Development of an acoustic absorbing material based on sunflower residue following the cleaner production techniques. J. Clean. Prod. 2020, 270, 122478. [Google Scholar] [CrossRef]
  88. Cabral, M.R.; Nakanishi, E.Y.; Mármol, G.; Palacios, J.; Godbout, S.; Lagacé, R.; Savastano, H.; Fiorelli, J. Potential of Jerusalem Artichoke (Helianthus tuberosus L.) stalks to produce cement-bonded particleboards. Ind. Crops Prod. 2018, 122, 214–222. [Google Scholar] [CrossRef]
Figure 1. Bio-wastes size and colour scale after air drying: (a) grape press waste; (b) hazelnut shells; (c) olive press waste; (d) spent coffee grounds; (e) maritime pine chips.
Infrastructures 07 00026 g001
Figure 2. (a) Points where thermal conductivity was calculated; (b) Method to calculate thermal conductivity (adapted from Cintura et al. [29]).
Infrastructures 07 00026 g002
Figure 3. Particle size distribution of the tested bio-wastes and the wood chips.
Infrastructures 07 00026 g003
Figure 4. Correlation between thermal conductivity and RH of the tested bio-wastes.
Infrastructures 07 00026 g004
Figure 5. Correlation between thermal conductivity and loose bulk density of bio-wastes, compared with some literature values: Page et al. [31]. Laborel-Préneron et al. [32], Antunes et al. [33], Ansell et al. [58] and Cherki et al. [64].
Infrastructures 07 00026 g005
Figure 6. Water absorption as a function of time, tested according to Amziane et al. [30].
Infrastructures 07 00026 g006
Figure 7. Variation of water absorption during time considering the ratio of the volume of absorbed water and the volume of the material.
Infrastructures 07 00026 g007
Figure 8. Moisture adsorption/desorption content for four cycles between 50% and 75% RH.
Infrastructures 07 00026 g008
Figure 9. Mould growth (test with culture media) after four weeks: (a) grape press waste; (b) hazelnut shells; (c) olive press waste; (d) spent coffee grounds (e) wood chips; (f) filter paper control.
Infrastructures 07 00026 g009
Figure 10. Mould growth (test without culture media) after four weeks of exposure: (a) grape press waste; (b) hazelnut shells; (c) olive press waste; (d) spent coffee grounds; (e) wood chips.
Infrastructures 07 00026 g010
Figure 11. Termites’ survival and mould growth after four weeks exposure: (a) grape press waste; (b) hazelnut shells; (c) olive press waste; (d) spent coffee grounds; (e) wood chips.
Infrastructures 07 00026 g011
Table 1. Particle size of bio-aggregates already studied for boards’ production.
ReferencesDescriptionParticle Size (mm)
Wong et al. [18] Particleboard of grapevine and pine chips (0.25–1.00 mm particles used for the surface layer; 1.00–6.00 mm for the core) and mixed with melamine modified urea-formaldehyde (MUF). Three layers were formed, and hot-pressed (T = 170 °C, pressure = 3.6 MPa, time = 5 min). 0.25–6.00
Binici et al. [19] Insulation composite of sunflower stalk fibre, sunflower stalk sponge and wheat stalks shredded to reach dimensions of 5–10 mm, vermiculite and gypsum as a binder. Materials were dry mixed, the water was added, and the fresh mortars were placed in moulds in three layers and compacted. 5–10
Liuzzi et al. [20] Insulation composite of straw fibres (size = 30 mm) and olive fibres (size = 20 mm) mixed with a sodium silicate solution Na2 On (SiO2) without pressing. The materials were cured at environmental conditions for 28 days and finally dried at 50 °C until constant mass. 20–30
Eschenhagen et al. [14] Insulation composite of Miscanthus and sunflower stalk fibre grounded with a 1.5 cm screen and sieved to obtain fibres equal or bigger than 10 mm, starch-based binder, wood glue made of casein and bone glue made of gelatine. ≥10
Pavelek and Adamová [21] Insulation boards consisted of a premanufactured panel filled with shredded rapeseed (Brassica napus) and woodchips from coniferous trees (sandwich panel). <0.25–8
Mati-Baouche et al. [22] Insulation composite of sunflower stalks (shredded and sieved to obtain particle size between 1 and 6.3 mm) and chitosan from shrimp shell. The materials were mixed, pressed at 20 °C for 1 min (pressure between 1 × 10⁻³ − 32 × 10−3 MPa) and then dried in an oven (T 50 °C, time = 50 h).1–6.3
Pásztory et al. [23]Insulation composite of chipped black locust (Robinia pseudoacacia) tree bark and urea-formaldehyde (UF) based resin, by pressing at T = 120 °C for 6 s per final mm thickness. <1–45
Binici et al. [24] Insulation composite of corn stalks (particle size between 0.5–4 mm), epoxy resin, gypsum and Portland cement (CEM I 42.5). Materials were mixed for 5 min, compacted (T = 20 °C, time = 1 min, pressure = 0.07–0.27 MPa) and dried at 50 °C for 50 h. 0.5–4
Wang et al. [25] Cement-bonded particleboard made up shredded grapevine stalk, cement and 3% calcium chloride (CaCl2) by weight of cement. The boards were cold pressed (pressure = 1.25MPa, time = 8 h) and then conditioned at T = (20 ± 2) °C, RH = (65 ± 5)% for 28 days.9–80
Kusumah et al. [26] Particleboard of sweet sorghum (Sorghum bicolor L. Monech) bagasse and citric acid dissolved in water as adhesive. Citric acid was sprayed onto the dried particles and the boards are hot-pressed (T = 200 °C, time = 10 min, maximum pressure = 6.5 MPa). 0.9–5.9
Buratti et al. [27] Panels of rice husk (length 9 mm, width of 1 mm) and cold-water-based polyurethane glue (density = 1000 kg/m3). For comparison samples of cork (size 0.8 mm–1 mm) and glue were fabricated (they were cured at T = 100 °C, time between 90–120 min).9
0.8–1
Table 2. Summary of laboratory tested properties, samples, considered/adapted references and standards.
PropertiesSamplesReferences and ContributionDescriptionStrengthsLimitations
Physical propertiesParticle size distribution3 samples of 100 g of the materialsAmziane et al. [30] described the method and reported EN 933-2 [46] Sieving methods by using 200 mm diameter sievesWidely used method: easier comparison between different aggregates considering the same laboratory testSieving time is not specified; for the considered agro-industrial wastes, a sample of 45 ± 10 g in case of 200 mm diameter sieves is too small
Loose bulk densityCylindrical glass (diameter = 6 cm height = 11 cm) filled with 3 samples of the materialAmziane et al. [30] introduced the method; Laborel-Préneron et al. [32] provided a detailed description tooBy considering aggregates’ weight and the corresponding volume of waterApplicability to different bio-aggregatesIt could be less rapid and immediate than EN 1097-3 [47] (replacement of the volume of aggregate with a volume of water)
Cylindrical plastic container (100 mL) filled with 3 samples of the materialEN 1097-3 [47] described the laboratory testThe ratio between mass and volumeFast laboratory testNot specific for bio-aggregates
Thermal conductivity5 different points of the surface of an open container (diameter = 18.50 cm, high = 5.80 cm) filled with the materialAntunes et al. [33] evaluated the thermal conductivity of bio-aggregates by using the transient method; Liuzzi et al. [20] described its advantages and reasons to use itTransient methodPossibility of analysing small samples (faster stabilization at different RH) and loose aggregatesFast evaluation; the results could be as not precise as other methods (e.g., heat flow)
Water absorption3 samples of 25 g of the materialsAmziane et al. [30] introduced the method; use and details are described by Laborel-Préneron et al. [32] Difference between dry and wet massPossibility of testing loose aggregatesNo specification of opening mesh (permeable bag could be better described) and of water’s temperature; possible compaction of the aggregates; rotation speed should be automatically controlled
Sorption/desorption properties3 plastic box (11.0 cm × 14.8 cm, high = 2 cm) with an open-top surface filled with the materialsISO 24353 [48] described the laboratory test; Rode et al. [49] provided the MBV classificationSamples at different RHSame sorption/desorption time (12 h); not developed considering indoor conditions in a specific area (differently from Rode et al. [49])The lack of a numeric classification in ISO 24353 [48] makes difficult the comparison between different aggregates and the discussion of the results
Bio susceptibilityMould5 + 5 Petri dishes (diameter = 9 cm) filled with similar volumes of materials. Two exposure methodsASTM D5590-17 [50] provided information about the test and the evaluation; Parracha et al. [51] detailed the adaptations to the materialEvaluation of contaminated surfaceDifferent exposure methods could be considered; the control secures the validation of the testsSubjective/visual evaluation
Termites3 Petri dishes (diameter = 9 cm), moistened calibrated sand on one side and similar volumes of materials on the otherNunes and Duarte [52] provided information to develop the testTermites’ survivalInnovative laboratory test to analyse loose aggregatesControl of moulds development for high sugar content materials
Table 3. Rate of mould growth adapted from ASTM D5590-17 [50].
RatingDescriptionContaminated Surface (%)
0None0
1Traces of growth<10
2Light growth10 to 30
3Moderate growth30 to 60
4Heavy growth>60
Table 5. Thermal conductivity of the analysed bio-wastes and comparison with literature values.
MaterialThermal Conductivity (W/(m·K))Literature Values (W/(m·K))References
T = 23 °C, RH = 50%T = 23 °C, RH = 70%
Grape press waste0.078 ± 0.0020.081 ± 0.002-
Hazelnut shells0.107 ± 0.0030.115 ± 0.0030.1Çuhadaroğlu [68]
Olive press waste0.089 ± 0.0040.097 ± 0.003-
Spent coffee grounds0.092 ± 0.0020.099 ± 0.0050.2Lachheb et al. [69]
Wood chips0.077 ± 0.0010.082 ± 0.0020.0568–0.0629 aCetiner and Shea [7]
a Materials particle size between 1 mm–4 mm, conditioned at RH = 50%.
Table 6. Water absorption of the bio-wastes after 48 h of immersion.
Bio-WasteAbsorption after 48 h (%)
Grape press waste89.7 ± 1.2
Hazelnut shells 35.5 ± 2.2
Olive press waste 49.3 ± 2.1
Spent coffee grounds60.1 ± 6.0
Wood chips 108.7 ± 5.6
Table 7. MBV of analysed bio-wastes classified according to Rode et al. [49].
MaterialsMBV
(g/(m2·% RH))
Classification according to
Rode et al. [49]
Grape press waste3.54 ± 0.09Excellent
Hazelnut shells3.13 ± 0.16Excellent
Olives press waste4.38 ± 0.13Excellent
Spent coffee grounds3.44 ± 0.01Excellent
Wood chips3.10 ± 0.06Excellent
Table 8. Average rate (±standard deviation) of mould growth for the samples without culture media.
MaterialMould Development
Week 1Week 2Week 3Week 4
Spent coffee grounds2.20 (±0.45)3.004.004.00
Grape press waste3.004.004.004.00
Olive press waste3.004.004.004.00
Hazelnut shells0.40 (±0.55)2.30 (±0.45)3.004.00
Wood chips0.40 (±0.55)1.40 (±0.55)1.80 (±0.45)2.70 (±0.67)
Table 9. Average rate (±standard deviation) of survival of R. grassei colonies for the bio-wastes.
MaterialSurvival Rate (%)Mould Development *
Spent coffee grounds0.00Extensive
Grape press waste63.33 (±27.30)Limited
Olives press waste0.00Extensive
Hazelnut shells10.67 (±9.45)Limited
Wood chips81.33 (±4.62)Limited
* Visually and qualitatively evaluated after four weeks.
Table 10. Comparison between values of considered bio-wastes and maritime pine chips for thermal insulation boards.
PropertiesMaterials
Wood ChipsGrape Press WasteHazelnut ShellsOlives Press WasteSpent Coffee Grounds
Loose bulk density (kg/m3)245.14343.88550.5449.43478.81
Thermal conductivity T = 23 °C, RH = 50% (W/(m·K))0.0770.0780.1070.0890.092
Thermal conductivity T = 23 °C, RH = 75% (W/(m·K))0.0820.0810.1150.0970.099
Absorption capacity after 48 h (%)108.789.735.549.360.1
MBV (g/(m2·% RH)) *3.023.52.944.183.38
Bio-susceptibility to mould with culture media44444
Bio-susceptibility to mould without culture media2.74444
Bio-susceptibility to termites—Survival rate (%)81.3363.3310.67n.a. *n.a. *
* Note: MBV—see detailed evaluation below; n.a. not available—the results need confirmation.
Publisher’s Note: MDPI stays neutral with regard to jurisdictional claims in published maps and institutional affiliations.

