GIS-Based Spatial Analysis of Accident Hotspots: A Nigerian Case Study
Abstract
1. Introduction
2. Review of Spatial Analysis Methods
2.1. Comparison of Various Methods of Hotspot Analysis
2.2. Theoretical Analysis
2.2.1. Mean Center Analysis
2.2.2. Kernel Density Estimation
2.2.3. Cluster Analysis
2.2.4. Hotspot Analysis
3. Data Collection and Analysis
3.1. Study Route
3.2. Data Collection
3.3. GIS-Based Analysis
4. Analysis and Results
4.1. Accident Severity, Contributory Causes, and Locations
4.2. Spatial Distribution of Accidents
4.2.1. Mean Center Analysis
4.2.2. Density Analysis
4.2.3. Cluster Analysis
4.2.4. Hotspot Analysis
4.3. Traffic Exposure
4.4. Geometric Characteristics of Hotspots
5. Discussion
6. Conclusions
- This study has contributed to the body of literature by showing the viability of the fishnet polygon and spatial weight matrix for the aggregation of accident locations and conceptualization of the spatial relationships among accident locations on a highway network. This is similar to the use of the SANET tool. The distance between features was measured within the network, rather than the ordinary Euclidean distances.
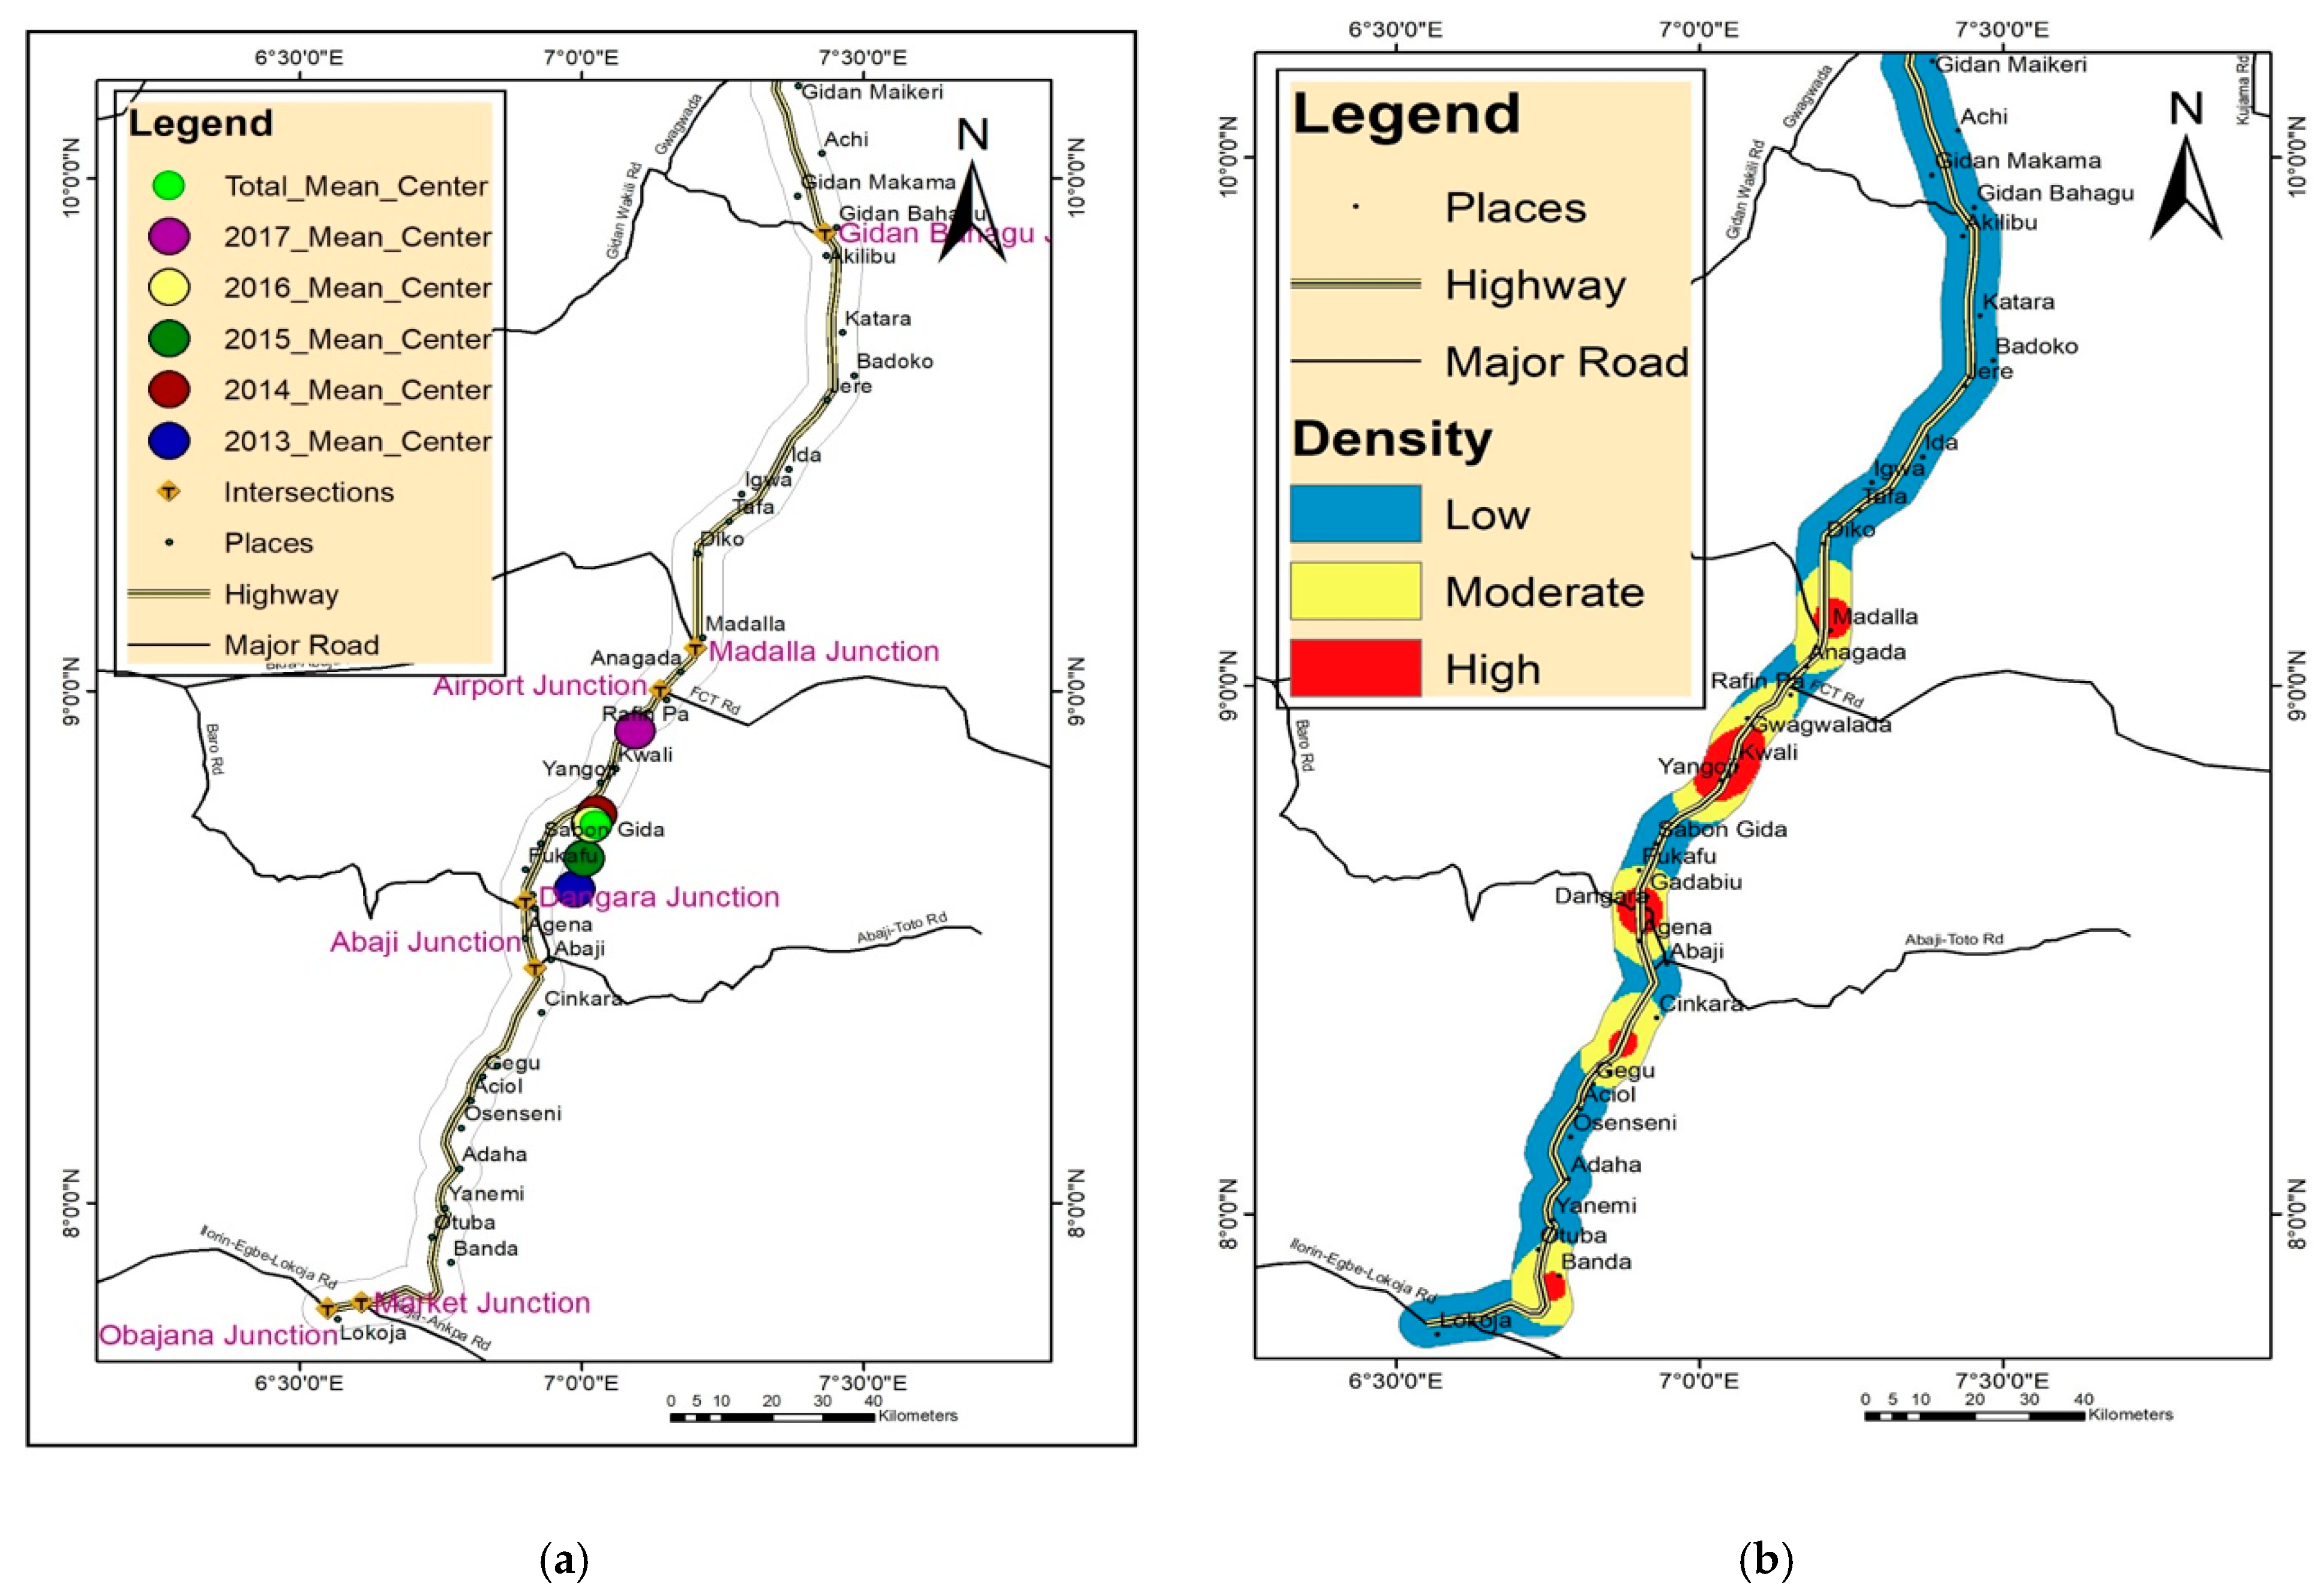
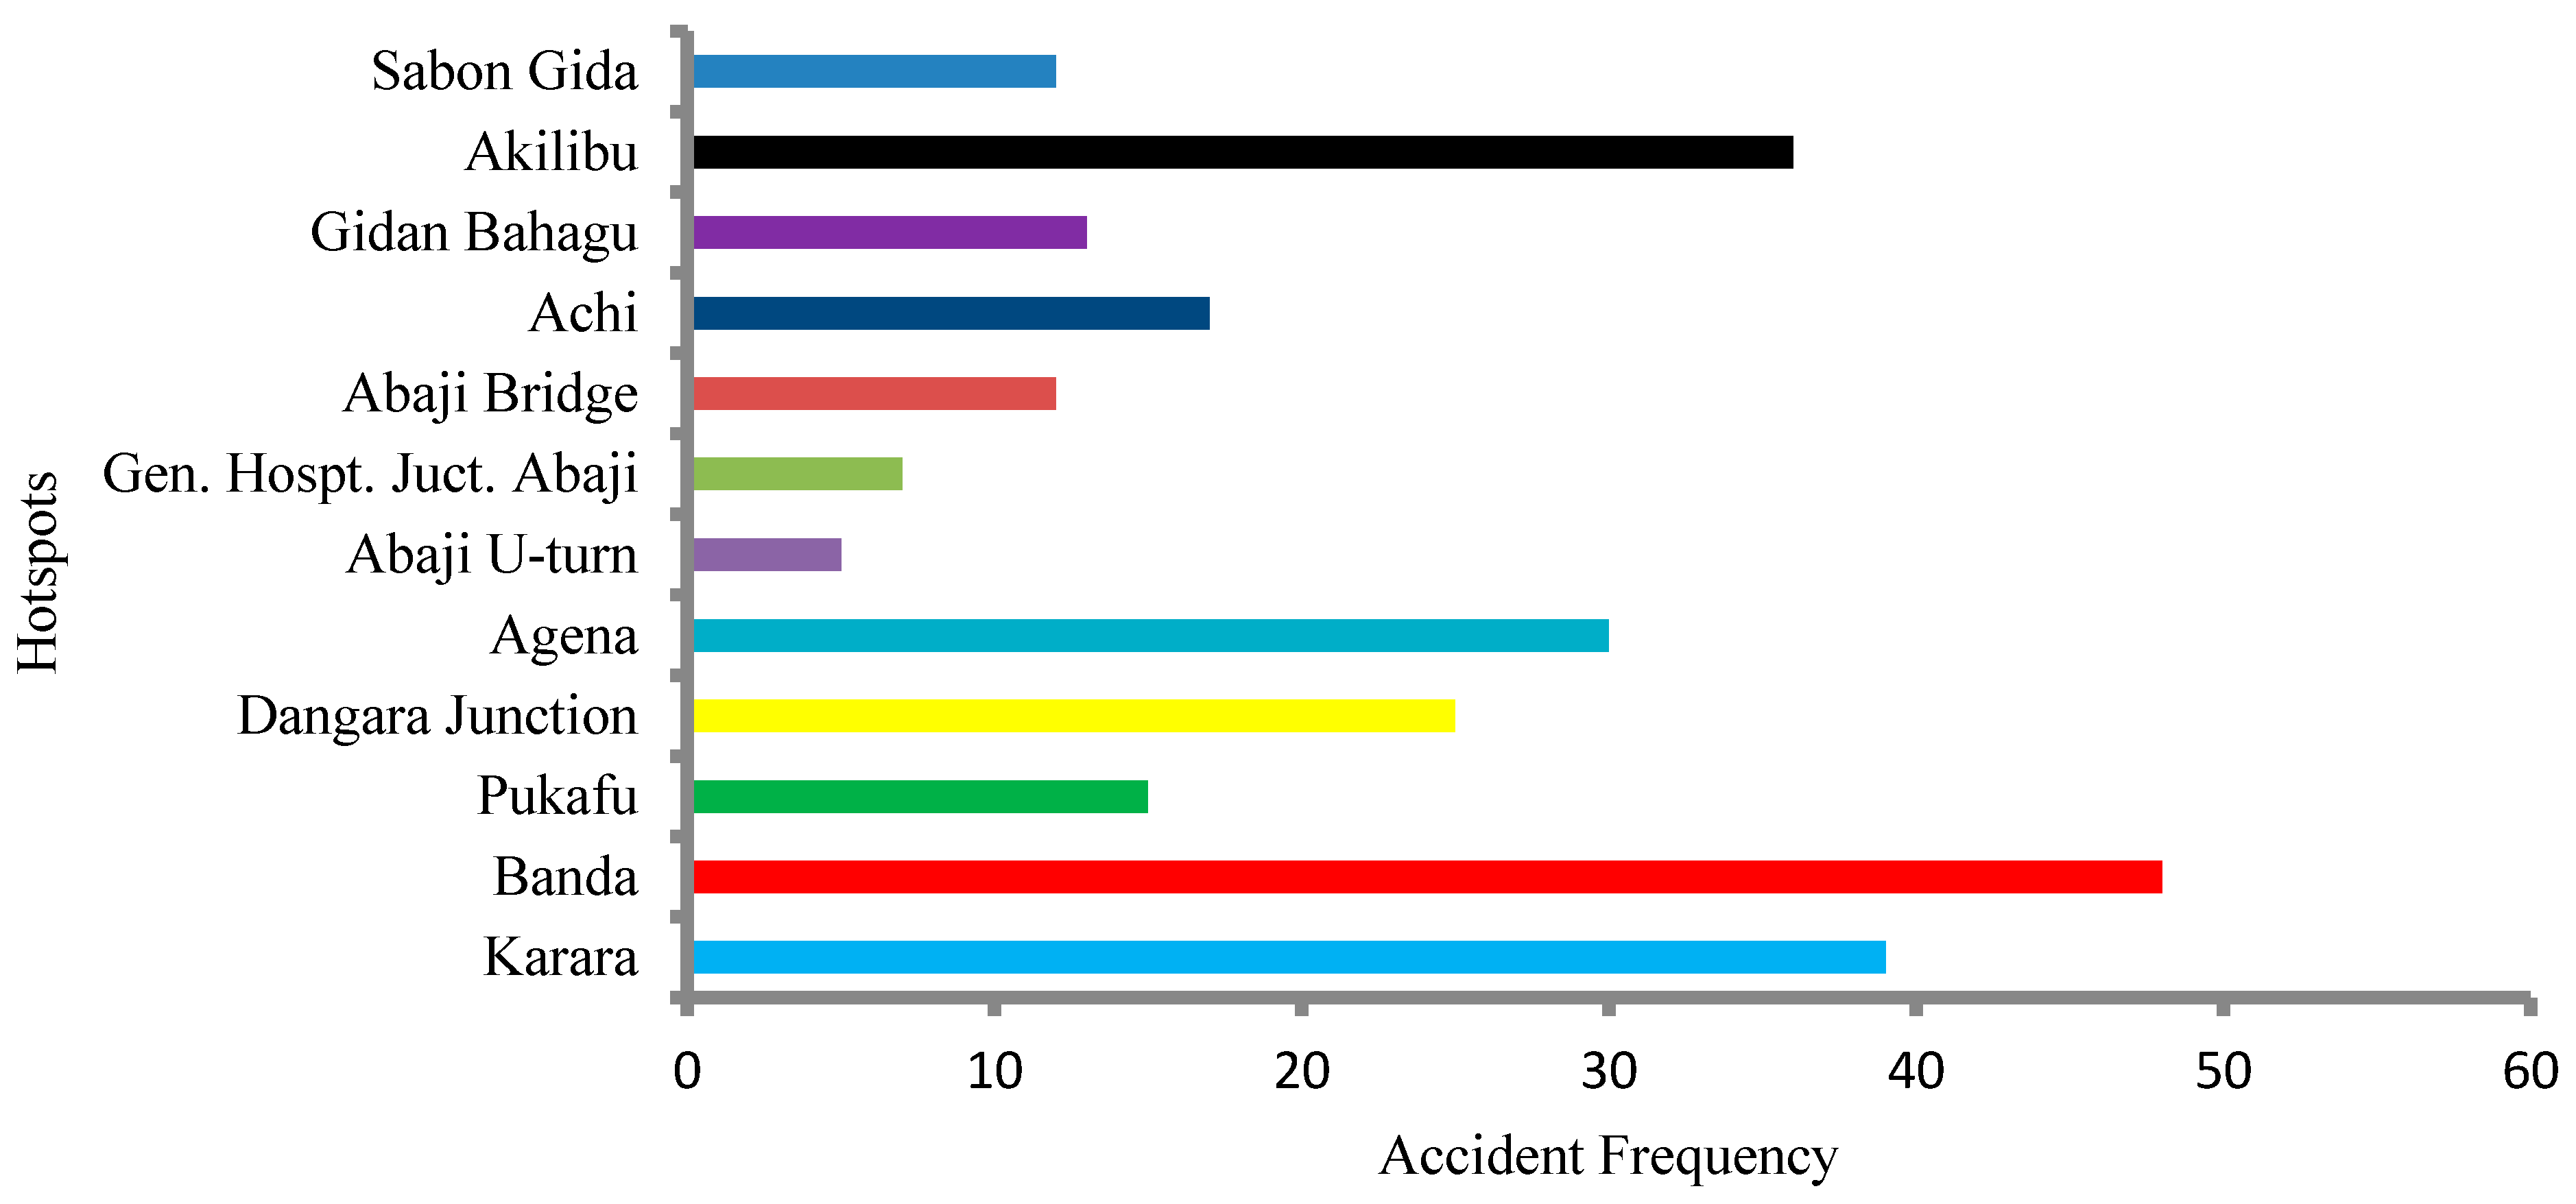
- The concentration of road traffic accidents is midway between the Sabon-Gida and Yangoji curves, as indicated by the weighted mean center analysis. In addition, based on the visual detection conducted using KDE, the frequency of accident locations is associated with road intersections (such as the Madalla and Dangara intersections) and road curves in Banda town.
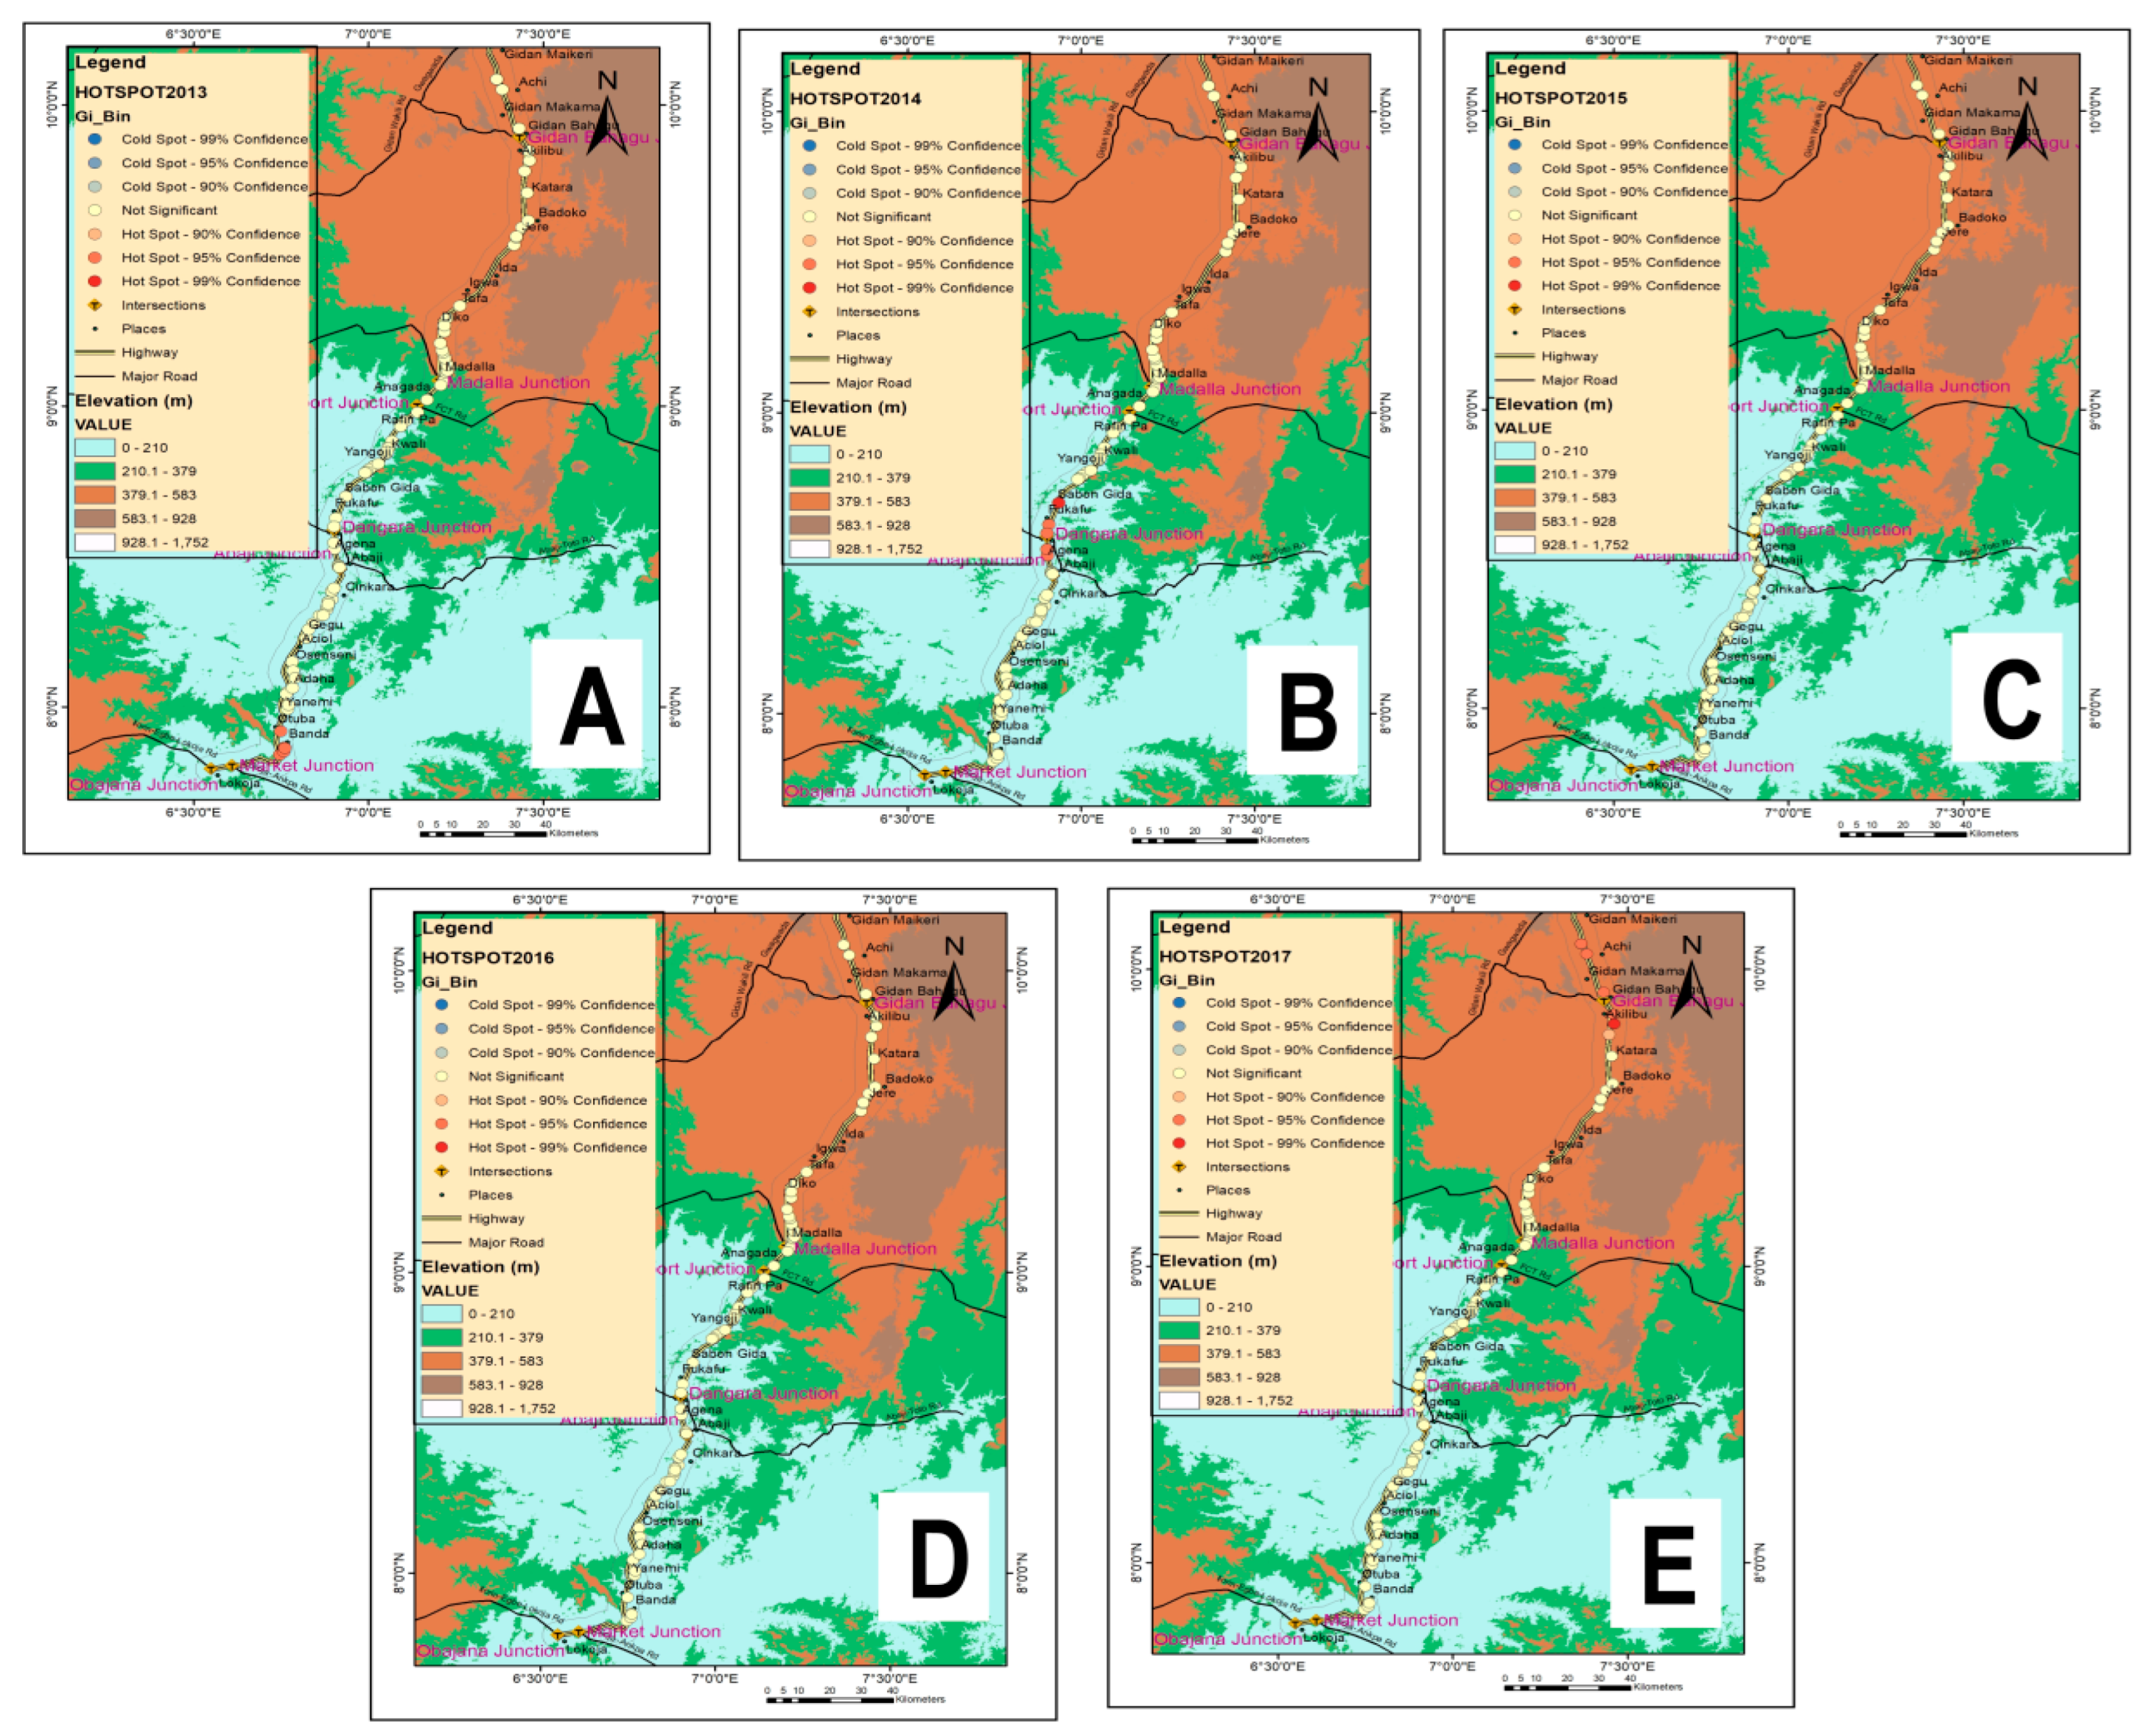
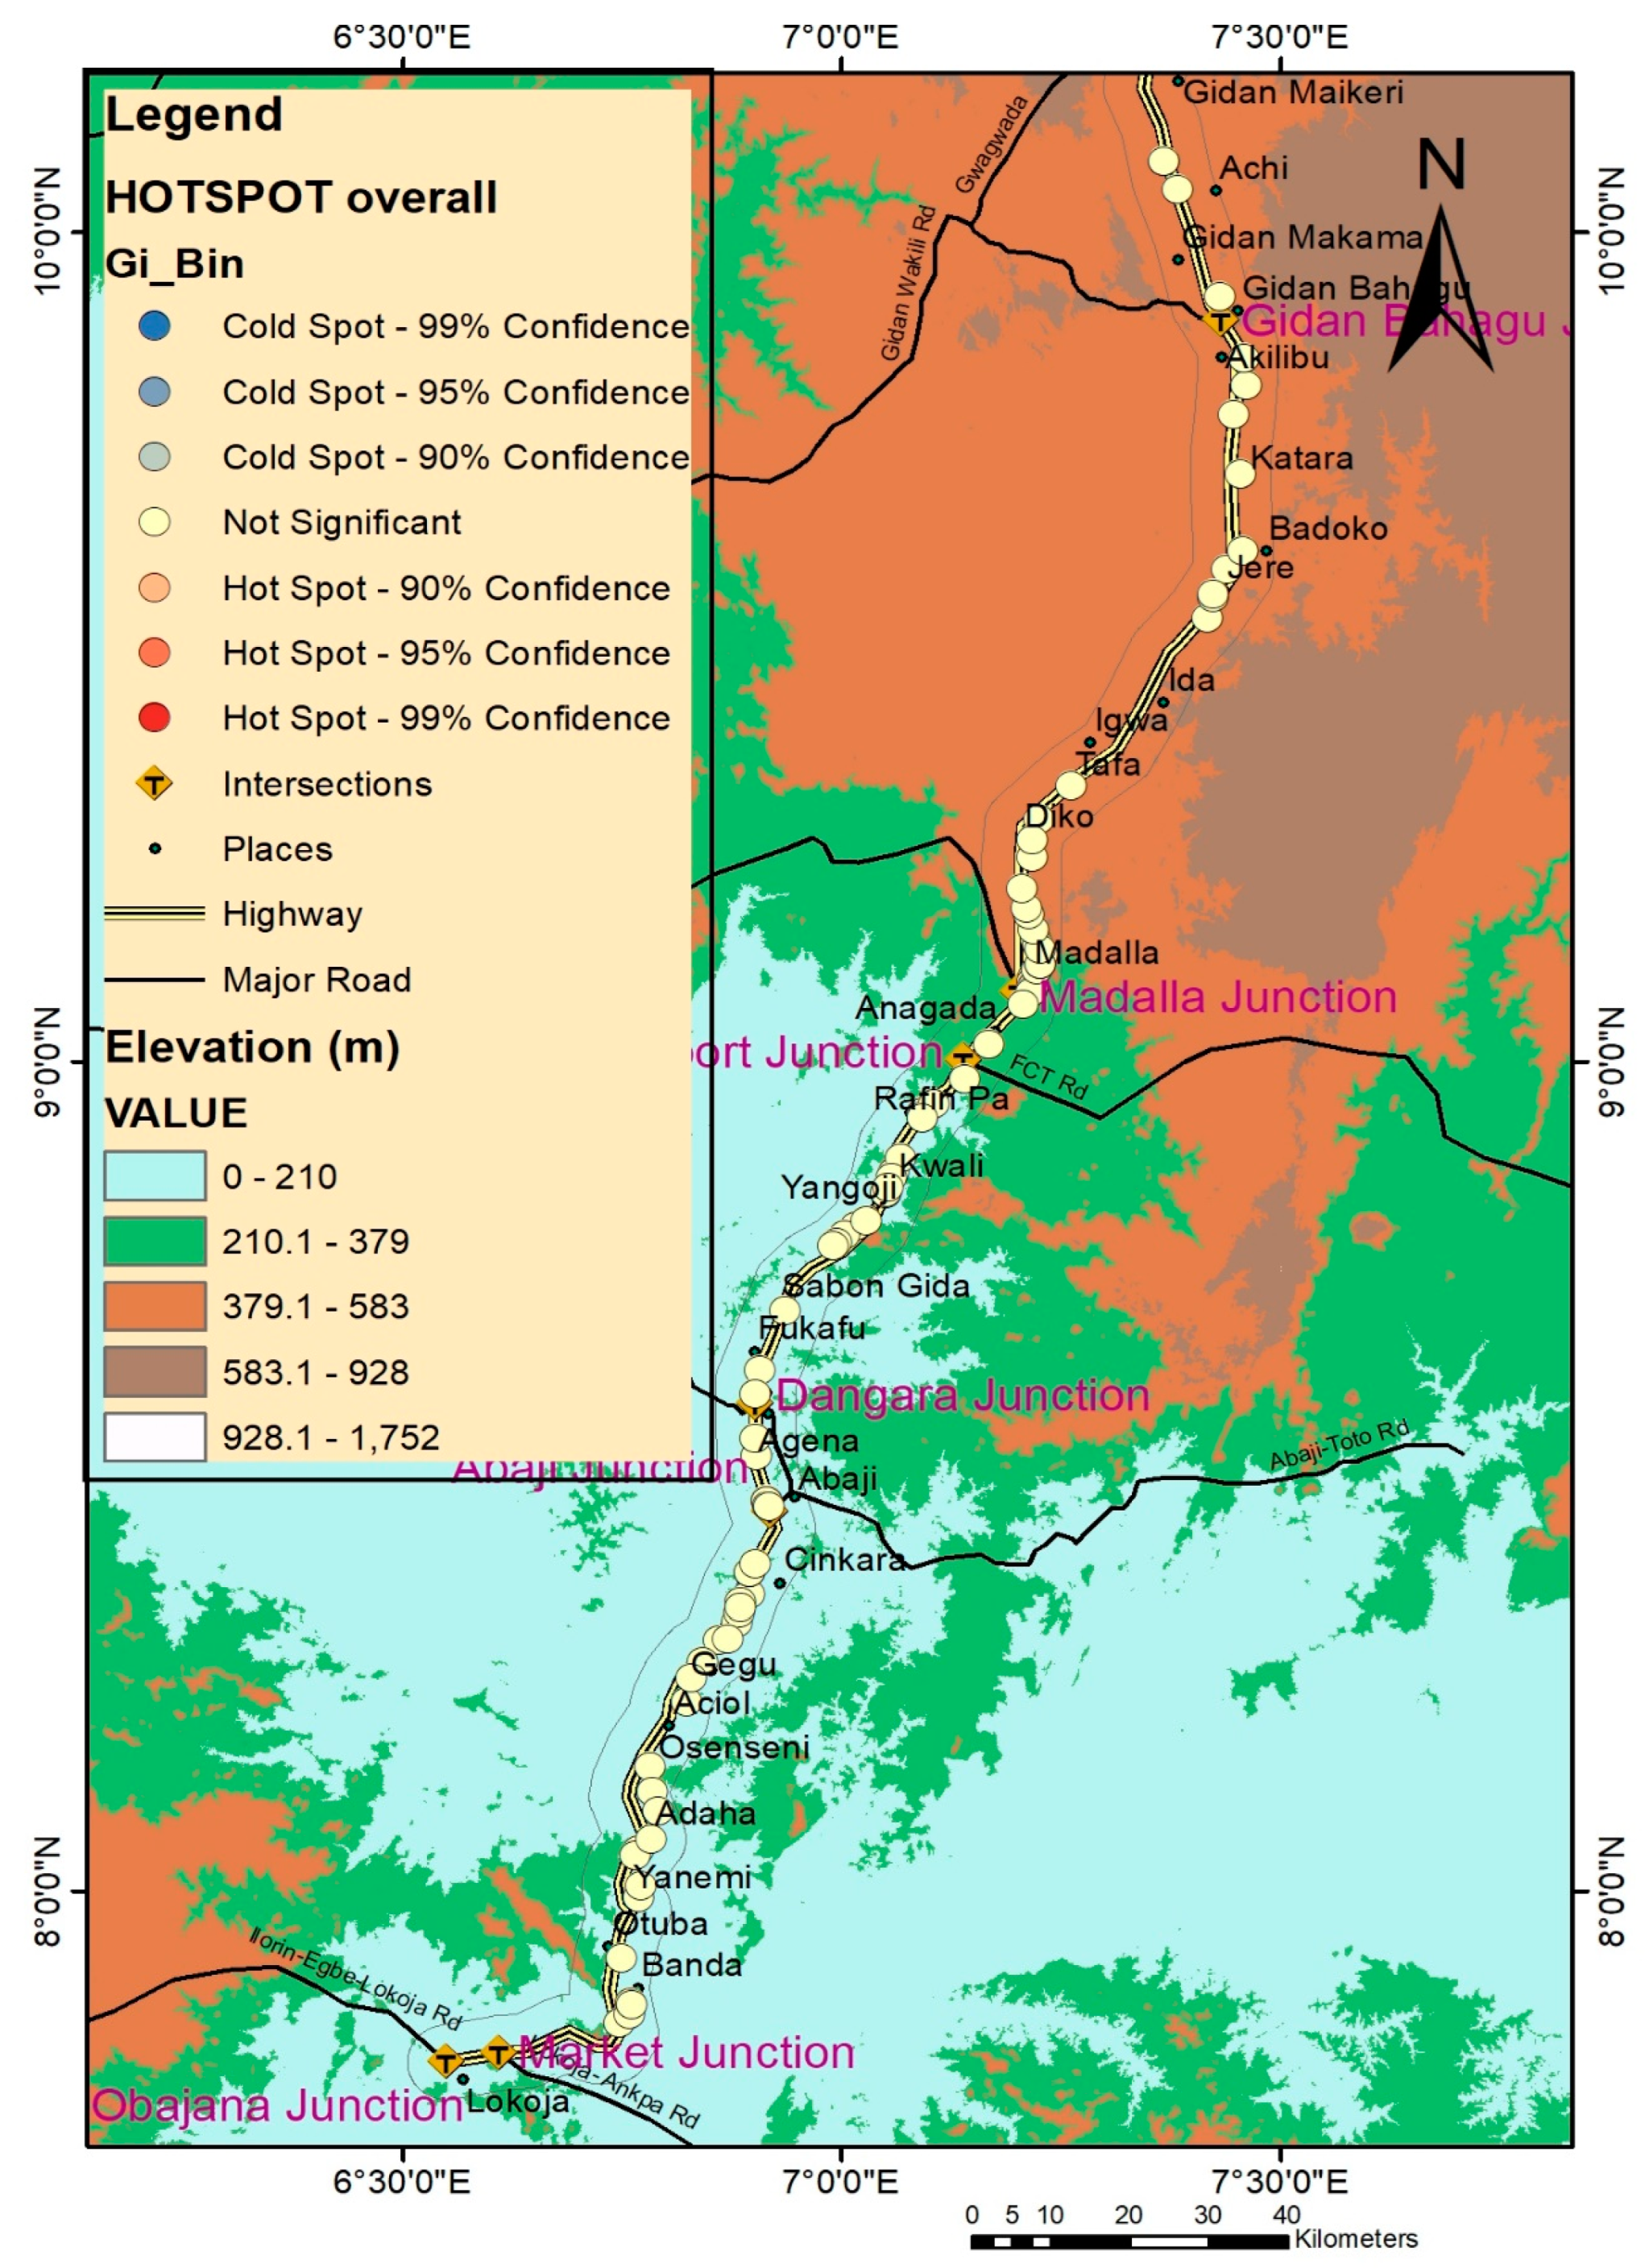
- The hotspots exist with a significance level between 95–99% for 2013, 2014, and 2017. However, the cumulative hotspot map indicates that the pattern of hotspots for 2015 and 2016 is random. Thus, preventive measures for the hotspot locations should be based on a yearly hotspot analysis. Further, traffic exposure is significant at the accident hotspots of the Abaji Bridge, Gen. hospt. Abaji, and Abaji U-turn. Thus, precautionary measures should be put in place at these locations.
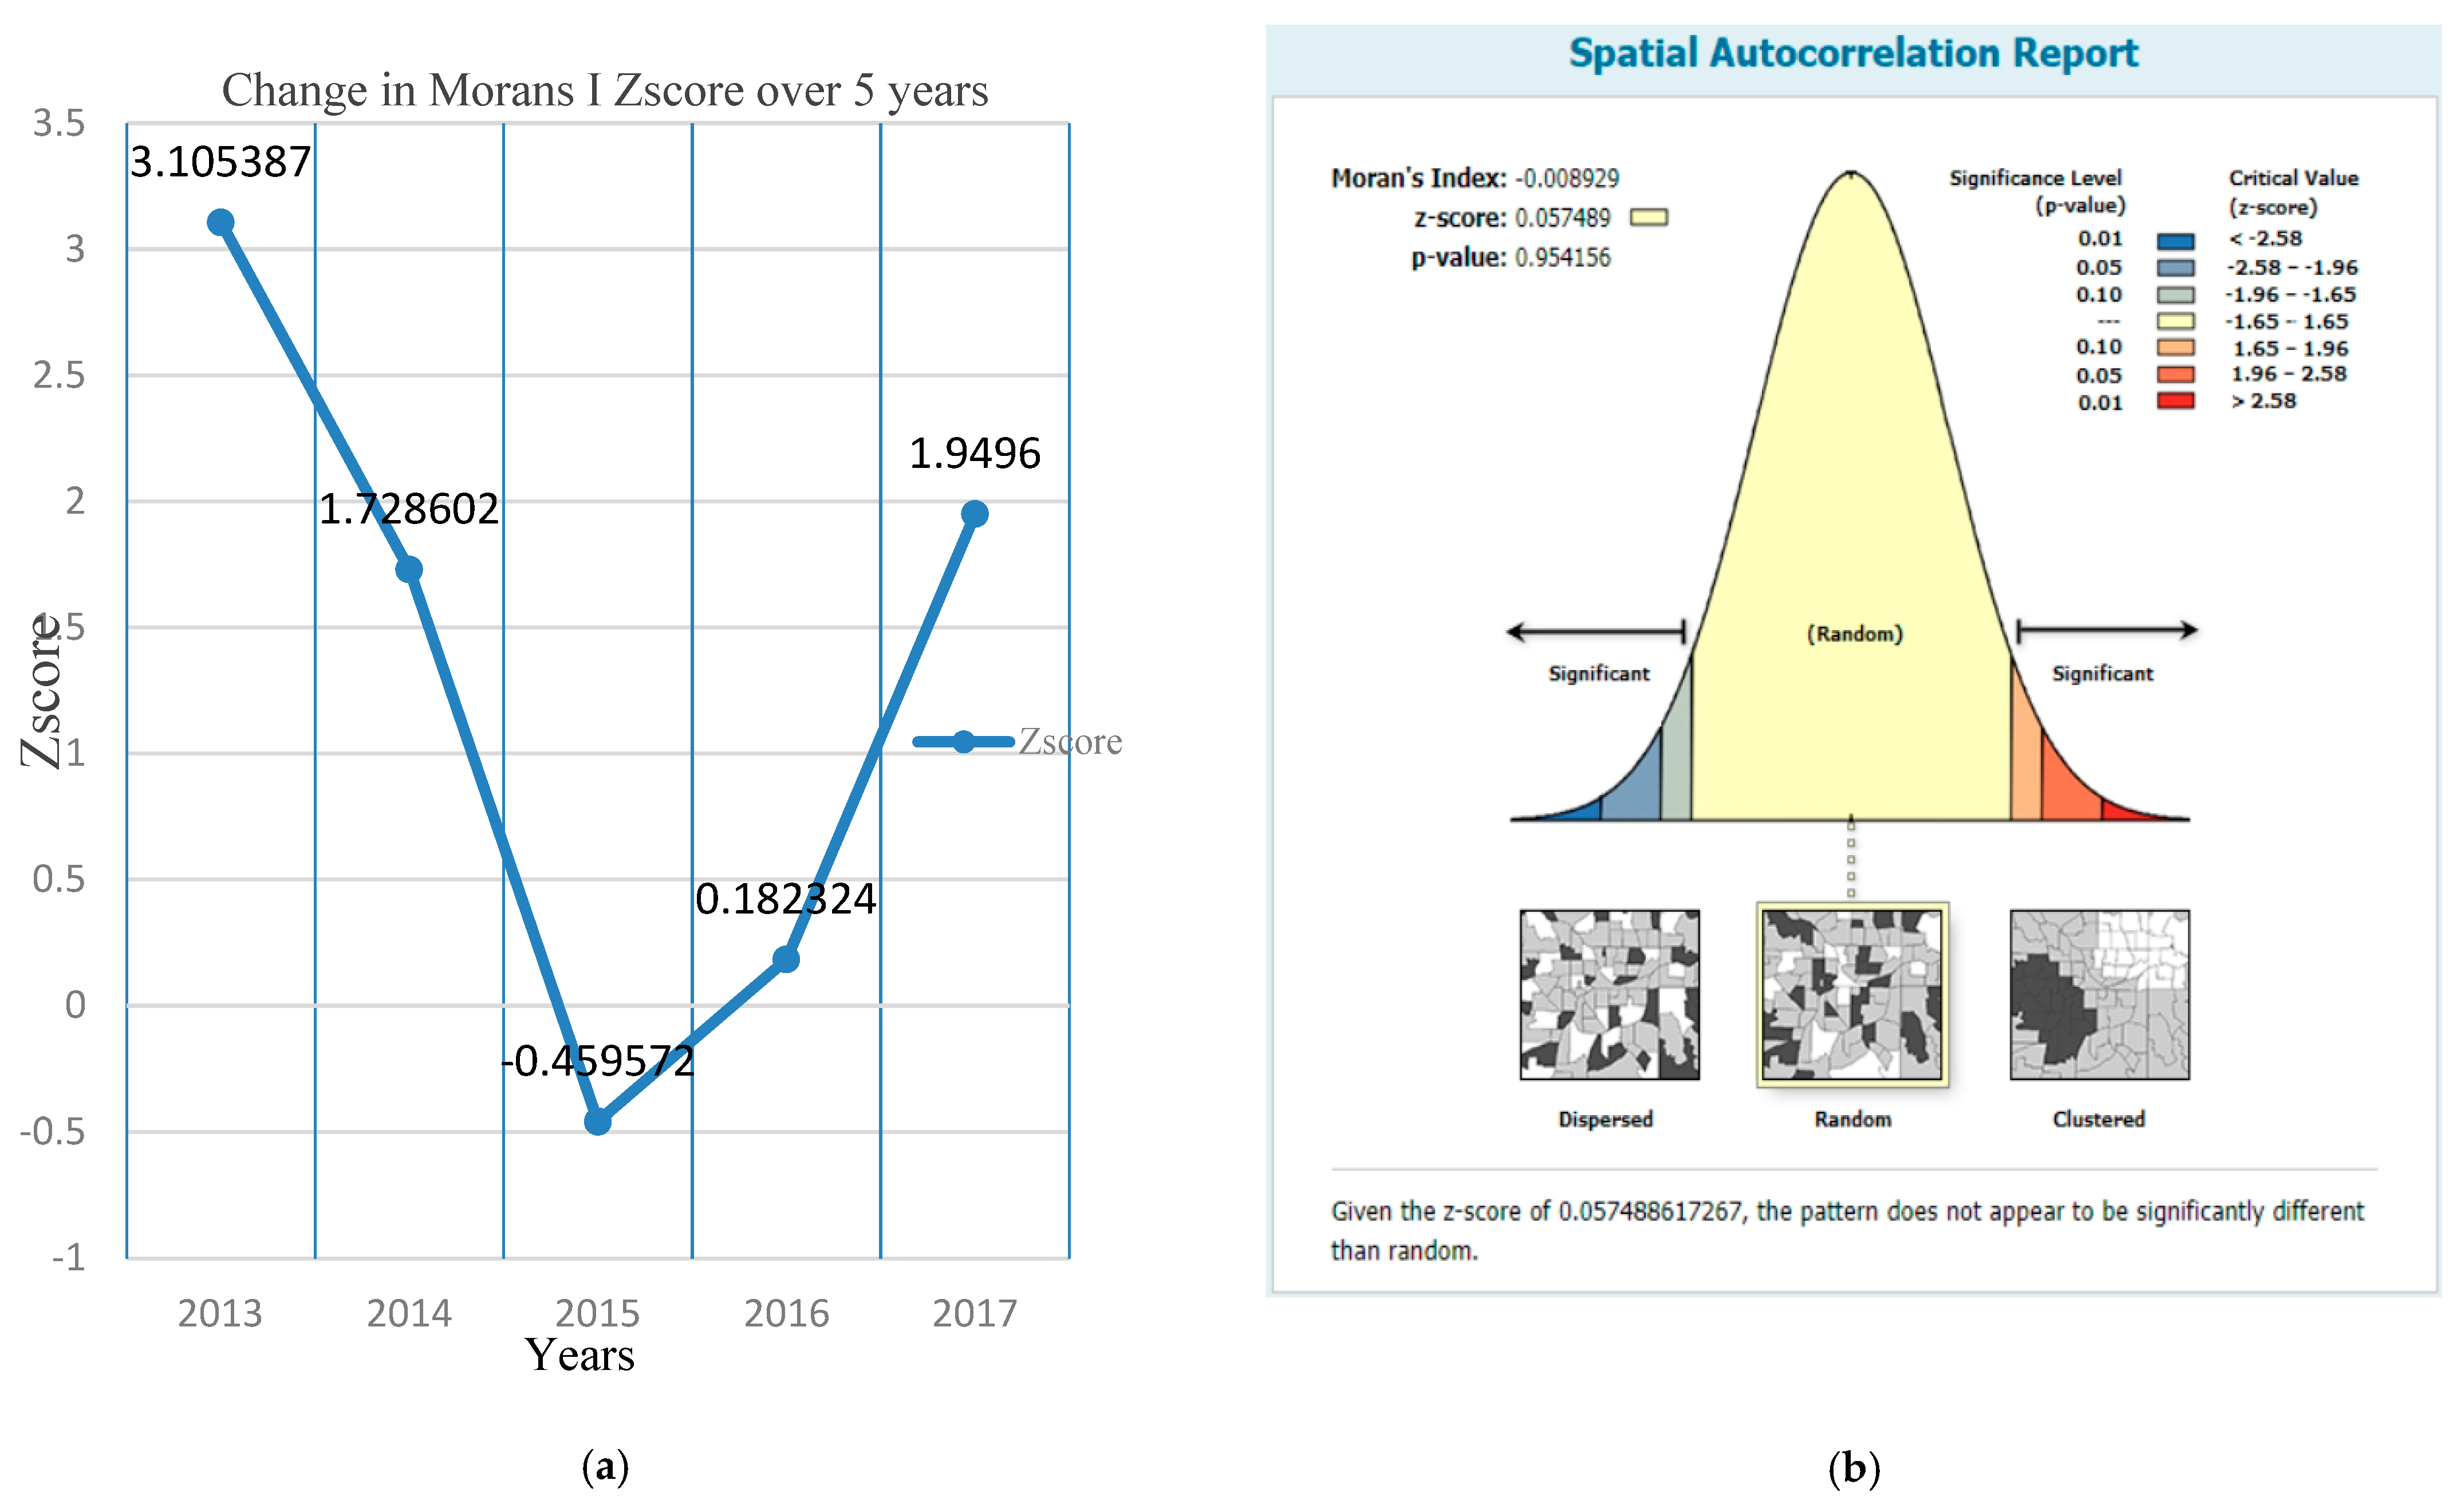
- The spatial autocorrelation analysis of the overall accident locations with a Z-score = 0.0575, p-value = 0.9542, and Moran’s I statistic = −0.0089 showed that the distribution of accidents in the study route is random.
- One limitation of the present study is that it did not include input variables such as pavement condition, grade, and sight distance in the analysis. Future research must examine such variables’ influence in the analysis. In addition, future work is needed to check the consistency and reliability of highway geometric design features.
Author Contributions
Funding
Acknowledgments
Conflicts of Interest
Abbreviations
| ADT | Average daily traffic |
| DI | Dangerousness index |
| EB | Empirical Bayes |
| FMWT | Federal Ministry of Works and Transport |
| FRSC | Federal Road Safety Commission |
| GIS | Geographic information systems |
| GOG | Getis–Ord Gi* |
| GPS | Global positioning system |
| HC | Hierarchical clustering |
| KDE | Kernel density estimation |
| KDE+ | Extended KDE |
| NB | Northbound |
| SB | Southbound |
| STAA | Spatial traffic accident analysis |
| SANET | Spatial analysis along network |
References
- Apparao, G.; Mallikarjunareddy, P.; Raju, S.S.V.; Gopala. Identification of accident blackspots for national highway using GIS. Int. J. Sci. Technol. Res. 2013, 2, 154–157. [Google Scholar]
- Oyedepo, O.J.; Makinde, O.O. Accident prediction models for Akure-Ondo carriageway, Ondo State Southwest Nigeria; using multiple linear regressions. Afr. Res. Rev.-J. 2010, 4, 30–49. [Google Scholar] [CrossRef][Green Version]
- Wikipedia. Road Traffic Accident. 2021. Available online: http://en.wikipedia.org/wiki/roadtrrafic_accident (accessed on 26 July 2021).
- Elvik, R. A survey of operational definitions of hazardous road locations in some European countries. Accid. Anal. Prev. 2008, 40, 1830–1835. [Google Scholar] [CrossRef]
- Kowtanapanich, W. Development of the GIS-Based Traffic Accident Information System Integrating Police and Medical Data: A Case Study in KhonKaen, Thailand. Ph.D Thesis, Dissertation No. TE-05-2. Asian Institute of Technology, Bangkok, Thailand, 2006. [Google Scholar]
- Gregory, M.; Jarrett, D. The long-term analysis of accident remedial treatments at high-risk sites in Essex. Traffic Eng. Control 1994, 35, 8–11. [Google Scholar]
- Overgaard Madsen, J.C. Skadesgradsbasered sortpletudpegning-fra crash prevention til loss reduction i de danske vejbestyrelsers sortpletarbejde. Ph.D. Thesis, Trafifikforskningsgruppen, Institut for Samfundsudvikling og Planlægning, Aalborg Universitet, Aalborg, Denmark, 2005. [Google Scholar]
- Khan, G.; Qin, X.; Noyce, D.A. Spatial analysis of weather crash patterns in Wisconsin. In Proceedings of the 85th Annual Meeting of the Transportation Research Board, Washington, DC, USA, 22–26 January 2006; Available online: www.topslab.wisc.edu/publications (accessed on 25 March 2021).
- Li, P.P. Road accident models and safety measures for vulnerable road users. In Proceedings of the 22nd ARRB Conference Research into Practice, Canberra, Australia, 29 October–2 November 2006. [Google Scholar]
- Deepthi, J.K.; Ganeshkumar, B. Identification of accident hot spots: A GIS-based implementation for Kannur District, Kerala. Int. J. Geomat. Geosci. 2010, 1, 51–59. [Google Scholar]
- Erdogan, S.; Ilci, V.; Soysal, O.M.; Korkmaz, A. A model suggestion for the determination of the traffic accident hotspots on the Turkish highway road network: A pilot study. Boletim de Ciências Geodésicas 2015, 21, 169–188. [Google Scholar] [CrossRef]
- Aguero-Valverde, J.; Jovanis, P. Analysis of road crash frequency with spatial models. TRB, National Research Council, Washington, D.C. Transpiration Res. Rec. 2008, 2061, 55–63. [Google Scholar] [CrossRef]
- Liang, L.Y.; Mo’soem, D.M.; Hua, L.T. Traffic accident application using geographic information system. J. East. Asia Soc. Transp. Stud. 2005, 6, 3574–3589. [Google Scholar]
- Demirel, A.; Akgungor, A.P. The importance of reports in the accident analyses, problems in application and recommendations for solution. In Proceedings of the International Traffic and Road Safety Congress, Gazi University, Ankara, Turkiye, 15–17 October 2021; In Turkish. Available online: http://www.trafik.gov.tr (accessed on 5 February 2022).
- Aderinlewo, O.O.; Afolayan, A. Development of road accident prediction models for Akure-Owo highway, Ondo State, Nigeria. J. Eng. Sci. 2019, 15, 53–70. [Google Scholar] [CrossRef]
- Shankar, V.; Mannering, F.; Woodrow, B. Effect of roadway geometrics and environmental factors on rural freeway accident frequencies. Accid. Anal. Prev. 1995, 27, 371–389. [Google Scholar] [CrossRef]
- Popoola, M.O.; Abiola, O.S.; Odunfa, S.O.; Ismaila, S.O. Comparison of Road Traffic Accident Models for Two-Lane Highway Integrating Traffic and Pavement Parameters. J. Nat. Sci. Eng. Technol. 2017, 16, 1–10. [Google Scholar] [CrossRef]
- Popoola, M.O.; Abiola, O.S.; Odunfa, S.O. Effect of Traffic and Geometric Characteristics of Rural Two-lane Roads on Traffic Safety: A case study of Ilesha-Akure-Owo Road South-West, Nigeria. FUOYE J. Eng. Technol. 2018, 3, 125–130. [Google Scholar] [CrossRef]
- Easa, S.M.; Chan, Y. Urban Planning and Development Applications of GIS; ASCE Press: Reston, VA, USA, 2000; Chapter 15; p. 304. [Google Scholar]
- Owusu, C.K.; Eshun, J.K.; Asare, C.K.O.; Alkins, A.A. Identification of road traffic accident hotspots in the Cape Coast metropolis, Southern Ghana using geographic information system (GIS). Int. J. Sci. Eng. Res. 2018, 10, 2106–2123. [Google Scholar] [CrossRef]
- Sandhu, H.A.S.; Singh, G.; Sisodia, M.S.; Chauhan, R. Identification of black spots on the highway with kernel density estimation method. J. Indian Soc. Remote Sens. 2016, 44, 457–464. [Google Scholar] [CrossRef]
- Moran, P.A.P. The interpretation of statistical maps. J. R. Stat. Soc. Ser. B 1948, 10, 243–251. [Google Scholar] [CrossRef]
- Erdogan, S.; Yilmaz, I.; Baybura, T.; Gullu, M. Geographical information systems aided traffic accident analysis system case study: City of Afyonkarahisar. Accid. Anal. Prev. 2008, 40, 174–181. [Google Scholar] [CrossRef]
- Olusina, J.O.; Ajanaku, W.A. Spatial analysis of accident spots using weighted severity index (WSI) and density-based clustering algorithm. J. Appl. Sci. Environ. Manag. 2017, 21, 397–403. [Google Scholar] [CrossRef]
- Verma, S.; Khan, J. Identification and improvement of accident black spots on N. H. 86 district Sagar, Madhya Pradesh. Int. Res. J. Eng. Technol. 2018, 5, 225–232. [Google Scholar]
- Getis, A. Spatial interaction and spatial autocorrelation: A cross-product approach. In Perspectives on Spatial Data Analysis; Springer: Berlin/Heidelberg, Germany, 2010; pp. 23–33. [Google Scholar]
- Sabel, C.E.; Kingham, S.; Nicholson, A.; Bartie, P. Road traffic accident simulation modeling-a Kernel estimation approach. Presented at SIRC. In Proceedings of the 17th Annual Colloquium of the Spatial Information Research Centre, Dunedin, New Zealand, 24–25 November 2005. [Google Scholar]
- Bello, T. A Stratified Traffic Accident Analysis Case Study: City of Richardson, Masters in Geographic Information Sciences; University of Texas: Dallas, TX, USA, 2005; Available online: http://charlotte.utdallas.edu/mgis/prjmstrs/index.htm (accessed on 26 July 2021).
- Kim, K.E.; Yamashita, E.Y. Using the K-Means Clustering Algorithm to Examine Patterns of Pedestrian-Involved Crashes in Honolulu, Hawaii CD Rom TRB; National Research Council: Washington, DC, USA, 2004. [Google Scholar]
- Levine, N.; Kim, K.E.; Lawrence, H.N. Spatial analysis of Honolulu motor vehicle crashes: 1. spatial patterns. Accid. Anal. Prev. 1995, 27, 663–674. [Google Scholar] [CrossRef]
- Sajed, Y.; Shafabakhsh, G.; Bagheri, M. Hotspot location identification using accident data, traffic and geometric characteristics. Eng. J. 2019, 23, 191–207. [Google Scholar] [CrossRef]
- El-Said Mahmoud, M.Z.; Soon, J.T.; Eng Hie, A.T.; Nurul Amirah ‘Atiqah Binti Mohamad’ Asri Putra, Yok Hoe Yap & Ena Kartina Abdul Rahman. Spatial analysis of road traffic accident hotspots: Evaluation and validation of recent approaches using road safety audit. J. Transp. Saf. Secur. 2019, 13, 575–604. [Google Scholar] [CrossRef]
- Düzgün, Ş. Analysis of Point Patterns. Spatial Data Analysis; Middle East Technical University: Ankara, Turkey, 2009. [Google Scholar]
- Thakali, L.; Kwon, T.J.; Fu, L. Identification of crash hotspots using kernel density estimation and kriging methods: A comparison. J. Mod. Transp. 2015, 23, 93–106. [Google Scholar] [CrossRef]
- Ver Hoef, J.M. Kriging models for linear networks and non-euclidean distances: Cautions and solutions. Methods Ecol. Evol. 2018, 9, 1600–1613. [Google Scholar] [CrossRef]
- Okabe, A.; Sugihara, K. Spatial Analysis along Networks; John Wiley & Sons, Ltd.: Hoboken, NJ, USA, 2012. [Google Scholar]
- Kuo, P.F.; Zeng, X.; Lord, D. Guidelines for choosing hotspot analysis tools based on data characteristics, network restrictions, and time distributions. In Proceedings of the 91 Annual Meeting of the Transportation Research Board, Washington, DC, USA, 22–26 November 2011; pp. 22–26. [Google Scholar]
- Zahran, E.-S.M.M.; Tan, S.J.; Yap, Y.H.; Rahman, E.K.A.; Husaini, N.H. A novel approach for identification and ranking of road traffic accident hotspots. MATEC Web Conf. 2017, 124, 04003. [Google Scholar] [CrossRef]
- Bíl, M.; Andrášik, R.; Janoška, Z. Identification of hazardous road locations of traffic accidents by means of kernel density estimation and cluster significance evaluation. Accid. Anal. Prev. 2013, 55, 265–273. [Google Scholar] [CrossRef]
- Anderson, T.K. Kernal density estimation and K-means clustering to profile road accident. Accid. Anal. Prev. 2009, 41, 359–364. [Google Scholar] [CrossRef]
- Plug, C.; Xia, J.; Caulfield, C. Spatial and temporal visualization techniques for crash analysis. Accid. Anal. Prev. 2011, 43, 1937–1946. [Google Scholar] [CrossRef]
- New Zealand Transport Department. Guidelines: Road Safety Audit Procedures for Projects; Transfund New Zealand manual No. TFM9; NZ Transport Department: Wellington, New Zealand, 2013. [Google Scholar]
- Xie, Z.; Yan, J. Kernel density estimation of traffic accidents in a network space. Comput. Environ. Urban Syst. 2008, 32, 396–406. [Google Scholar] [CrossRef]
- Xie, Z.; Yan, J. Detecting traffic accident clusters with network kernel density estimation and local spatial statistics: An integrated approach. J. Transp. Geogr. 2013, 31, 64–71. [Google Scholar] [CrossRef]
- Bíl, M.; Andrášik, R.; Svoboda, T.; Sedoník, J. The kde+ software: A tool for effective identification and ranking of animal-vehicle collision hotspots along networks. Landsc. Ecol. 2016, 31, 231–237. [Google Scholar] [CrossRef]
- Andrášik, R.; Bíl, M. Clustering of Traffic Accidents with the Use of the Kde+ Method; Transport Research Centre: Brno, Czech Republic, 2015. [Google Scholar]
- Chainey, S. Examining the influence of cell size and bandwidth size on kernel density estimation crime hotspot maps for predicting spatial patterns of crime. Bull. Geogr. Soc. Liege 2013, 60, 7–19. [Google Scholar]
- FRSC. Annual Report. 2017. Available online: http://www.frsc.gov.ng (accessed on 19 January 2019).
- Afolayan, A. Development of a Framework for Road Accidents Prevention: Akure-Owo Highway as a Case Study. Master of Engineering Thesis, Department of Civil and Environmental Engineering, Federal University of Technology Akure, Akure, Nigeria, 2017. Available online: https://futa.edu.ng/projects/frontuser/projectdetails/1666 (accessed on 26 July 2021).
- Paul, D.J. Analysis of road traffic accident hotspots along Zaria-Kaduna expressway, Kaduna state Nigeria. Master of Science Thesis, Department of Geography, Ahmadu Bello University, Zaria, Nigeria, 2015. [Google Scholar]
- Lee, J.; Mannering, F. Analysis of Roadside Accident Frequency and Severity and Roadside Safety Management; Washington State Department of Transportation: Olympia, WA, USA, 1999. [Google Scholar]



| Fatalities | Injuries | ||||
|---|---|---|---|---|---|
| Year | No. of Accidents | Frequency (F) | % | Frequency (F) | % |
| 2013 | 1285 | 1154 | 40.46 | 996 | 25.50 |
| 2014 | 861 | 818 | 28.68 | 767 | 19.64 |
| 2015 | 815 | 271 | 9.50 | 737 | 18.87 |
| 2016 | 704 | 195 | 6.84 | 621 | 15.90 |
| 2017 | 991 | 414 | 14.52 | 785 | 20.10 |
| Total | 4656 | 2852 | 100 | 3906 | 100 |
| 2013 | 2014 | 2015 | 2016 | 2017 | Total | ||||||||
|---|---|---|---|---|---|---|---|---|---|---|---|---|---|
| No. | Contributory Cause | F | % | F | % | F | % | F | % | F | % | F | % |
| 1 | Speed Violation | 286 | 21.95 | 279 | 26.27 | 309 | 30.21 | 288 | 29.24 | 416 | 29.44 | 1578 | 27.27 |
| 2 | Loss of Control | 370 | 28.40 | 274 | 25.80 | 231 | 22.58 | 133 | 13.50 | 224 | 15.85 | 1232 | 21.29 |
| 3 | Sign Light Violation | 63 | 4.83 | 102 | 9.60 | 122 | 11.93 | 254 | 25.79 | 386 | 27.32 | 927 | 16.02 |
| 4 | Tyre Burst | 142 | 10.90 | 137 | 12.90 | 133 | 13.00 | 97 | 9.85 | 125 | 8.85 | 634 | 10.97 |
| 5 | Wrongful Overtaking | 184 | 14.12 | 62 | 5.84 | 44 | 4.30 | 25 | 2.54 | 45 | 3.18 | 360 | 6.22 |
| 6 | Dangerous Driving | 103 | 7.90 | 60 | 5.65 | 67 | 6.55 | 54 | 5.48 | 45 | 3.18 | 329 | 5.69 |
| 7 | Route Violation | 47 | 3.61 | 50 | 4.71 | 51 | 4.99 | 55 | 5.58 | 53 | 3.75 | 256 | 4.42 |
| 8 | Dangerous Overtaking | 27 | 2.07 | 19 | 1.79 | 08 | 0.78 | 07 | 0.71 | 23 | 1.63 | 84 | 1.45 |
| 9 | Mechanically Deficient Vehicle | 17 | 1.35 | 12 | 1.13 | 06 | 0.59 | 15 | 1.52 | 31 | 2.19 | 81 | 1.40 |
| 10 | Brake Failure | 08 | 0.61 | 22 | 2.07 | 16 | 1.56 | 10 | 1.02 | 15 | 1.06 | 71 | 1.23 |
| 11 | Others | 19 | 1.45 | 13 | 1.22 | 12 | 1.27 | 08 | 0.81 | 12 | 0.85 | 65 | 1.12 |
| 12 | Road Obstruction Violation | 10 | 0.76 | 14 | 1.32 | 12 | 1.17 | 13 | 1.32 | 13 | 0.92 | 62 | 1.07 |
| 13 | Fatigue | 09 | 0.69 | 04 | 0.38 | 03 | 0.29 | 18 | 1.83 | 16 | 1.13 | 50 | 0.86 |
| 14 | Driving under the Influence of Alcohol/Drugs | 09 | 0.69 | 05 | 0.47 | 05 | 0.49 | 03 | 0.30 | 03 | 0.21 | 25 | 0.43 |
| 15 | Overloading | 02 | 0.15 | 02 | 0.19 | 0 | 0 | 02 | 0.20 | 03 | 0.21 | 09 | 0.16 |
| 16 | Sleeping at the Wheel | 01 | 0.07 | 04 | 0.38 | 03 | 0.29 | 0 | 0 | 0 | 0 | 08 | 0.14 |
| 17 | Bad Road | 01 | 0.07 | 02 | 0.19 | 0 | 0 | 02 | 0.20 | 01 | 0.07 | 06 | 0.10 |
| 18 | Use of Phone While Driving | 02 | 0.15 | 01 | 0.09 | 0 | 0 | 01 | 0.10 | 01 | 0.07 | 05 | 0.09 |
| 19 | Poor Weather | 03 | 0.23 | 0 | 0 | 0 | 0 | 0 | 0 | 01 | 0.07 | 04 | 0.07 |
| Total | 1303 | 100 | 1062 | 100 | 1022 | 100 | 985 | 100 | 1413 | 100 | 5786 | 100 | |
| No. | Accident Location | Total Number of Accidents | No. | Accident Location | Total Number of Accidents |
|---|---|---|---|---|---|
| 1 | Gadabiyu town | 86 | 25 | Doka | 16 |
| 2 | Awawa | 53 | 26 | Idu Bridge | 15 |
| 3 | Manderegi | 52 | 27 | Giri Inter. | 15 |
| 4 | Banda | 48 | 28 | Rijana | 15 |
| 5 | Ahoko Village | 40 | 29 | Bako Village | 14 |
| 6 | Kara | 39 | 30 | FGC Kwali | 14 |
| 7 | Gwako Village | 33 | 31 | Anagada U-turn | 14 |
| 8 | General Hospital Inter. Kw | 28 | 32 | Azara Town | 14 |
| 9 | Okpaka | 26 | 33 | Kwaita | 13 |
| 10 | GSS Yangoji | 26 | 34 | Zuma Rock | 13 |
| 11 | NATACO Junct. | 24 | 35 | Gidan Busa | 13 |
| 12 | Small Sheda | 24 | 36 | Kwali Mrkt. U-turn | 12 |
| 13 | Gaba Hill | 22 | 37 | Opp. Coll. Of Edu. Zuba | 12 |
| 14 | SLAN F/ST | 21 | 38 | Madalla Inter. | 12 |
| 15 | OZI Village | 20 | 39 | KM14 DM Kurfi | 12 |
| 16 | KM85 Katari | 19 | 40 | Bishini Inter. | 12 |
| 17 | Ahoko bridge | 17 | 41 | Toll gate SBW | 11 |
| 18 | Aseni Village | 17 | 42 | Ohono | 10 |
| 19 | SDP Junct | 17 | 43 | Chikara Village | 10 |
| 20 | T/Maje U-turn | 17 | 44 | Fire Serv. Coll. Kwali | 10 |
| 21 | Akilibu | 17 | 45 | Zuba U-turn | 10 |
| 22 | Adabo Village | 16 | 46 | Polewire | 10 |
| 23 | Big Sheda U-turn | 16 | 47 | Maro | 10 |
| 24 | KM11 Murada | 16 |
| No. | Accident Location | Total Number of Accidents | No. | Accident Location | Total Number of Accidents |
|---|---|---|---|---|---|
| 1 | Chikara Village | 110 | 20 | Big Sheda U-turn | 17 |
| 2 | Kwaita | 108 | 21 | Giri Inter. | 17 |
| 3 | Piri | 94 | 22 | Rijana | 17 |
| 4 | Banda | 48 | 23 | Doka | 17 |
| 5 | T/Maje U-turn | 44 | 24 | M/M Bridge | 17 |
| 6 | Akilibu | 36 | 25 | GSS Yangoji | 16 |
| 7 | Omoko | 35 | 26 | Jamata Curve | 15 |
| 8 | Gadabiyu town | 34 | 27 | Awawa | 14 |
| 9 | Bako Village | 30 | 28 | Zuba U-turn | 14 |
| 10 | Anagada U-turn | 28 | 29 | Akpogu Village | 13 |
| 11 | Opp. Marist Coll. | 25 | 30 | Small Sheda by NASC | 13 |
| 12 | SLAN F/ST | 25 | 31 | Gwako Village | 13 |
| 13 | Aseni Village | 22 | 32 | Sabon Gari Gadabiyu | 12 |
| 14 | Gidan Busa | 22 | 33 | Okpaka | 12 |
| 15 | Bulletin | 21 | 34 | Zuba Inter. | 12 |
| 16 | Naharati | 21 | 35 | Dankogi | 11 |
| 17 | KM 85 Karari | 21 | 36 | Gen. Hospt. Inter. Kwali | 10 |
| 18 | Kotonkarifi | 18 | 37 | NNPC F/ST. | 10 |
| 19 | Opp. Coll. Of Edu. Zuba | 18 | 38 | KM 8 SBW | 10 |
| No. | Section | Direction a | Hotspot Locations | ADT |
|---|---|---|---|---|
| 1 | Lokoja–Kontokarifi | NB | Banda, Market Intersection, Karara | 4903 |
| SB | 3836 | |||
| 2 | Kontokarifi–Abaji | NB | Sabon Gida, Agena, Pukafu, Dangara Intersection | 5600 |
| SB | 4960 | |||
| 3 | Abaji–Abuja | NB | Abaji Bridge, Gen. Hospt. Intersection Abaji, Abaji U-turn | 31,270 |
| SB | 16,303 |
| Year a | Location | Geometric Characteristics b | Major Accident Causes c | C.L. (%) | Suggested Improvement |
|---|---|---|---|---|---|
| 2013 | Market Inter. | HC, Built-up area, eroded shoulder | High speed | 99 | Pedestrian bridge/parking lot |
| Banda | HC, roadside obstacle (hill) | High speed | 99 | Speed limit | |
| 2014 | Fukafu | HC, built-up area, | Sign violation | 99 | Proper signpost |
| Dangara Inter. | Built-up area, U-turn, T-intersection | LOC | 95 | Proper signpost | |
| Agena | HC | High speed on sharp curve | 95 | Reconstruction | |
| Abaji Bridge | HC | Wrongful overtaking | 95 | Speed limit & signpost | |
| Gen. Hospt. Abaji | T-intersection, | High speed | 90 | Speed limit & signpost | |
| Abaji U-turn | U-turn | Fatigue | 99 | Reconstruction | |
| NAHARATI Abaji | U-turn, bridge, built-up area, vertical curve | LOC/pavement failure | 90 | Reconstruction | |
| Sabon Gida | HC, truck parking on shoulder & deceler. lane, U-turn | LOC | 99 | Proper road marking and signpost | |
| 2017 | Achi | Vertical curve | LOC | 95 | Proper road marking and speed limit |
| Gidan Bahagu | U-turn | Fatigue | 95 | Reconstruction | |
| Akilibu | Horizontal curve, T-intersection | Road obstruction | 99 | Intersection signalization | |
| Karara | Bridge, horizontal curve | High speed | 90 | Signpost required |
| Year | Z-Score | p-Value | Moran’s I Index |
|---|---|---|---|
| 2013 | 3.1054 | 0.0019 | 0.1263 |
| 2014 | 1.7286 | 0.0839 | 0.0638 |
| 2015 | −0.4596 | 0.6458 | −0.0320 |
| 2016 | 0.1823 | 0.8553 | −0.0032 |
| 2017 | 1.9496 | 0.0512 | 0.0799 |
Publisher’s Note: MDPI stays neutral with regard to jurisdictional claims in published maps and institutional affiliations. |
© 2022 by the authors. Licensee MDPI, Basel, Switzerland. This article is an open access article distributed under the terms and conditions of the Creative Commons Attribution (CC BY) license (https://creativecommons.org/licenses/by/4.0/).
Share and Cite
Afolayan, A.; Easa, S.M.; Abiola, O.S.; Alayaki, F.M.; Folorunso, O. GIS-Based Spatial Analysis of Accident Hotspots: A Nigerian Case Study. Infrastructures 2022, 7, 103. https://doi.org/10.3390/infrastructures7080103
Afolayan A, Easa SM, Abiola OS, Alayaki FM, Folorunso O. GIS-Based Spatial Analysis of Accident Hotspots: A Nigerian Case Study. Infrastructures. 2022; 7(8):103. https://doi.org/10.3390/infrastructures7080103
Chicago/Turabian StyleAfolayan, Abayomi, Said M. Easa, Oladapo S. Abiola, Funmilayo M. Alayaki, and Olusegun Folorunso. 2022. "GIS-Based Spatial Analysis of Accident Hotspots: A Nigerian Case Study" Infrastructures 7, no. 8: 103. https://doi.org/10.3390/infrastructures7080103
APA StyleAfolayan, A., Easa, S. M., Abiola, O. S., Alayaki, F. M., & Folorunso, O. (2022). GIS-Based Spatial Analysis of Accident Hotspots: A Nigerian Case Study. Infrastructures, 7(8), 103. https://doi.org/10.3390/infrastructures7080103


