Abstract
Load rating, using nominated rating vehicles by individual road authorities, is described in the Australian standard for bridge assessment, AS 5100.7, for all load effects, including shear. The load rating can be used to indicate the strength condition of bridges and to determine load posting for weak bridges. Thus, the information is useful for managing vehicle movements. However, for road authorities to accurately assess requested movements for a heavy vehicle with a prime mover and a platform trailer, additional information is required. This paper describes an approach employing a nonlinear search technique to determine the maximum allowable cartage loads of vehicles for various number of trailer axles up to that of a nominated load rating vehicle to ensure shear adequacy. A vehicle–bridge system has been analyzed considering a two-span bridge girder subject to a nominated rating vehicle. The calculated scaling factors for trailer loads corresponding to the total number of axles in the vehicle are presented. A platform table can then be created to assess the requested permits. The approach ensures full compliance with Modified Compression Field Theory (MCFT) as the section shear strength used for load rating is consistent with the load effects of the rating vehicle for the vehicle–bridge system under assessment.
1. Introduction
The management of bridges includes accurate assessment of permit requests for heavy vehicles. Assessment using the Australian standard AS 5100.7 [1] is a multi-stage process that includes load rating. As described in this standard, load rating factors are to be obtained for key load effects, including bending moment, shear, and torsion, and the lowest value is reported as the load rating factor RF for a vehicle–bridge system under assessment. This is to be carried out for load rating vehicles nominated by the road authority managing the bridge. Since a heavy vehicle permit assessment is an activity relating to public safety, it is important to ensure that the approach used is accurate to prevent overloading bridges and shortening their service life. Overtly conservative assessments unnecessarily limit the volume of cartage on routes served by these bridges. When assessing section shear, the load rating factor alone is insufficient for managing heavy vehicles with a platform trailer as the MCFT-based strength is dependent on load effects. This paper focuses on an additional analysis required to enable accurate determination of allowable cartage axle loads for managing the movement of these heavy vehicles on concrete bridges and ensuring that the section shear capacity is adequate.
Calculating load rating factors for shear according to AS 5100.7 [1] using the strength determined from the MCFT-based equation of AS 5100.5 [2] yields factors that accurately indicate section shear adequacy [3]. For a section with concurrent total load effects M*D&L and V*D&L, dead load effects M*D and V*D, and a reduced ultimate shear strength ϕVu, RF = [ϕVu − |V*D|]/[|V*D&L| − |V*D|]. To manage the movement of heavy vehicles with a platform trailer, a rigorous analysis is required for an accurate assessment.
A multiplying factor MF can be used as the scaling factor to determine the allowable cartage load, but it has several limitations [4]. Determining the MF basically uses a nonlinear goal-seeking procedure to find the reduced shear strength ϕVu, which is then substituted in place of the non-iterative value into the load-rating equation provided in AS 5100.7 [1] to calculate the factor. The value of the MF is calculated such that when it is applied to the vehicle load effects on the assessed section of the girder, it results in a rating factor of unity for that section.
However, selecting the loading stage (i.e., the position of the moving rating vehicle on the bridge) and the critical section to give the lowest MF is challenging. A trial-and-error approach is necessary to ensure accuracy. The process in the trial-and-error approach requires determining the MF of a trial section for a trial vehicle position, then using it to calculate the modified vehicle load, and checking the MF values of the other potential critical sections with the modified vehicle in the trial position. If the value of the MF in any of the other sections is less than one, another trial is required, and the entire process is repeated. Furthermore, this approach can only be used for systems where all axles on the bridge at the critical loading stage are those of the trailer.
Parvin et al. [5] used a “load rating factor method” in the semi-automated method described by Smith and Parvin [6] for heavy vehicle permit assessment. This method uses a combination of the load rating information stored digitally and the load effects from a linear elastic line beam structural analysis to predict the RF of one vehicle–bridge system using the known RF of another similar system. Both systems are assumed to have the same ultimate strength, transverse load distribution factor, dynamic load amplification factor, and load factor. The equation used to predict the RF is a ratio method that assumes that the shear capacity (strength) at the critical section is the same for both systems. Since this assumption is not valid for MCFT-based strengths, the continued use of this method causes inaccuracies in the assessment.
The use of ratio methods [7] in the past which typically considered the ratio of the assessed vehicle effect to a standard load rating vehicle was acceptable for all load effects since all strengths, including shear and bending, were assumed to not be dependent on load effects in older standards. These methods are unsuitable for use with the latest MCFT-based shear strength standards. Holt et al. [8] stressed the importance of ensuring that the strain used to compute shear resistance is consistent with the applied loads to prevent the assessments from adversely affecting operation and management decisions.
To assess a vehicle similar to G2V5 (a nominated rating vehicle of Main Roads Western Australia (MRWA) [9]) using the semi-automated method, say one with eight trailer axles with requested cartage loads, two line beam analyzes have to be carried out using a computer program with the ability to perform two-dimensional linear elastic analysis for moving loads. An example of such a program is PCBEAMAN, described in the Structures Engineering Design Manual of MRWA [10]. Two analyzes, one for the reference vehicle G2V5 and the other for the assessed vehicle, are carried out using the unfactored full loading of the vehicles to give the load effects at closely spaced sections along the beam caused by the moving vehicle. The program also gives envelopes for the bending moment and shear for the moving vehicle on the bridge. Using this information, the critical section and loading stage are then selected. A simple proportioning equation, RF2 = RF1 × (VL1/VL2), is then used to predict the load rating factor of the assessed vehicle. RF2 is the rating factor of the assessed vehicle, and RF1 is the known load factor of the reference vehicle from a previous assessment. VL1 is the unfactored live shear load effect of the reference vehicle, and VL2 is that of the assessed vehicle. Note that the determination of RF1 uses the MCFT-based strength equation in AS 5100.5. If RF2 for the section shear is less than unity, the assessed vehicle is not permitted on the bridge. The use of a platform table, which shows the allowable trailer axle loads of a heavy vehicle for different numbers of trailer axles, to support the permit assessment was described by Smith and Parvin [6]. These tables were created to enable speedy and accurate assessment of requested permits for heavy vehicles with a platform trailer that has various numbers of axles. No information was provided on its creation, and these tables were likely developed using ratings for shear not based on MCFT, since the article was published in 2017, the year when MCFT was first adopted by AS 5100.5 [2] for shear strength determination in Australia. The creation of a platform table to meet the requirement of the latest standard requires rigorous analyzes owing to shear strength being dependent on load effects. In Section 2, a numerical study is carried out to present the approach for creating a platform table for a more accurate assessment of vehicle permit requests.
The rigorous analysis described in this paper results in accurate scaling factors for optimal shear adequacy. The analysis was based on several simplifying assumptions, including the calculation of the axle loads acting on the girder using the Lever Rule method, and that shear reinforcement and both top and bottom steels are uniform along the beam. The Lever Rule method gives an approximate transverse distribution factor to determine the proportion of the total load of an axle carried by the girder. The method assumes no moment continuity at the interior girders of the transverse deck, rendering the deck statistically determinate. This allows a line beam 1-D model to be used instead of a 2-D grillage representation, or a 3-D finite-element representation.
The assumption of uniform reinforcement along the beam reduces the amount of input. The approach to determine SFtrailer is also suitable for girders with non-uniform reinforcement when using linear elastic analysis as it does not affect the calculation of load effects where the flexural stiffnesses of members are based on gross section concrete properties. Since shear is section-based, the scaling factor is not affected by the detail of reinforcement elsewhere if the reinforcement of the critical section with the lowest rating factor remains the same. In practice, full compliance with design standards must be met. Instead of the line beam used in the current study, a more accurate method of modelling the bridge such as a grillage model is most commonly used.
2. Generation of a Platform Table
Creating a platform table for assessing the shear adequacy of a bridge with a nominated rating vehicle requires a rigorous analysis. The process aims to determine the scaling factor SFtrailer of the platform trailer axles of a nominated rating vehicle and the factors for vehicles with fewer numbers of trailer axles, for optimal shear adequacy (RF = 1).
It should be noted that SFtrailer differs from the multiplying factor, MF, as the latter is basically a scaling factor, SFvehicle, applied to all axles of the vehicle for optimal shear adequacy. Using MF as the scaling factor to calculate allowable cartage loads may cause inaccuracy since the cartage load is carried by the trailer and not the prime mover (the driving unit with invariant axle loads) of the vehicle. In the present study, two computer programs written in Python [11] were used to carry out the rigorous analyzes, one for SFtrailer and the other for MF. Using a rigorous analysis to determine MF eliminates the trial-and-error iterative steps described in Section 1 to ensure that we obtain the lowest value of MF for the girder.
2.1. Vehicle–Bridge System Used in Analysis
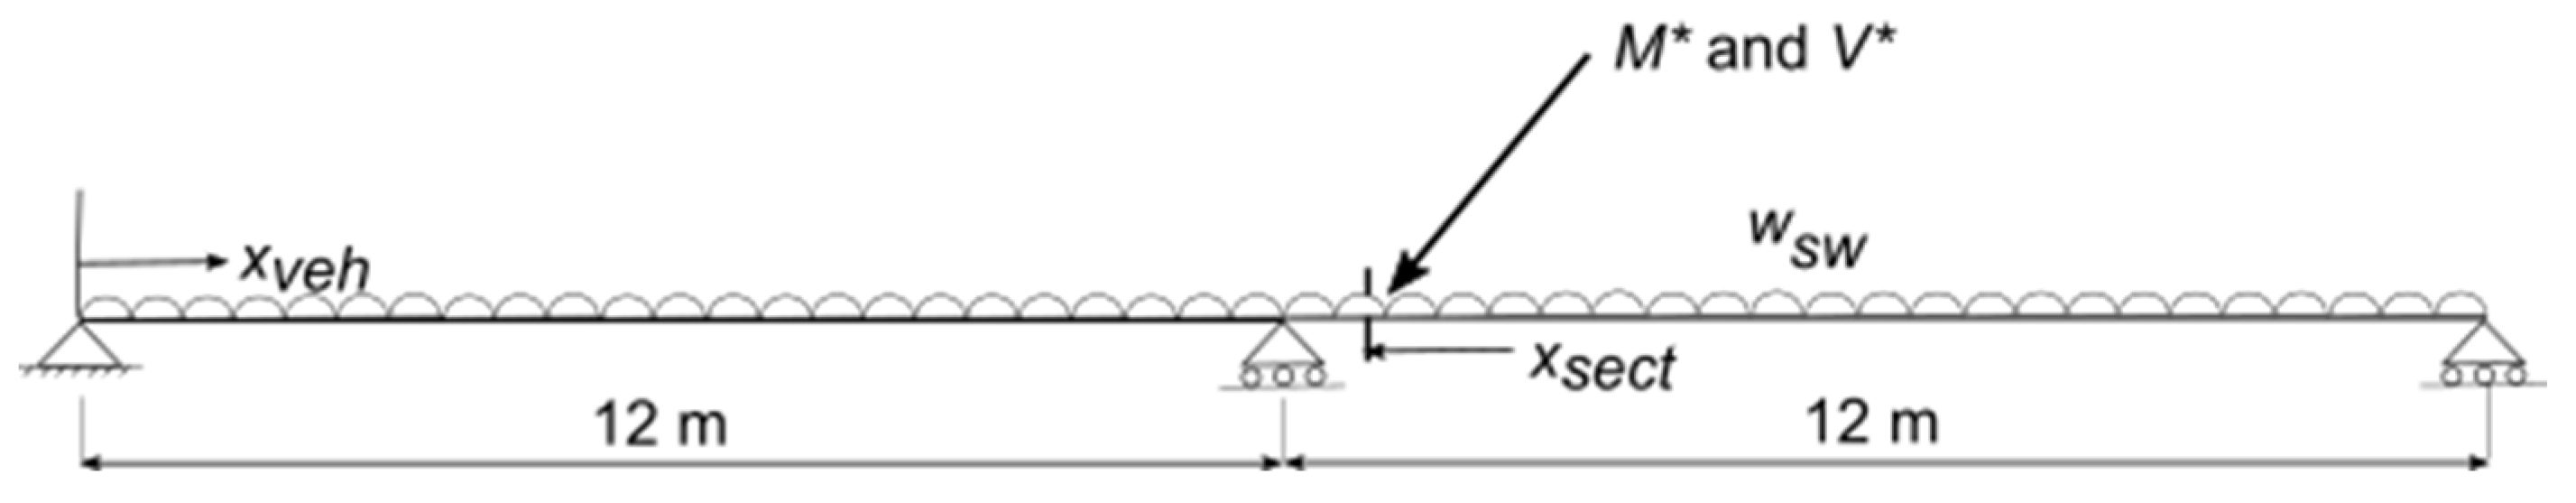
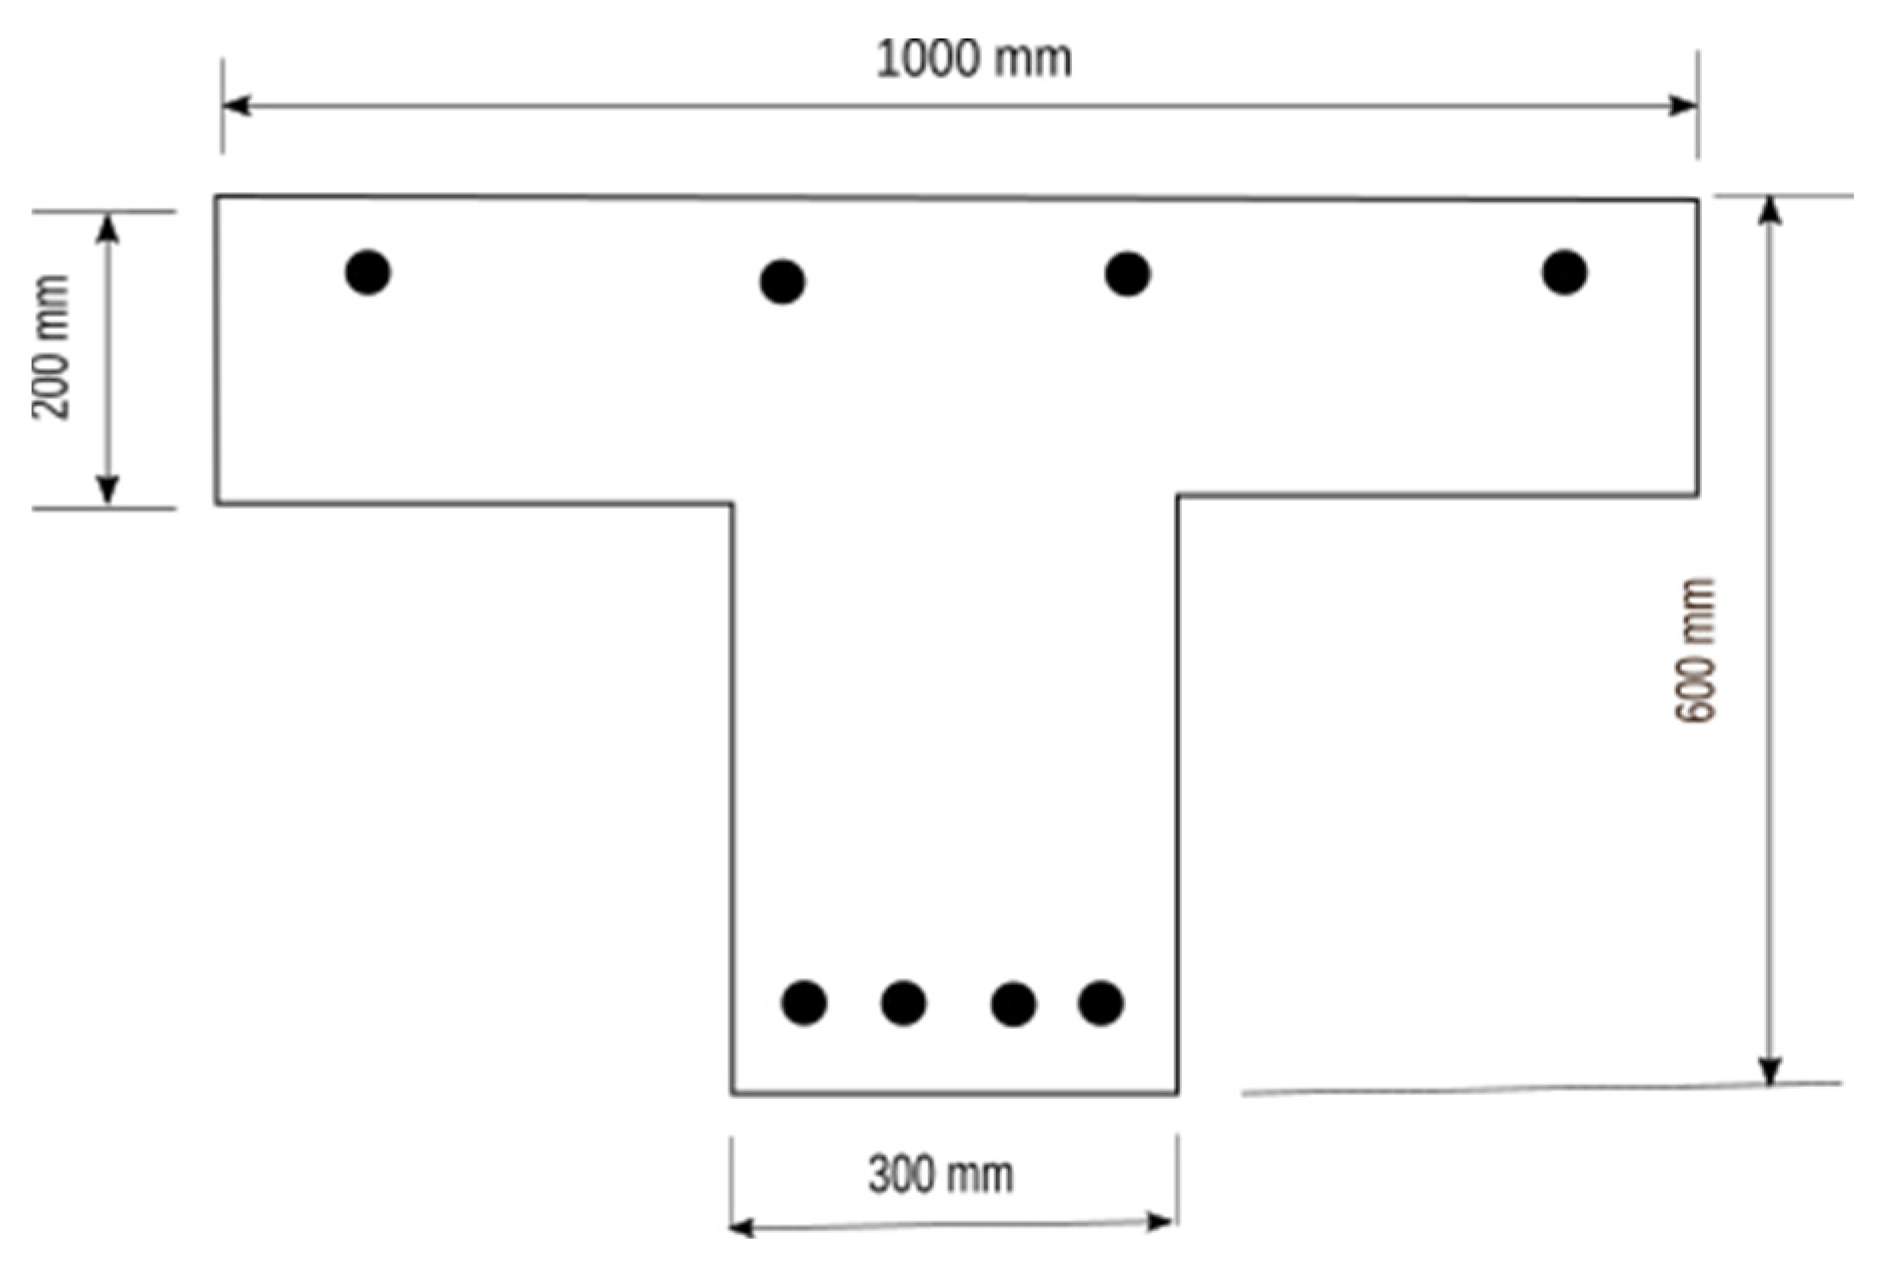
The system selected for analysis is a two-span undivided RC bridge with no bridge barrier between the marked lanes. The bridge is symmetrical about the middle support. The span length is shown in Figure 1, and the cross-section of an interior girder is shown in Figure 2. The material strengths used are as follows: the concrete characteristic strength f′c = 40 N/mm2, the yield strength is 500 MPa for both longitudinal and shear reinforcements, and the modulus of elasticity Es for the reinforcements is 200.0 × 10³ MPa. The shear reinforcement is two legs of N16 (Asv = 400 mm2) at 200 mm centers along the girder. The top longitudinal reinforcement is assumed to be 4N24 (Ast = 1800 mm2) and the bottom reinforcement is 4N20 (Ast = 1240 mm2). The sections are assumed to be singly reinforced for bending, with the area of steel Ast equaling that of the bottom steel for T-beam positive bending and equaling that of the top steel for rectangular beam negative bending. Effective depths for both top and bottom steels are assumed to be the same, equal to 500 mm.

Figure 1.
Two-span bridge.
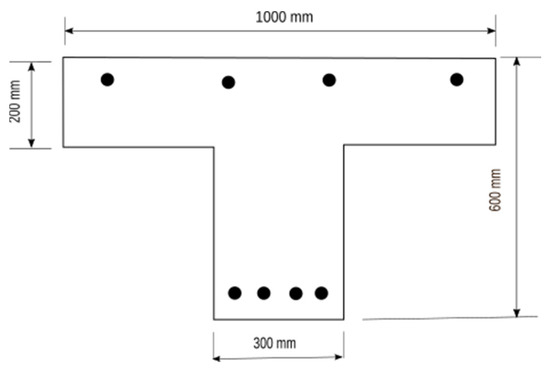
Figure 2.
Typical cross-section of interior girder.
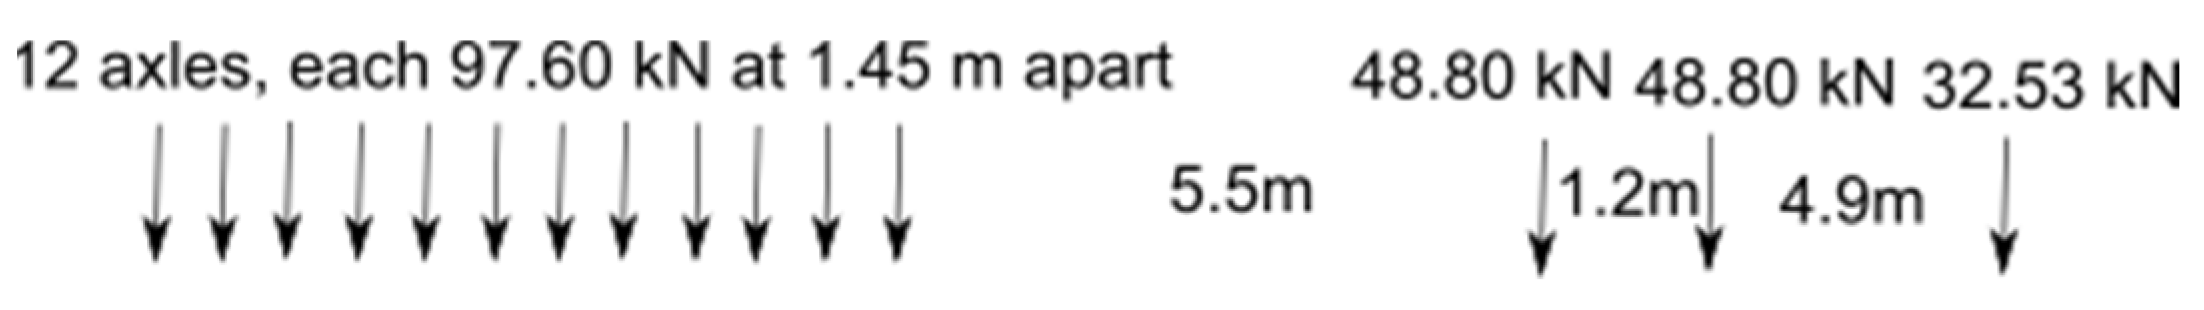
The selected rating vehicle is the nominated rating vehicle G2V5 of MRWA [9]. This vehicle has 15 axles, comprising a 12-axle platform trailer and a 3-axle prime mover (PM). One of its controlled movements is along a path known as center-move, with the centerline of the vehicle aligned with that of the bridge with permitted variations of up to ±1.0 m. The load factor for this vehicle is 1.5 and the dynamic load amplification factor is 0.1. The highest point of loading from the vehicle on an interior girder is when the middle of an inner wheel group is directly above the girder. Each trailer axle has four wheel groups, each with two wheels, and the spacings between the centers of adjacent groups along the axles are 0.85 m, 0.81 m and 0.85 m. Note that a wheel group is a group of wheels belonging to the axle sufficiently close together that their loads can be represented by a single load placed at the centroid of the group for analysis. In the analysis, the trailer cartage load was taken as the base loading with the axles, each having a full axle load of 18 tonnes (t). The share of the trailer axle-factored load supported by the girder was determined by using the Lever Rule method to be 97.60 kN (=0.335 × 18-t × 9.81 kN/t × 1.5 × 1.1). An assumption was made that the number and the transverse spacing of the wheel groups are the same for both the PM and trailer axles since no information was available in the design manual. The share of the axle loads for the prime mover is 48.80 kN (=0.335 × 9-t × 9.81 kN/t × 1.5 × 1.1) for the nine t axle and 32.53 kN (=0.335 × 6-t × 9.81 kN/t × 1.5 × 1.1) for the six t axle. The self-weight of the girder wsw is 9.6 kN/m using a unit weight of concrete of 25 kN/m3. The axle loads on the girder are shown in Figure 3.

Figure 3.
The axle loads acting on the girder from the nominated vehicle G2V5 (not to scale).
2.2. Determination of Minimum Load Rating Factor
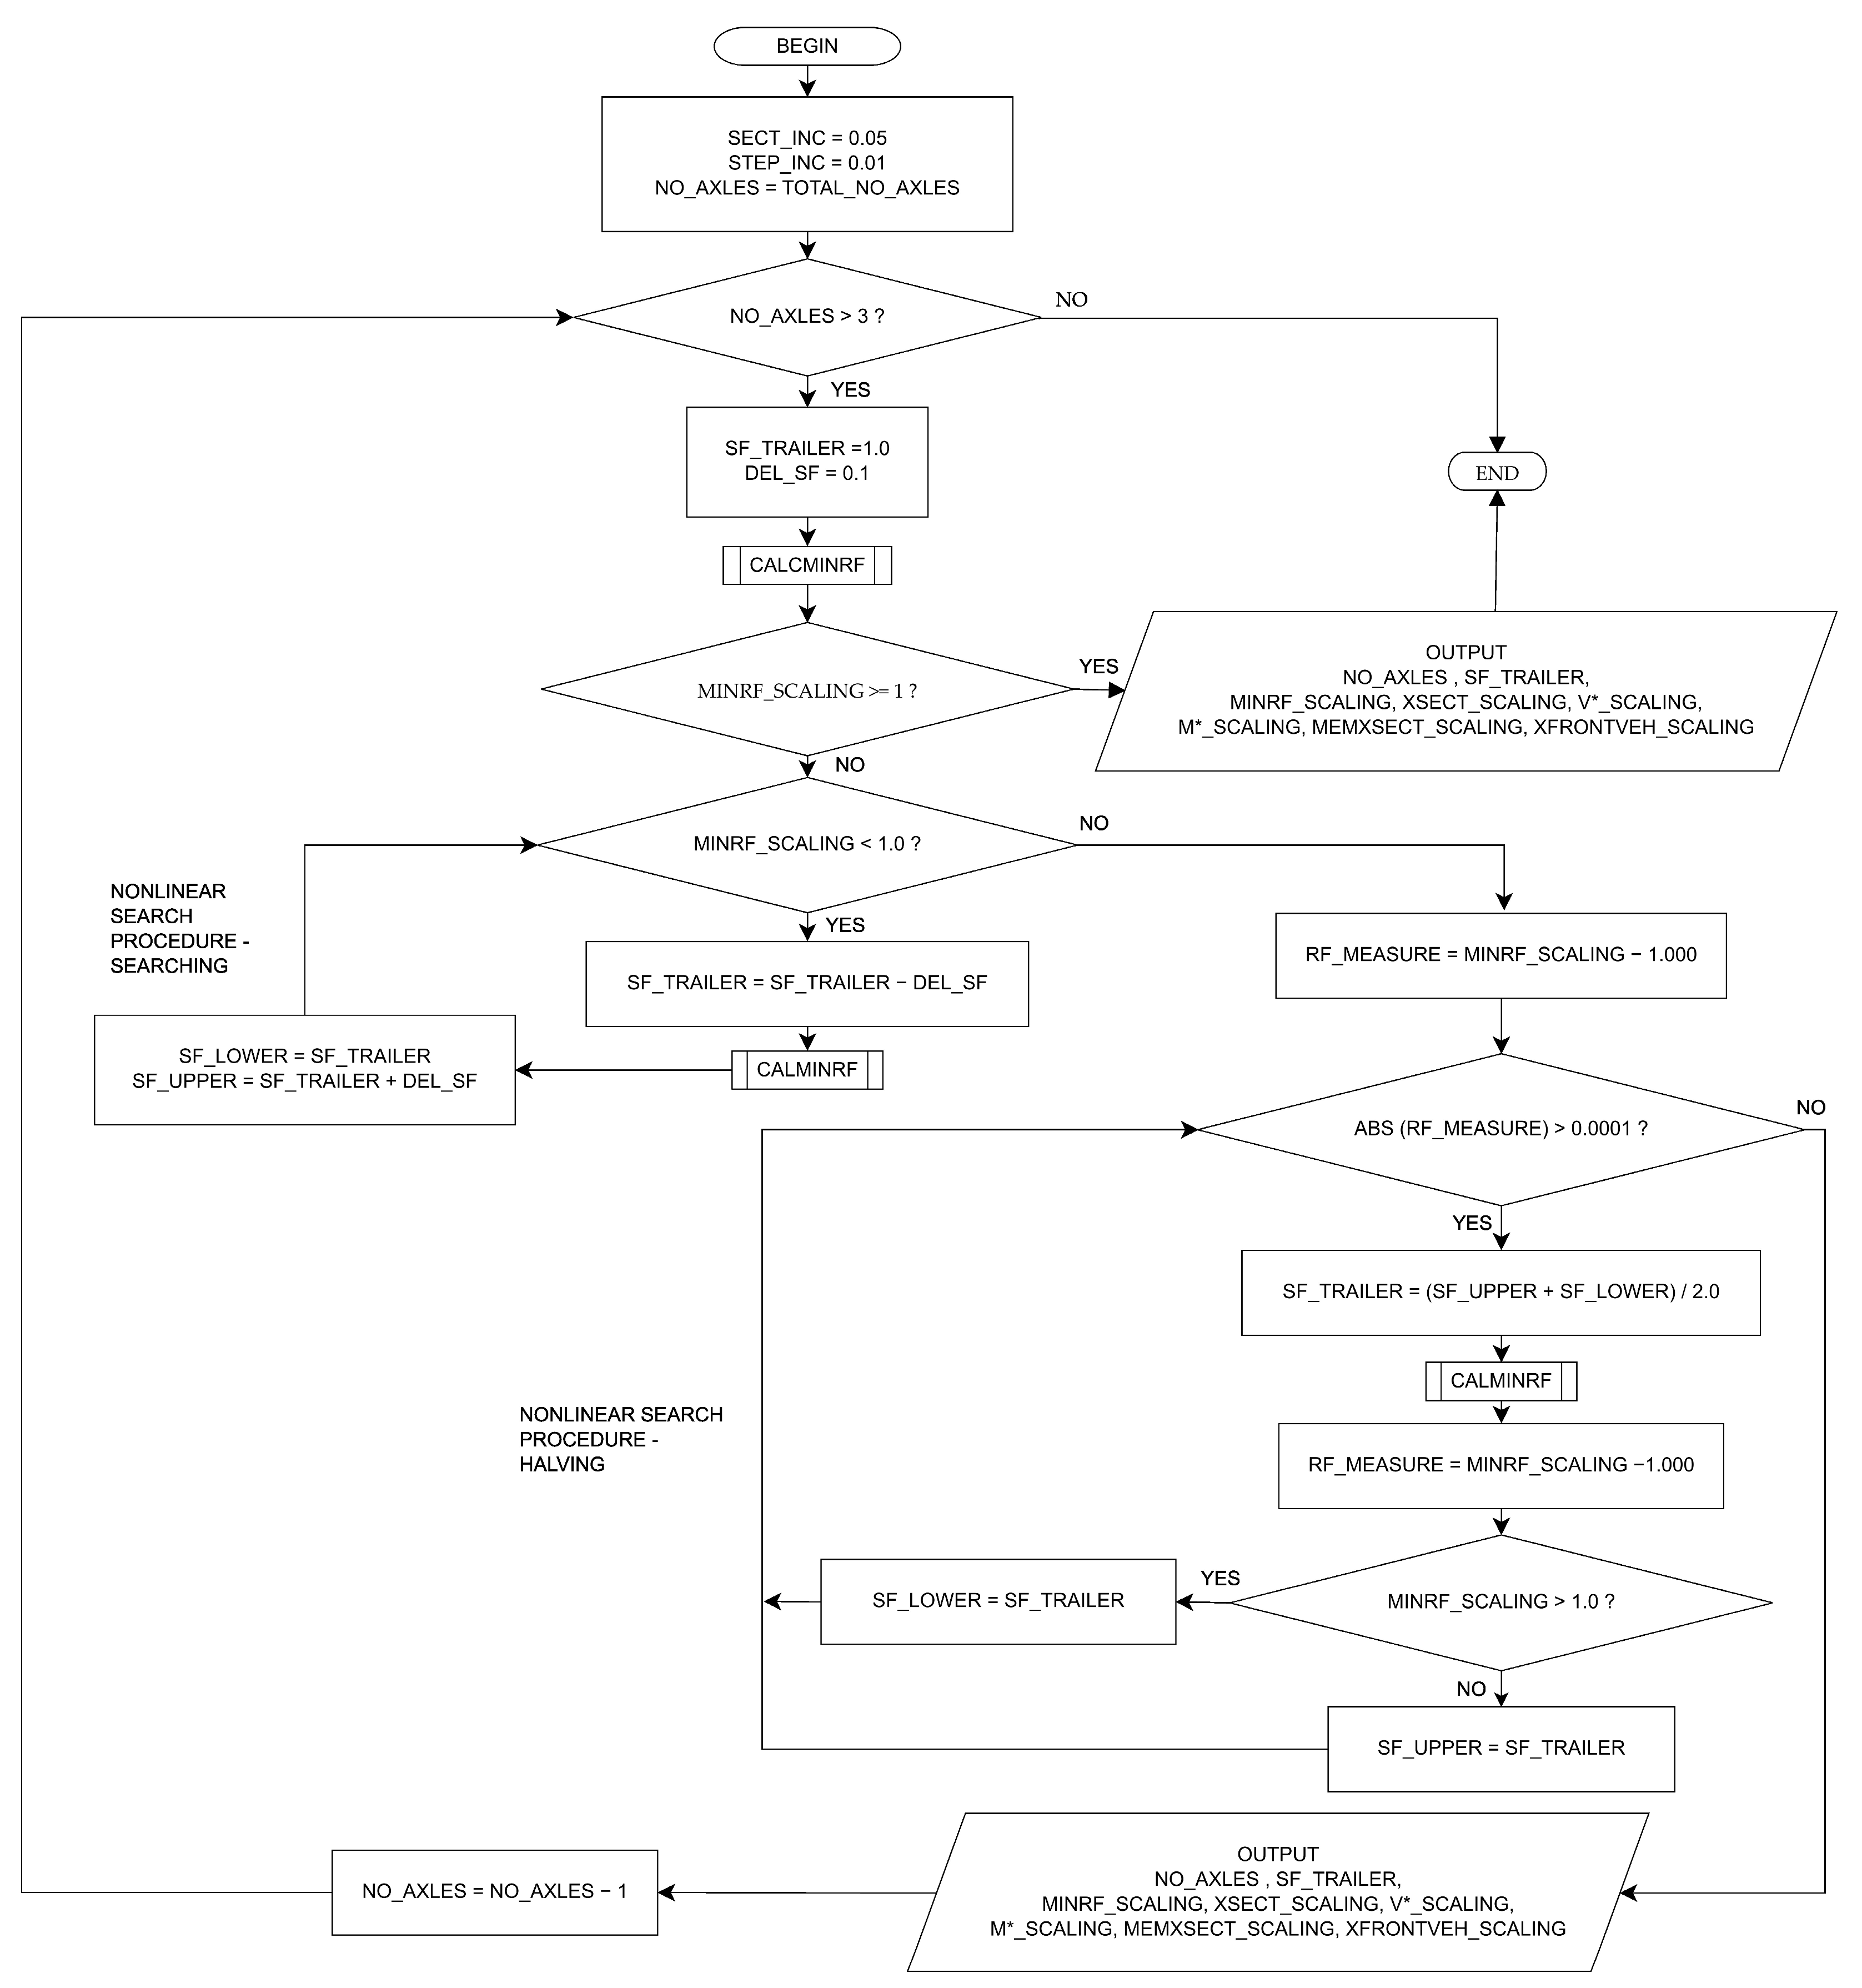
In this section, the user-defined function in Python CALCMINRF (see Figure 4) used to determine the minimum RFmin for a given SFtrailer is described. The RF is calculated for each combination of beam section and vehicle position. The sections are 0.05 m apart, starting from an xsect of 0.5 m and ending at 11.5 m for each of the two members from left to right (i.e., member 1, followed by 2). The vehicle positions are 0.01 m apart starting from an xveh of zero (left support) to 55.55 m (=27.55 m + 24.0 m), where the last axle of the vehicle leaves the bridge, from left to right. The number of sections in a cycle of calculation is approximately 220 (=[12 m – (2 × 0.5 m)]/0.05 m), and the number of movement positions for the nominated 15-axle rating vehicle with a length from the front to the back axles of 27.55 m is approximately 5155 (=[24 m + 27.55 m]/0.01 m) since a movement step of 0.01 m was used. The approximate number of repeated structural analyzes for each call of the function is 1,134,110 (=220 × 5155). For each of these combinations, the load effects M* and V* for the vehicle with scaled trailer axle loads were calculated using the Moment Distribution Method [12]. From these values, the RF for shear was calculated using the load rating equation provided in AS 5100.7 [1]. The minimum value was progressively updated, resulting in the final value being the minimum of all combinations. The function returns the following values: RFmin, and the corresponding values for the combination with RFmin: xveh, xsect, the member with xsect, the factored shear V* and the factored moment M*. The computer program described in Section 2.3 which uses this function took approximately 1.2 h to run on a PC with an Intel Core i3-3220 CPU @ 3.30 GHz processor (Intel Corporation, Santa Clara, CA, USA).
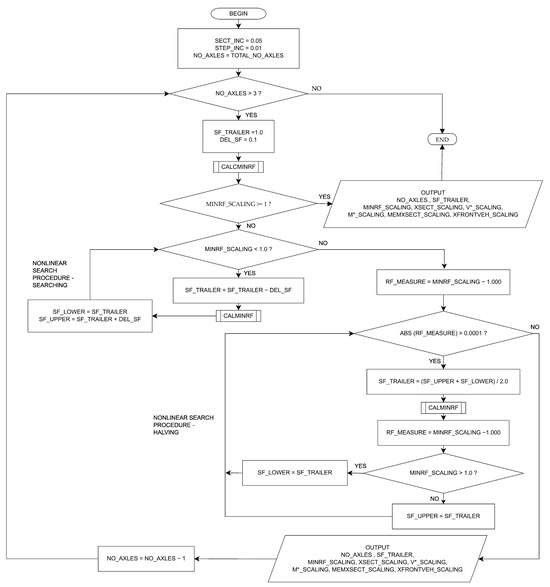
Figure 4.
A flow diagram of the main program with the nonlinear search procedure.
2.3. Seeking SFtrailer for Optimal Shear Adequacy
The platform table for a movement type, described later in this section, for a bridge is not required if the RF of the nominated rating vehicle, e.g., G2V5, is greater than or equals unity. This is because all similar vehicles with the number of trailer axles up to the maximum permitted on the roads are not restricted. Therefore, the seeking of SFtrailer is for a vehicle with a known number of trailer axles, each bearing 18 t, for a vehicle–bridge system with an RF less than unity.
An efficient two-stage nonlinear search procedure described by Ahmad and Warner [13] is used to obtain the SFtrailer for the RF of unity The first stage “searching” uses an envelope size of 0.1, starting with an SFupper of 1.0 and an SFlower of 0.9, and progressively moving it by 0.1 in the direction of decreasing the SFtrailer until the limits of the envelope bound the targeted value of the SFtrailer that gives RF = 1.0. This occurs when the SFlower gives RFmin ≥ 1.0. Note that SFupper always gives RFmin < 1.0.
The second stage “halving” is used to progressively reduce the bounding limits by replacing one of the two limits by the halfway value SFtrailer (=[SFupper + SFlower]/2) that maintains the bound. The narrowing of the bound continues until the halfway value gives an RF close to unity within a prescribed tolerance. A tight tolerance requirement of RF to be within 1.0 × 10⁻⁴ was used. The seeking of the SFtrailer for optimal shear adequacy was carried out for a range of vehicles with different numbers of trailer axles. The analysis begins with seeking the SFtrailer for a vehicle with 12 trailer axles (representing a G2V5) and progressively reducing the number of axles; the seeking of SFtrailer is carried out for each vehicle with the reduced number of axles until a vehicle without scaling is not restricted, that is, when the minimum RF ≥ 1 for SFtrailer = 1. Figure 4 shows the flow diagram describing the main program.
2.4. Platform Table—Its Creation and Use
Performing the analysis described in Section 2.3 for a range of trailer axle numbers for a common permit bridge movement type (e.g., non-controlled edge-move, controlled center-move, non-controlled center-move) for the different key load effects (e.g., axial force in the longitudinal reinforcement, bending, shear, torsion) enables tabulating the maximum permissible unfactored loads for the trailer axle of vehicles with different numbers of trailer axles for each movement type. Loading a vehicle with a fixed configuration beyond the maximum permissible value for the platform trailer is not required. For example, the unfactored load of the platform trailer axle of Group 2 vehicles is limited to 18 t. Compiling a table for a range of trailer axle numbers using the results from the exercise to give axle loads (to say nearest 0.1-t) for platforms for a set of axle widths and inter-axle spacing of a nominated rating vehicle (e.g., G2V5) enables us to assess a permit vehicle with a configuration close to one of these combinations. For the configurations suitable for trailer axle loads greater than 18 t, the permissible maximum value of 18 t is used. The results from the analysis are presented in Table 1.

Table 1.
SFtrailer and RF of vehicle–bridge system.
Row 2 of the table presents the results for the nominated rating vehicle G2V5. The lowest RF for the vehicle crossing the bridge determined using the ϕVu of the concurrent M*D&L and V*D&L by the Python program is 0.483. Thus, this bridge–vehicle system is inadequate for section shear. This RF is for the loading stage where the vehicle is at the position defined by xveh = 28.89 m for the critical section 11.5 m from the left end of the first member. For the same vehicle, optimal shear adequacy (with RF = 1.0) occurs when the SFtrailer is 0.598. The concurrent shear of this load-modified vehicle is |V*D&L| = 361.79 kN and |M*D&L| = 602.46 kNm. The ϕVu for this loading case is 361.81 kN, which differs from |V*D&L| by only +0.02 kN. Similarly, the other vehicles with fewer trailer axles (i.e., from 8–14 axles) require a reduction in their full 18 t trailer axle load to achieve optimal shear adequacy. The dead load effects at the critical sections at 0.5 m from the center supports are |M*D| = 138.0 kNm and |V*D| = 67.2 kN. They were determined by the program and used to calculate the rating factors presented in the table. The unfactored allowable trailer axle load is calculated as SFtrailer × 18-t.
Using the results summarized in Table 1, a platform table can be created to present the allowable unfactored axle loads that satisfy shear adequacy. In this case, Table 2 is a platform table for a vehicle with the trailer axle width and spacing of the G2V5 specification and different numbers of trailer (platform) axles for center-move. Vehicles not having the same axle configuration can be assessed using engineering judgment. An advantage of this method is where the requested tonnage of the trailer load of a permit vehicle is found to be excessive, a reduced value can be provided to the vehicle owners to manage cartages. Similar tables can be made for other action effects, including force in the longitudinal reinforcement and bending. The determination of RF for force without iteration is described by Wong and Vimonsatit [14].
Table 2.
The platform table for the G2V5 vehicle on the 2-span bridge (controlled center-move).
Bridge engineers carrying out bridge asset management must be able to rapidly assess bridges for vehicular loads [15]. Platform tables enable prompt assessment of requested permits. For example, a requested permit for a vehicle with a configuration similar to a G2V5 but with nine trailer axles to cross the bridge described in Section 2.1, each axle with a load of 14 t, is not permitted since its load exceeds the 13.5 t allowed for optimal section shear adequacy. This is more efficient than carrying out the rigorous analysis required for assessing section shear adequacy without using tables.
The results show that the moment/shear ratios (Table 1) are not the same at the critical section and the shear strengths are mostly not the same for the systems with optimal shear adequacy (i.e., RF = 1) when compared to the shear strength of the reference system (with the nominated rating vehicle G2V5) presented in row 2 of the table. There is also a possibility that their critical sections are not the same. All these load effects cause their shear strengths to be different from the value for the reference system, as can be seen in column 8 of the table. These are the possible causes of inaccuracies when using the load rating factor method [5] described in Section 1 to predict the RF of any of these optimal shear adequate systems. Using the MF in place of the RF does not eliminate the sources of inaccuracy since the MF is also determined using MCFT-based strengths.
3. Adverse Effects of Using MF for Creating Platform Tables
Parvin et al. [5] did not use the non-iterative strength consistent with the vehicle for calculating the RF. The resulting factor is therefore a multiplying factor MF, as described by Vimonsatit and Wong [4]. This section presents a study to demonstrate the possible inaccuracies caused by using the MF as the scaling factor for trailer axle loads instead of determining SFtrailer for RF = 1 for creating platform tables.
In this study, for each of the vehicles with the number of axles presented in Table 2 and with each trailer axle fully loaded to 18 t, i.e., SFtrailer = 1.0, the lowest MF was obtained using a rigorous analysis for the same combinations of the sections and vehicle positions described in Section 2.2. For each combination, the values of M*DL&LL and V*DL&LL were calculated. An iterative goal-seeking procedure was used to determine the value of ϕVu that equals V within a small tolerance for V = V1 + |V*DL| and M = (V1 × ηM) + |M*DL|, varying V1. The ratio ηM is equal to |M*DL&LL − M*DL|/|V*DL&LL − V*DL|. The procedure used is the same two-stage searching and halving solution procedure described in Section 2.3. The criterion used for convergence is |V − ϕVu| ≤ 0.1. The sought ϕVu was then used in place of the non-iterative ϕVu in the load rating equation to calculate the MF. Using this approach, the minimum MF values obtained from the analysis are given in Table 3, with their corresponding SFtrailer values from the bridge systems presented in Table 1. The percentage error of the MF calculated as [(MF − SFtrailer)/SFtrailer] × 100% ranges from 0 to 3.3%. This analytical outcome demonstrates the inaccuracy that can occur in scaling the vehicle axle loads instead of the trailer axle loads to obtain a modified vehicle for optimal shear adequacy.
Table 3.
Inaccuracies of using MF for creating platform table.
The system with 15 axles has no error owing to having only trailer axles on the bridge at the critical loading stage. The other systems have one or more PM axles on the bridge, thus resulting in inaccuracies in the MF, shown in the table, since these axle loads, supposed to be invariant, were reduced owing to the scaling being applied to all axles.
Using the MF as a scaling factor instead of SFtrailer to determine the allowable cartages and create the platform table is unconservative in cases where one or more PM axles are on the bridge at the critical loading stage. It is expected that the percentage error will be larger than those shown in Table 3 for vehicle–bridge systems with a combination of bridge and vehicle configurations where the adverse effect of reducing the load of the PM axles significantly reduces the load effects of the critical section at the critical loading stage.
Figure 5 shows the shear plotted against the longitudinal concrete strain εx at the mid-depth of member 1 at xsect = 11.5 m for the 11-axle vehicle. This is the system with the largest error in Table 3. Figure 5 shows the results of the two vehicles, one with a reduction factor of 0.667 applied to trailer axles (which is the SFtrailer), and the other with 0.689 applied to all axles (which is the MF). While both meet the strength line without exceeding it, as expected, they meet the strength line at different points, the former at ϕVu = 389 kN and the latter at ϕVu = 396 kN. The load effect for SFtrailer is accurate since the scaling of the axle loads is for the trailer only; the load effect from using the MF is not accurate. The plots show the unsuitability of using the MF to determine the allowable cartages of vehicle–bridge systems where the critical loading point has one or more PM axles on the bridge.
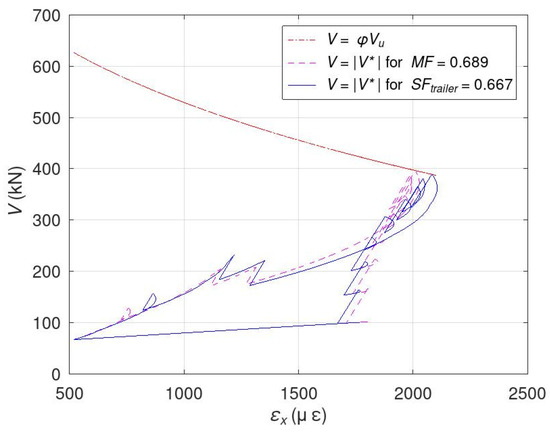
Figure 5.
Shear plotted against εx for vehicles with optimal adequacy.
4. Concluding Remarks
An illustrative study has been carried out to demonstrate the use of a rigorous analysis, taking into consideration the nonlinear relationship between the axle loads of a moving vehicles and MCFT-based strength to obtain information suitable for heavy vehicle movement management on concrete bridges. For an accurate assessment, a rigorous analysis scaling only the trailer axle loads of vehicles with a platform trailer is required. Listed below are the concluding remarks from the study.
- The study described in this paper shows the rigorous analysis used to determine the SFtrailer required to create additional information for the creation of a platform table to support the accurate assessment of permit requests for the movement of heavy platform vehicles. An accurate assessment is necessary to prevent overloading bridges causing them to have a shorter lifespan, to ensure safety, and to maximize the volume of cartage on haulage routes.
- The approach described in this paper is suitable for adoption by software providers to expand the scope of their current bridge analysis and design applications and carry out bridge assessments using more sophisticated bridge models that allow analyzes to obtain the information required for creating platform tables to support managing heavy vehicle movements.
- Although the creation of these tables is laborious, they only require updating when either the condition of the bridge or an influencing requirement of the design standard changes.
- The common multiplying factor, MF, which is obtained from scaling all axles of the vehicle to give an optimal shear adequate system, is not accurate for calculating allowable platform cartages.
This study shows the importance of maintaining consistency between the applied loading and the resulting MCFT-based shear strength in determining the allowable cartage loads of heavy vehicles with a platform trailer.
Author Contributions
Conceptualization, V.V. and K.W.W.; methodology, V.V. and K.W.W.; software, K.W.W.; validation, V.V. and K.W.W.; formal analysis, V.V. and K.W.W.; investigation, V.V. and K.W.W.; writing—original draft preparation, V.V. and K.W.W.; writing—review and editing, V.V. and K.W.W. All authors have read and agreed to the published version of the manuscript.
Funding
This research received no external funding.
Data Availability Statement
Data is contained within the article.
Conflicts of Interest
The authors declare no conflicts of interest.
References
- AS 5100.7; Bridge Design Part 7: Bridge Assessment. Standards Australia: Sydney, NSW, Australia, 2017.
- AS 5100.5; Bridge Design Part 5: Concrete (with 2018 and 2024 Amendments). Standards Australia: Sydney, NSW, Australia, 2017.
- Wong, K.W.; Vimonsatit, V. Determination of MCFT-based shear strength for Shear Load Rating of Concrete Bridges: The Effects of Using Load-Dependent Strengths. In Proceedings of the Bridge Engineering Institute Conference (BEI-2024), Las Vegas, NV, USA, 22–25 July 2024; pp. 332–336. Available online: https://beibridge.org/[BEI-2024]_Proceedings.pdf (accessed on 7 December 2024).
- Vimonsatit, V.; Wong, K.W. Bridge Assessment using MCFT—Determination of Load Multiplying Factors for Optimal Shear Adequacy. In Proceedings of the Bridge Engineering Institute Conference (BEI-2024), Las Vegas, USA, 22–25 July 2024; pp. 88–93. Available online: https://beibridge.org/[BEI-2024]_Proceedings.pdf (accessed on 7 December 2024).
- Parvin, J.; Hossain, R.; Kitis, N.; de Burgh, J.; Esteli, Z. Load Rating Factors Calculation for Bridge Deck as per AS5100.5—A Tee-Roff Bridge Example. In Proceedings of the Austroads Bridge Conference, Adelaide, SA, Australia, 15–18 November 2022. [Google Scholar]
- Smith, E.; Parvin, J. Semi-Automation of Period Permit and Single Trip Permit Vehicle Bridge Assessments. In Proceedings of the 8th Australian Small Bridge Conference, Surfer Paradise, QLD, Australia, 27–28 November 2017. [Google Scholar]
- Colosimo, V. Load Rating Bridge Structures—Vicroads Practice. In Proceedings of the Austroads 8th Bridge Conference, Sydney, NSW, Australia, 31 October–5 November 2011; pp. 231–244. [Google Scholar]
- Holt, J.; Garcia, U.; Waters, S.; Monopolis, C.; Zhu, A.; Bayrak, O.; Powell, L.; Halbe, K.; Kumar, P.; Chavel, B. Concrete Bridge Shear Load Rating; Synthesis Report; Federal Highway Administration; U.S. Department of Tansport: Washington, DC, USA, 2018.
- Main Roads Western Australia. Bridge Branch Design Information Manual. Version 7. Document Reviewed 2022. Available online: https://www.mainroads.wa.gov.au/technical-commercial/technical-library/ (accessed on 7 December 2024).
- Main Roads Western Australia. Structural Engineering Design Manual. Document Number No. 3912/03. Document Reviewed 2014. Available online: https://www.mainroads.wa.gov.au/technical-commercial/technical-library/ (accessed on 7 December 2024).
- Python. Available online: https://www.python.org/ (accessed on 14 October 2024).
- Hibbeler, R.C. Structural Analysis, SI ed; Prentice Hall, Pearson Education South East Asia Pte Ltd.: Singapore, 2002; pp. 443–447. [Google Scholar]
- Ahmad, A.; Warner, R.F. Ductility Requirements for Continuous Reinforced Concrete Structures; Research Report No. R62; Department of Civil Engineering, University of Adelaide: Adelaide, SA, Australia, 1984. [Google Scholar]
- Wong, K.W.; Vimonsatit, V. Determination of Shear Capacity for Load Rating of Concrete Bridges to AS 5100.7-2017. Infrastructures 2022, 7, 156. [Google Scholar] [CrossRef]
- Molloy, P. Bridge Load Assessment—Current Practice in South Australia. In Proceedings of the Austroads 4th Bridge Conference, Adelaide, SA, Australia, 29 November–1 December 2000; pp. 205–216. [Google Scholar]

Disclaimer/Publisher’s Note: The statements, opinions and data contained in all publications are solely those of the individual author(s) and contributor(s) and not of MDPI and/or the editor(s). MDPI and/or the editor(s) disclaim responsibility for any injury to people or property resulting from any ideas, methods, instructions or products referred to in the content. |
© 2024 by the authors. Licensee MDPI, Basel, Switzerland. This article is an open access article distributed under the terms and conditions of the Creative Commons Attribution (CC BY) license (https://creativecommons.org/licenses/by/4.0/).