Abstract
Road crashes, although random events, frequently occur on roads. However, certain characteristic infrastructural locations require detailed analysis regarding the frequency of road crashes. This study examines the dynamics of road crashes at characteristic infrastructural locations in Serbia from 2018 to 2022, focusing on bridges, tunnels, railroad crossings, and road work zones. Using data on road crashes from official reports, the analysis includes trends in crash rates, fatalities, injuries, and material damage during the above-mentioned time frame. In addition to the data analysis, 22 experts from the fields of traffic engineering ranked the mentioned characteristic infrastructural locations in terms of road safety. The same questions were asked to six different artificial intelligence software programs. The findings reveal significant variations in crash rates across different infrastructures, with bridges and road work zones having the highest number of crashes. Expert assessment is in line with the analysis of the results, while artificial intelligence gives a completely opposite assessment.
1. Introduction
Road crashes are a global challenge that affects nations worldwide. These crashes result in injuries, disabilities, and fatalities, impacting individuals of all ages [1,2]. While crashes may occur randomly across road networks, certain characteristic infrastructural locations exhibit distinct characteristics that make them prone to a higher number of crashes. Bridges, tunnels, railroad crossings, and road work zones stand out as focal points for detailed research due to their unique features and potential hazards. This paper analyzes the dynamics of road crashes at characteristic infrastructural locations in Serbia [3,4] over a five-year period from 2018 to 2022. Several studies have researched various aspects of road crashes, starting from driver behavior and vehicle characteristics to road design and road environment factors [2,5,6,7,8]. While crashes can arise from countless causes, some research consistently emphasizes the importance of infrastructure-related variables in shaping crash patterns and outcomes.
Bridges are the main links for many transportation systems. Many of the bridges that were built are subject to deterioration but are still in use [9]. However, their structural complexity, limited visibility in fog conditions, slippery road surfaces in winter conditions, and frequent narrow lanes, as well as the impact of aerodynamics on bridges [10], due to the reduction in construction costs can pose challenges for drivers, potentially increasing the likelihood of crashes. Some of the previous studies have documented increased crash rates on bridges compared to straight road segments, highlighting the need for tailored safety interventions [9,11,12,13,14].
When it comes to tunnels, there are differences in the adhesion coefficient of road surfaces, as well as differences in lighting before the entrance to the tunnel and after exiting the tunnel, and the narrowing of traffic lanes in certain tunnels, due to the cost of tunnel construction, are just some of the factors that increase the risk of road crashes in tunnels. Poor signalization, inadequate maintenance, and insufficient emergency provisions have been identified as contributing factors to tunnel-related crashes in previous research, highlighting the importance of comprehensive risk assessment and preventative measures. When “poor and unmaintained” traffic signals, inadequate tunnel maintenance, and inadequate alerting of professional services are added to that, this factor gains additional importance in influencing the occurrence of road crashes in tunnels. Road crashes involving vehicles transporting hazardous goods are particularly dangerous in tunnels. Many studies have analyzed these mentioned aspects [15,16,17].
Railroad crossings represent another characteristic point of the road infrastructure, where the railroad and road transport systems intersect, which represents places of high risk for the occurrence of serious road crashes. Factors such as inadequate warning systems, poor visibility, damaged traffic signals and protective ramps, and driver negligence are key factors for the occurrence of many (severe) road crashes at railroad crossings. In addition to motor vehicle drivers, pedestrians and cyclists are often injured at railroad crossings [18,19,20,21].
Work zones are dangerous places that increase the risk of crashes. Reduced visibility is a common problem, as obstacles such as equipment and temporary structures obstruct views, making it difficult for drivers to anticipate changes in traffic. Altered traffic patterns, such as lane shifts and narrowed lanes, can confuse drivers and lead to lane drifting. Uneven road surfaces pose another threat, potentially causing a loss of vehicle control, especially at high speeds. Navigating work zones often requires sudden stops due to slower-moving vehicles or unexpected lane closures, increasing the risk of rear-end collisions. Tired workers enduring long shifts can exhibit impaired judgment and reflexes, further complicating road safety. Additionally, poorly marked hazards like exposed equipment or loose debris can catch drivers off guard. Despite eventual improvements in road safety, there are still around 700 deaths per year in work zones. Understanding these risk factors empowers drivers to take proactive measures for safer roads. In 2022, the number of crashes in the work zone was severe, with 891 fatalities and 37,701 injuries. Crashes in the work zone include incidents that occur within the boundaries of the work zone or in its immediate vicinity, under the influence of activities, behavior, or traffic control within those boundaries. Upon analyzing fatalities, we find that 528 occurred in construction zones, 305 were in work zones of unknown types, 49 occurred in maintenance zones, and 9 were in utility zones. These figures illustrate the different environments in which work zone fatalities occur. Interestingly, the data reveal fluctuating trends over the years. In 2002, work zone fatalities peaked at 1186, in stark contrast to the lowest recorded fatalities in 2010, a total of 586. However, since 2010, there has been a notable 52% increase in work zone fatalities, though a slight 7% decrease was observed in 2022. Such statistics underscore the ongoing challenges and efforts required to improve safety within work zones [22]. Comprehensive costs of work zone crashes are estimated at over $37.9 billion annually. The benefits of reducing the number of crashes by implementing Positive Protection and barrier separation in work zones can be estimated at over $3.7–$8.7 billion annually (10–23% of work zone crash costs) [23].
When analyzing road crashes at various infrastructure locations, it is crucial to maintain a high-quality database with georeferenced data [24]. A study by Karamanlis et al. [25] examines this by providing a database of black spots—areas prone to crashes—on roads and characteristic infrastructure locations. Although various studies have addressed predicting road crashes on roads [26,27], accurately predicting crashes at characteristic infrastructure locations, which often result in more severe consequences for the involved parties, remains a significant challenge. This challenge is intensified when considering the rising use of electric and hybrid vehicles, which have unique risks associated with their batteries [28]. Beyond the direct outcomes of crashes, the psychological impact, particularly stress, on individuals involved is an essential factor that requires separate analysis [29,30]. This issue underscores the complexity of improving road safety, especially in the context of rapidly evolving vehicle technologies and infrastructure demands [31,32].
By analyzing the existing literature, it becomes obvious that understanding the dynamics of road crashes at characteristic infrastructural locations requires a multifaceted approach that includes different spatial, temporal, and contextual factors. By using empirical data and applying rigorous analytical techniques, this research seeks to contribute to the body of knowledge on road safety and inform evidence-based policy interventions aimed at reducing crash rates and increasing the resilience of the road network.
The primary goal of this research is the analysis of road crashes at characteristic infrastructural locations throughout Serbia from 2018 to 2022, with a special focus on bridges, tunnels, railroad crossings, and road work zones. The objective of this research was to analyze data on road crashes at characteristic infrastructural locations for a period of two years, prior to the COVID-19 pandemic (2018 and 2019), during the pandemic (2020), and conditionally after the pandemic (2021 and 2022). Through comprehensive data analysis, this research seeks to identify trends in crash rates, fatalities, and injuries at these locations over the mentioned periods of time. In addition, the paper aims to research the relationships between various factors such as years and site-specific characteristics, shedding light on the underlying causes of variation in crash rates among different infrastructure locations. By achieving these goals, this research aims to provide valuable insight into the factors affecting road safety and propose evidence-based strategies to reduce road crashes and improve overall road safety in Serbia.
2. Materials and Methods
This section describes the methods of data collection and processing.
2.1. Data Collection
For this research, a comprehensive methodology was used for the analysis of road crashes at characteristic infrastructural locations in Serbia from 2018 to 2022. The data used for this research were taken from the databases of the National Agency for Road Safety [33] and the Public Enterprise Roads of Serbia [28]. Data collection involved collecting information on fatalities, injuries, and property damage resulting from crashes from official sources such as police reports. Four key infrastructure locations were selected for analysis: bridges, tunnels, railroad crossings, and road work zones, based on their importance in the traffic network. For this study, data were exclusively sourced from non-highway roads to ensure that the average annual daily traffic (AADT) remained approximately consistent across all selected infrastructure locations. This methodological approach was chosen to mitigate discrepancies in traffic volumes, thereby enabling a more accurate and meaningful comparison of crash densities across various types of infrastructure. This methodological approach achieves a more realistic comparison of the four mentioned characteristic infrastructure locations because the AADT is in a lower range. For the purposes of this paper, artificial intelligence was used only for Section 3.3.
2.2. Expert Assessments
Twenty-four experts participated in the research with the goal of ranking the following characteristic infrastructural locations on the road network in terms of road safety: bridges, tunnels, road work zones, and railroad crossings. They ranked them from the most unsafe to the safest. The experts had PhDs in the fields of construction and traffic and were selected based on stringent criteria. These criteria included having at least five publications in SCI-listed journals in their area of expertise within the last three years. Additionally, they were required to have a proven track record of contributions to the field, demonstrated through participation in relevant professional conferences and projects or having various awards for their contribution to the field. All experts voluntarily participated in the research. The respondents did not receive any type of compensation for participating in the research. During the research, all ethical principles were respected. All respondents gave their informed consent for inclusion before they participated in the study. The study was conducted in accordance with the Declaration of Helsinki.
2.3. Artificial Intelligence (AI)
The task for artificial intelligence was to rank the following characteristic infrastructural locations on the road network in terms of road safety: bridges, tunnels, road work zones, and railroad crossings. Six artificial intelligence software programs were used, according to recommendations from the literature [34,35]. The software programs we used are Chat GPT-4), Chat AI, Chat Gate AI, Gemini 1.5, Copilot Microsoft, and DeepAI. These software programs were chosen based on their strong performance metrics in previous studies, their accessibility within Serbia, and their widespread use in similar analytical tasks, ensuring their relevance and reliability. Also, these software platforms are known for their advanced natural language processing capabilities, which are crucial for interpreting and analyzing complex data. Additionally, their availability and user support in the region provided a practical advantage, making them suitable for the scope of this study. One query was used for all software, and it was the same for all.
2.4. Processing Data
Statistical analysis was conducted using IBM SPSS Statistics v. 29 and the R Project for Statistical Computing (v. 4.3.3). Regression analysis was utilized to predict road crashes, while Network Analysis was employed for further data analysis. The normality of distribution was assessed through the inspection of histograms and the Kolmogorov–Smirnov test. As the data for all measured variables did not follow a normal distribution, nonparametric methods were employed. The significance of differences was evaluated using the Kruskal–Wallis and Friedman tests.
In this study, the null hypothesis (H0) was formulated as follows: there is no statistically significant difference between the groups. The alternative hypothesis (Ha) posited that there is a statistically significant difference between the groups. The threshold for statistical significance (α) was set at 5%. Consequently, if p < 0.05, H0 was rejected and Ha was accepted. Conversely, if p > 0.05, H0 was accepted.
3. Results
This section presents an individual analysis of road crashes (fatalities, injuries, material damage, and the total number of road crashes) at each of the characteristic infrastructural locations (bridges, tunnels, railroad crossings, and road work zones) from 2018 to 2020. Also, an analysis of the mutual comparison of the mentioned characteristic infrastructural locations is provided. In addition to the above, the results of expert assessments and the results of artificial intelligence software are also presented.
3.1. Analysis of Traffic Crashes Data
This section presents an individual analysis of road crashes (fatalities, injuries, material damage, and the total number of road crashes) at each of the characteristic infrastructural locations (bridges, tunnels, railroad crossings, and road work zones) from 2018 to 2020. Also, an analysis of the mutual comparison of the mentioned characteristic infrastructural locations is provided.
3.1.1. Bridges
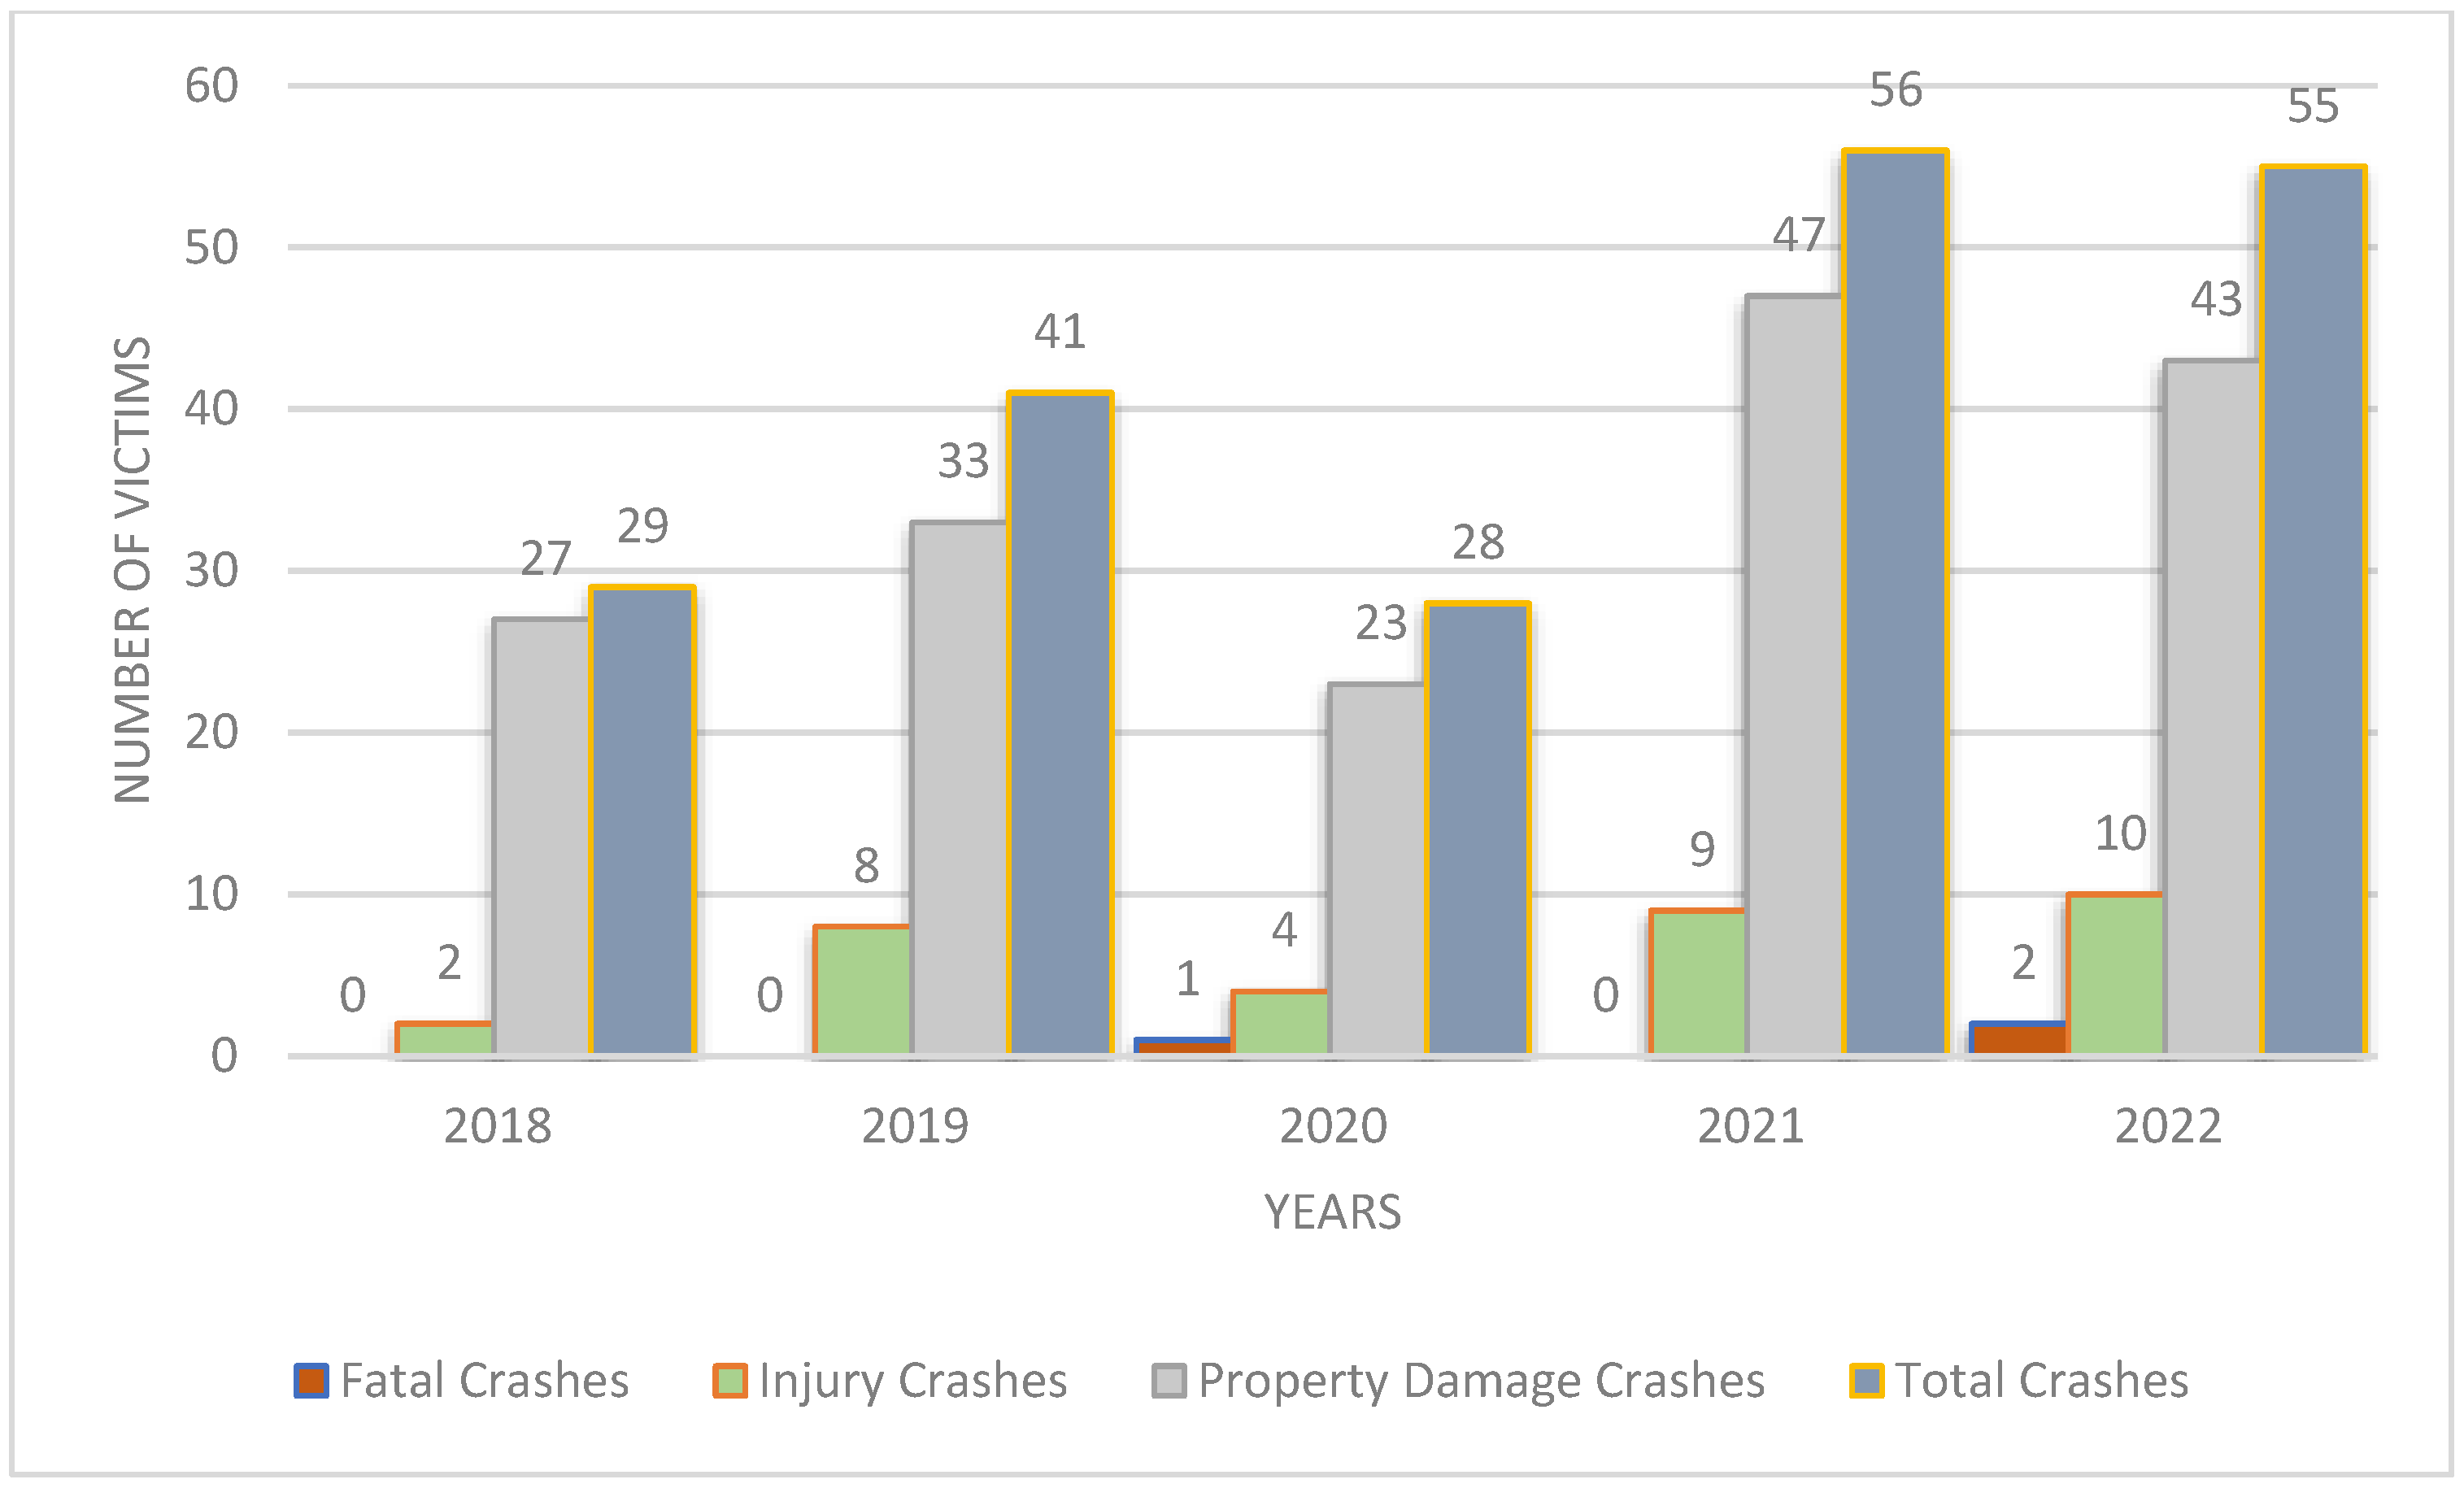
There are currently 3465 bridges with a total length of over 154 km and an area of over 1,760,000 m2 on the state roads of the Republic of Serbia. The Republic of Serbia has 297 large bridges over 100 m long on state roads [36]. Figure 1 shows the frequency of road crashes categorized by consequences beginning from 2018 to 2022 on bridges that are not on highways. Analysis of the graph suggests a minor declining trend in the number of road crashes over the mentioned years. The outcomes of the Kruskal–Wallis test indicate no statistically significant variances between the years concerning both the total number of road crashes (χ2(4) = 4.251, p = 0.324) and the fatalities resulting from road crashes (χ2(4) = 4.002, p = 0.407). This indicates that despite the slight decrease observed, the changes are not significant enough to suggest a consistent improvement in road safety over the analyzed period. The results for 2020 regarding bridges should be taken with caution due to the COVID-19 pandemic.
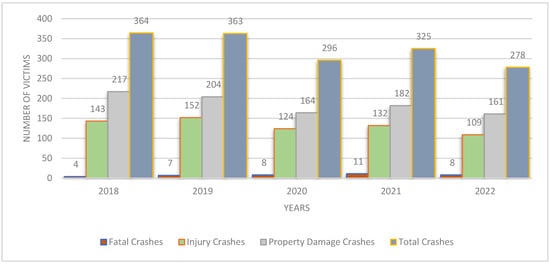
Figure 1.
Road crashes on bridges for the period from 2018 to 2022.
From 2018 to 2022, according to the type of road crash, the highest percentage of road crashes that occurred on bridges were “at least two vehicles moving in the same direction—overtaking” (33.38%), followed by “crashes with one vehicle—running off the road” (9.76%) [37].
3.1.2. Tunnels
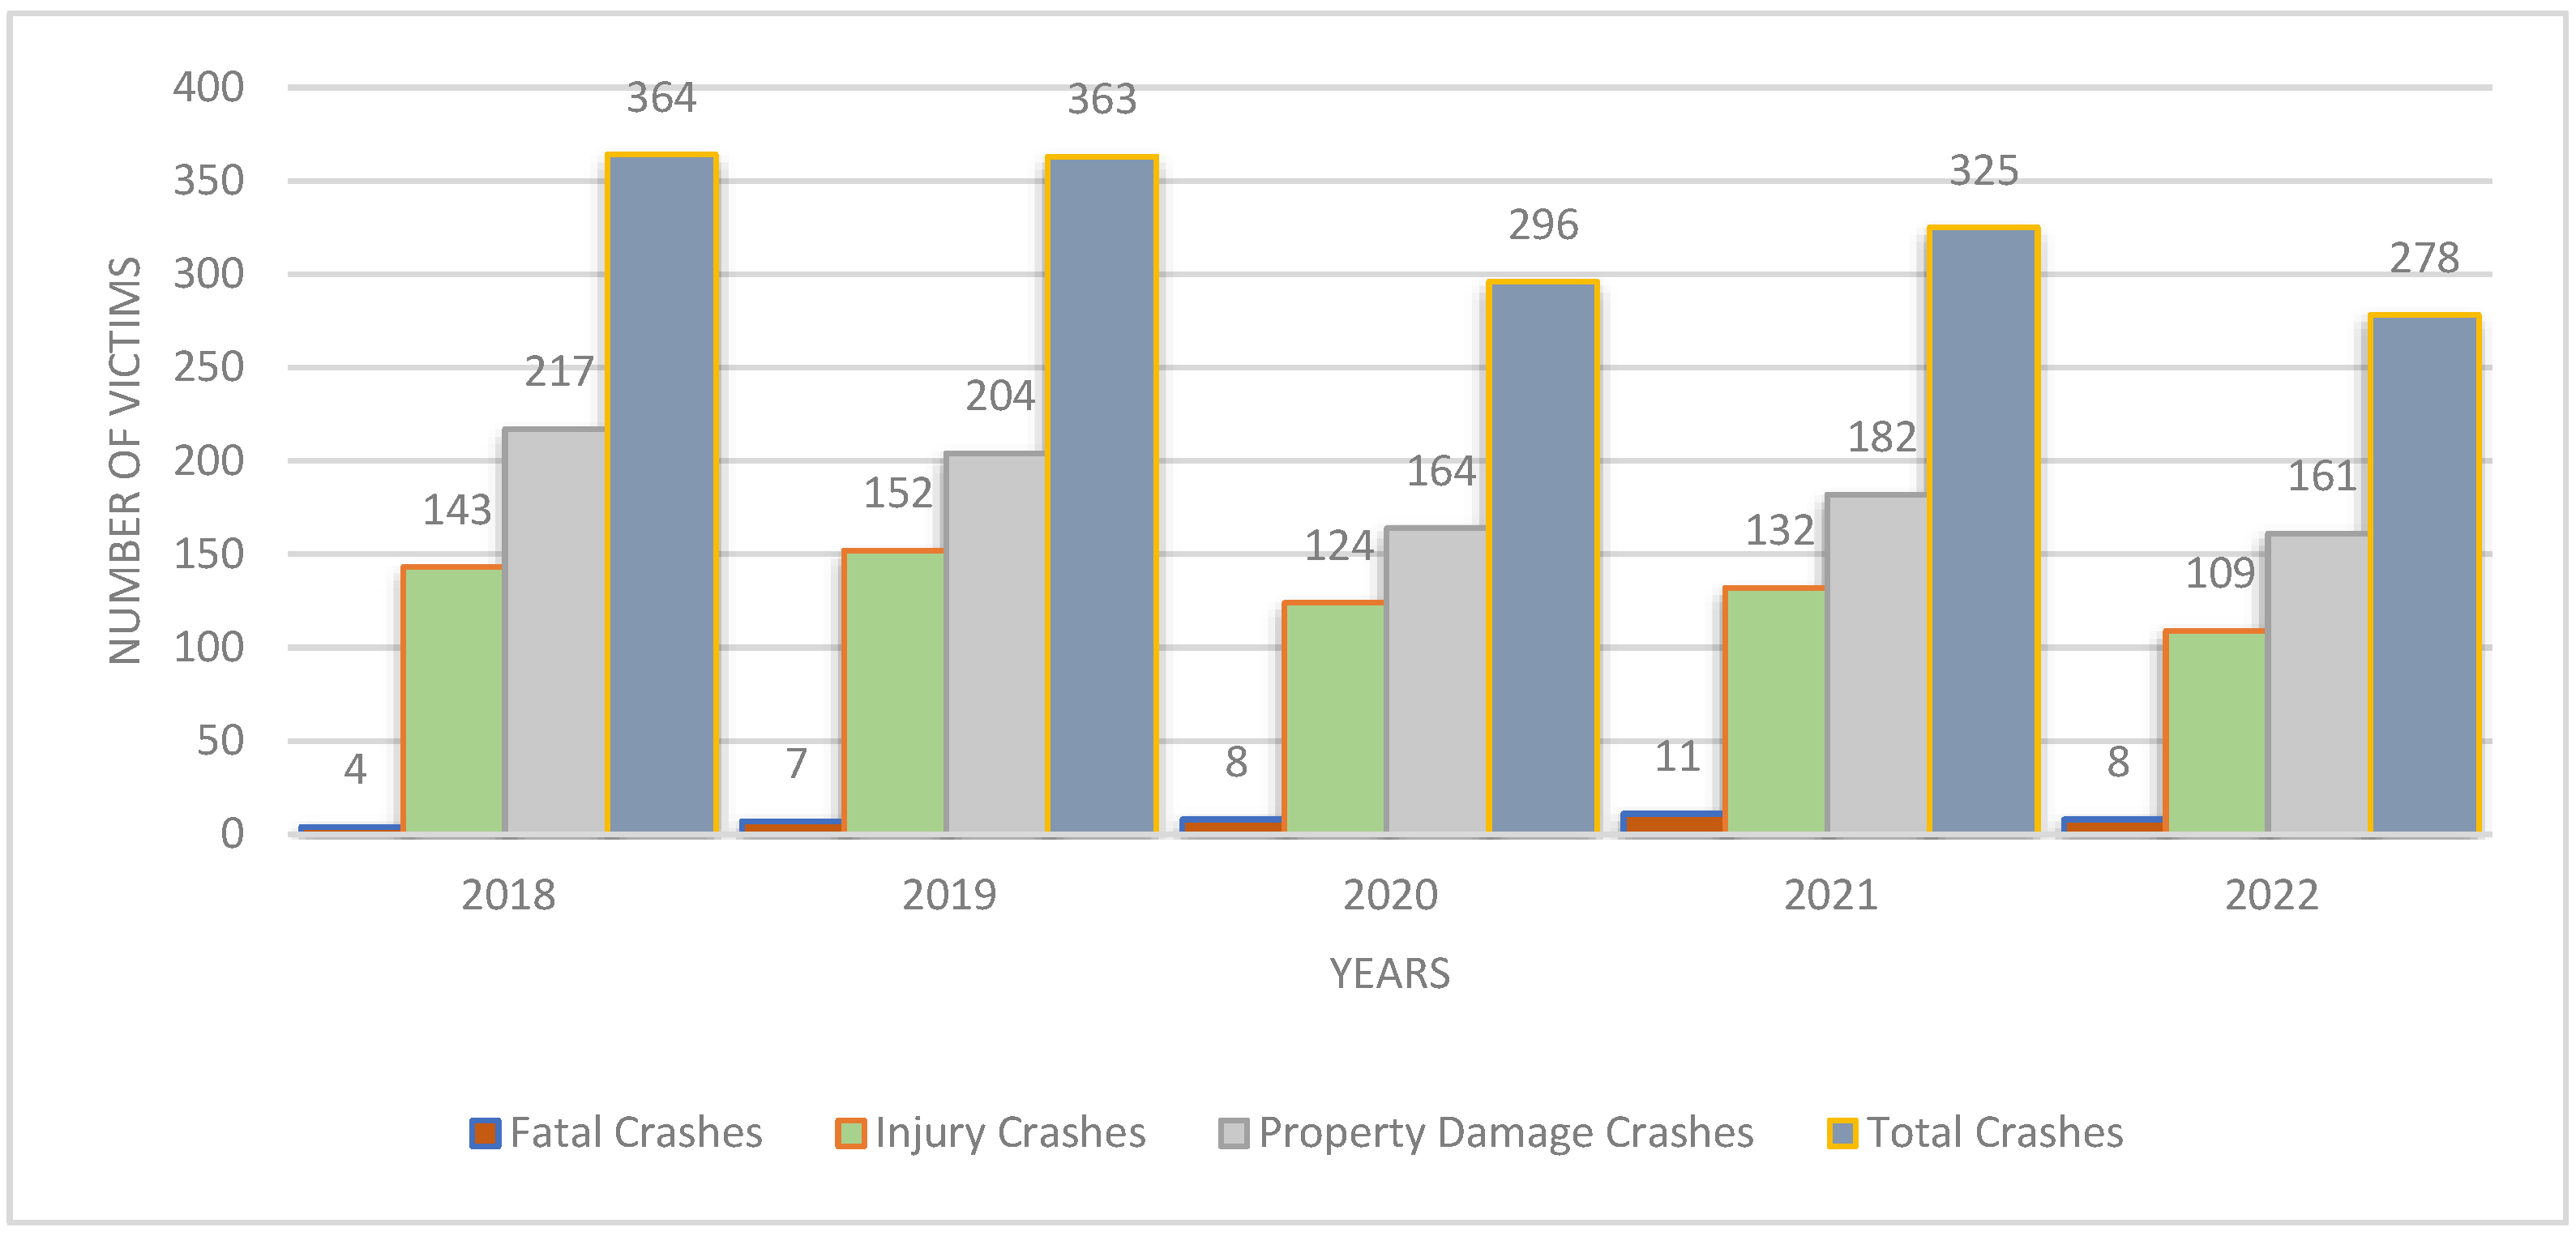
A network of 109 tunnels, with a total length of 31.81 km along the state roads of the Republic of Serbia, is currently in operation. Additionally, 32 tunnels are situated specifically along the major state roads [34]. Figure 2 shows data on road crashes in tunnels for the period from 2018 to 2022. The total number of road crashes and fatalities in road crashes vary from year to year. A slight drop can be observed in 2020, likely due to the consequences of the coronavirus and reduced mobility of people. The outcomes of the Kruskal–Wallis test indicate no statistically significant variances between the years concerning both the total number of road crashes (χ2(4) = 3.344, p = 0.504) and the fatalities resulting from road crashes (χ2(4) = 4.394, p = 0.355). This suggests that while there are fluctuations in crash statistics, these changes do not show a consistent trend or significant shift in road safety in tunnels over the analyzed period. The results for 2020 regarding tunnels should be taken with caution due to the COVID-19 pandemic.

Figure 2.
Road crashes in tunnels for the period from 2018 to 2022.
From 2018 to 2022, according to the type of road crash, the highest percentage of road crashes that occurred in tunnels were “at least two vehicles moving in the same direction—overtaking” (25.66%), followed by “crashes with one vehicle on the road” (9.87%) [37].
3.1.3. Railroad Crossings
There are 2104 railroad crossings in Serbia. Figure 3 shows data on road crashes at railroad crossings for a five-year period (from 2018 to 2022). The analyzed crashes at railroad crossings included all road crashes that occurred precisely at these locations, following current regulations. At this location, the total number of road crashes has increased over the years, as has the number of fatalities. It was also determined that there is no statistically significant difference in the total number of road crashes (χ2(4) = 4.669, p = 0.323) or in the number of fatalities in road crashes (χ2(4) = 4.967, p = 0.287) for this five-year period at railroad crossings. The results for 2020 related to railroad crossings should be taken with caution due to the COVID-19 pandemic. It is concerning that more than 50% of all railroad crossings on state roads in the Republic of Serbia are not adequately equipped with traffic signals and road equipment [38], which could potentially influence the observed results.

Figure 3.
Road crashes on railroad crossings for the period from 2018 to 2022.
From 2018 to 2022, observed according to the type of road crash, the highest percentage of road crashes that occurred at railroad crossings were “crashes involving a rail and road vehicle” (21.79%), followed by “crashes involving a single vehicle and obstacles on or above the road” (24.83%) [37].
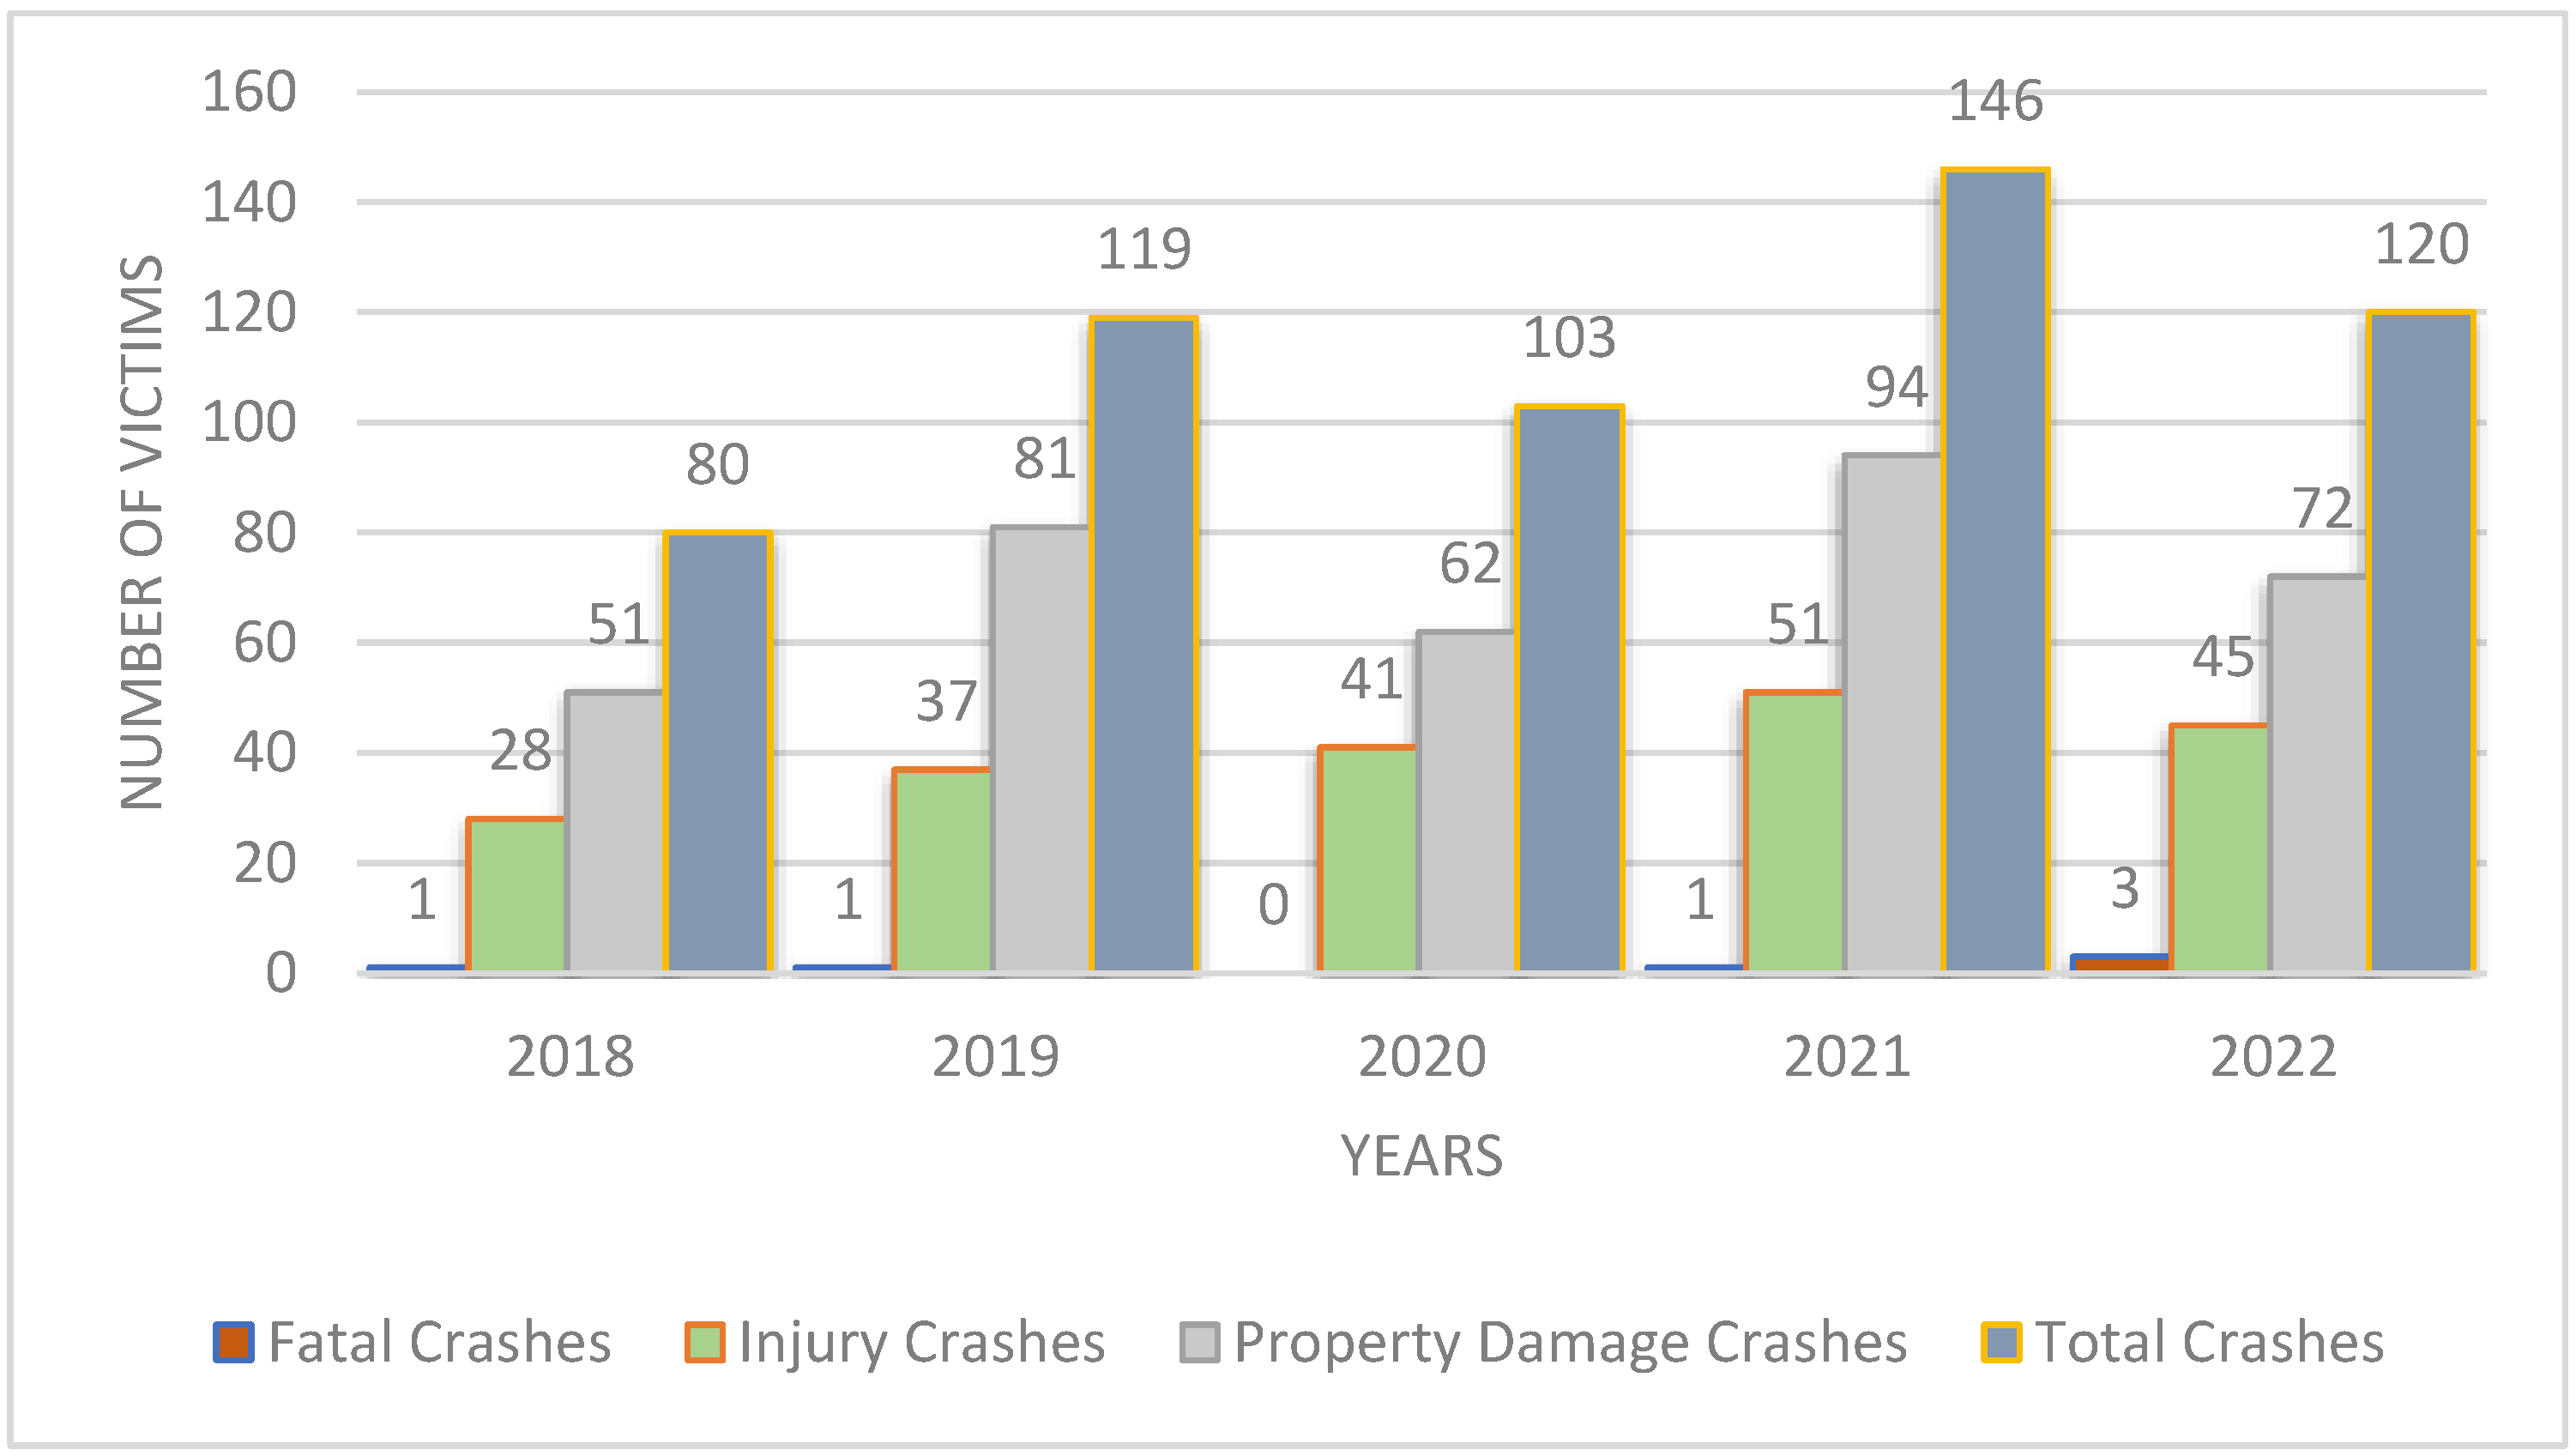
3.1.4. Road Work Zones
The statistical overview of road crashes for the period from 2018 to 2022 is shown in Figure 4. From the data, a slight decrease in the total number of road crashes in 2020 can be observed (the year of the coronavirus pandemic [39]). Regarding the characteristic infrastructural locations on the road network, there are no statistically significant differences by year for the total number of road crashes (χ2(4) = 4.527, p = 0.342) or the fatalities resulting from road crashes (χ2(4) = 4.836, p = 0.311). The results for 2020 related to road work zones should be taken with caution due to the COVID-19 pandemic.

Figure 4.
Road crashes on road works zones for the period from 2018 to 2022.
From 2018 to 2022, according to the type of road crash, the highest percentage of road crashes that occurred in the work zones were “at least two vehicles moving in the same direction—overtaking” (52.5%), followed by “crashes with one vehicle—running off the road” (22.5%) [37].
3.1.5. Comparison of Road Crashes at Characteristic Infrastructural Locations
When comparing the total number of road crashes for the four characteristic infrastructural locations, the highest number of road crashes occurs on bridges, then in road work zones, then at railroad crossings, and the least road crashes occur in tunnels. The statistical Friedman test also confirms that there are differences between the mentioned critical transport infrastructures (χ2(3) = 14.362, p = 0.002). The situation is similar when looking at the number of road crashes with material damage (χ2(3) = 15.353, p = 0.001), for crashes with injuries (χ2(3) = 14.938, p = 0.003), and for crashes with fatalities (χ2(3) = 11.428, p = 0.009).
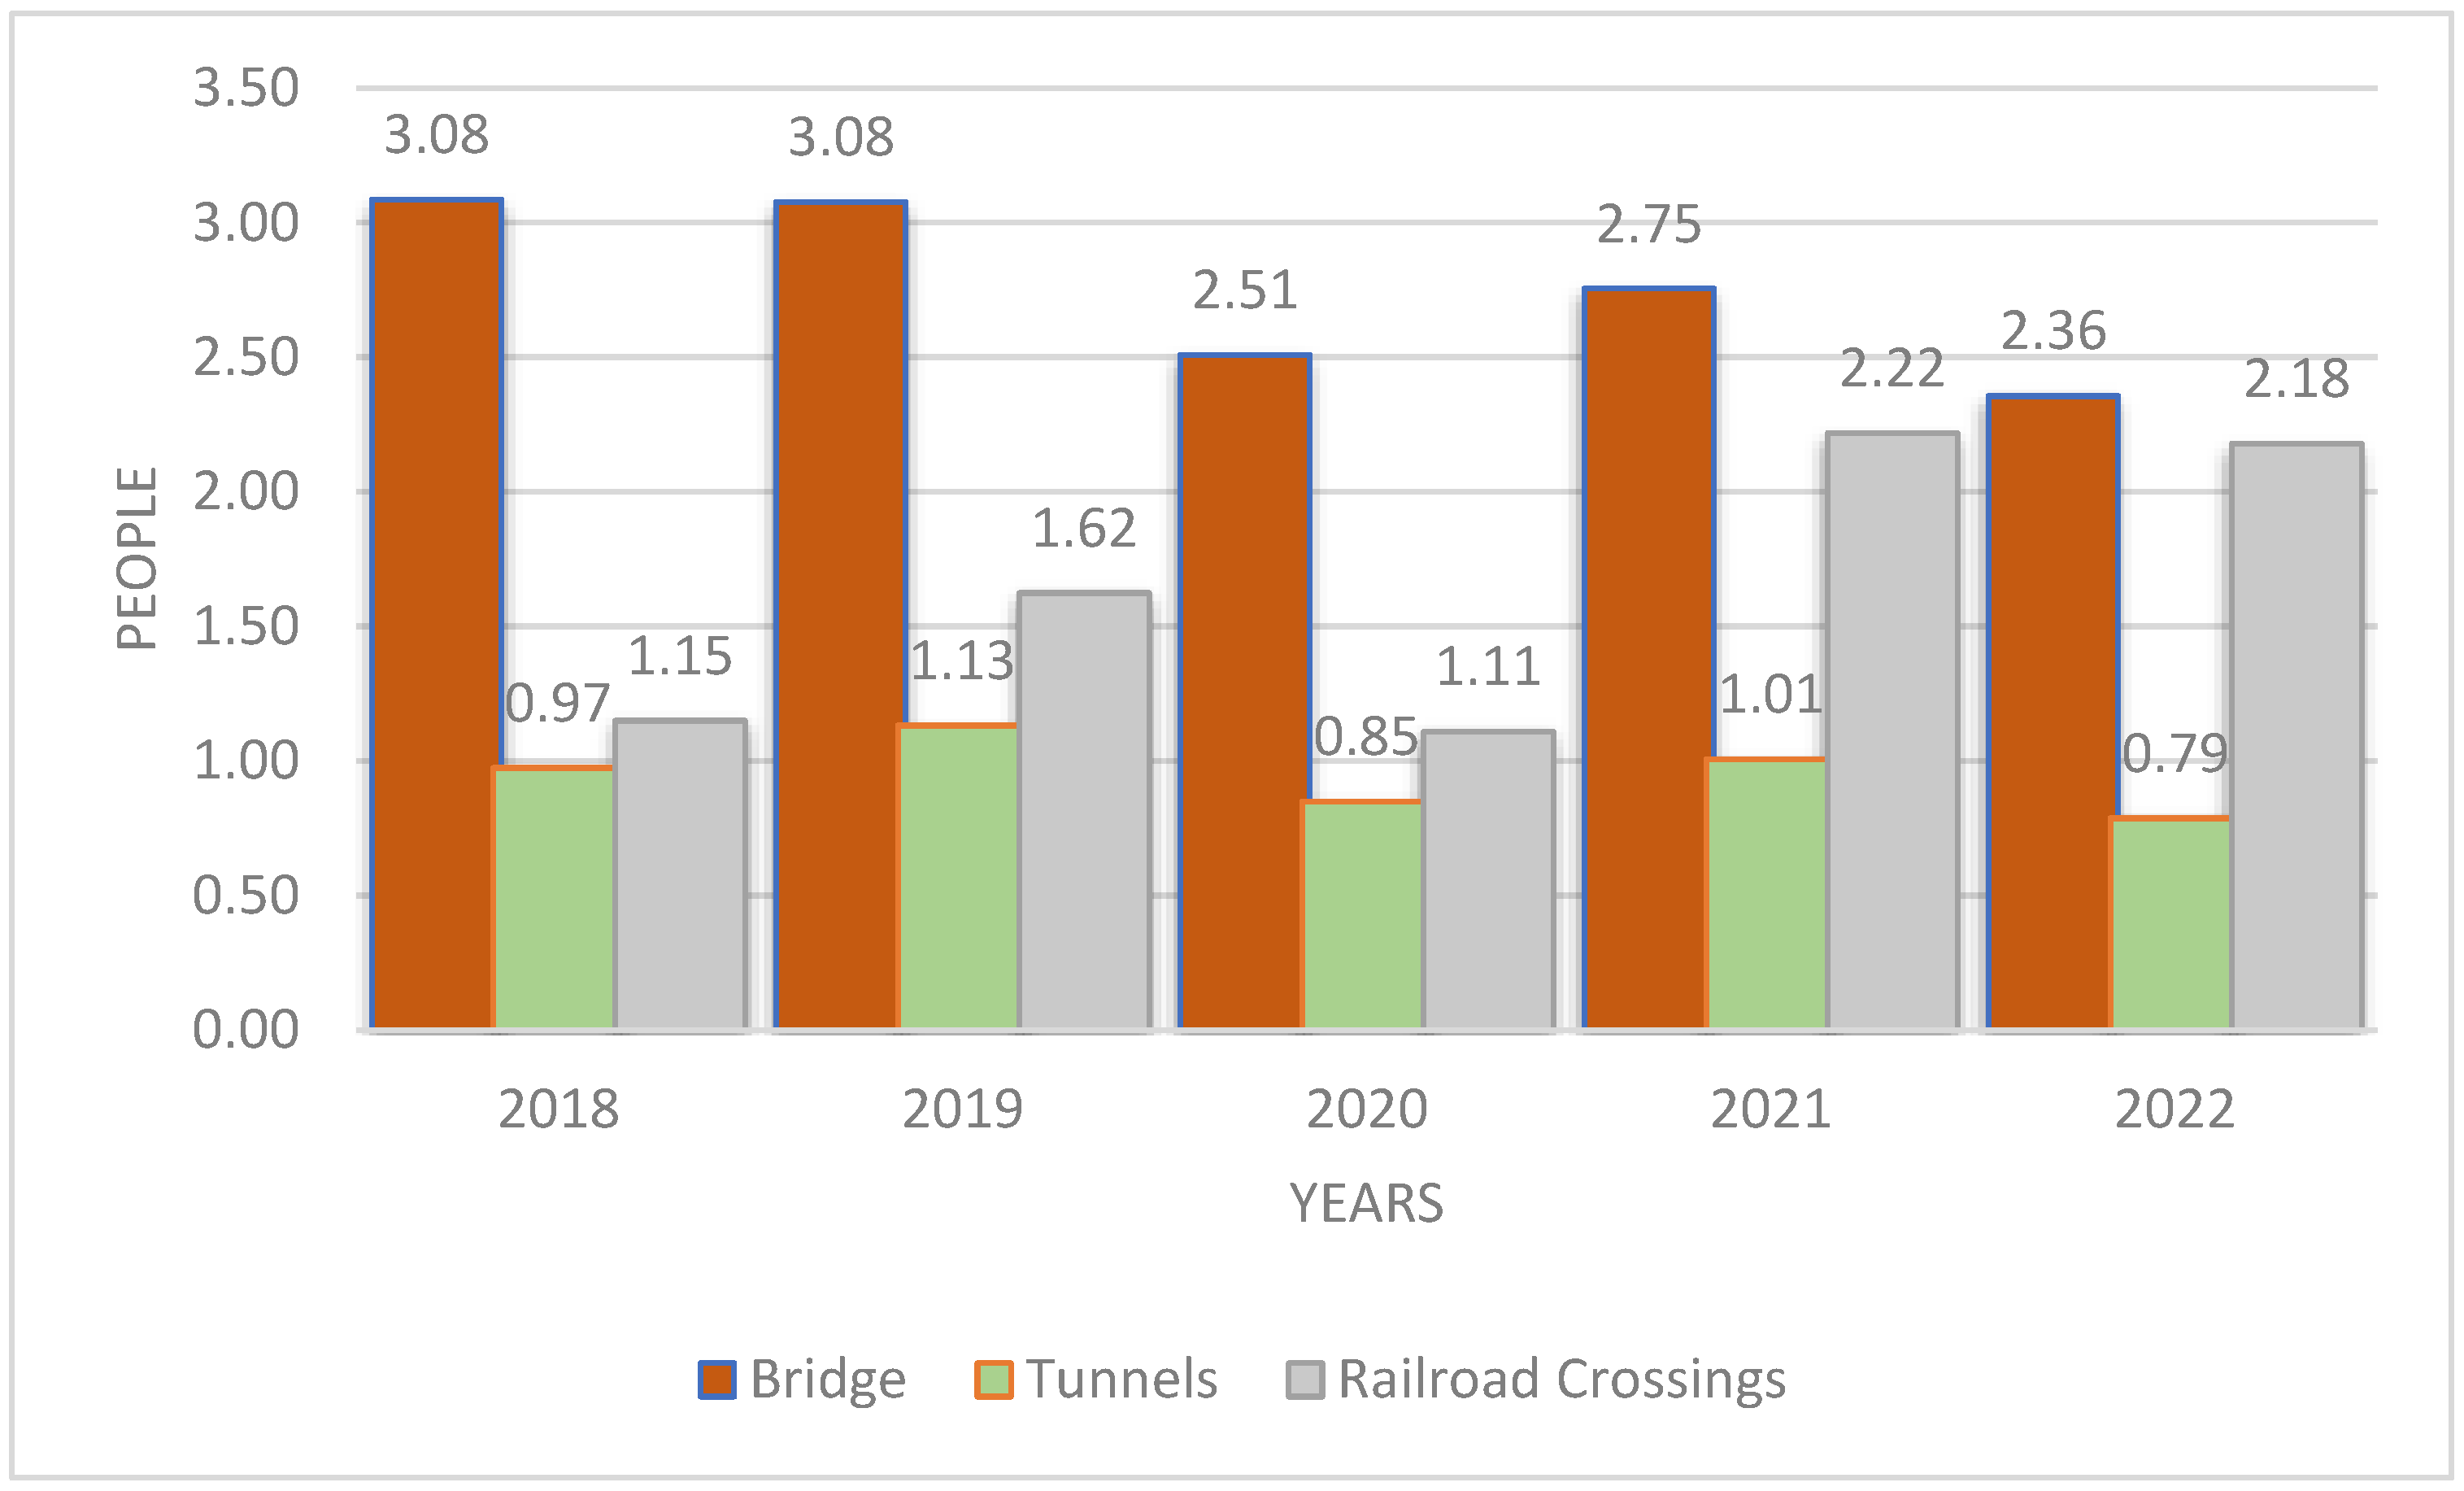
So far, analyses of the absolute number of road crashes at characteristic infrastructural locations have been shown. To more precisely compare the data on the number of road crashes, the indicator of the number of road crashes per kilometer will be used. The total length of bridges, the total length of tunnels, and the total length of railroad crossings will be considered for the aforementioned analysis. There are no accurate data on the total length of work zones in Serbia, nor on the exact number of work zones on the road (due to inconsistencies in the databases). Attempts to obtain this information through a survey of experts were unsuccessful due to the large dispersion in responses regarding the estimation of the number of road work zones, as well as the estimation of the average length of the road work zone. For the above reasons, the data on the number of road crashes per kilometer will not be analyzed in this part.
Figure 5 illustrates the total number of road crashes per kilometer at characteristic infrastructural locations from 2018 to 2022. It can be concluded that the highest number of road crashes per kilometer occurs on bridges, followed by railroad crossings, and the lowest occurs in tunnels. A similar pattern is observed in the number of fatalities per kilometer, the number of injuries per kilometer, and the number of road crashes with material damage per kilometer for the period from 2018 to 2022. Table 1 shows the above data.
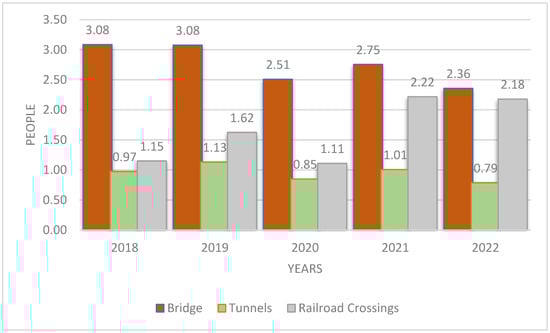
Figure 5.
Total number of road crashes per kilometer at characteristic transportation infrastructures from 2018 to 2022.

Table 1.
Road crashes per kilometer at characteristic infrastructural locations from 2018 to 2022.
To facilitate the comparison of road crash rates per kilometer between characteristic infrastructure locations and the rest of the road network, Table 2 is provided. This comparison reveals that, for all types of crashes, there is a higher frequency of crashes per kilometer at these characteristic infrastructure locations compared to the rest of the road network. This finding underscores the critical need for targeted safety interventions at these specific locations to address and mitigate the elevated risk.
Table 2.
Road crashes per kilometer on road networks of national roads from 2018 to 2022.
3.2. Expert Assessments
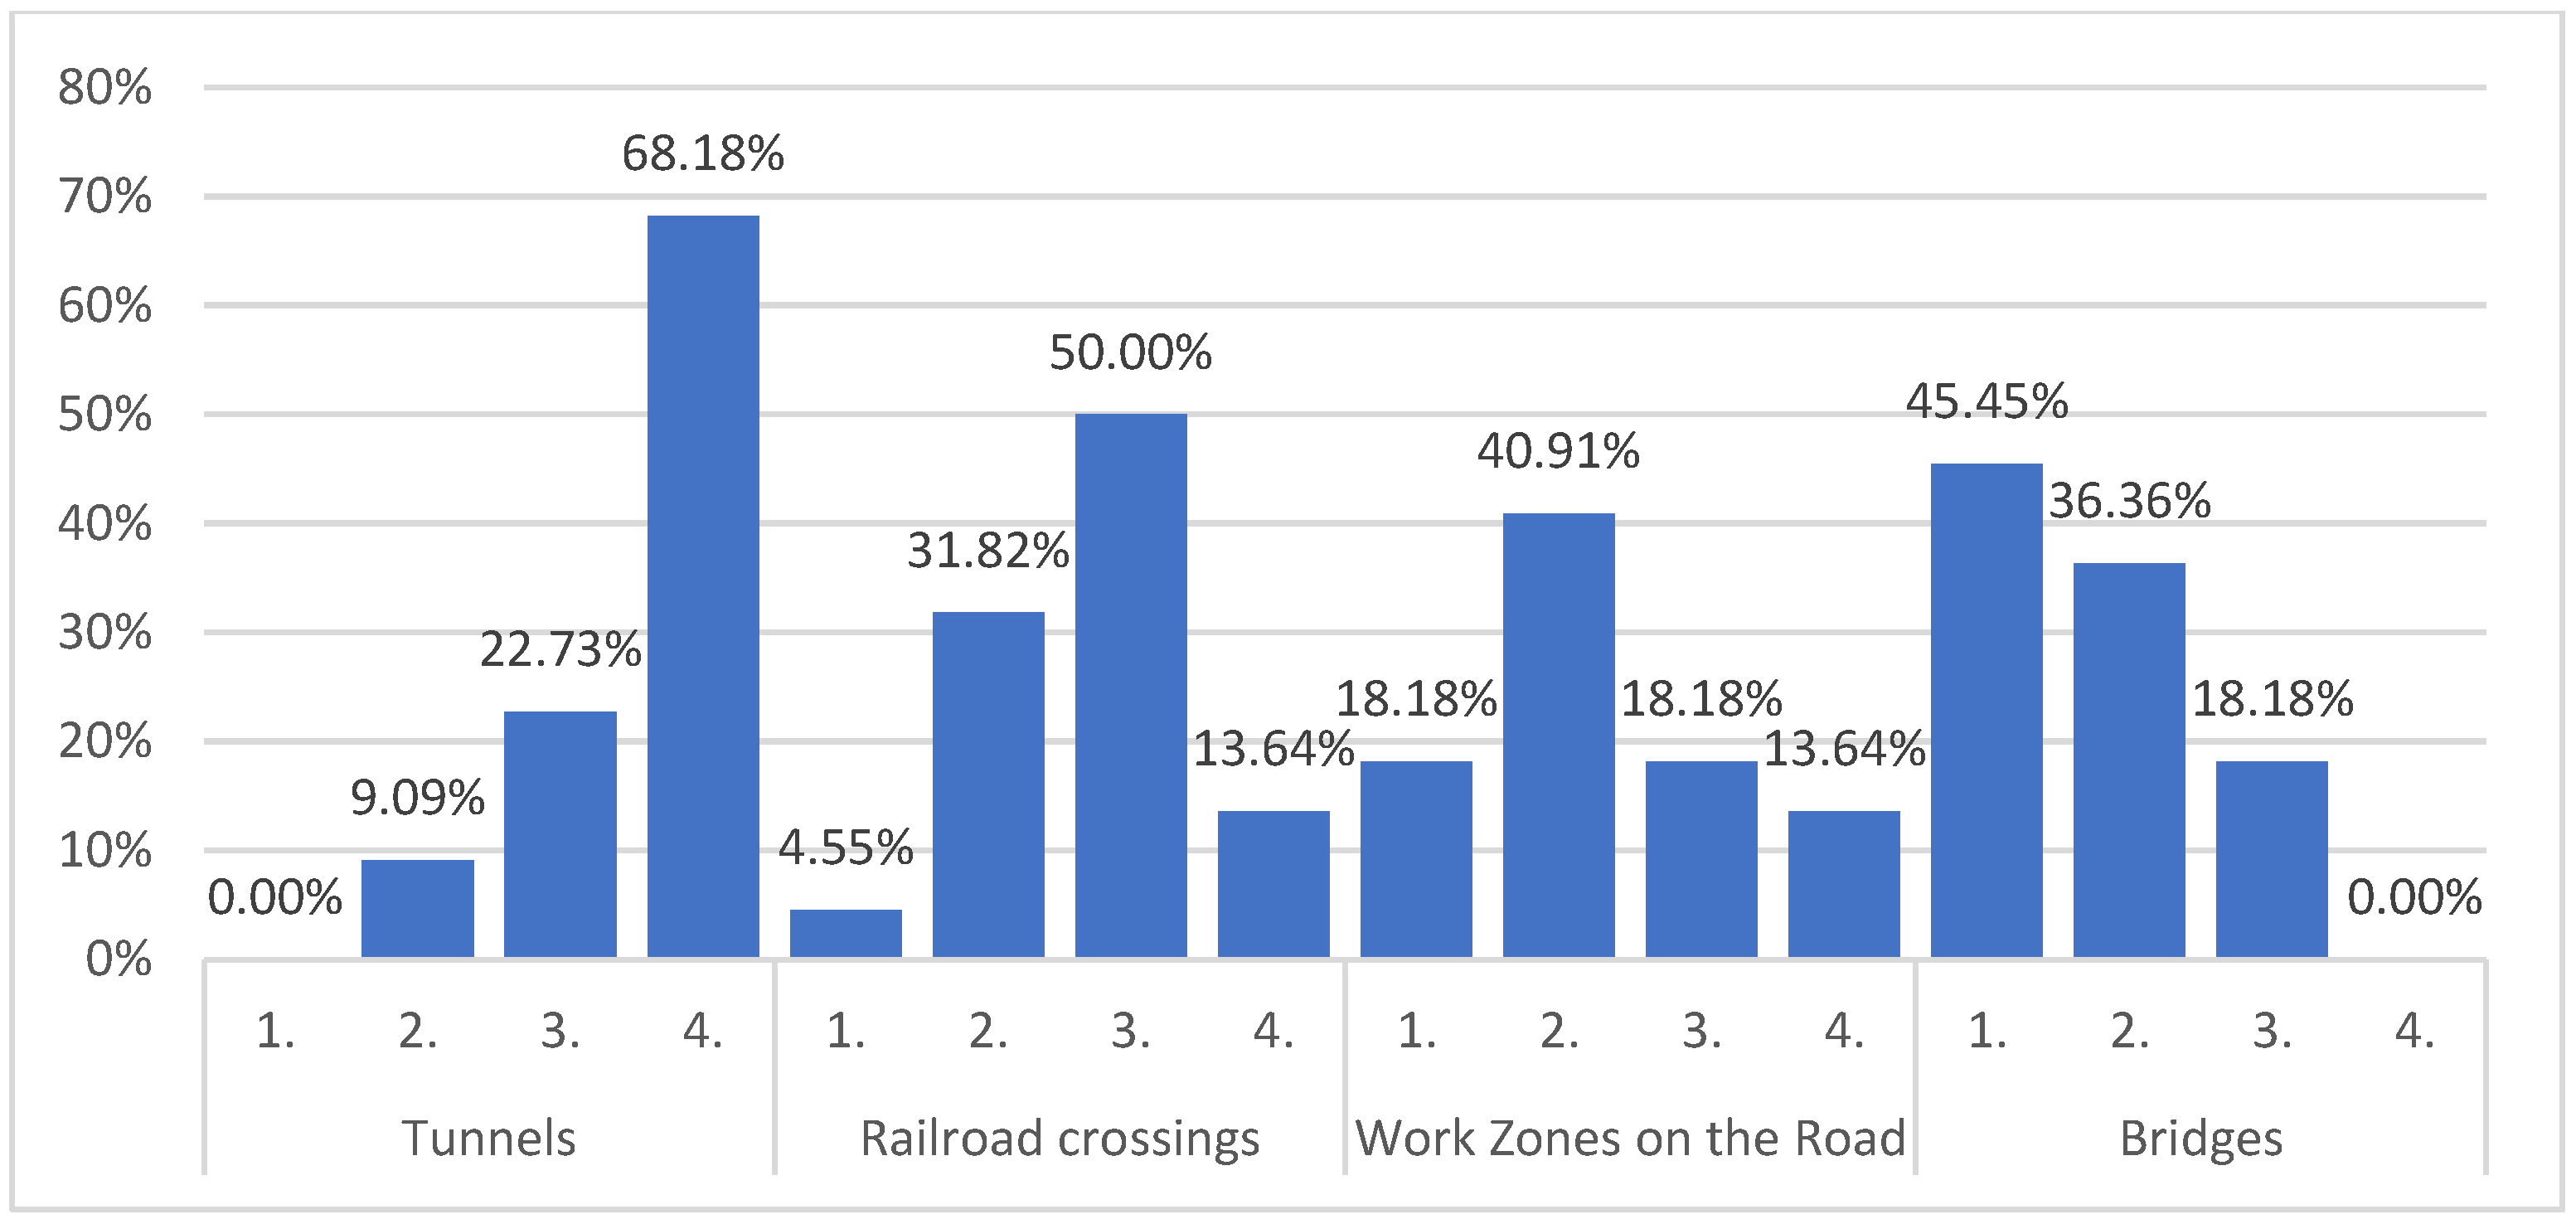
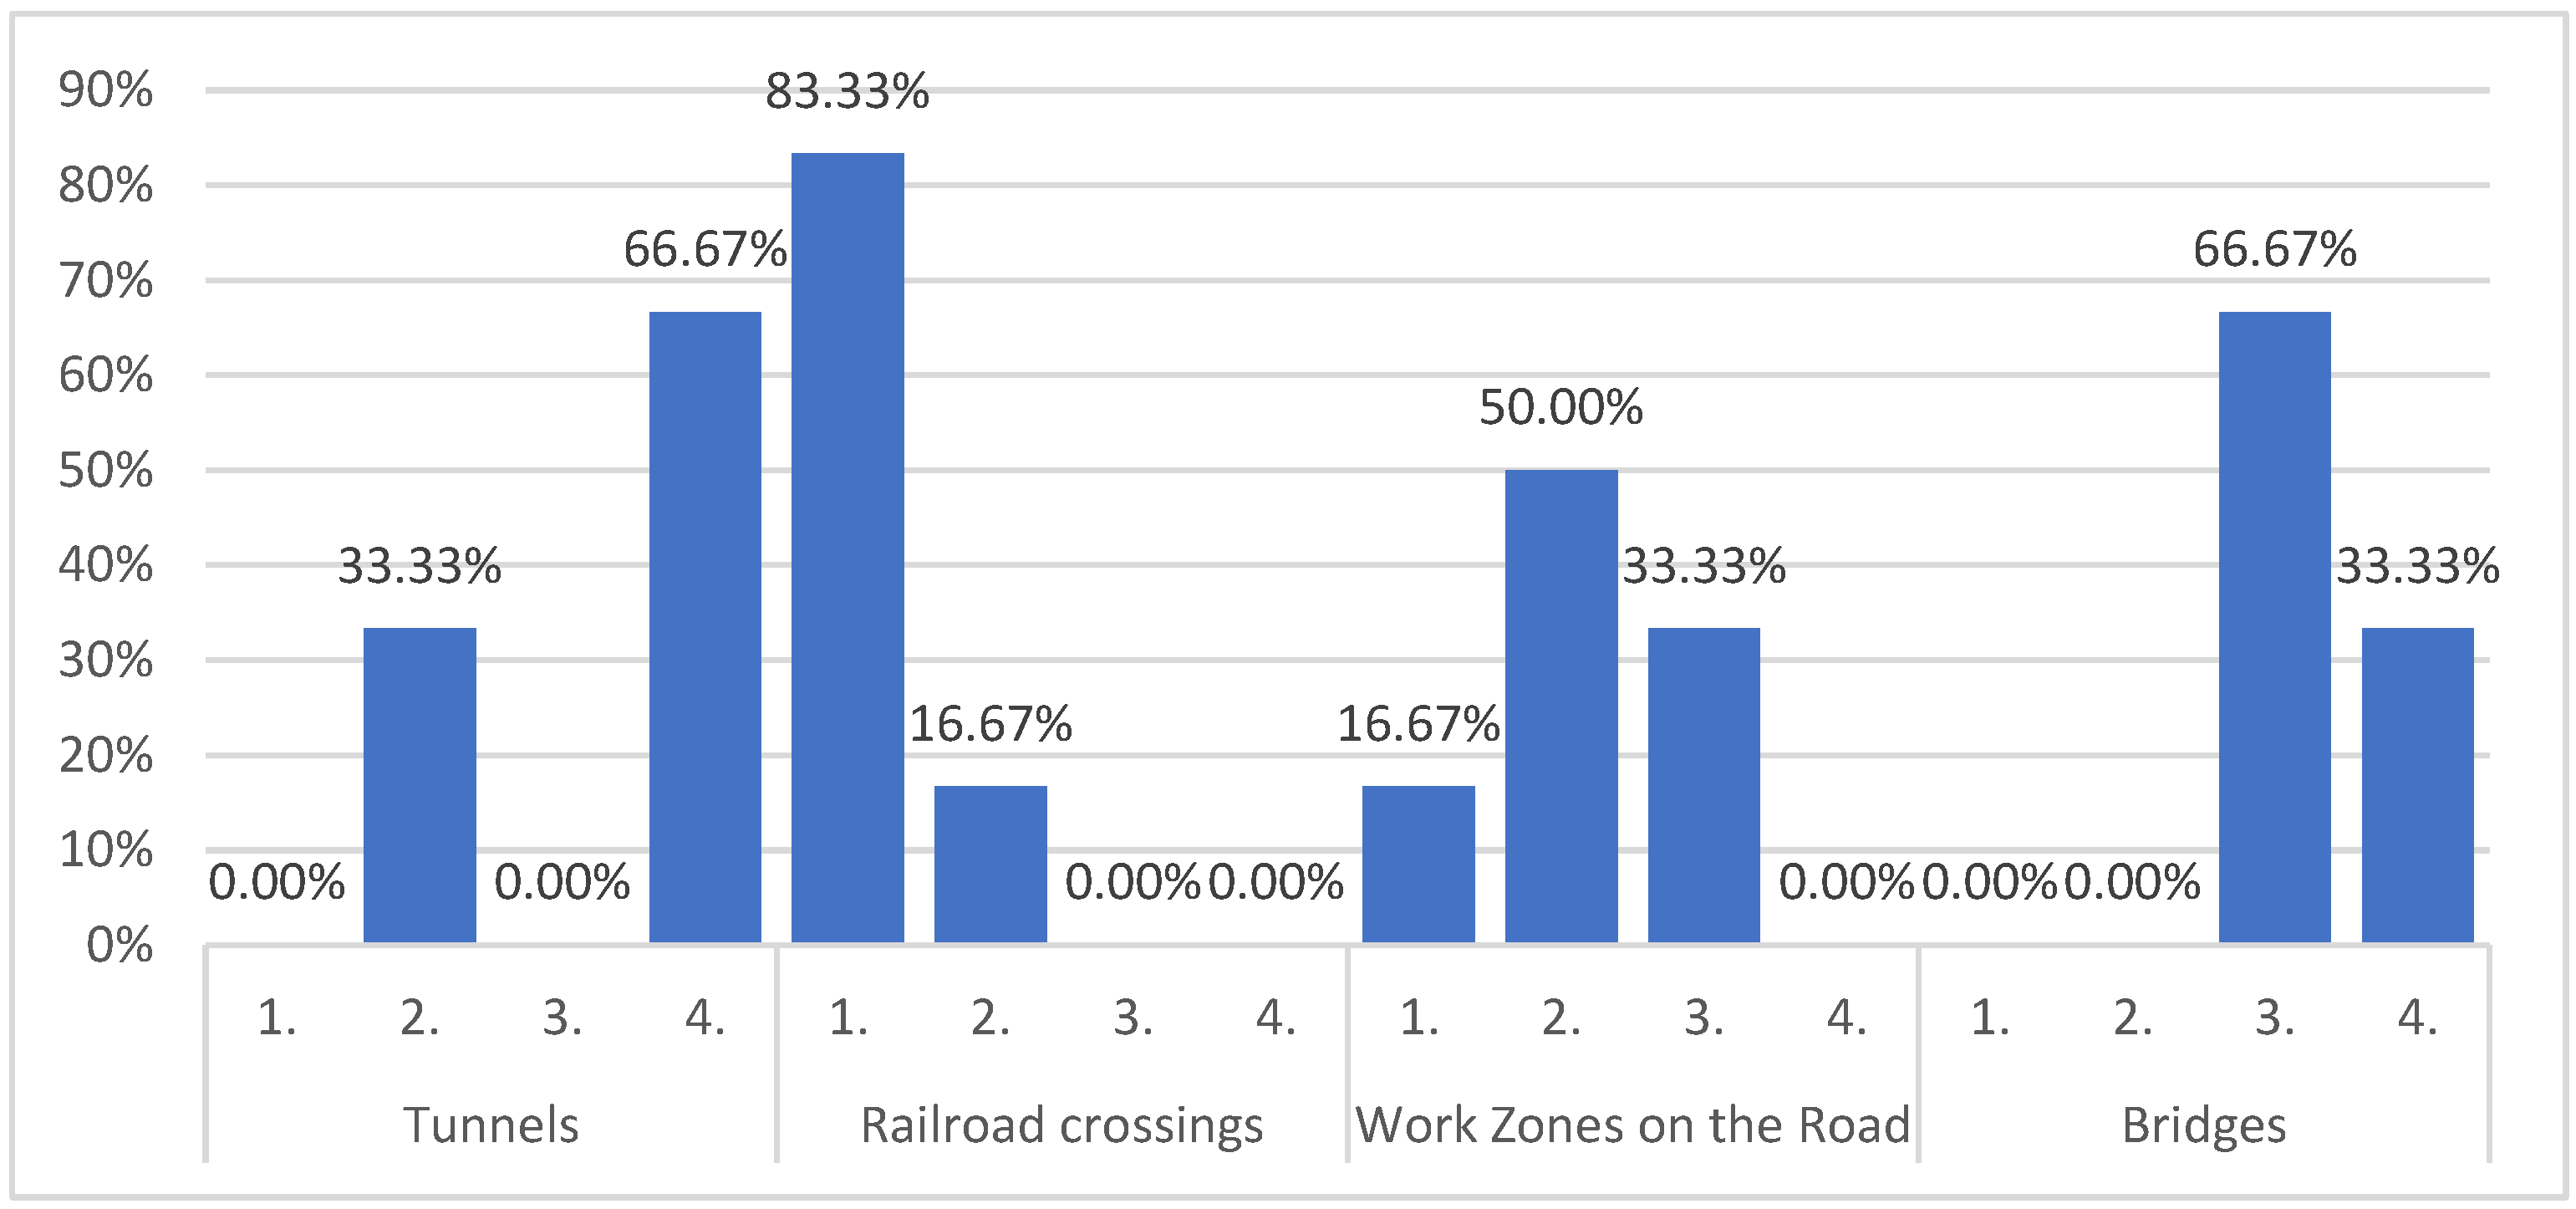
The results of the expert assessment show that tunnels are the safest (68.18% of experts consider them the safest), followed by railroad crossings, according to half of the experts, while 13.64% of experts consider railroad crossings the safest. On the other hand, 45.45% of experts consider bridges the most unsafe, while 36.36% believe bridges to be the second least safe. Road work zones are considered the most unsafe by 18.18% of experts, while 40.91% of respondents consider road work zones to be the second safest characteristic infrastructural locations in Serbia. When ranking the characteristic infrastructural locations according to the assessments of selected experts, it can be concluded that bridges are the least safe, followed by road work zones, then railroad crossings, while tunnels are the safest. These results are consistent with objective indicators of real data for the previous period. This result is likely a consequence of experts’ familiarity with the state of road safety in Serbia (Figure 6).

Figure 6.
Experts’ assessment of characteristic infrastructural locations.
3.3. Artificial Intelligence
The following section shows the results of how different software ranked the characteristic infrastructural locations and briefly explains the above-mentioned decision.
- -
- Chat GPT
- Railroad crossings: Railroad crossings are particularly dangerous if drivers do not obey warning signs or pay enough attention. Crashes at these locations can be fatal.
- Tunnels: Tunnels pose a challenge due to changes in lighting and possible reduced visibility. Crashes in tunnels can be severe, especially if drivers do not adjust their speed or lose focus.
- Road work zones: Road work zones on the road are often places where crashes occur due to changes in driving conditions and the presence of workers. These zones require extra attention and caution from the driver.
- Bridges: Although bridges are often the site of crashes, I still rank them as the safest of the locations.
- -
- Chat AI
- Railroad crossings: These locations have a higher risk due to the potential for collisions between vehicles and trains, which can lead to severe consequences.
- Road work zones: These areas often have reduced speed limits, lane changes, and construction equipment, making them more prone to crashes.
- Bridges: Bridges can be risky due to limited visibility, narrow lanes, and the potential for ice and snow accumulation, which can affect vehicle control and increase the likelihood of crashes.
- Tunnels: Tunnels can be safer than the other options if well-lit, ventilated, and maintained, but they can also present challenges due to limited visibility, echo effects, and the potential for crashes to be more severe due to confined spaces.
- -
- Chat Gate AI
- Railroad crossings: Often pose significant risks due to the intersection of road and rail.
- Tunnels: Limited visibility and potential for crashes make tunnels relatively risky.
- Road work zones: Changing road conditions and the presence of workers can lead to safety hazards.
- Bridges: While bridges can have their own safety concerns, they are usually more straightforward compared to the other locations listed.
- -
- Gemini
- Railroad crossings: The greatest risk is represented by railroad crossings due to the possibility of collisions with trains. These crossings often have limited visibility and require drivers to come to a complete stop and take extra care.
- Road work zones: These zones are at increased risk due to lane changes, uneven surfaces, merging traffic, and slower speeds. There is also the presence of workers and construction equipment.
- Bridges: Bridges are typically safe as they separate traffic levels. However, factors like high winds, narrow lanes, or congested traffic can increase the risk.
- Tunnels: Generally, tunnels have the safest record. They eliminate interactions with oncoming traffic, pedestrians, and other distractions. They also often have controlled environments with lighting and ventilation.
- -
- Copilot Microsoft
- Railroad crossings: Railroad crossings are the least safe because of the inherent risk of collisions between trains and road vehicles. Trains cannot stop quickly, and collisions can be severe.
- Road work zones: Road work zones pose risks due to ongoing construction activities.
- Bridges: Bridges are generally safe for road users. However, safety depends on factors such as bridge design, maintenance, and adherence to traffic rules.
- Tunnels: Tunnels can be safe if well-designed and maintained.
- -
- DeepAI
- Road work zones: These zones often have reduced speed limits, lane closures, and unpredictable traffic patterns, making them the least safe.
- Railroad crossings: They require drivers to stop and look for approaching trains, which can be difficult if visibility is poor or the train is far away. The risk of crashes with trains is significant.
- Bridges: Bridges may have reduced visibility due to their structure and limited sightlines, especially in poor weather conditions.
- Tunnels: Tunnels generally have better visibility and are well ventilated but can be dangerous due to limited escape routes in the event of a crash or emergency.
Table 3 shows an overview of AI tools and a ranking of characteristic infrastructural locations according to road safety.
Table 3.
An overview of AI tools and the ranking of characteristic infrastructural locations according to road safety.
Figure 7 shows the order of characteristic infrastructural locations according to AI ratings. It can be concluded that the most unsafe infrastructural locations, according to AI, are railroad crossings, followed by road work zones. The safest infrastructure locations, according to the AI ranking, are bridges, followed by tunnels.

Figure 7.
Order of characteristic infrastructural locations according to AI rating.
3.4. Data–Expert Assessments–AI
By analyzing data on road crashes in the territory of the Republic of Serbia, for selected characteristic infrastructural locations, it can be concluded that bridges are the most unsafe, then road work zones, then railroad crossings, while tunnels are the safest. The same order is observed when analyzing the results of expert opinions. This result is likely a consequence of experts’ familiarity with the real state of road safety in Serbia. On the other hand, when analyzing data obtained from six selected AI tools, the most unsafe characteristic infrastructural locations are railroad crossings, followed by road work zones. The safest characteristic infrastructural locations, according to AI ranking, are bridges, followed by tunnels. The ranking results of selected characteristic infrastructural locations are shown in Table 4.
Table 4.
Overview of the ranking of characteristic infrastructural locations according to road safety data–expert assessments–AI.
4. Conclusions
Based on a comprehensive analysis conducted on road crashes from 2018 to 2020 at characteristic infrastructural locations, including bridges, tunnels, railroad crossings, and road work zones, several significant insights have emerged.
First, as far as bridges are concerned, the data illustrate a smaller trend of a decrease in the number of road crashes in the mentioned years. Statistical tests show that there are no statistically significant variations between years both for the total number of road crashes and fatalities. In contrast, with tunnels, while a slight decrease in road crashes was observed in 2020, there were no statistically significant variations between years for the total number of road crashes and fatalities. Over the years, an increase in both the total number of road crashes and fatalities has been recorded at railroad crossings, with no statistically significant differences between years. Similarly, in road work zones, a slight decrease in the total number of road crashes was recorded in 2020, without significant differences between years.
Comparatively, when analyzing the total number of road crashes for characteristic infrastructural locations, bridges are the most represented, then road work zones, railroad crossings, and tunnels, and statistical tests confirm the differences between these places. Furthermore, predictive models for each infrastructure type shed light on future trends. A significant reduction in crashes was predicted for bridges, while tunnels revealed a complex relationship with road crashes that shows a tendency to irregularly decrease over time. Railroad crossings showed an exponential increase in crashes, while road work zones depicted a quadratic relationship between crashes and years.
Although an in-depth analysis of each characteristic transportation infrastructure is necessary, the practical implementation of the obtained results can include a series of measures aimed at improving road safety. This would involve organizing educational campaigns for drivers, focusing on safe behavior in tunnels, bridges, railroad crossings, and road work zones, which could contribute to reducing the number of road crashes. Additionally, regular maintenance of infrastructure, including bridges, tunnels, and railroad crossings, is essential for reducing potential risks and improving road safety. Furthermore, the incorporation of new technologies for marking road work zones is necessary. These practical measures can provide a basis for the development of effective prevention and risk management strategies in traffic, considering the specifics of each infrastructure location and traffic flow dynamics. By integrating these diverse sources of information, the study aims to highlight and address safety concerns at bridges, tunnels, railroad crossings, and road work zones. One of the goals is to enhance awareness of the critical need for targeted safety improvements at these high-risk locations, ultimately contributing to more effective road safety strategies and interventions.
In addition to the above, several limitations should be acknowledged. First, only available data on road crashes on characteristic infrastructure locations were analyzed. Data on average annual daily traffic for the largest number of sections were not available for inclusion in the comprehensive analysis. Furthermore, the time scope of the study is limited to the years 2018 to 2022 (data on road crashes for 2023 are not officially available for the Republic of Serbia), potentially limiting the ability to capture long-term trends or cyclical patterns in crash rates. Additionally, the geographical focus on Serbia may restrict the generalizability of the findings to other regions with different infrastructure and socio-economic contexts. Furthermore, while the analysis emphasizes the role of infrastructure characteristics, it overlooks other significant factors such as weather conditions, driver behavior, and road maintenance practices, which could also influence crash rates. Finally, the predictive models developed in the study are based on certain assumptions, which may not fully capture the complexity of real-world scenarios.
Future research directions in the field of road safety could explore several ways to further advance our understanding and improve safety measures. Firstly, there is a need for longitudinal studies that extend beyond the timeframe of this analysis to track trends and patterns in road crashes over a more extended period comprehensively. In addition, comparative studies across regions and countries could provide valuable insight into the impact of different infrastructural, regulatory, and socio-economic factors on road safety outcomes. Furthermore, integrating advanced data analytics techniques, such as machine learning and spatial analysis, could enable a more nuanced analysis of the complex interactions between the various factors that contribute to falls, enabling the development of more accurate predictive models and targeted intervention strategies. Moreover, interdisciplinary approaches that incorporate insights from fields such as psychology, human factors, and urban planning could offer a more holistic understanding of the root causes of road crashes and inform the design of comprehensive, multifaceted interventions aimed at reducing crash rates and promoting safer transportation systems. Finally, research that focuses on evaluating the effectiveness of existing safety interventions and developing innovative technologies, such as intelligent transportation systems and vehicle automation, promises to further advance road safety efforts and ultimately save lives on the roads.
The expert assessment indicates that tunnels are perceived as the safest by a significant majority of experts, followed closely by railroad crossings, while bridges are considered the least safe. These findings align with empirical data from previous periods, suggesting a strong correlation between experts’ assessments and real-world road safety indicators. However, AI rankings prioritize bridges as the safest infrastructure locations, in contrast to expert opinion and data analysis.
Future directions of research must be focused on several fields. Firstly, there is a need for longitudinal studies that extend beyond the timeframe of this analysis to track trends and patterns in road crashes over a more extended period comprehensively. In addition, comparative studies in different regions and countries could provide valuable insight into the impact of different infrastructural, regulatory, and socio-economic factors on crash outcomes. Moreover, interdisciplinary approaches that incorporate insights from fields such as psychology, logistics, human factors, and urban planning could offer a more holistic understanding of the underlying causes of road crashes and inform the design of comprehensive, multi-faceted interventions aimed at reducing crash rates and promoting safer transport systems [40,41,42,43,44]. Finally, research focusing on the evaluation of the effectiveness of existing safety interventions and the development of innovative technologies, such as intelligent transportation systems and vehicle automation, holds promise for further advancing road safety efforts and ultimately saving lives on the roads.
Author Contributions
Conceptualization, T.I., M.V. and A.T.; methodology, A.T. and A.S.; software, A.T.; validation, T.I., A.T. and A.S.; formal analysis, T.I.; investigation, A.T.; resources, T.I.; data curation, A.T.; writing—original draft preparation, T.I. and A.T.; writing—review and editing, S.Č.; visualization, S.Č.; supervision, S.Č.; project administration, S.Č. and A.T.; funding acquisition, A.T. All authors have read and agreed to the published version of the manuscript.
Funding
This research received no external funding.
Institutional Review Board Statement
All subjects gave their informed consent for inclusion before they participated in the study. The study was conducted in accordance with the Declaration of Helsinki, and the protocol was approved by the Ethics Committee of Academy of Professional Studies Sumadija, 632/2024-02.
Data Availability Statement
The original contributions presented in the study are included in the article, further inquiries can be directed to the corresponding author.
Conflicts of Interest
The authors declare no conflicts of interest.
References
- Mohamed, J.; Mohamed, A.I.; Ali, D.A.; Gebremariam, T.T. Prevalence and factors associated with ever had road crashes among drivers in Hargeisa city, Somaliland, 2022. Heliyon 2023, 9, e18631. [Google Scholar] [CrossRef]
- Pešić, D.; Pešić, D.; Trifunović, A.; Čičević, S. What affects the perception of a drunk driving campaign? Transp. Res. Rec. 2023, 2677, 196–210. [Google Scholar] [CrossRef]
- Glavić, D. The impact of highway construction on the volume and distribution of traffic flows: Case study for highway A2 in Serbia. J. Road Traffic Eng. 2023, 69, 11–17. [Google Scholar] [CrossRef]
- Ivanović, V.; Lindov, O.; Radović, M. Testing and analysis of the elements of the high-risk road section concerning the quality of the pavement curtain and its impact on the value of the adhesion coefficient. J. Road Traffic Eng. 2024, 70, 23–30. [Google Scholar] [CrossRef]
- Çeven, S.; Albayrak, A. Traffic accident severity prediction with ensemble learning methods. Comput. Electr. Eng. 2024, 114, 109101. [Google Scholar] [CrossRef]
- Cui, P.; Yang, X.; Abdel-Aty, M.; Zhang, J.; Yan, X. Advancing urban traffic accident forecasting through sparse spatio-temporal dynamic learning. Accid. Anal. Prev. 2024, 200, 107564. [Google Scholar] [CrossRef] [PubMed]
- Kodepogu, K.; Manjeti, V.B.; Siriki, A.B. Machine Learning for Road Accident Severity Prediction. Mechatron. Intell. Transp. Syst. 2023, 2, 211–226. [Google Scholar] [CrossRef]
- Pantelić, O.; Pešić, D.; Vujanić, M.; Švab, K.; Trifunović, A. Application of the AHP Method for Comparative Analysis of Software Systems in Traffic from the Aspect of Road Safety. Promet-TrafficTransp. 2023, 35, 525–539. [Google Scholar] [CrossRef]
- Vasavi, S.; Sravanthi, G.L.; Ram, B.S.; Gokhale, A.A. Predictive analytics of bridge safety for intelligent transportation system using ensemble model. Mater. Today Proc. 2021, 45, 5608–5616. [Google Scholar] [CrossRef]
- Zhang, J.; Zhu, C.; Ma, C. Driving safety analysis of wind–vehicle–bridge system considering aerodynamic interference. J. Wind Eng. Ind. Aerodyn. 2024, 245, 105649. [Google Scholar] [CrossRef]
- Lu, P.; Pei, S.; Tolliver, D. Regression model evaluation for highway bridge component deterioration using national bridge inventory data. J. Transp. Res. Forum 2016, 55, 5–16. [Google Scholar] [CrossRef]
- Neves, A.C.; González, I.; Leander, J.; Karoumi, R. A new approach to damage detection in bridges using machine learning. In Experimental Vibration Analysis for Civil Structures: Testing, Sensing, Monitoring, and Control; Springer: Berlin/Heidelberg, Germany, 2018; Volume 7, pp. 73–84. [Google Scholar] [CrossRef]
- Zhao, X.; Yang, H.; Yao, Y.; Qi, H.; Guo, M.; Su, Y. Factors affecting traffic risks on bridge sections of freeways based on partial dependence plots. Phys. A Stat. Mech. Appl. 2022, 598, 127343. [Google Scholar] [CrossRef]
- Yang, L.H.; Wang, Y.M.; Chang, L.L.; Fu, Y.G. A disjunctive belief rule-based expert system for bridge risk assessment with dynamic parameter optimization model. Comput. Ind. Eng. 2017, 113, 459–474. [Google Scholar] [CrossRef]
- Luo, Q.; Liu, C. Exploration of road closure time characteristics of tunnel road crashes: A case study in Pennsylvania, USA. Tunn. Undergr. Space Technol. 2023, 132, 104894. [Google Scholar] [CrossRef]
- Pérez-Sala, L.; Curado, M.; Tortosa, L.; Vicent, J.F. Deep learning model of convolutional neural networks powered by a genetic algorithm for prevention of road crashes severity. Chaos Solitons Fractals 2023, 169, 113245. [Google Scholar] [CrossRef]
- Yang, Y.; Zhang, Y.; Zheng, T.; Tian, Q. Research on traffic accident prediction of expressway tunnel based on B-NB model. Traffic Inj. Prev. 2024, 25, 527–536. [Google Scholar] [CrossRef]
- Ahmed, J.; Robinson, A.; Miller, E.E. Effectiveness of signs for pedestrian-railroad crossings: Colors, shapes, and messaging strategies. J. Saf. Res. 2024, 89, 141–151. [Google Scholar] [CrossRef]
- Benekohal, R.F.; Mathew, J. Railroad Safety: Grade Crossings and Trespassing. In International Encyclopedia of Transportation; Elsevier: Amsterdam, The Netherlands, 2021; Volume 1–7, pp. 466–476. [Google Scholar] [CrossRef]
- Guo, F.; Wang, Y.; Qian, Y. Computer vision-based approach for smart traffic condition assessment at the railroad grade crossing. Adv. Eng. Inform. 2022, 51, 101456. [Google Scholar] [CrossRef]
- Mathew, J.; Benekohal, R.F. Highway-rail grade crossings accident prediction using Zero Inflated Negative Binomial and Empirical Bayes method. J. Saf. Res. 2021, 79, 211–236. [Google Scholar] [CrossRef]
- NSC Injury Facts. Available online: https://injuryfacts.nsc.org/motor-vehicle/motor-vehicle-safety-issues/work-zones/ (accessed on 16 April 2024).
- Work Zone Barriers. Available online: https://www.workzonebarriers.com/work-zone-crash-facts.html (accessed on 16 April 2024).
- Vivas Pacheco, H.; Rodríguez-Mariaca, D.; Jaramillo, C.; Fandiño-Losada, A.; Gutiérrez-Martínez, M.I. Traffic fatalities and urban infrastructure: A spatial variability study using geographically weighted Poisson regression applied in Cali (Colombia). Safety 2023, 9, 34. [Google Scholar] [CrossRef]
- Karamanlis, I.; Kokkalis, A.; Profillidis, V.; Botzoris, G.; Kiourt, C.; Sevetlidis, V.; Pavlidis, G. Deep Learning-Based Black Spot Identification on Greek Road Networks. Data 2023, 8, 110. [Google Scholar] [CrossRef]
- Mendes OB, B.; Larocca AP, C.; Rodrigues Silva, K.; Pirdavani, A. Assessing the Performance of Highway Safety Manual (HSM) Predictive Models for Brazilian Multilane Highways. Sustainability 2023, 15, 10474. [Google Scholar] [CrossRef]
- Le, K.G.; Tran, Q.H.; Do, V.M. Urban Traffic Accident Features Investigation to Improve Urban Transportation Infrastructure Sustainability by Integrating GIS and Data Mining Techniques. Sustainability 2023, 16, 107. [Google Scholar] [CrossRef]
- Chen, J.; Xiong, P.; Li, K.; Yang, S. Optimization Study of Fire Prevention Structure of Electric Vehicle Based on Bottom Crash Protection. Fire 2024, 7, 209. [Google Scholar] [CrossRef]
- Amin, M.; Ullah, K.; Asif, M.; Shah, H.; Mehmood, A.; Khan, M.A. Real-world driver stress recognition and diagnosis based on multimodal deep learning and fuzzy EDAS approaches. Diagnostics 2023, 13, 1897. [Google Scholar] [CrossRef]
- Kovacevic, J.; Fotez, I.; Miskulin, I.; Lesic, D.; Miskulin, M.; Berlancic, T.; Vukoja, I.; Candrlic, S.; Palenkic, H.; Candrlic, M. Different patterns of mental health outcomes among road traffic crash survivors: A prospective cohort study. Int. J. Environ. Res. Public Health 2021, 18, 1564. [Google Scholar] [CrossRef]
- Bridgelall, R. Driving standardization in infrastructure monitoring: A role for connected vehicles. Vehicles 2023, 5, 1878–1891. [Google Scholar] [CrossRef]
- Niu, C.; Song, Y.; Zhao, X. SE-Lightweight YOLO: Higher Accuracy in YOLO Detection for Vehicle Inspection. Appl. Sci. 2023, 13, 13052. [Google Scholar] [CrossRef]
- Road Safety Agency. Available online: https://www.abs.gov.rs/rsc (accessed on 16 April 2024).
- Alfredo, R.; Echeverria, V.; Jin, Y.; Yan, L.; Swiecki, Z.; Gašević, D.; Martinez-Maldonado, R. Human-Centered Learning Analytics and AI in Education: A Systematic Literature Review. Comput. Educ. Artif. Intell. 2024, 6, 100215. [Google Scholar] [CrossRef]
- Ifelebuegu, A.O.; Kulume, P.; Cherukut, P. Chatbots and AI in Education (AIEd) tools: The good, the bad, and the ugly. J. Appl. Learn. Teach. 2023, 6, 332–345. [Google Scholar] [CrossRef]
- Public Enterprise—Roads of Serbia. Available online: https://www.putevi-srbije.rs/index.php/en/about-us (accessed on 16 April 2024).
- Road Safety Agency. Available online: https://www.abs.gov.rs/en/statistika/baza_podataka (accessed on 16 April 2024).
- Obradovic, M.; Jevremović, S.; Trpković, A.; Milosavljević, M. Traffic-spatial analysis of road-rail crossings on state roads in the Republic of Serbia. J. Road Traffic Eng. 2020, 66, 35–40. [Google Scholar] [CrossRef]
- Wu, C.; Kao, S.C.; Chang, C.C. A knowledge elicitation approach to road crashes analysis in open data: Comparing periods before and after the COVID-19 outbreak. Heliyon 2022, 8, e10302. [Google Scholar] [CrossRef]
- Krstić, M.; Tadić, S.; Brnjac, N. Strategic Application of Industry 4.0 Technologies in Enhancing Intermodal Transport Terminal Efficiency. J. Organ. Technol. Entrep. 2023, 1, 98–109. [Google Scholar] [CrossRef]
- Krstić, M.; Tadić, S.; Jolović, M. Evaluation of Transshipment Technologies in Intermodal Terminals: A Hybrid FSWARA-ADAM Approach. J. Organ. Technol. Entrep. 2024, 2, 27–38. [Google Scholar] [CrossRef]
- Pajić, V.; Andrejić, M.; Chatterjee, P. Enhancing Cold Chain Logistics: A Framework for Advanced Temperature Monitoring in Transportation and Storage. Mechatron. Intell. Transp. Syst. 2024, 3, 16–30. [Google Scholar] [CrossRef]
- Trifunović, A.; Senić, A.; Čičević, S.; Ivanišević, T.; Vukšić, V.; Simović, S. Evaluating the Road Environment Through the Lens of Professional Drivers: A Road Safety Perspective. Mechatron. Intell. Transp. Syst. 2024, 3, 31–38. [Google Scholar] [CrossRef]
- Ivanišević, T.; Ivković, I.; Čičevic, S.; Trifunović, A.; Pešić, D.; Vukšić, V.; Simović, S. The impact of daytime running (LED) lights on motorcycles speed estimation: A driving simulator study. Transp. Res. Part F Traffic Psychol. Behav 2022, 90, 47–57. [Google Scholar] [CrossRef]
Disclaimer/Publisher’s Note: The statements, opinions and data contained in all publications are solely those of the individual author(s) and contributor(s) and not of MDPI and/or the editor(s). MDPI and/or the editor(s) disclaim responsibility for any injury to people or property resulting from any ideas, methods, instructions or products referred to in the content. |
© 2024 by the authors. Licensee MDPI, Basel, Switzerland. This article is an open access article distributed under the terms and conditions of the Creative Commons Attribution (CC BY) license (https://creativecommons.org/licenses/by/4.0/).