Article

Structural Performance of Porcelain Insulators in Overhead Railway Power Systems: Experimental Evaluations and Findings

by
Pablo Agüero-Barrantes
1 and
Alexandra Hain
2,*
1
Laboratorio Nacional de Materiales y Modelos Estructurales, Universidad de Costa Rica, San Pedro 11501, Costa Rica
2
Civil and Environmental Engineering Department, University of Connecticut, Storrs, CT 06269, USA
*
Author to whom correspondence should be addressed.
Infrastructures 2024, 9(8), 138; https://doi.org/10.3390/infrastructures9080138
Submission received: 20 June 2024 / Revised: 7 August 2024 / Accepted: 13 August 2024 / Published: 21 August 2024

Abstract

:
This paper addresses the critical knowledge gap in the structural performance of porcelain insulators in overhead railway power systems through experimental evaluations. The focus is on porcelain insulators as part of a contact wire registration assembly (CWRA) in the railway power system. While porcelain insulators are the most widely used high-voltage insulator material, no previous studies have investigated the impact of age on their ultimate load capacity in overhead rail systems. The paper presents the experimental design for tension and a novel 45-degree test setup that replicates field conditions, as well as an overview of the test specimens, which were both new and retired from the field. The results indicate that aging has no impact on the strength of insulators in direct tension tests, but retired insulators in the CWRA show a reduced capacity. Additionally, the location of the drop bracket has a notable influence on the failure mode and stiffness of the assembly. The findings contribute to future improvements in system design and performance. Future research should include material testing, finite element studies, and dynamic testing of the full CWRA setup to further understand insulator performance and support resilient power transmission and distribution systems. Additionally, similar tests should be conducted on polymeric insulators, due to their prevalence.

1. Introduction

Isolators, or insulators, are essential components in rail systems and electrical towers, including those on overhead power lines. They perform two principal functions: electrically isolating live parts from grounded elements and providing mechanical support to accommodate conductor weight. The former prevents electrical leaks, thereby safeguarding the infrastructure; the latter ensures the strength and stability of these systems. The insulators serve as connectors between the energized conductor and supporting structures, effectively managing the electrical isolation between them. Moreover, their weather- and heat-resistant properties contribute to the robustness, longevity, and efficient performances of these systems [1,2]. There are three main classes of dielectric materials that have been used for outdoor high-voltage (HV) insulator construction: glass, porcelain, and polymer [1]. Porcelain and glass have been used since the beginning of telegraphy and electricity transmission. The first high-voltage porcelain (ceramic) insulator was introduced by Fred M. Locke in the early 1890s in Victor, New York [1,3]. Polymer (composite) insulators were introduced in the late 1960s [1,2].
Costea and Baran [4] conducted a comparative analysis of classical insulators (porcelain and glass) and composite (polymeric) insulators. The study highlighted the long operational history and mechanical strength of porcelain insulators, emphasizing their resilience in various environmental conditions. However, it also pointed out the advantages of composite insulators, such as their lighter weight, resistance to vandalism, and superior performance in polluted environments, similarly noted by Verma et al. [5]. This comparison underscores the ongoing debate regarding the optimal choice of insulator material for different applications. According to Venkataraman and Gunasekaran [6], in 2015, ceramic insulators made up nearly 50% of the global market for high-voltage insulators, higher than both composite (40%) and glass (12%).
The majority of recent literature focuses on polymeric insulators. Verma and Subba Reddy [7] studied different experimental methods for evaluating the erosion performance of polymeric insulators in high-voltage applications to inform about service life estimations. Gao et al. [8] explored the failure mechanisms and mechanical properties of composite insulators. Halloum and Subba Reddy [9] conducted a failure analysis of polymeric outdoor insulators, specifically for use in HVDC converter stations, which were significantly affected by voltage polarity reversal. Several researchers have specifically focused on the failure of the fiber-reinforced polymer core of polymeric insulators from transmission lines. Notable studies include those by Ogbonna et al. [10], Gao et al. [8], and Nagaraj [11]. These studies collectively highlight the critical aspects of polymeric insulator performance and failure, contributing to a deeper understanding of their reliability in various high-voltage applications.
While less recent, the structural performance of cantilever porcelain insulators has been the subject of extensive research. These studies have focused on aspects including mechanical strength, insulation capability, durability, and resilience in various environmental conditions, providing critical insights for their successful implementation. The research primarily targets high-voltage transmission lines (60 kV to 500 kV) to improve efficiency and address insulator failures in electric substations caused by seismic events. Cherney [12] conducted long-term static cantilever testing on 46 kV porcelain post insulators removed from service after up to 10 years. Statistical comparison with conformance test data showed no discernible reduction in strength due to aging. Takhirov et al. [13] performed seismic qualification of 550 kV disconnect switches, including dynamic testing on switch assemblies and static cantilever tests on insulator post arrays. The study found that the posts had considerable strength beyond their rated capacities and variations in load–strain diagrams, with tension strains having a steeper slope than compression strains. Reinhorn et al. [14] developed finite element models to investigate the dynamic response of the high-voltage transformer and 196 kV/230 kV porcelain bushing assemblies. Moustafa and Mosalam [15,16] conducted static cyclic-loading, fragility pull, resonance-search, and dynamic tests on 230 kV post insulators, followed by finite element modeling and a sensitivity parametric study, to rank uncertainties. Gokce et al. [17] reported on the seismic performance testing of 550 kV post insulators, conducting quasi-static cyclic tests and finite element simulations. Khalvati et al. [18] performed shake table testing on 63 kV and 132 kV insulator posts, both standalone and mounted on a lattice steel structure. This data was then used by Mohammadpour and Hosseini [19] to develop fragility curves based on finite element simulation and the seismic time history analysis of a 63 kV post insulator.
While research is abundant on the overall insulator performance in high-voltage applications, it has been noted that limited attention has been given to the performance of insulators tied to railway power systems [20]. The few articles on the performance of insulators in overhead rail systems are summarized below. Muangpratoom et al. [21] investigated the use of nano-TiO2 coatings on porcelain insulators to enhance their electrical performance in railway electrification systems. The study found that the nano-TiO2 coating significantly improved the low-frequency flashover voltage in both dry and wet conditions. However, the impact on the lightning impulse critical-flashover voltage was minimal. Subba-Reddy and Ramamurthy [20] studied the performance of in-service composite insulators in overhead railway systems. Electrical performance was studied using leakage current analysis and surface resistance measurements in a fog test chamber. The structural changes in the composite silicone polymeric material were studied by using scanning electron microscopy and energy-dispersive X-ray, Fourier-transform infrared, and wettability measurements. Wang et al. [22] designed an image-based algorithm that classifies overhead railway insulators using an adaptative, cascaded convolutional neural network. The system can classify the status of insulators as normal, damaged, or missing by analyzing high-definition images. The trained model can detect insulators with an average precision of 94.5%, while the classification network has F1-scores of 96.09%, 90.66%, and 88.52% for normal, damaged, and missing states, respectively.
There is a clear knowledge gap on the structural performance of both porcelain and polymeric insulators in overhead contact systems (OCSs). OCSs serve as the power source for heavy rail, electric light vehicles, streetcars utilizing pantographs or trolley poles, and electric trolleybuses [23]. Mechanical failure in insulators leads to a conductor drop, which prompts significant safety hazards, including prolonged power interruption, potential injuries, and damage [1]. Therefore, it is classified as a critical failure mode within the domains of power transmission and distribution systems. Insulator failure within a railway power system can disrupt train services, causing delays and economic losses.
This paper aims to close the knowledge gap on the structural performance of porcelain insulators as an integral part of a contact wire registration assembly (CWRA) (shown in Figure 1) in an overhead railway power system through experimental evaluation. This study focuses on porcelain insulators due to their prevalence in the northeastern United States, where the study was completed. Both direct tension and the standard 45-degree assembly were evaluated. Both new insulators and those removed from service were tested to determine if aging had an impact on the ultimate strength of the insulators. The insulators tested were 23 kV. The supply voltage of the rail line was 12.5 kV. In the 45-degree tests, the location of the drop bracket was modified to determine the impact of installation tolerances on the ultimate strength of the assembly. This paper will include a summary of the experimental design for both the tension and 45-degree tests, an overview of the test specimens, the results of the experiments, and a thorough discussion of the findings. Major findings include the fact that insulators that were removed from service had lower ultimate strengths than virgin insulators in the standard 45-degree assembly. Additionally, the location of the drop bracket influenced the failure mode and stiffness of the overall assembly. The findings from this work can contribute towards future improvements in the system’s design and performance.

2. Materials and Methods

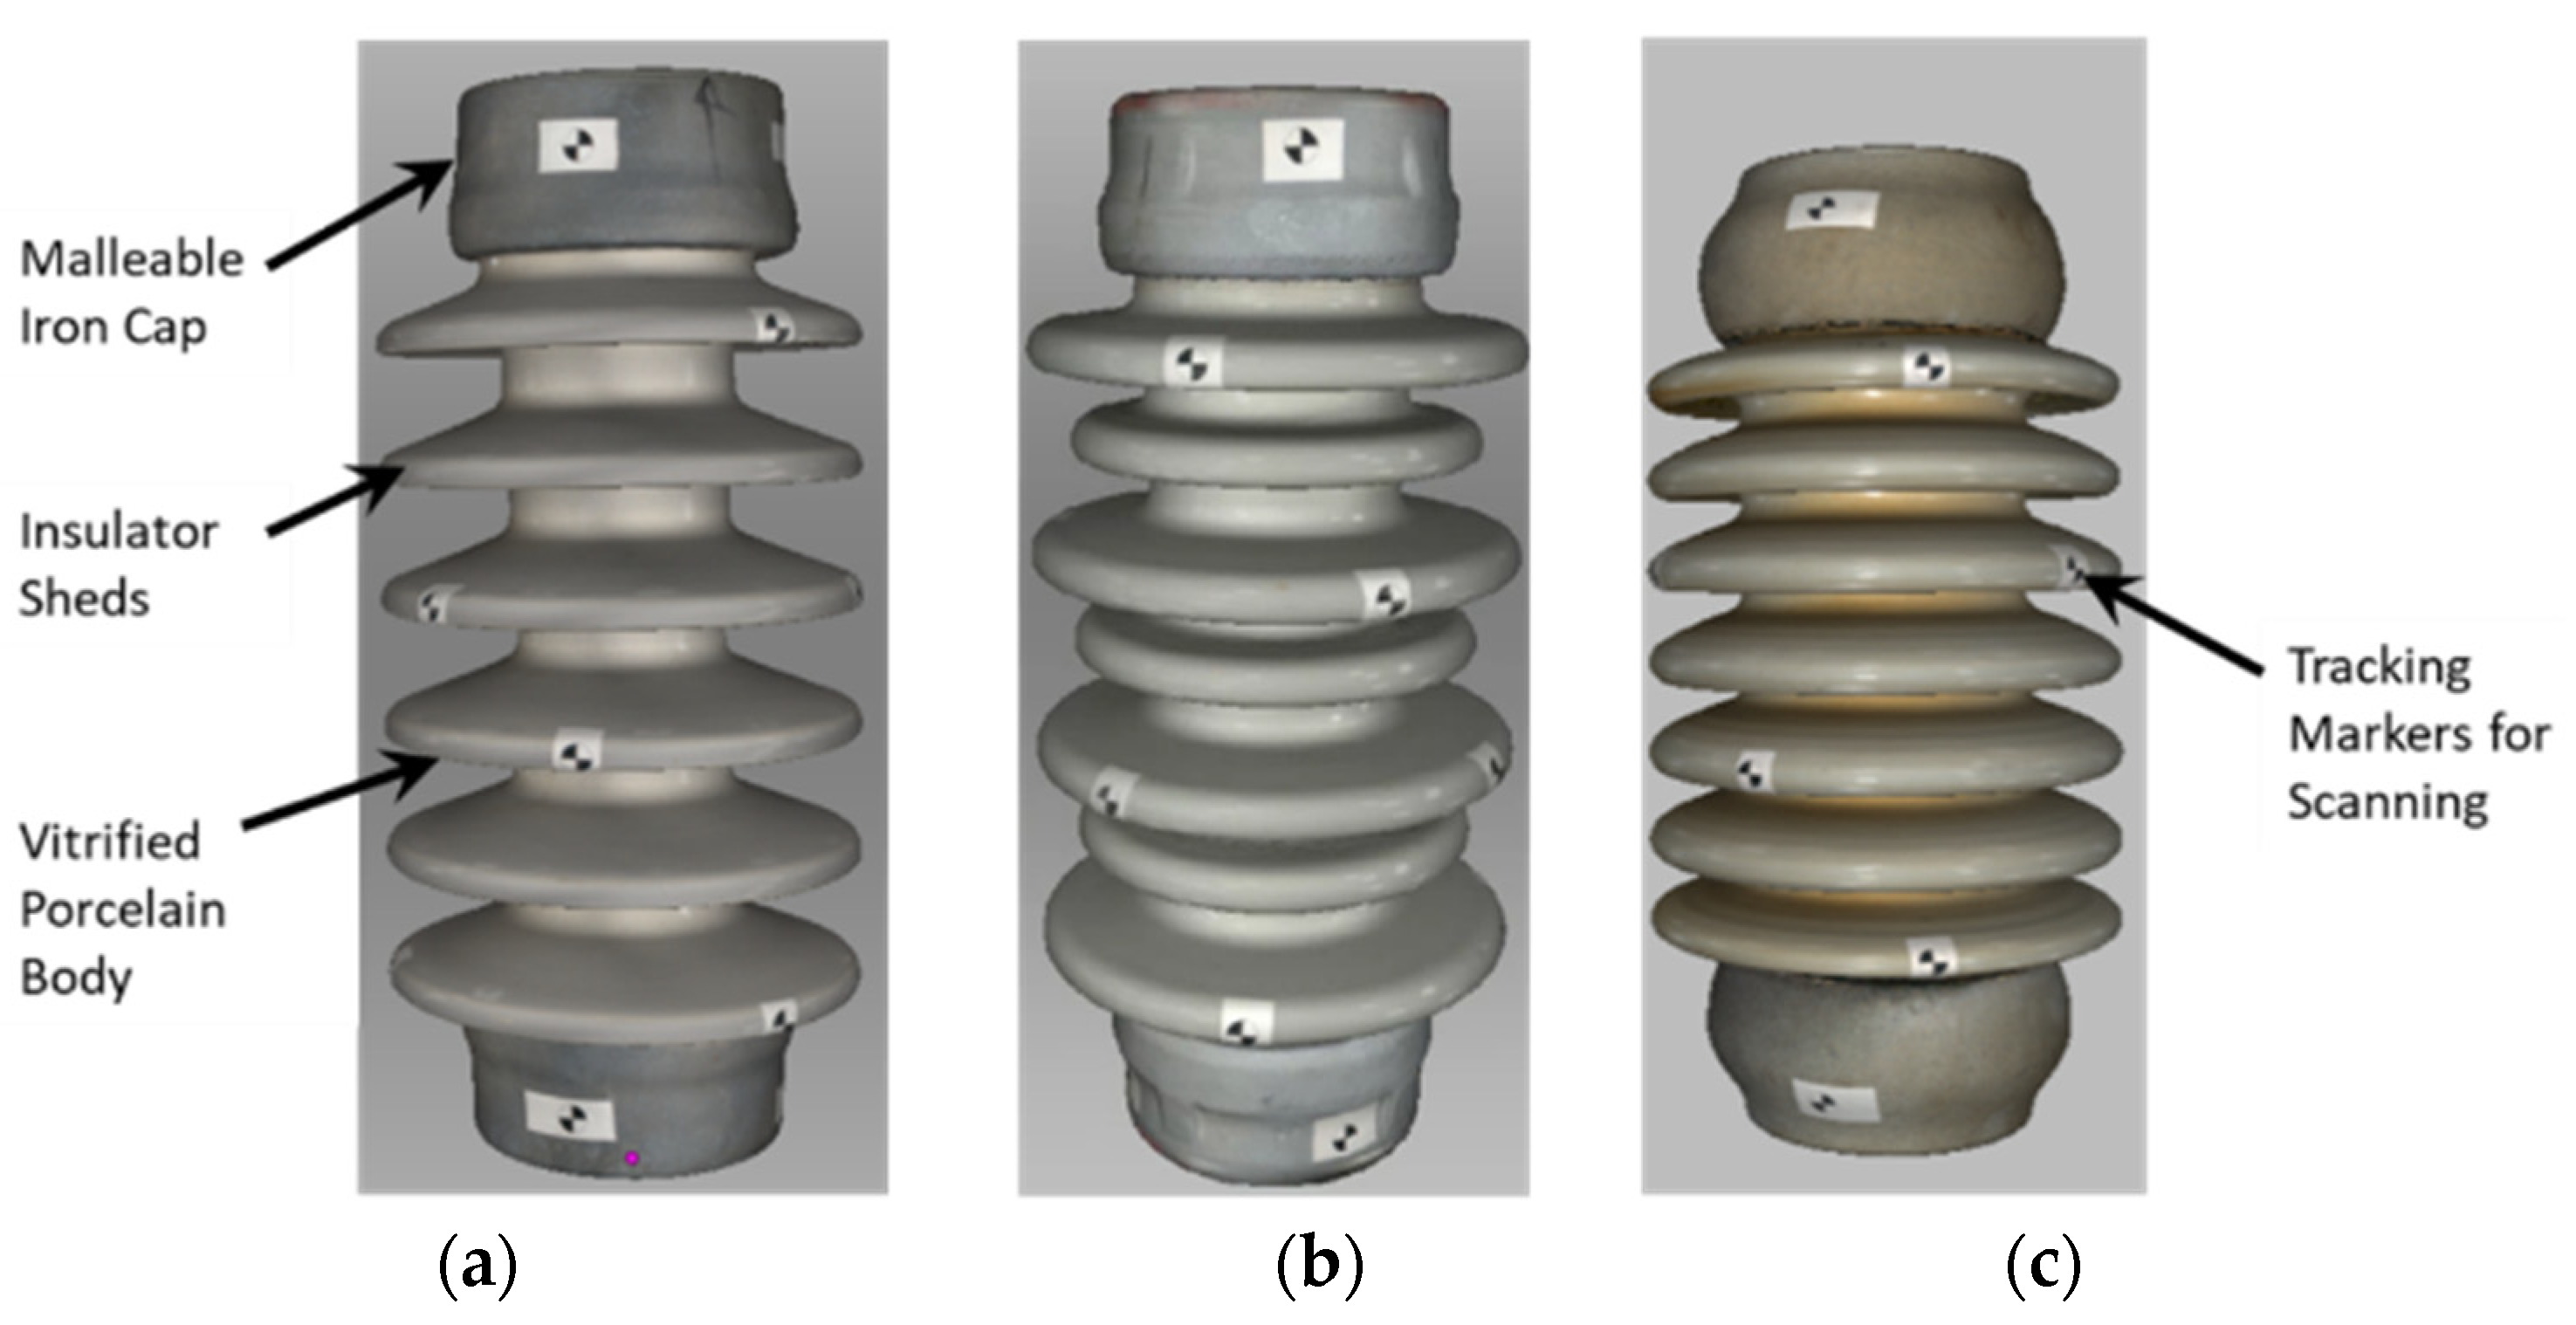
To investigate the structural performance of the 23 kV porcelain insulators in the context of the CWRA, a series of tests were conducted. The insulator type studied was Technical Reference Number 208, from ANSI/NEMA C29.9-2017 [24]. This included a height of 356 mm (14 in), minimum leakage distance of 610 mm (24 in), cantilever strength of 8.9 kN (2000 lbf), tension strength of 44.5 kN (10,000 lbf), compression strength of 44.5 kN (10,000 lbf), and torsion strength of 914 N-m (8000 in-lbf). The following text was added to note this. A total of four direct tension tests and nineteen standard 45-degree assembly tests were conducted. Each porcelain insulator was 3D-scanned to extract a full geometric profile. A sample scan below in Figure 2 shows all geometric profiles of the insulators tested. It is important to note that all new insulators had the geometry shown in Figure 2a.
The two additional geometries were included only for retired insulators, which were in service under a supply voltage of 12.5 kV. While the research team tried to eliminate as many variables as possible, it was not possible to control for the geometry of retired insulators. To enable a comparison of the results for the different geometries, stresses rather than ultimate forces were compared. The following sections will expand first on the tension tests, followed by the CWRA (45°) tests.

2.1. Tension Tests

2.1.1. Experimental Setup

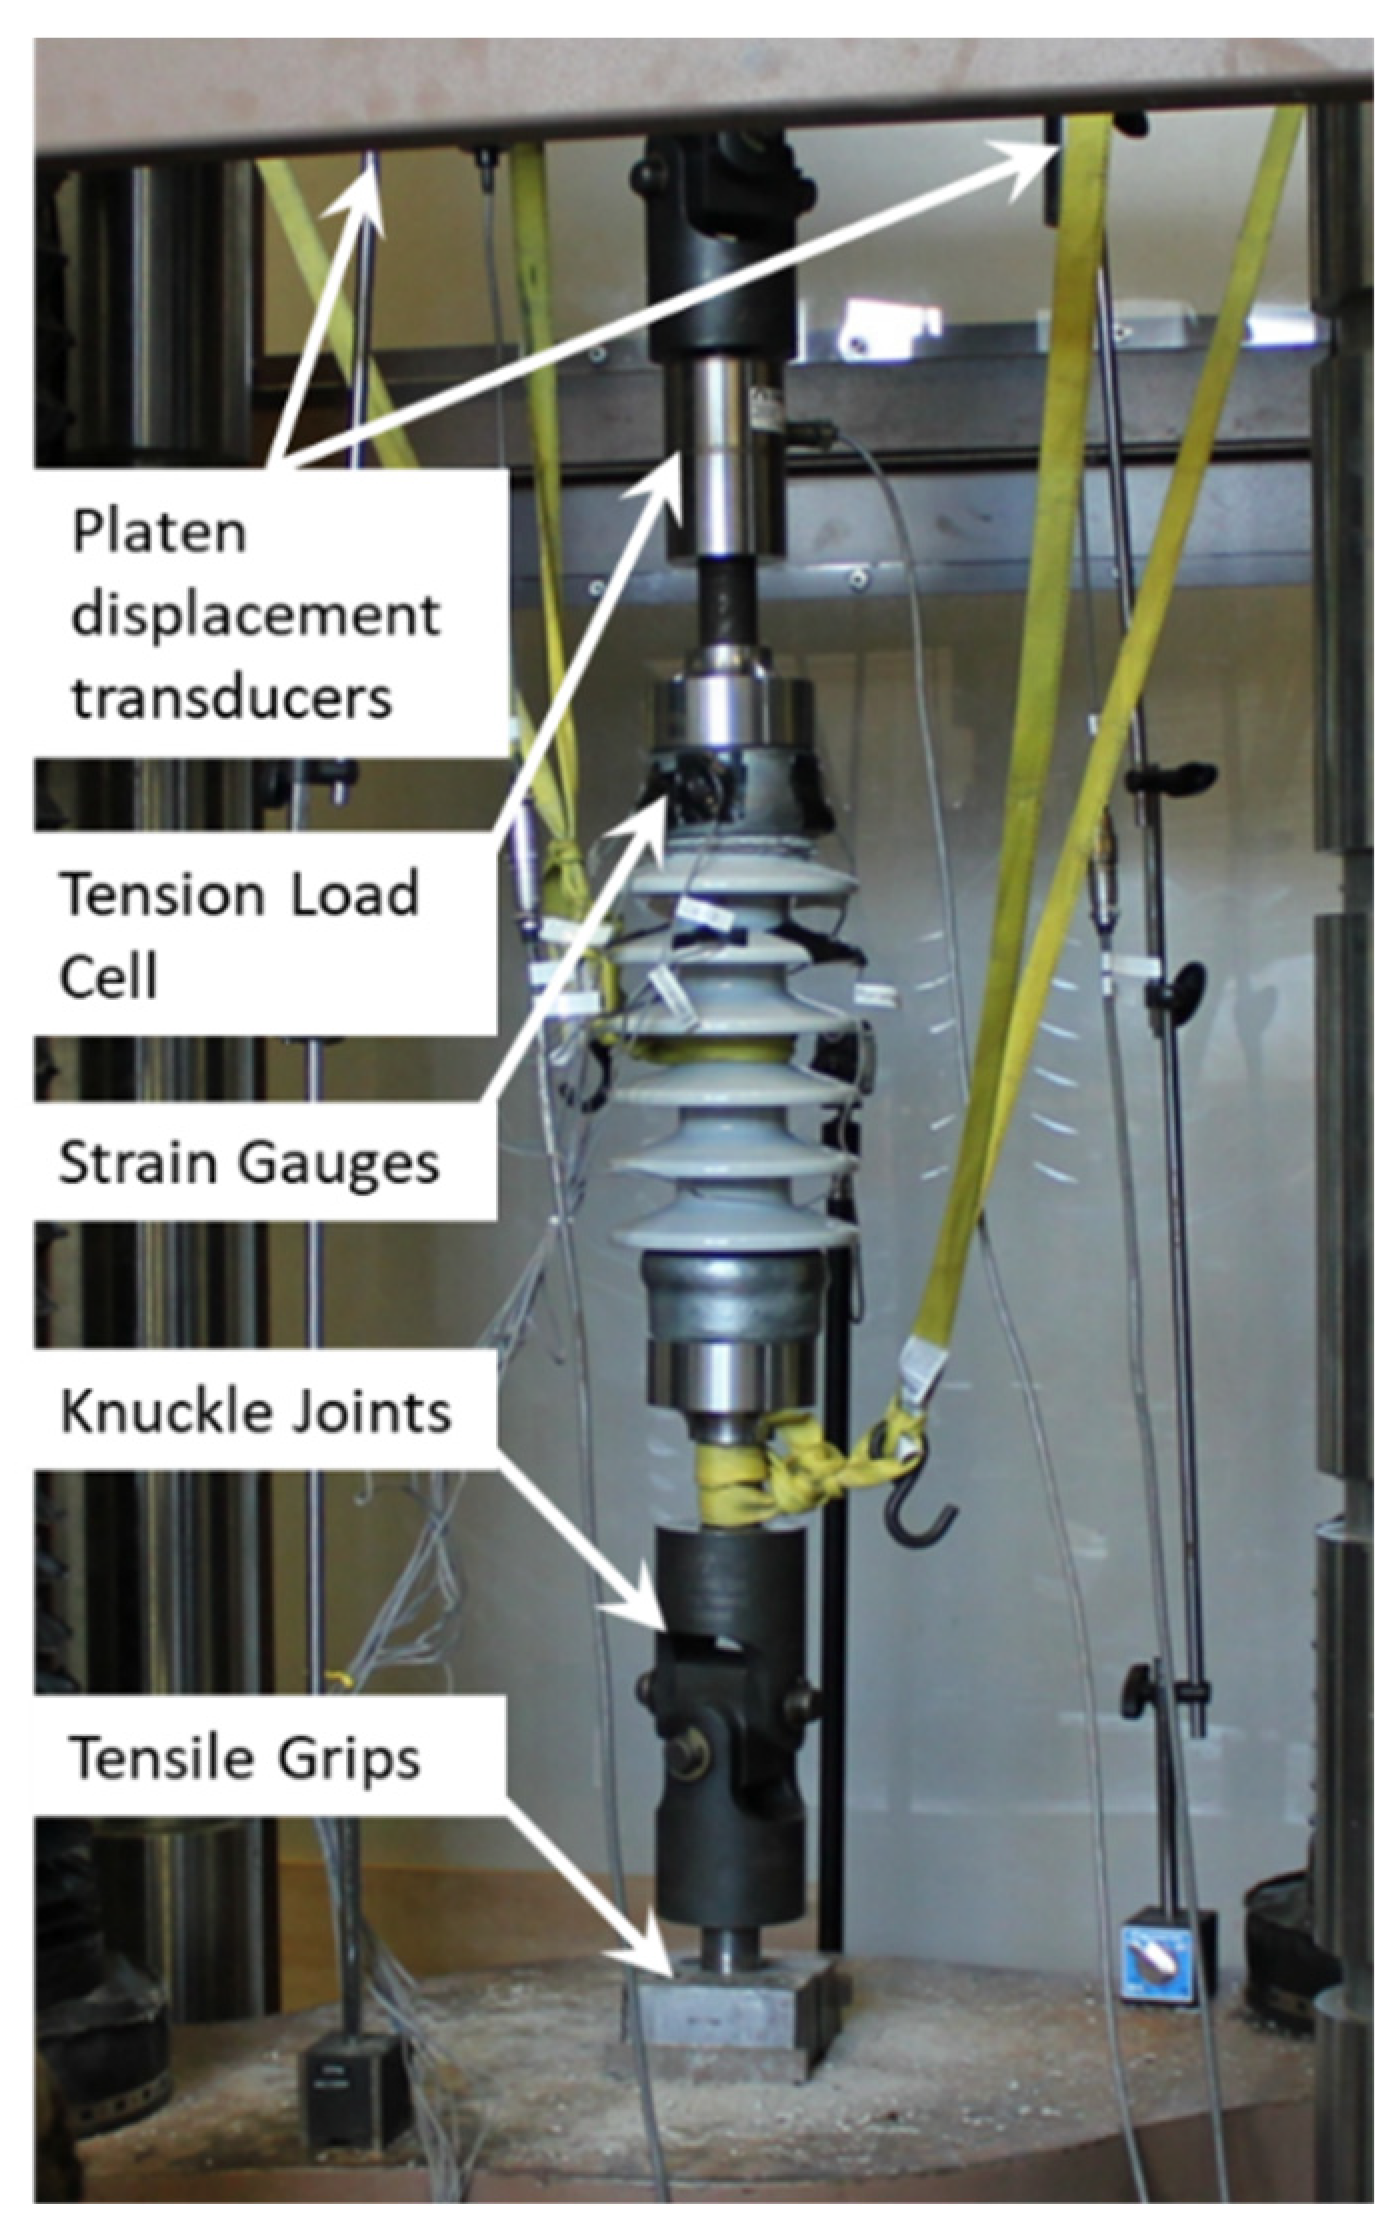
Tension tests were performed on several insulators (three new and one retired from service) to assess the consistency of the ultimate tensile strength. All tests were completed on the 6-shed standard geometry. A direct tension test was carried out, as it helped to limit the number of variables affecting the ultimate strength determination. Knuckle grips were used at the top and bottom of the assembly to allow for any small rotations. The specimens were tested in a Satec 1780 kN (400 Kip) hydraulic testing machine, as shown in Figure 3.

2.1.2. Instrumentation and Loading Protocol

To collect a robust dataset, additional instrumentation beyond the machine load and displacement measurements was included, such as two platen displacement transducers and strain gauges on the top cap and on the insulator, as well as a tension load cell. Loading was carried out per ANSI/NEMA C29.1-2018 [25]. The insulators were loaded at a rate of 25% of the ultimate rated tensile strength per min (11.1 kN/min or 2.5 kips/min).

2.2. CWRA Tests

2.2.1. Experimental Setup

The test setup for the CWRA was composed of a vertical 1.2 m (4 ft) length of a W200 × 35.9 (W8 × 24) section bolted to a horizontal W355 section (W14). The vertical section was clamped to two sections of 100 × 100 × 13 mm (4″ × 4″ × 1/2″), from which the CWRA assembly was mounted. Gusset plates and a braced member were added to provide stiffness. The setup allowed for less than 0.25 mm (0.01″) of horizontal displacement at the top of the WF column. A representative view of the assembly is shown in Figure 4.

2.2.2. Instrumentation and Loading Protocol

To conduct the static tests, a hydraulic load ram (Enerpac RD1610, North America, Menomonee Falls, WI, USA) was employed that applied a tensile load at a rate of 4000 N/min (900 pounds per min). The loading rate was monitored and manually adjusted using a 22.2 kN (5 kip) S-type load cell attached to both the assembly and load ram. This loading rate aligned with the ANSI/NEMA C29.1-2018 [25] standard for cantilever ultimate mechanical strength testing, which stipulated a target loading rate of 30–60% of the insulator’s rated cantilever ultimate strength per min. Consequently, a target rate of 45% per min was set. Loading was halted when failure occurred, as defined by a drop in the load-carrying capacity or by the notable yielding of the registration tube at the attachment plate.
The internal pressure of the return and supply lines of the hydraulic system was observed using separate pressure gauges. Additionally, the force exerted on the vertical bracket by the cylinder was measured using a 22.2 kN (5 kip) load cell. To prevent the application of bending loads on the load cell, an adapter was included. Three different positions of the vertical bracket attached to the registration tube were examined to simulate various field conditions, as depicted in Figure 5.
The horizontal displacement data were recorded utilizing a PB series string pot from UniMeasure Inc. (Corvallis, OR, USA), model PB-10-S10-N0S-10C. The same sensor was responsible for tracking the top displacement of the braced W200 × 35.9 (W8 × 24) column. A modular HBM MX1615B served as the data acquisition system (DAQ) for recording the transducer data. The HBM Catman software version 5.3.1 facilitated data recording, capturing 100 datapoints per second.
A high-resolution monochrome video camera from The Imaging Source (model DMK 38GX304, Breman, Germany) equipped with a Sony Pregius 17.6 mm type 1.1 CMOS sensor model IMX304LLR (Sony, Tokio, Japan) and a Computar 2/3″ F2.0 16 mm lens (model M1620-MPV, CBC Group, Tokio, Japan) was used for visual documentation. The image capturing was performed at a rate of five frames per second (FPS) using the IC Capture software version 2.5.547.4007 (The Imaging Source, Bremen, Germany) and saved in BMP format. Lighting conditions were manipulated using a combination of yellow and LED lights, along with red light from three RGB-LED video lights (GVM model RBG-800D, Great Video Maker, Philadelphia, PA, USA). High-contrast video trackers were employed at specific points of interest, aiding the post-processing software’s ability to track pixel displacement and provide displacement measurement values all along the CWRA.

3. Experimental Results and Discussion

3.1. Tension Tests

3.1.1. Failure Modes

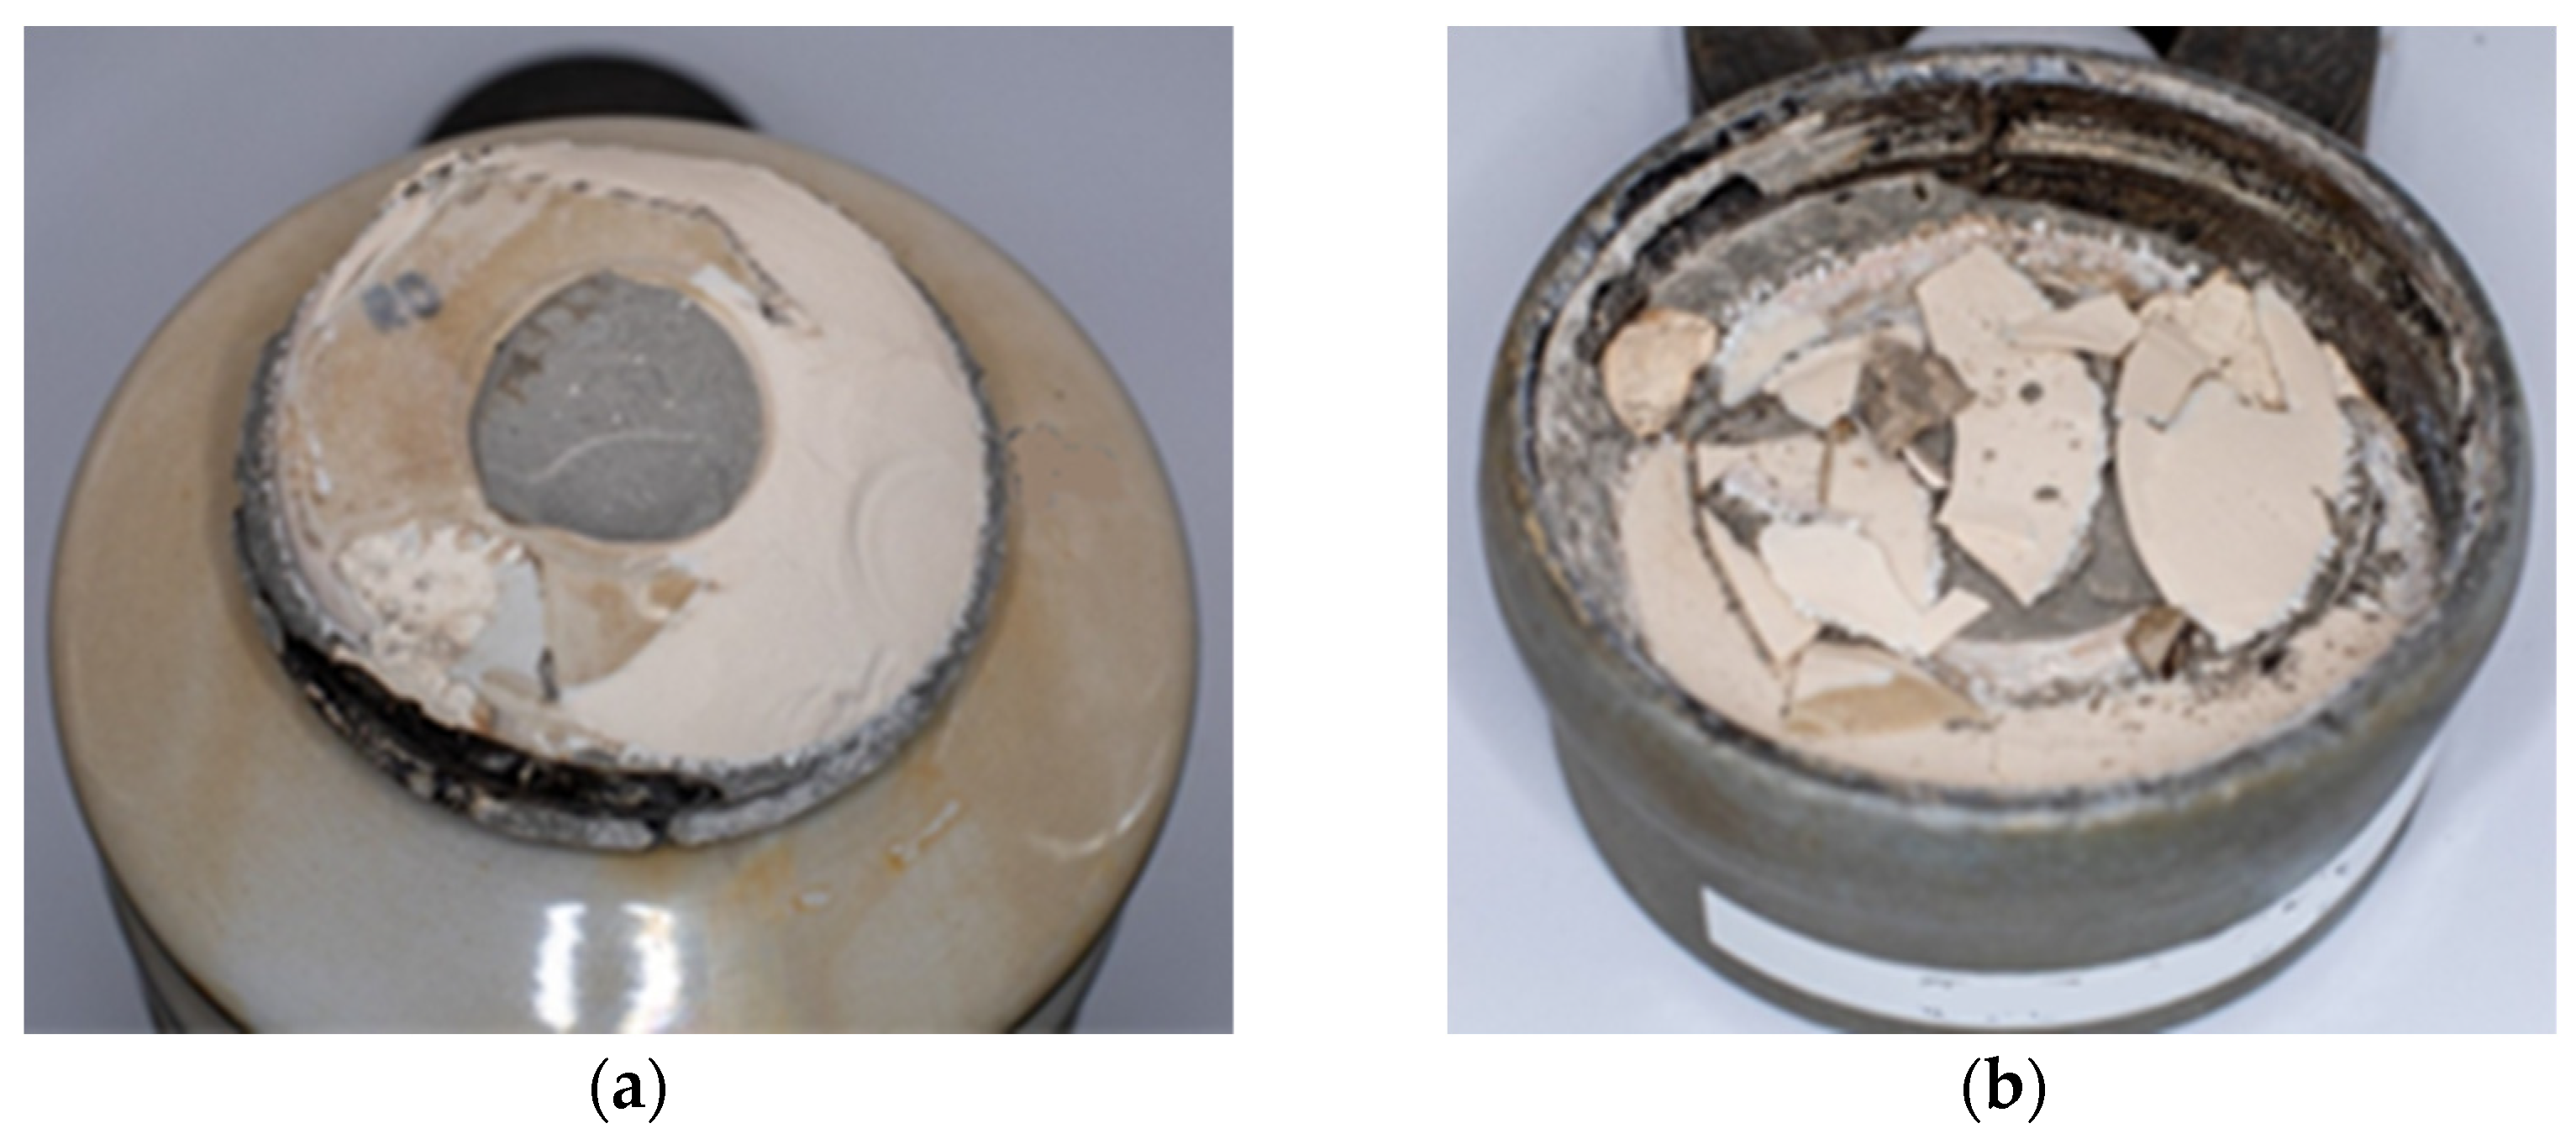
For all the tested insulators, the observed failure mode was the pullout of the porcelain body from the grout of the cap, as shown in Figure 6. The mean pullout force was 108.1 kN (24.3 kips). The test on a retired insulator had a similar failure mode; however, cracking within the porcelain was heard at 89.0 kN (20 kips) of loading before failing at 117.9 kN (26.5 kips), with both shear failure in the grout and multiple fractures in the porcelain connected to the grout, as shown below in Figure 7. The results showed a similar failure mode to the new specimens and no reduction in the maximum tensile capacity. This high degree of consistency of the failure mode and ultimate strength led to the observation that it is unlikely to have a pure tension failure of the porcelain insulator body.

3.1.2. Load–Displacement Response

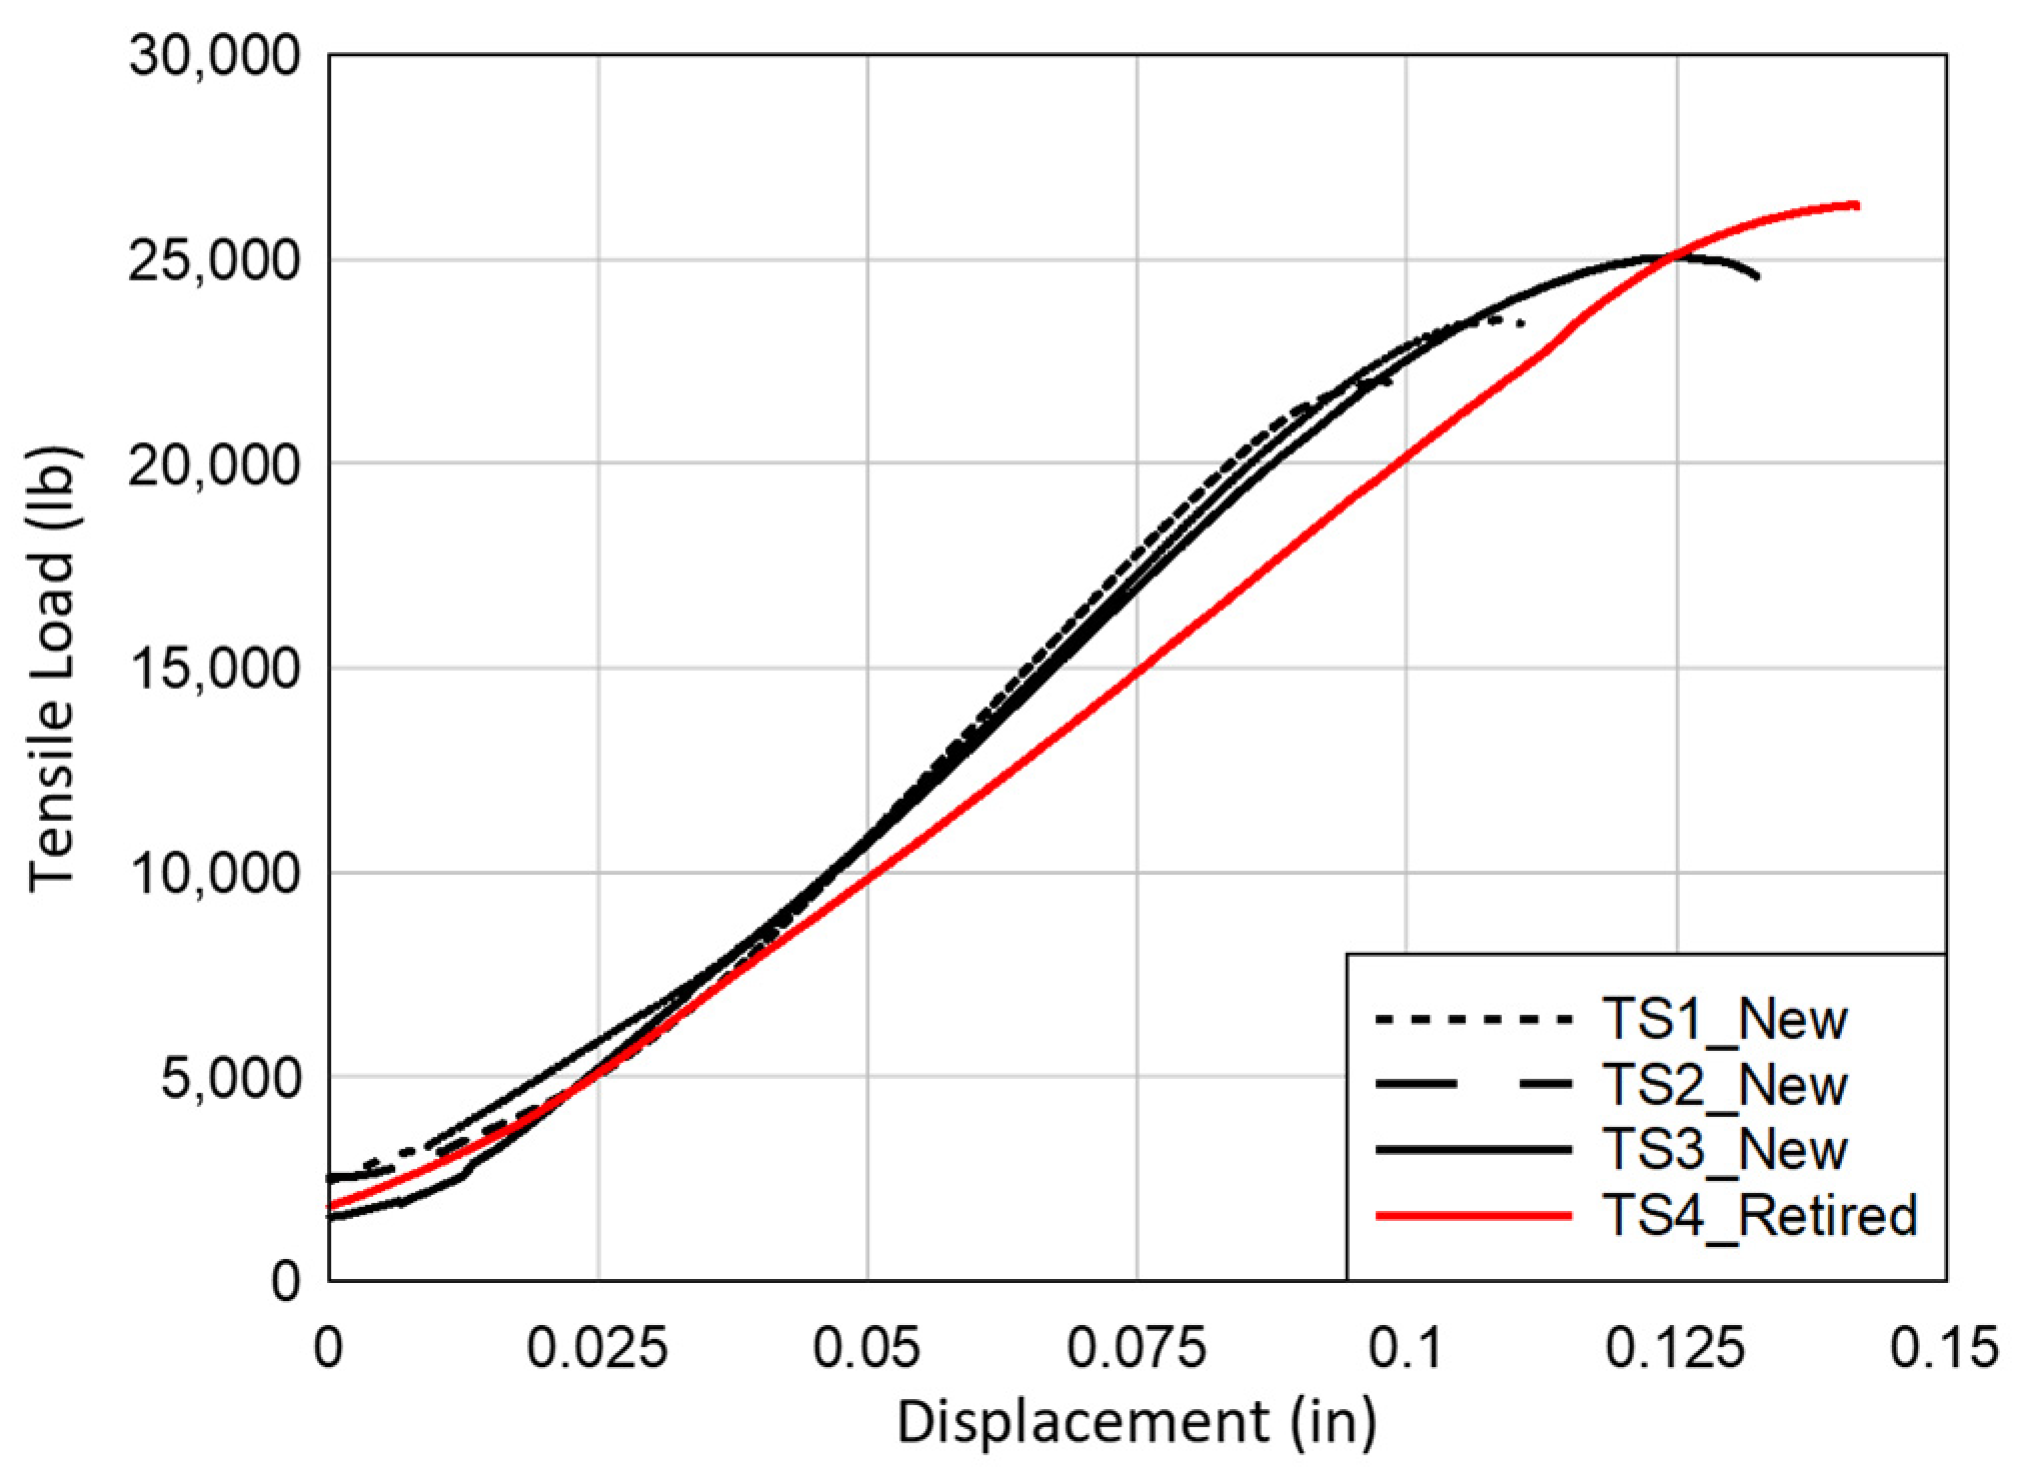
A summary of all tension test results is shown in Table 1, and the load–displacement responses are shown in Figure 8. The results indicate no significant difference in the ultimate capacity between the tested insulators. However, a slight decrease in stiffness was identified in the retired insulator. The implications of this decrease in stiffness on the long-term performance may warrant further analysis. However, as all insulators achieved loads more than double the manufacturing noted capacity of 44.5 kN (10 kips), it was deemed more important to complete further testing on the CWRA assembly to study the impact of age and damage on the standard orientation, as presented in the next section.

3.2. CWRA Tests

3.2.1. Failure Modes

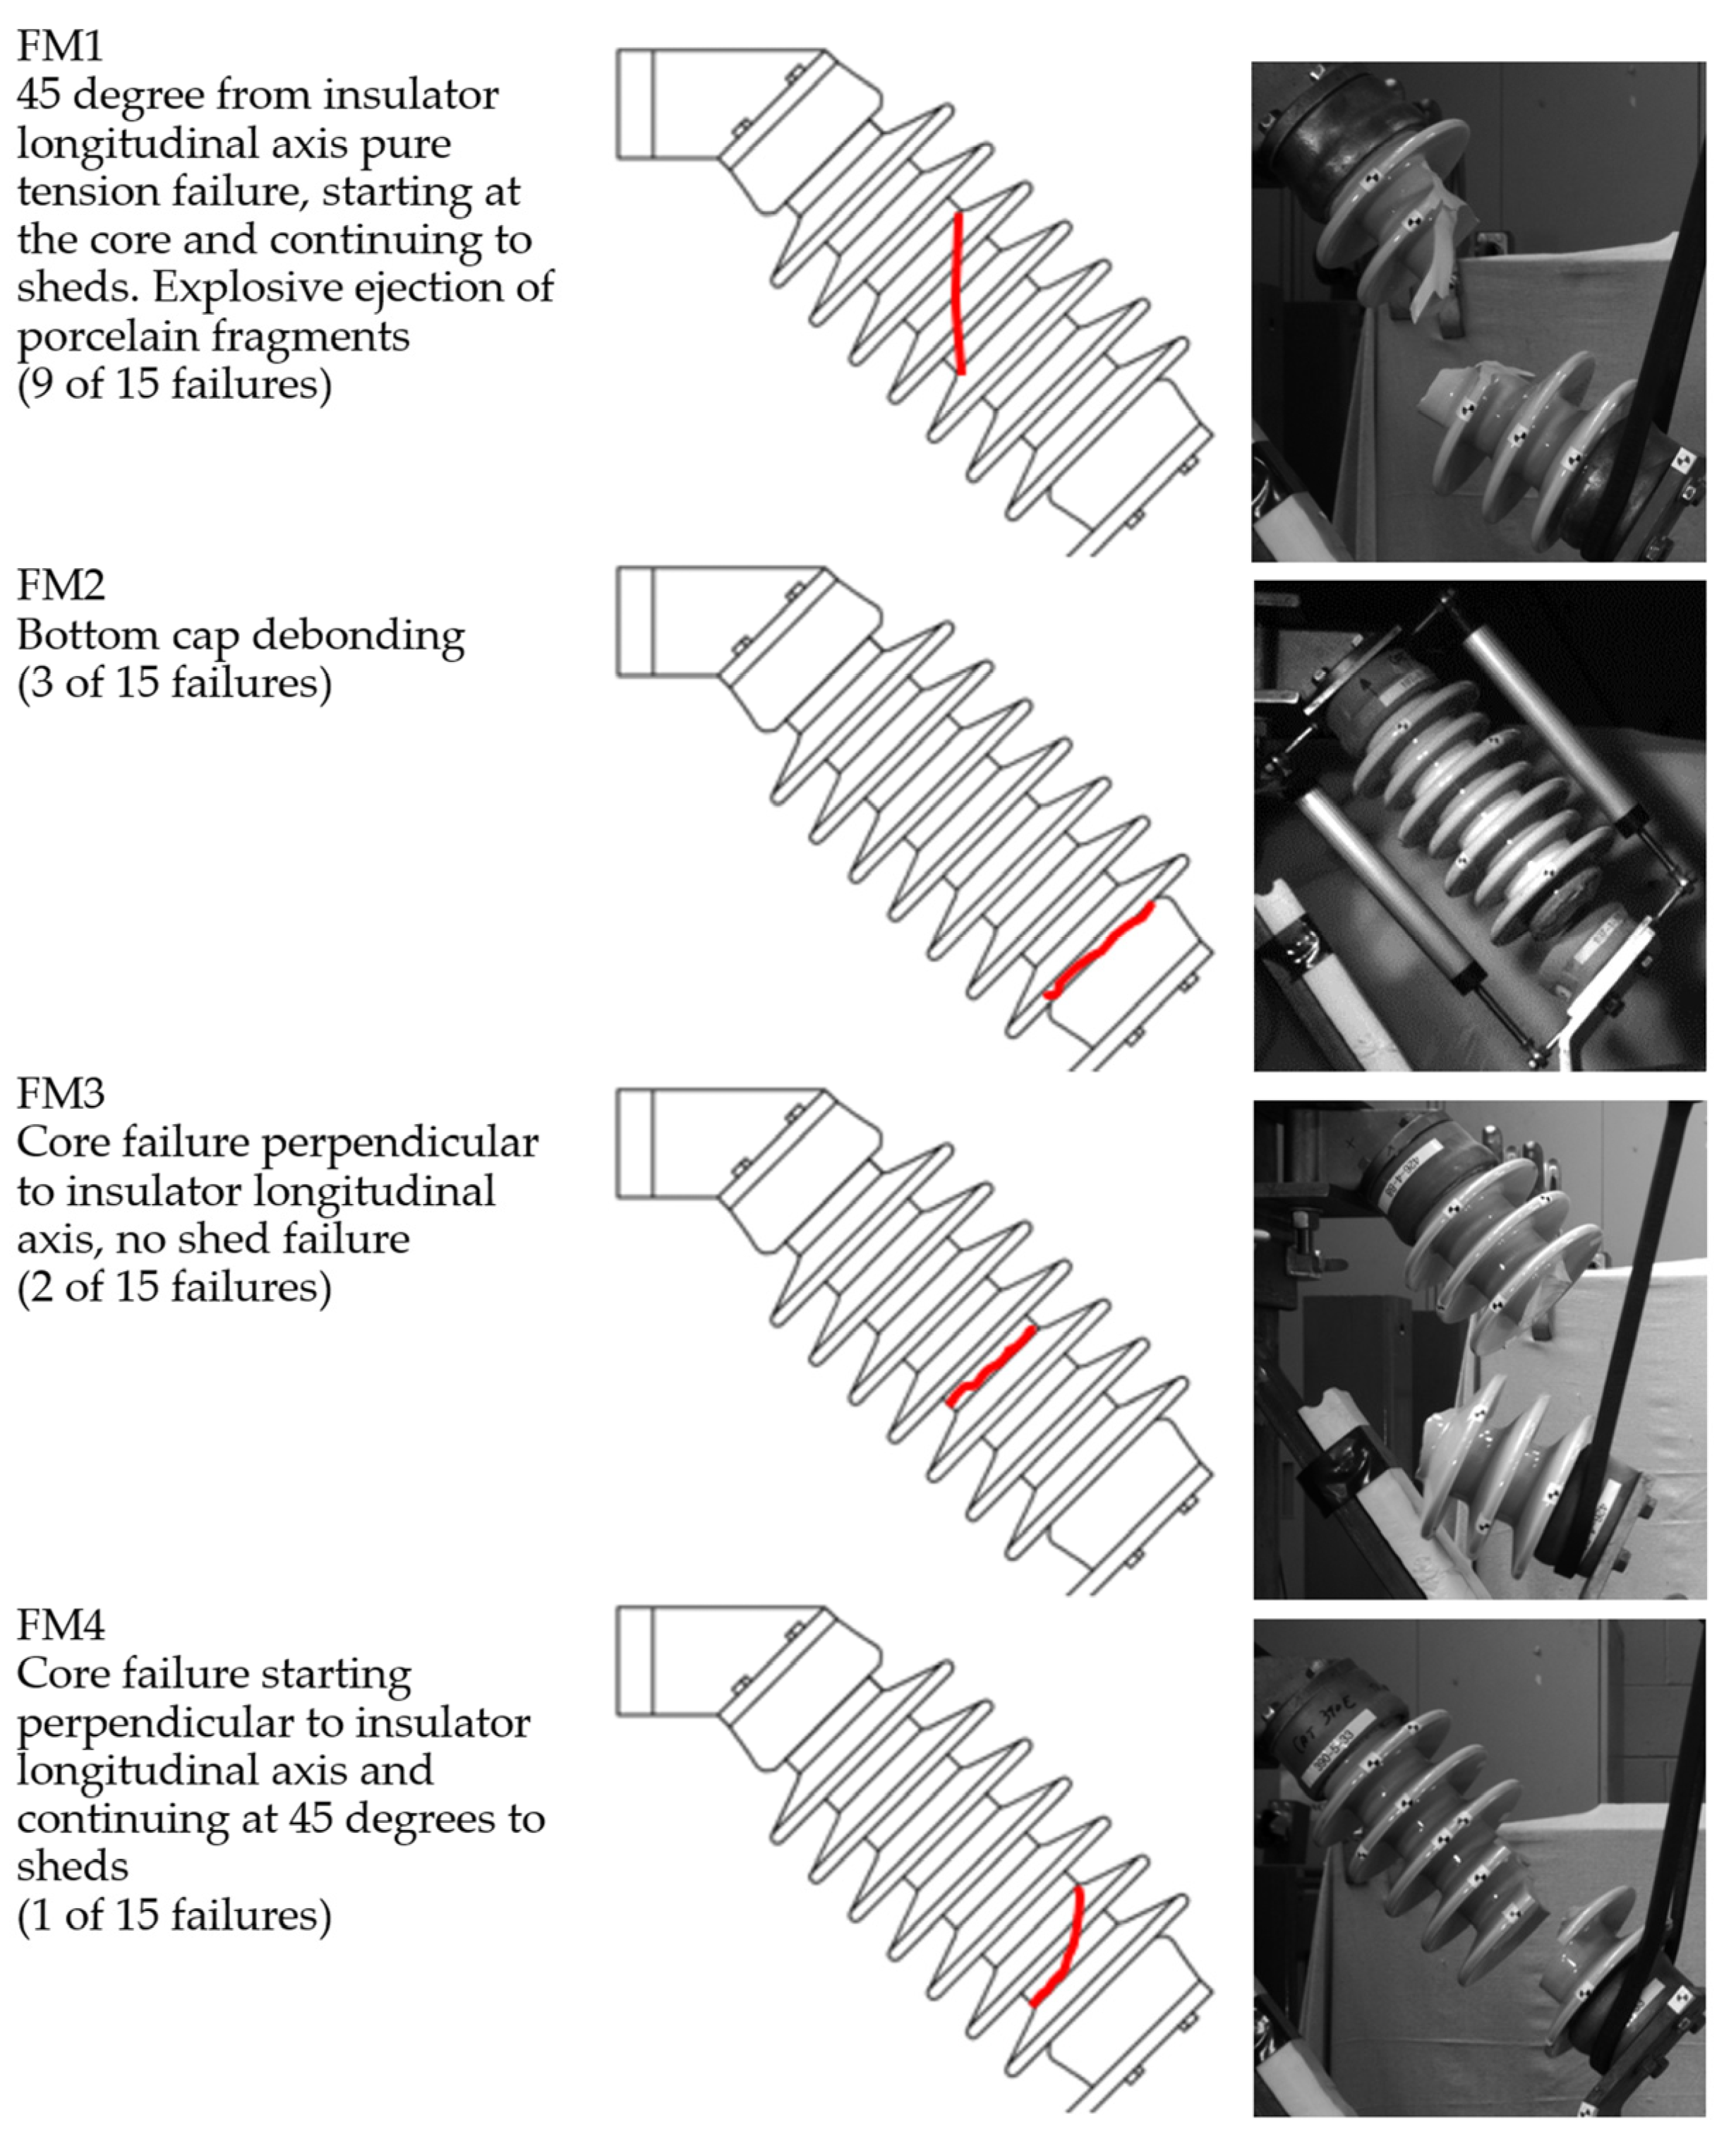
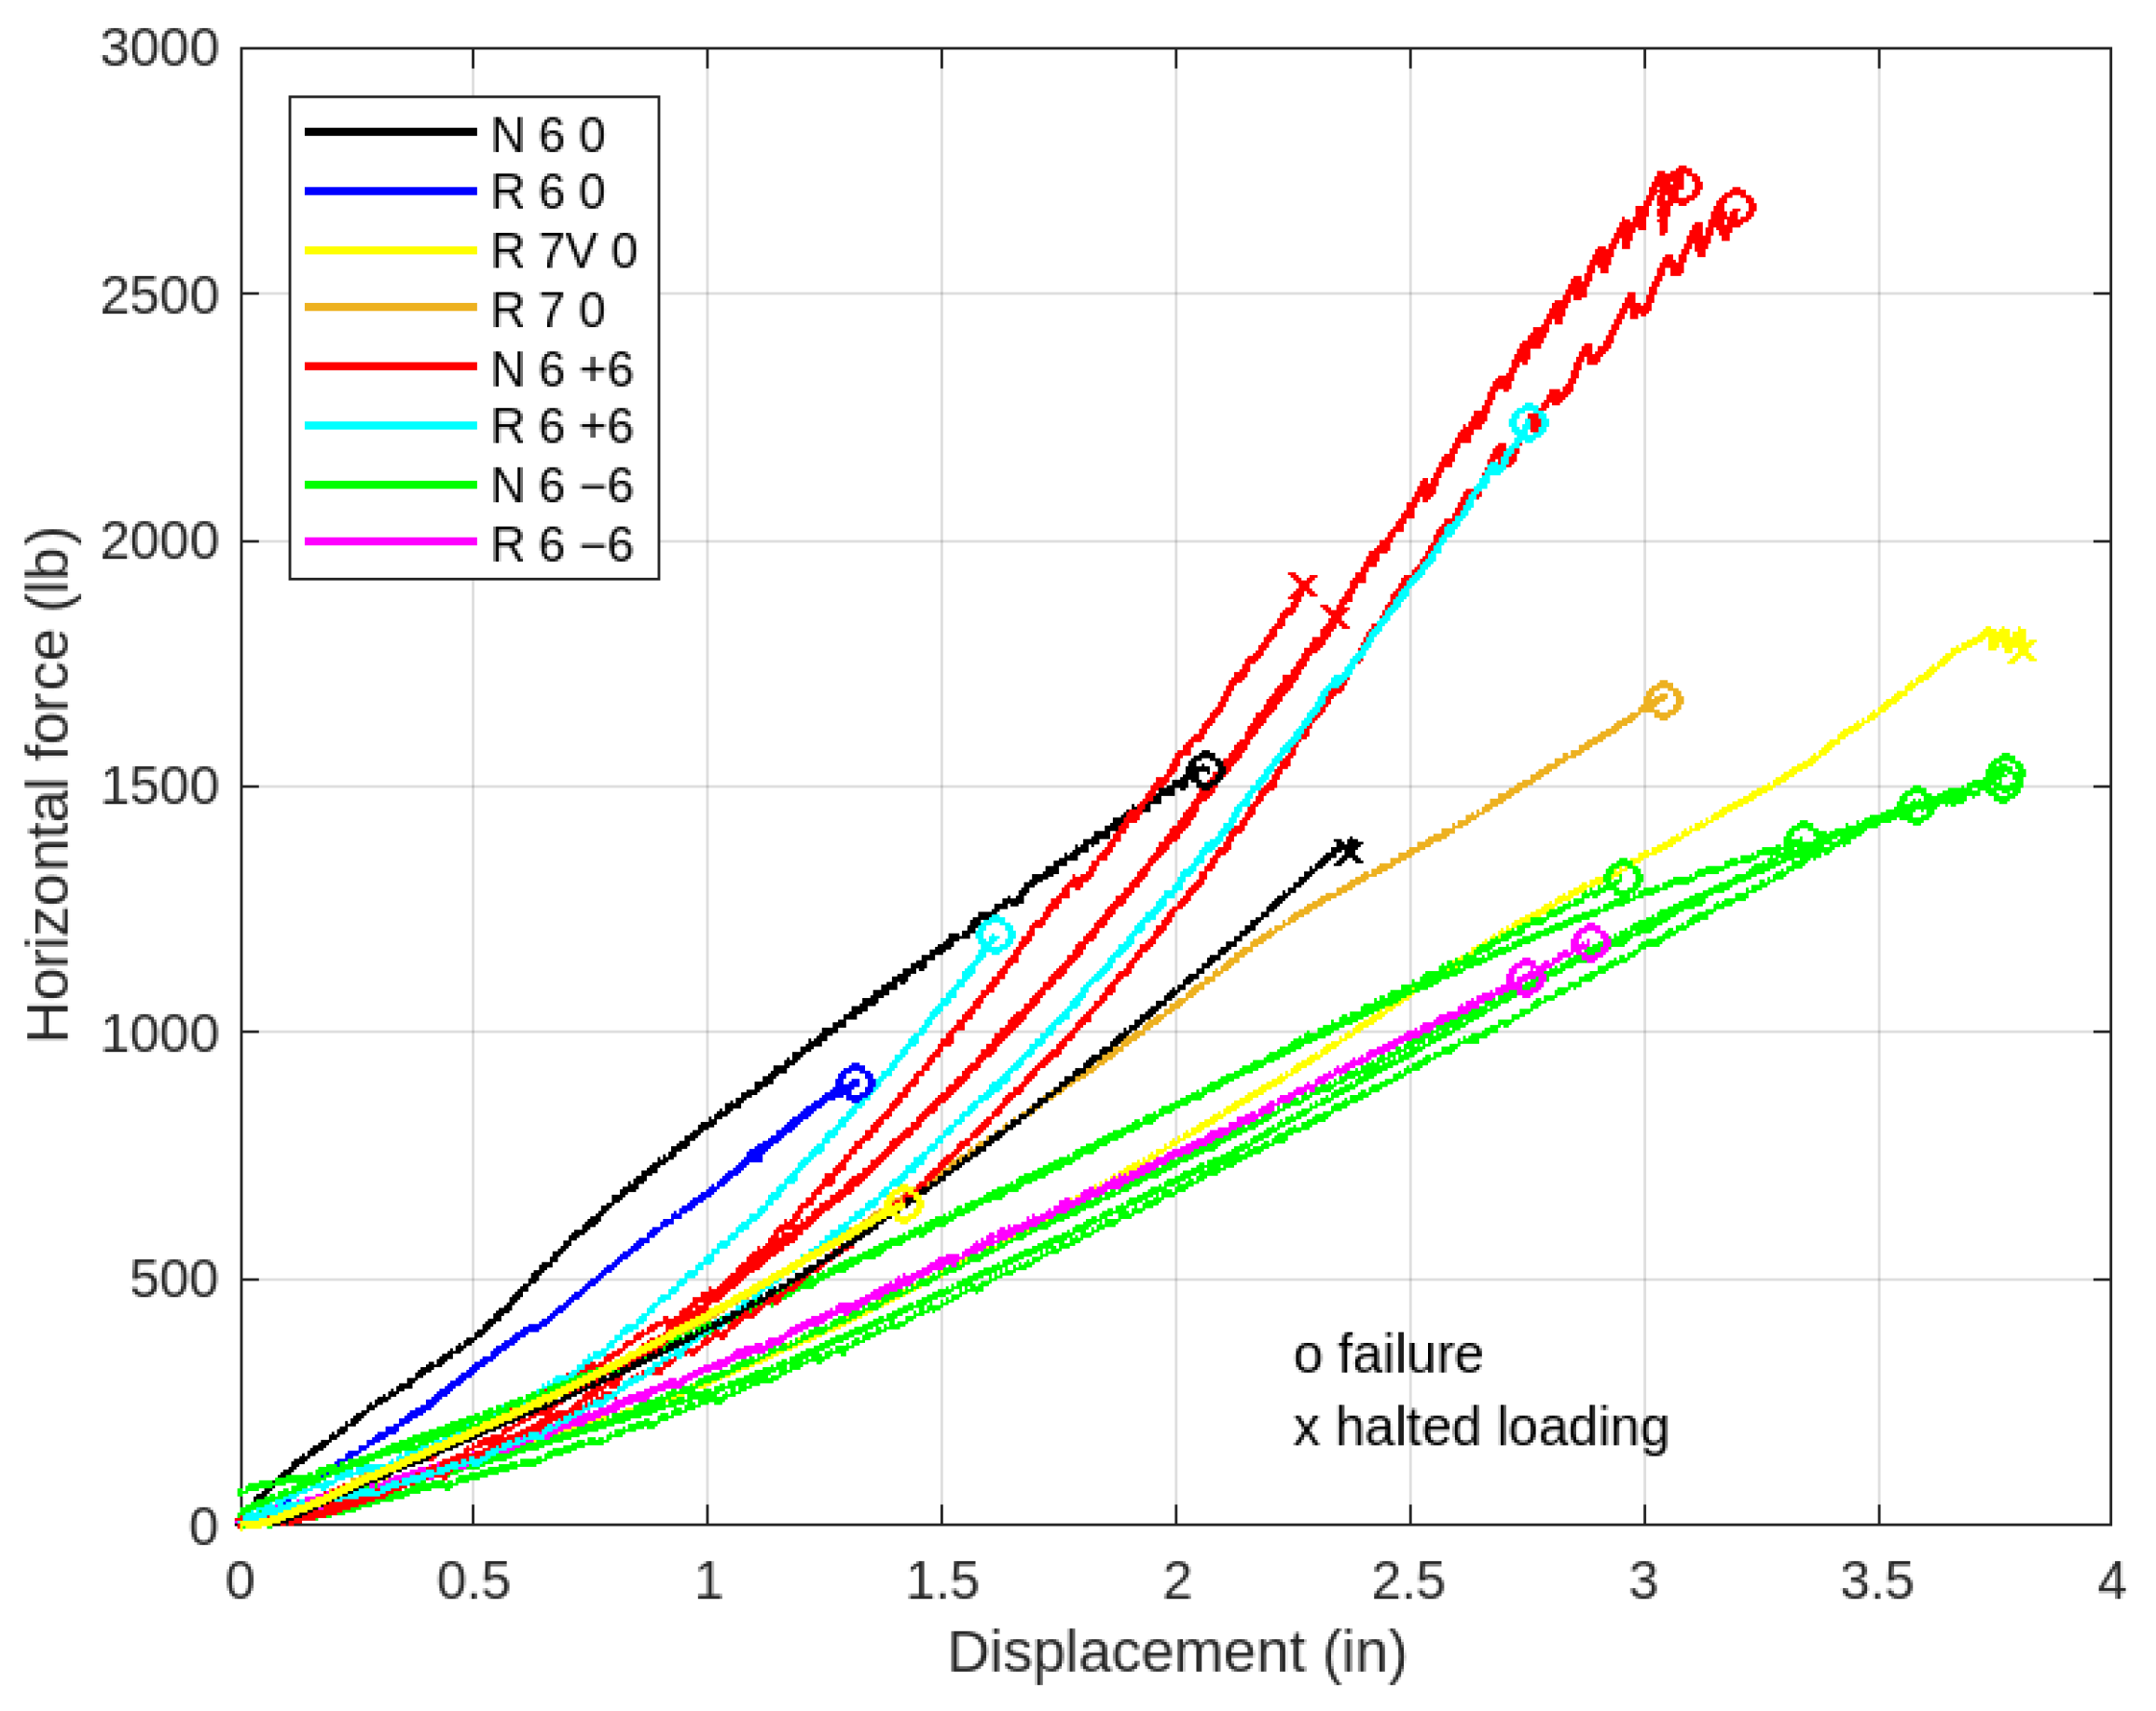
Table 2 presents the maximum force F values and failure modes of nineteen insulators, eight of which were retired from the field. As commented above, different positions of the vertical bracket along the horizontal registration tube were used. The naming convention of the specimens was threefold. The first letter, R or N, denotes new or retired. The second value, either 6, 7, or 7V, denotes the insulator geometry or the number of sheds (Figure 2), where 7V stands for seven sheds, a variable representing the diameter of the shed changes. The final term denotes the offset, either 0, +152 mm (+6 in), or −152 mm (−6 in). The failure modes description is presented in Figure 9.
Failure Mode 1 (FM1) was the most prevalent, seen in 9 out of the 15 insulator failures. FM1 is characterized by pure tension failure initiating at the core and extending to the insulator sheds. Notably, this failure occurs at a 45-degree angle from the insulator’s longitudinal axis and often results in an explosive ejection of porcelain. This failure mode was the most violent one observed. The debonding of the bottom cap of the insulator, termed Failure Mode 2 (FM2), represented 3 of the 15 failures recorded. Failure Mode 3 (FM3), observed in 2 out of 15 failures, is characterized by a core failure perpendicular to the insulator’s longitudinal axis without any shed fractures. Lastly, Failure Mode 4 (FM4) was the least common, noted once out of the fifteen failures. It involves a core failure starting perpendicular to the insulator’s longitudinal axis and continuing at a 45-degree angle to the sheds. There was no explicit differentiation observed in the failure modes between the new and retired insulators. However, it was noted that FM1 was strictly limited to the samples offset in either direction. This observation could potentially imply that positioning the drop bracket at the center may be the most optimized location.

3.2.2. Load–Displacement Response

The horizontal and vertical forces, FX and FY, respectively, were calculated using video tracking of the picture records using the open-source software Blender, which allowed the tracking of the displacements of points of interest during the test. The displacement measurement was photo-recorded at five frames per second (FPS) in the BMP format. Geometric calculations of the points of interest were performed to decompose the load cell force.
As the load cell was able to rotate during loading (see Figure 10 for representative rotations of the different offsets), the components of the load needed to be continuously updated based on the rotation of the load cell. The horizontal force FX and displacement relationship for each test are presented in Figure 11. For the zero offset bracket position, there was no consistency regarding stiffness. For the −152 mm and +152 mm bracket positions, there were corresponding consistent stiffness behaviors. Regarding the +152 mm bracket position, rigid body displacement was observed during testing and confirmed though video tracking, resulting in a double slope, as presented in Figure 11.
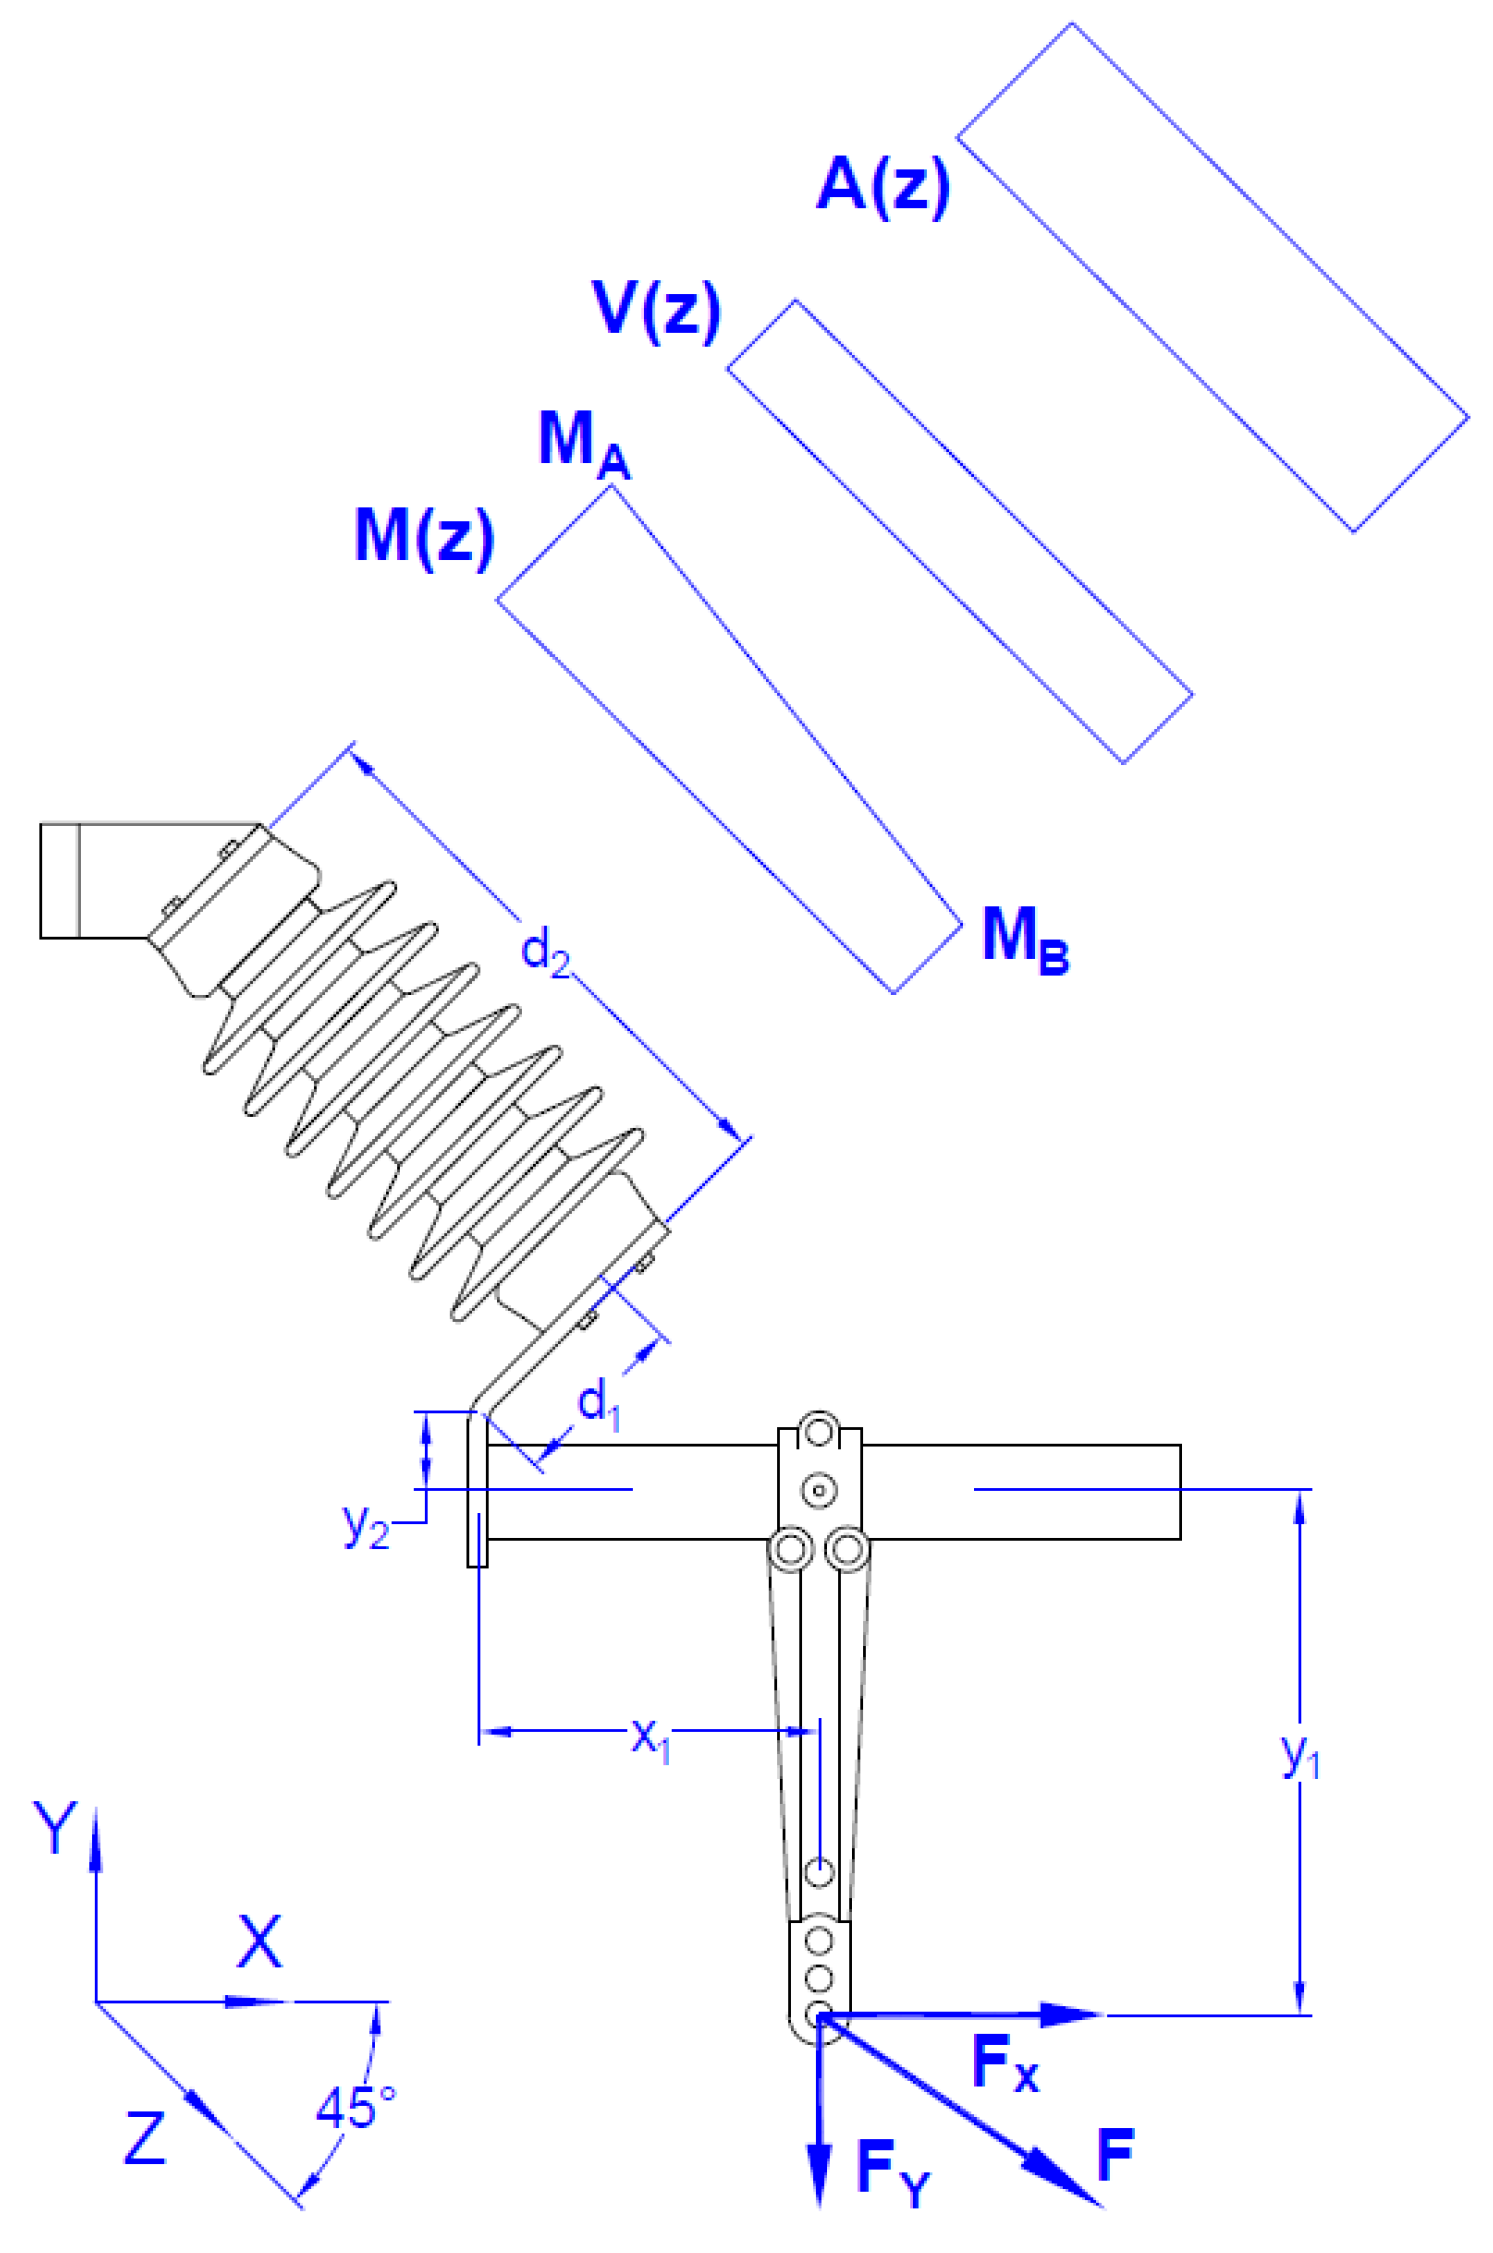
Figure 12 presents the static analysis of the CWRA, along with internal force diagrams—axial +force (A), shear (V), and moment (M)—of the insulator along its longitudinal axis (z). These internal actions are represented by the equations below.
A ( z ) = 0.707 ( F X + F Y )
F ( z ) = 0.707 ( F X F Y )
M A = F X ( y 1 + y 2 + 0.707 [ d 1 + d 2 ] ) F Y ( x 1 + 0.707 [ d 1 + d 2 ] )
M B = F X ( y 1 + y 2 + 0.707 d 1 ) F Y ( x 1 0.707 d 1 )
Both the axial force and shear remained constant throughout the length of the insulator. However, the moment diagram presented a linear variation between the ends of the insulator. Using the classical solid mechanics theory [26], these stresses were combined to calculate the maximum stress at failure, labeled as fmax, as shown in Table 2. According to the conducted analysis, the maximum tensile stress was a combined effect of axial and flexural tensions, with the shear stress equating to zero, due to the parabolic distribution. This stress combination resulted in a failure plane with a 45-degree angle from the longitudinal axis of the insulator, corresponding to the failure mode FM1, which was the most common failure mode (9 of 15 failures).
Seven of eight new insulators that failed at FM1 had ultimate stress values ranging from 64.85 to 88.04 MPa (9.41 to 12.77 ksi), with an average of 74.12 MPa (10.75 ksi). Retired insulators that failed at FM1 (two cases) presented maximum stress values of 39.59 and 51.98 MPa (5.74 and 7.54 ksi). The most common failure mode for retired insulators was FM2 (three cases), with stress values from 10.73 to 38.22 MPa (1.56 to 5.54 ksi). One retired insulator failed at 21.29 MPa (3.09 ksi), and it was the only case of failure mode FM4. The failure mode FM3 was presented in one new insulator and one retired insulator, with maximum stress values of 53.91 and 36.21 MPa (7.82 and 5.25 ksi), respectively. Regarding halted loading insulators (one retired and three new), the maximum provided stress values varied from 62.78 to 69.50 MPa (9.11 to 10.08 ksi). The new insulator maximum stress values in this research were in the range of the stress values reported by Gökçe et al. [17], based on the quasi-static cyclic testing of post insulators, as presented in Table 3. For reference purposes, the Brazilian split-tension average reported by Moustafa and Mosalam [16] is included in this table.
Collectively, these results indicate that new insulators typically fail more under higher stress values than retired ones, following a predictable failure mode that is in line with the classical solid mechanics theory. Conversely, retired insulators tend to fail at lower stress values, demonstrating a variety of failure modes. These findings clearly indicate that even with insulators seemingly in good condition and without any visible signs of external damage, there is a significant decline in strength once they have been in service. This highlights a crucial area for further research, particularly regarding the development of deterioration curves for insulators under different service conditions. A deeper understanding of the rate and nature of insulator strength degradation over time would be instrumental in predicting their service life and planning for their effective maintenance or replacement.
Moreover, these results underscore the necessity of considering the additional stresses introduced to the insulator by the bracket in differing orientations when designing these components. This suggests a need for a more dynamic evaluation system that includes an assessment of the maximum expected stresses in the loading environment. This, in turn, would facilitate more informed and effective design strategies, enhancing the insulators’ resilience and longevity in service and raising the overall robustness and reliability of the systems in which they are deployed.

4. Conclusions

This paper presents an experimental evaluation of the performance of porcelain insulators in contact wire registration assemblies (CRWA) for railroad applications. Laboratory testing was conducted on new and retired porcelain insulators, delivering critical data regarding their structural performances and failure modes. The experimental procedures of this study included two types of static tests. The individual insulators underwent direct tension tests, as well as 45° tests, which had the insulator in the full CWRA in a novel testing setup. Here, insulator performance was evaluated with multiple drop bracket positions to represent possible field installations. The results indicated that while aging does not influence the resistance of the insulator in tension tests, it does reduce the structural capacity of insulators in the CWRA. Understanding the effects and manifestations of aging on insulators would offer illuminative insights to aid in the maintenance and replacement decision-making processes.
Another key implication of this work is the role of the drop bracket position on the registration tube in dictating the overall load–strain behavior and failure mode of the insulator assembly. This necessitates its consideration in the design phase of insulator installation, a variable that is not currently accounted for. This implies a need for the development of dynamic assessment instruments that account for varying loading environments and the maximum projected stresses during operation. Doing so would enhance insulator designs’ resilience and reliability, thus bolstering the performance of the overall systems where they are deployed.
Future research should expand upon the findings to include material testing, such as scanning electron microscopy, hardness testing, and compression testing of the porcelain; robust finite element studies of the CWRA assembly; and dynamic testing of the full CWRA setup, including the steady arm connecting to the vertical bracket in the field. Furthermore, all research should be extended to other insulator types, mainly other insulators for different supply voltages and polymeric insulators, due to their prevalence in the field. Current work enables the use of either insulator type without accounting for performance differences in the design phase. This research will further our understanding of insulator performance under varying conditions, thereby supporting the design of more resilient power transmission and distribution systems.

Author Contributions

The authors confirm their contribution to the paper as follows: study conception and design: A.H.; experimental data collection: A.H. and P.A.-B.; analysis and interpretation of results: A.H. and P.A.-B.; draft manuscript preparation: P.A.-B. and A.H. All authors have read and agreed to the published version of the manuscript.

Funding

This research was funded by the Connecticut Department of Transportation, project No. 173-184. CTDOT assumes no responsibility for the work performed by UCONN or its contractor(s). This paper is based upon publicly supported research and is copyrighted. It may be reproduced in part or in full, but it is requested that there be customary crediting of the source. This paper does not constitute a standard, specification, or regulation. The contents of this paper reflect the views of the authors, who are responsible for the facts and the accuracy of the data presented herein. The opinions, findings, and conclusions expressed in the paper are those of the authors and do not necessarily reflect the views of the Connecticut Department of Transportation or University of Connecticut.

Data Availability Statement

The data that support the findings of this study are available from the corresponding author upon reasonable request.

Acknowledgments

The authors would like to thank Jay Young and Mena Shehata of the Connecticut Department of Transportation, Luis Ortiz, Robert Woodhouse and Timothy Holland of AECOM, and William Lockery of Metro-North Railroad. The contributions of several UConn graduate students in the experiemtnal testing are acknowledged. Pablo Agüero-Barrantes acknowledges the support provided by the University of Costa Rica and LanammeUCR for his doctoral studies.

Conflicts of Interest

The authors declare no conflicts of interest.

References

  1. Gorur, R.S.; Cherney, E.A.; Burnham, J.T. Outdoor Insulators; Ravi, S., Ed.; Gorur Inc.: Phoenix, AZ, USA, 1999. [Google Scholar]
  2. Macey, R.E.; Vosloo, W.L.; Tourreil, C. The Practical Guide to Outdoor High Voltage Insulators; Crown Publications: New York, NY, USA, 2004. [Google Scholar]
  3. National Insulator Association. Available online: https://www.nia.org/ (accessed on 28 July 2023).
  4. Costea, M.; Baran, I. A comparative analysis of classical and composite insulators behavior. Univ. Politeh. Buchar. Sci. Bull. Ser. C Electr. Eng. 2012, 74, 147–154. [Google Scholar]
  5. Verma, A.R.; Reddy, B.S. Aging studies on polymeric insulators under DC stress with controlled climatic conditions. Polym. Test. 2018, 68, 185–192. [Google Scholar] [CrossRef]
  6. Venkataraman, S.; Gunasekaran, B. Case Study on Using Different Insulating Materials for Indian Railways Network, Performance Analysis of in-Service Composite Insulators & Recommendations for the Future. In Proceedings of the 2019 International Conference on High Voltage Engineering and Technology (ICHVET), Hyderabad, India, 7–8 February 2019; IEEE: New York, NY, USA, 2019; pp. 1–5. [Google Scholar]
  7. Verma, A.R.; Reddy, B.S. Interpretation of surface degradation on polymeric insulators. Eng. Fail. Anal. 2019, 95, 214–225. [Google Scholar] [CrossRef]
  8. Gao, Y.; Liang, X.; Bao, W.; Wu, C.; Li, S. Failure analysis of a field brittle fracture composite insulator: Characterisation by X-ray photoelectron spectroscopy analysis. High Volt. 2019, 4, 89–96. [Google Scholar] [CrossRef]
  9. Halloum, M.; Reddy, B.S. Investigations on the Failure of In-Service 400 kV Composite Insulator. IEEE Trans. Dielectr. Electr. Insul. 2023, 30, 2769–2778. [Google Scholar] [CrossRef]
  10. Ogbonna, V.E.; Popoola, P.I.; Popoola, O.M.; Adeosun, S.O. A comparative study on the failure analysis of field failed high voltage composite insulator core rods and recommendation of composite insulators: A review. Eng. Fail. Anal. 2022, 138, 106369. [Google Scholar] [CrossRef]
  11. Nagaraj, H.P.; Ravi, K.N.; Vasudev, N. Analysis of Brittle Fracture of Composite Insulators by Using Finite Element Technique. In Proceedings of the 2019 International Conference on High Voltage Engineering and Technology (ICHVET), Hyderabad, India, 7–8 February 2019; IEEE: New York, NY, USA, 2019; pp. 1–5. [Google Scholar]
  12. Cherney, E.A. Long-term mechanical life testing of polymeric post insulators for distribution and a comparison to porcelain. IEEE Trans. Power Del. 1988, 3, 1141–1145. [Google Scholar] [CrossRef]
  13. Takhirov, S.; Fenves, G.L.; Fujisaki, E. Seismic Qualification and Fragility Testing of Line Break 550-kV Disconnect Switches; Pacific Earthquake Engineering Research Center: Berkeley, CA, USA, 2005. [Google Scholar]
  14. Reinhorn, A.M.; Oikonomou, K.; Roh, H.; Schiff, A.; Kempner, J. Modeling and Seismic Performance Evaluation of High Voltage Transformers and Bushings; MCEER: Las Vegas, NV, USA, 2011. [Google Scholar]
  15. Moustafa, M.A.; Mosalam, K.M. Finite element modeling and assessment of seismic response of electrical substations porcelain post insulators. Soil Dyn. Earthq. Eng. 2021, 150, 106895. [Google Scholar] [CrossRef]
  16. Moustafa, M.A.; Mosalam, K.M. Structural performance of porcelain and polymer post insulators in high voltage electrical switches. J. Perform. Constr. Facil. 2016, 30, 04016002. [Google Scholar] [CrossRef]
  17. Gökçe, T.; Yüksel, E.; Orakdöğen, E. Failure mode investigation for high voltage porcelain insulators. In Proceedings of the 16th European Conference on Earthquake Engineering, Paper, Thessaloniki, Greece, 18–21 June 2018. [Google Scholar]
  18. Khalvati, A.H.; Hosseini, M.; Mohammadpour, S. Seismic behavior of 63kV and 132kV substation post insulators with flexible conductors, an experimental approach. J. Seismol. Earthq. Eng. 2011, 13, 77–92. [Google Scholar]
  19. Mohammadpour, S.; Hosseini, M. Experimental system identification of a 63kV substation post insulator and the development of its fragility curves by dynamic finite element analyses. Earthq. Spectra 2017, 33, 1149–1172. [Google Scholar] [CrossRef]
  20. Reddy, B.S.; Ramamurthy, P.C. Analysis of in-service composite insulators used in overhead railway traction. Eng. Fail. Anal. 2020, 108, 104227. [Google Scholar] [CrossRef]
  21. Muangpratoom, P.; Khonchaiyaphum, I.; Vittayakorn, W. Improvement of the Electrical Performance of Outdoor Porcelain Insulators by Utilization of a Novel Nano-TiO2 Coating for Application in Railway Electrification Systems. Energies 2023, 16, 561. [Google Scholar] [CrossRef]
  22. Wang, Z.; Liu, X.; Peng, H.; Zheng, L.; Gao, J.; Bao, Y. Railway Insulator Detection Based on Adaptive Cascaded Convolutional Neural Network; IEEE Access: New York, NY, USA, 2021; Volume 9, pp. 115676–115686. [Google Scholar]
  23. VT/OCS—Overhead Contact Systems IEEE Recommended Practice for Terminology Used for Direct Current Electric Transit Overhead Contact Systems. 2019. Available online: https://standards.ieee.org/ieee/1791/5894/ (accessed on 1 August 2024).
  24. ANSI/NEMA C29.9-2017; Wet-Process Porcelain Insulators—Apparatus, Post Type. NEMA: National Electrical Manufacturers Association: Virginia, VA, USA, 2017. Available online: https://webstore.ansi.org/standards/nema/ansinemac292017-1669325 (accessed on 1 August 2024).
  25. ANSI/NEMA C29.1-2018; Test Methods for Electrical Power Insulators. NEMA: National Electrical Manufacturers Association: Virginia, VA, USA, 2018. Available online: https://webstore.ansi.org/standards/nema/ansinemac292018 (accessed on 1 August 2024).
  26. Beer, F.; Johnston, E.; DeWolf, J.; Mazurek, D. Mechanics of Materials; Mc Graw Hill: New York, NY, USA, 2020. [Google Scholar]
Figure 1. Overhead railway power line attached to its registration arm, which is connected to a contact wire registration assembly (CWRA), including a 23 kV porcelain insulator.
Infrastructures 09 00138 g001
Figure 2. Insulator full 3D scan showing relevant geometries, including a (a) standard 6-shed, (b) varying diameter 7-shed, and (c) 7-shed.
Infrastructures 09 00138 g002
Figure 3. Fully assembled tension testing apparatus shown for a post insulator.
Infrastructures 09 00138 g003
Figure 4. View of test frame in the laboratory.
Infrastructures 09 00138 g004
Figure 5. Vertical bracket positions along the 460 mm (18 in) long registration tube: (a) centered, (b) +152 mm offset (+6 in), and (c) −152 mm offset (−6 in).
Infrastructures 09 00138 g005
Figure 6. Representative image of the pullout failure mode from tension testing for the new insulator, showing the (a) insulator body and (b) corresponding top cap.
Infrastructures 09 00138 g006
Figure 7. Views of retired insulator failure following tensile testing, showing the fractures within the porcelain on (a) the insulator body and (b) in the cap.
Infrastructures 09 00138 g007
Figure 8. Load–displacement results for insulators tested under tension.
Infrastructures 09 00138 g008
Figure 9. CWRA insulator failure modes including description of failure in left column, cad drawing showing location of failure with red line, and rightmost column showing sample images of failure.
Infrastructures 09 00138 g009
Figure 10. Representative views of the rotation of the load cell for different bracket offsets, including (a) −152 mm (−6 in), (b) 0 mm (0 in), and (c) +152 mm (+6 in). All images were taken at comparable load values of F ≈ 5.78 kN (1300 lb).
Infrastructures 09 00138 g010
Figure 11. CWRA testing results.
Infrastructures 09 00138 g011
Figure 12. Insulator internal forces calculation.
Infrastructures 09 00138 g012
Table 1. Ultimate tensile strength of insulator test specimens.
Test IDInsulator ConditionMax Load (kN)Max Load (kip)
TS1New109.024.5
TS2New104.523.5
TS3New111.225.0
TS4Retired117.926.5
Table 2. CWRA testing insulator results.
Test IDInsulator ConditionGeometry (Sheds)Offset (mm)Fmax (kN)Fmax (lb)Failure Modefmax (MPa)fmax (ksi)
N 6 0New606.851540.0FM353.917.82
N 6 0New606.221398.3NA62.939.13
R 6 0Retired604.01901.6FM238.225.54
R 7V 0Retired7V02.94662.0FM210.731.56
R 7 0Retired708.031806.4FM212.451.81
R 7V 0Retired7V08.781974.2NA67.589.80
N_6_+6New6+15213.282985.0FM188.0412.77
N 6 +6New6+15213.503036.1FM170.9010.28
N_6_+6New6+1529.092044.0NA69.5010.08
N 6 +6New6+1528.952012.0NA62.789.11
R_6_+6Retired6+1525.661273.0FM421.293.09
R 6 +6Retired6+15210.962465.0FM151.987.54
N_6_−6New6−1526.821533.0FM178.8111.43
N 6 −6New6−1526.291415.0FM171.8710.42
N_6_−6New6−1526.951562.0FM171.1310.32
N 6 −6New6−1526.031356.0FM164.859.41
N_6_−6New6−1526.791527.0FM173.3310.64
R 6 −6Retired6−1525.101147.0FM336.215.25
R_6_−6Retired6−1525.451225.0FM139.595.74
Table 3. Porcelain tensile strength values.
Ref.Value (ksi)Comment
[17]7.92Quasi-static cyclic test
[17]13.11Quasi-static cyclic test
[16]7.69Brazilian split-tension test 1
1 Individual specimen results provided.
Disclaimer/Publisher’s Note: The statements, opinions and data contained in all publications are solely those of the individual author(s) and contributor(s) and not of MDPI and/or the editor(s). MDPI and/or the editor(s) disclaim responsibility for any injury to people or property resulting from any ideas, methods, instructions or products referred to in the content.