Abstract
We investigated the effects of irradiation beam conditions on the performance degradation of silicon and triple-junction solar cells for use in space. The fluence rates of electron and proton beams were varied. Degradation did not depend on the fluence rate of protons for both cells. A higher fluence rate of electrons caused greater degradation of the Si cell, but the dependence was due to the temperature increase during irradiation. Two beam-area expansion methods, defocusing and scanning, were examined for proton irradiation of various energies (50 keV–10 MeV). In comparing the output degradation from irradiation with defocused and scanned proton beams, no significant difference in degradation was found for any proton energy. We plan to reflect these findings into ISO standard of irradiation test method of space solar cells.
Keywords:
solar cell; space application; irradiation test; beam condition; degradation; standardization; ISO 1. Introduction
Most spacecraft are powered by electricity generated by photovoltaic cells mounted on solar panels. In space, solar cells are exposed to radiation environment, and electrons and protons contained in the environment degrade them and reduce their power output. Electrons and protons are relatively light particles that easily penetrate a solar cell, which is generally made of single-crystal semiconductor material. These electrons and protons create crystal defects in the material that form minority-carrier recombination centers or majority-carrier traps. The effect of these two types of defect states is to reduce the output power of a solar cell. Thus, radiation resistance is of the utmost importance to space solar cells.
To determine a material’s radiation resistance (i.e., the radiation degradation characteristics) irradiation tests need to be performed on the ground with electron and proton using accelerators. A ground test is mandatory because the obtained degradation characteristics are necessary to predict the degradation of generated power during a mission in space; therefore, it is essential for a test to reflect the actual degradation in space accurately.
Space solar cell irradiation tests are executed in various facilities by many organizations worldwide using their own test protocols. However, to ensure accurate degradation predictions, the test results must be identical regardless of the test procedure and facility. Additionally, investigating the radiation resistance of a new solar cell requires that test results are perfectly reproducible, so standardizing solar cell irradiation tests is crucial.
To this end, the Japan Aerospace Exploration Agency (JAXA), European Space Agency (ESA), National Aeronautics and Space Administration of the United States (NASA), and US Naval Research Laboratory (NRL) have been collaborating to standardize the irradiation test procedures for space solar cells [1]. As a result, an international standard (ISO) of irradiation test methods was published in 2005 and revised in 2015 [2]. However, no quantitative definition of irradiation test conditions is contained in the standard because the effects of conditions of electron/proton beam irradiation on testing had not clarified when the standard was published. Currently, each facility/organization performs solar cell irradiation tests under its own test conditions.
Our paper aims to provide information for standardizing radiation specifications for testing space solar cells. This study clarifies the effects of two typical irradiation beam conditions, fluence rate, and beam-area expansion technique, on a solar cell’s degradation for use in space.
2. Experimental
Two typical irradiation beam conditions were selected in this study, dose rate and beam-area expansion methods, for the following reasons: First, in the ground irradiation test, the dose rate is generally selected to complete the test within an acceptable duration. However, the rate of actual radiation exposure in space is several orders of magnitude lower than the rate for ground irradiation tests. A lower dose might be gentler for degradation because recovery of radiation damage can be expected [3]. Therefore, the dose rate employed for a ground test is likely to over-estimate degradation. Second, to secure a beam area for an objective solar cell, scanning with a focused spot beam is the usual technique in a ground irradiation test. On the other hand, radiation particles fall into a solar cell uniformly in space. In the case of scanning, intense particles in the focused beam spot are irradiated momentarily, which may induce greater degradation than a uniform defocus beam. Therefore, clarifying the potential difference in output degradation due to the difference of beam condition is the primary purpose of this study.
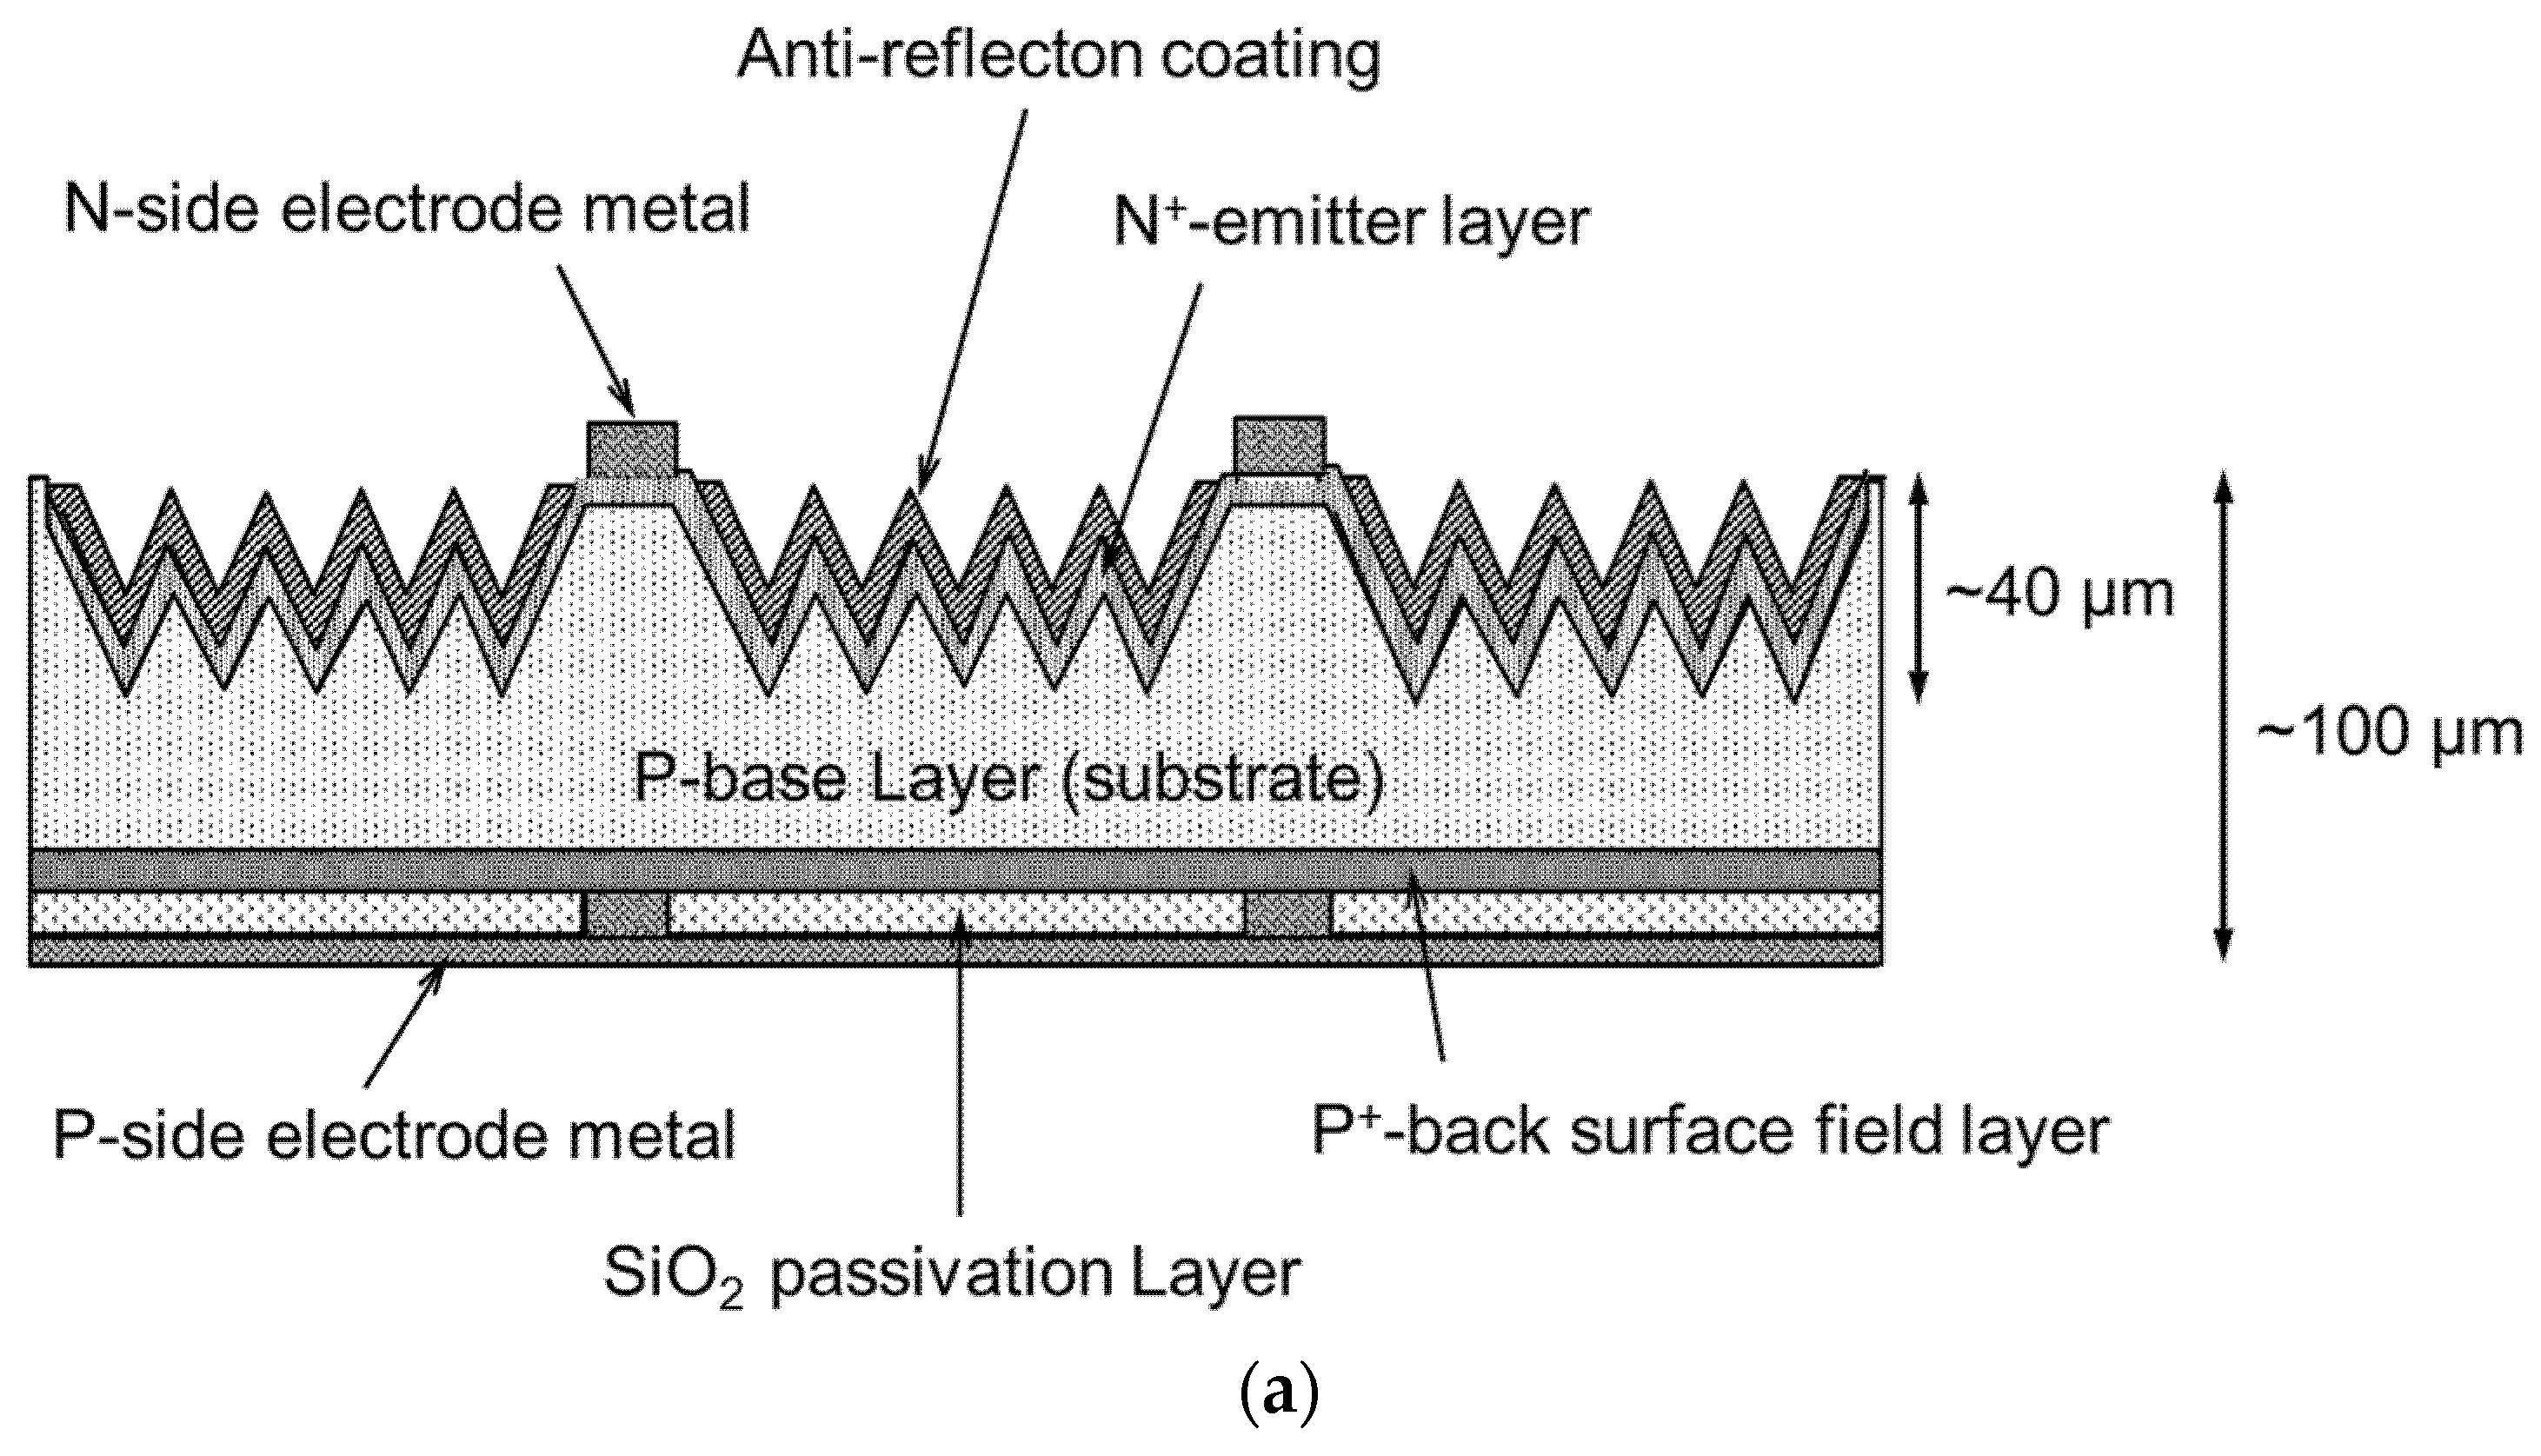
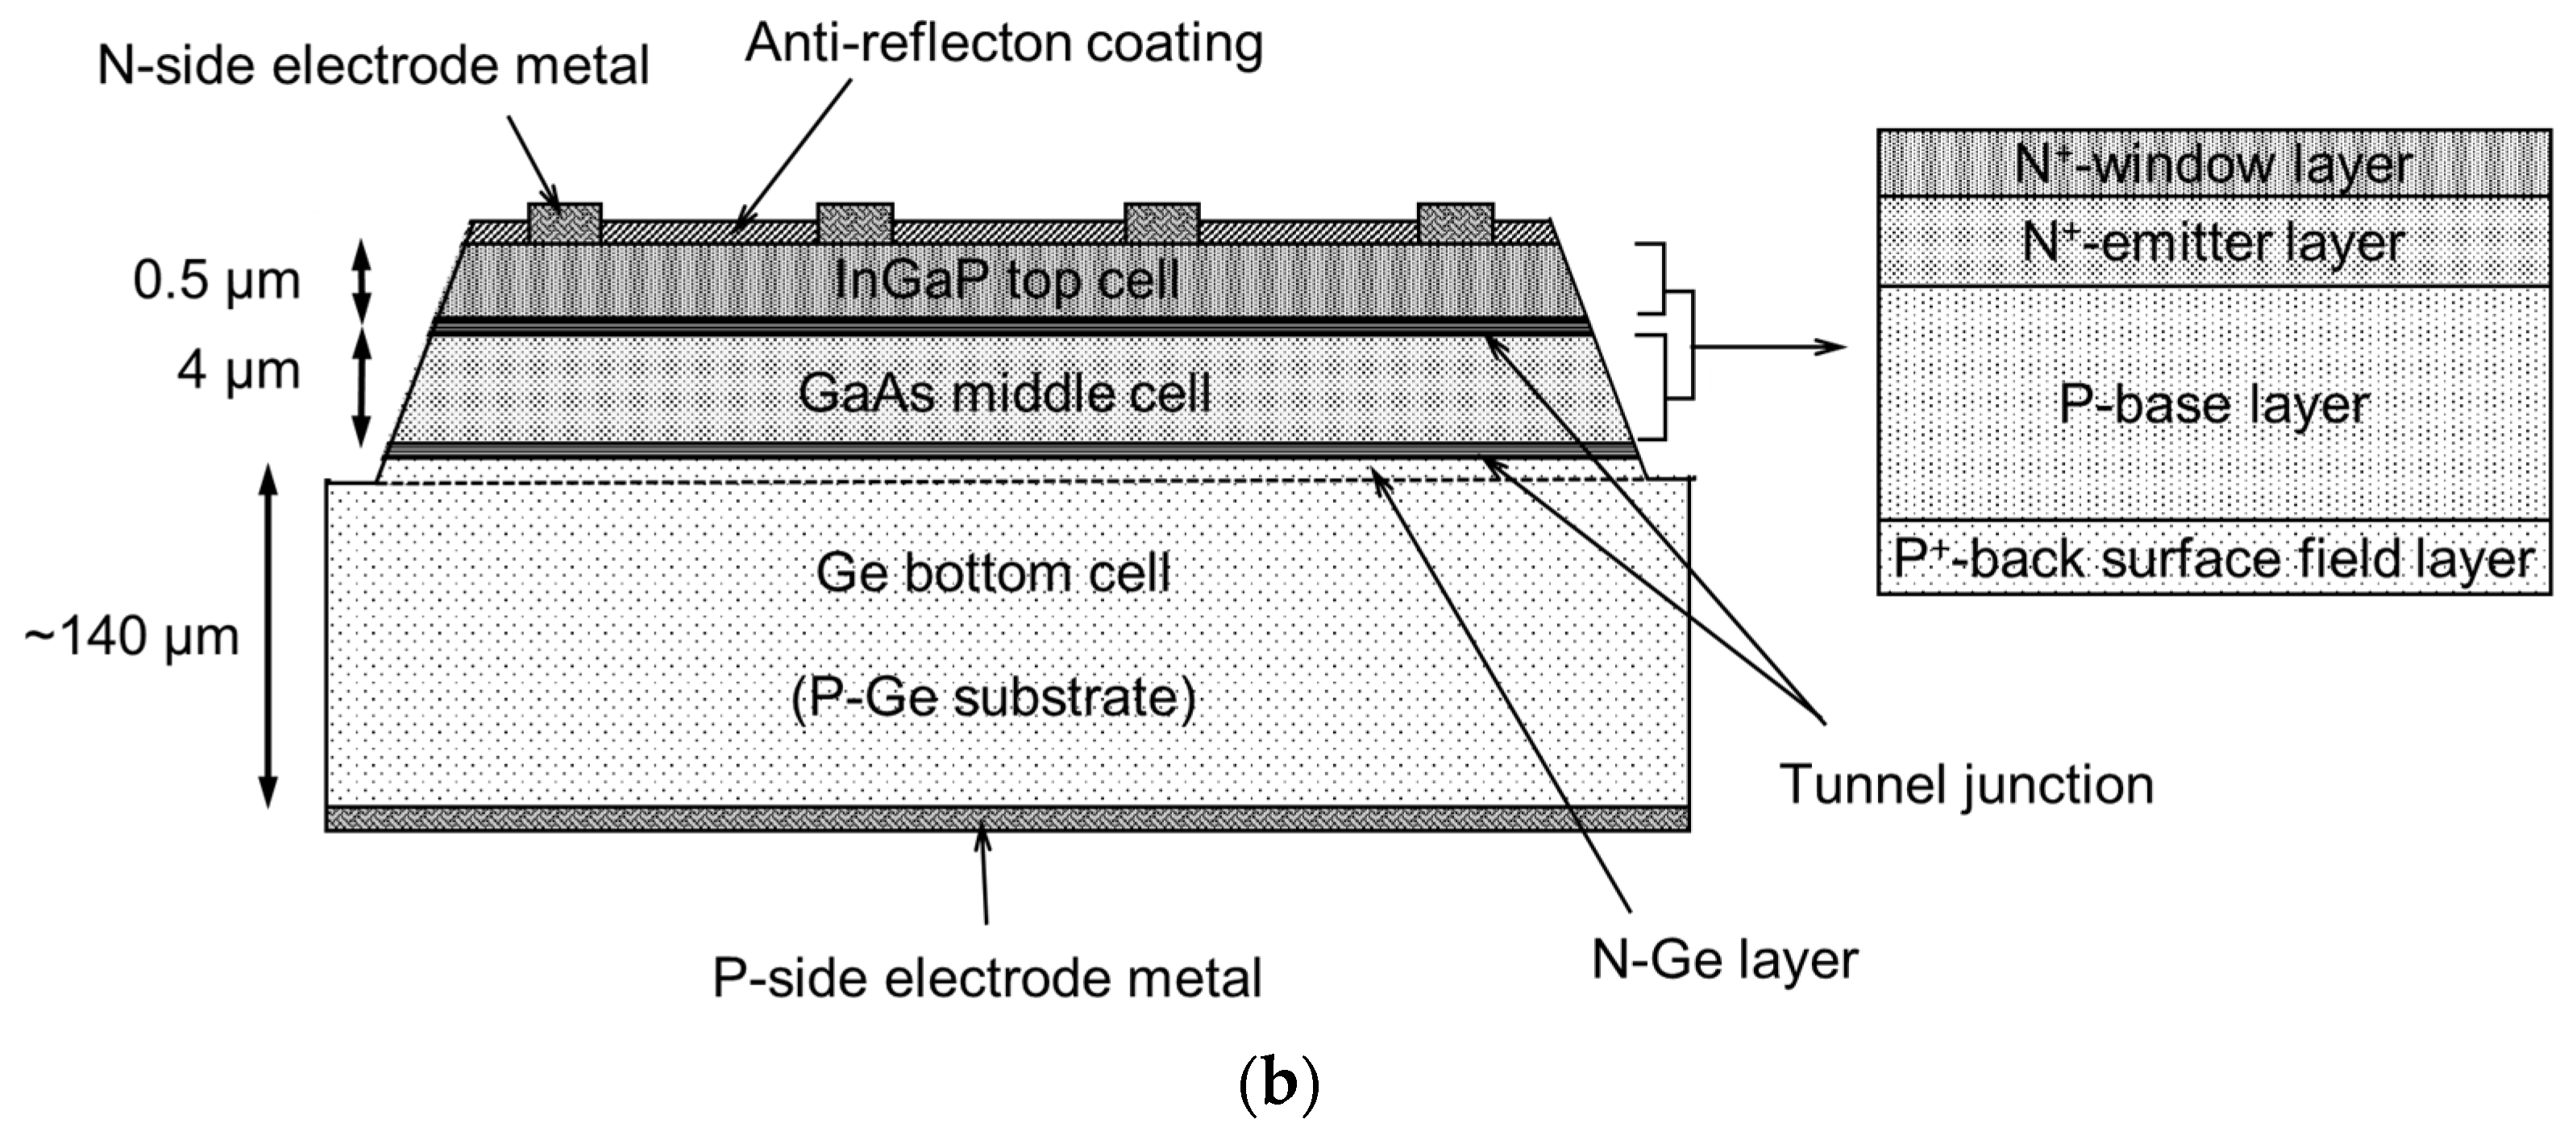
An InGaP/GaAs/Ge triple-junction (3J) space solar cell and a high-efficiency silicon (Si) space solar cell were used in this study, both made by SHARP Corporation. Figure 1 shows the schematic cross-section of the solar cells. The size of both cells was 2 cm × 2 cm. The typical efficiency of a 3J cell is 27%; for a Si cell, it is 17%.
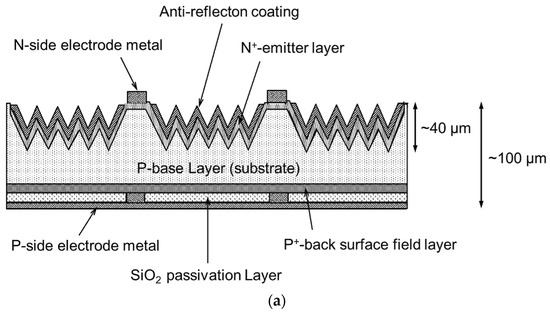
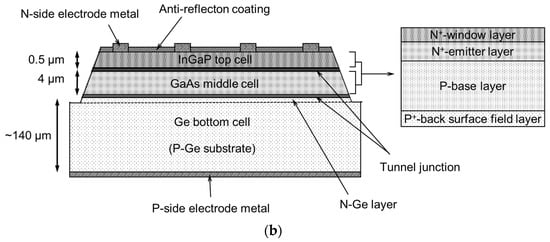
Figure 1.
Cross-section of (a) a high-efficiency silicon solar cell and (b) an InGaP/GaAs/Ge triple-junction solar cell. Note that the figures are not to scale.
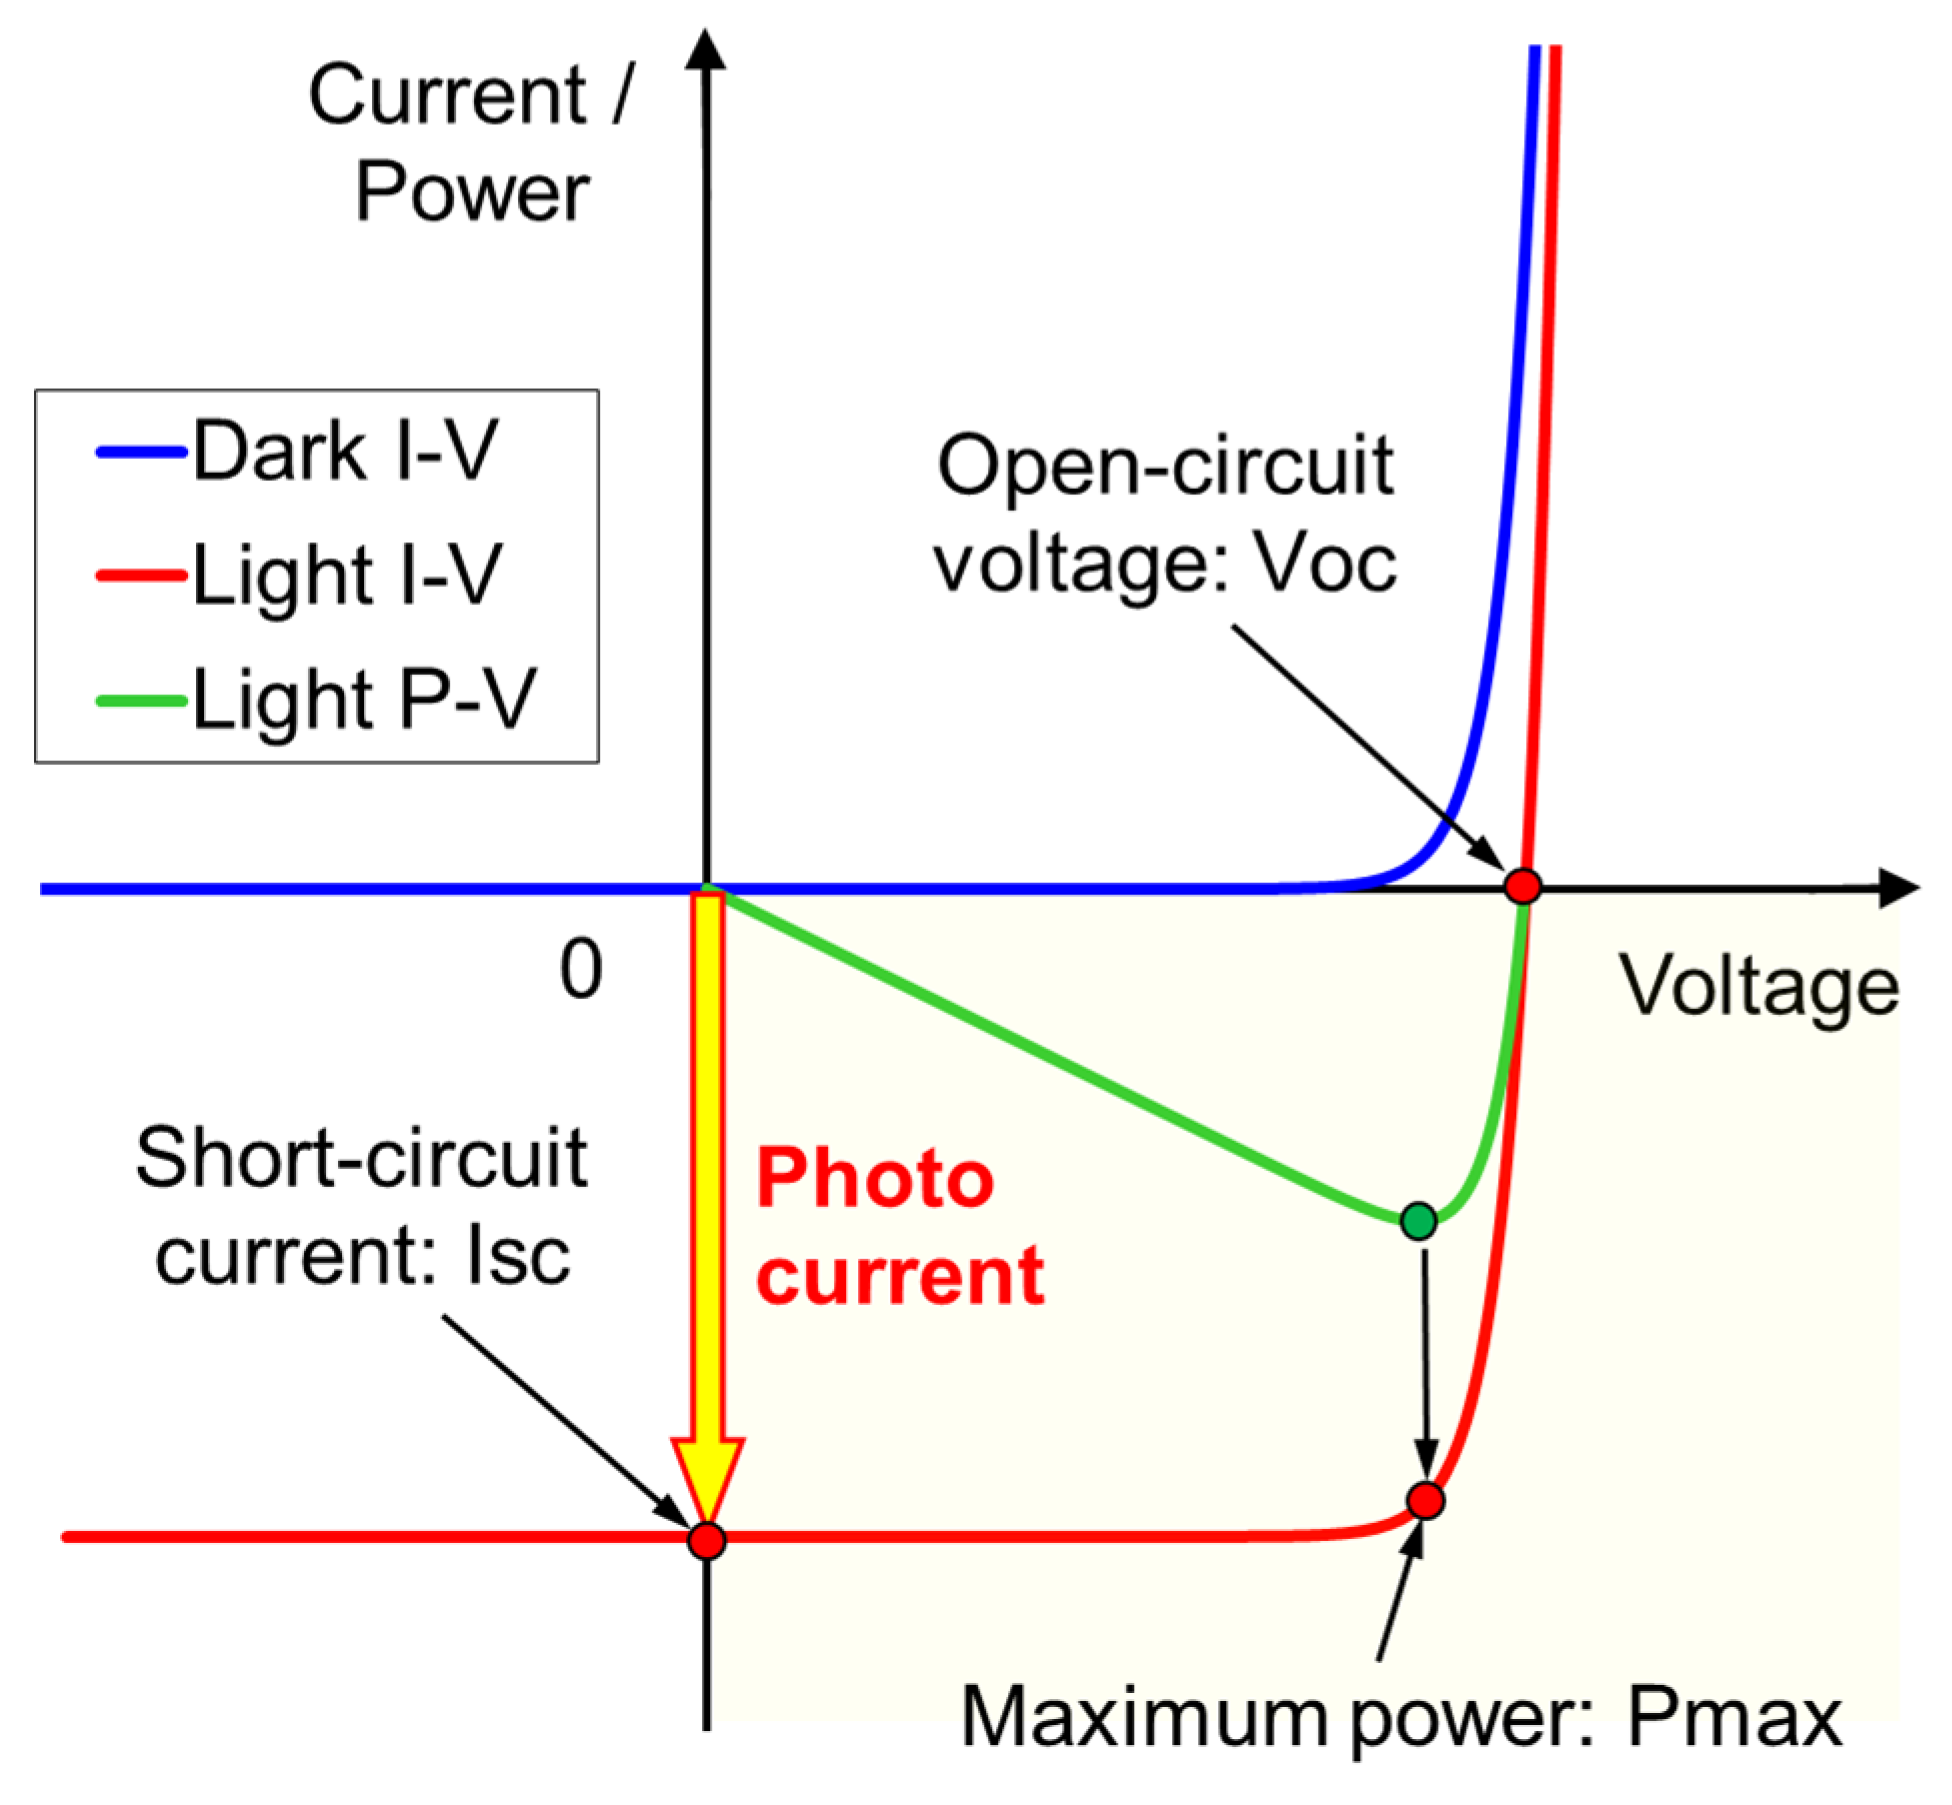
The irradiation experiments were carried out at the National Institute for Quantum and Radiological Science and Technology (QST) [4], Takasaki Lab, and the Wakasa Wan Energy Research Center (WERC) [5]. High-energy (10 MeV) proton irradiation was executed using the cyclotron accelerator at QST Takasaki. Low-energy (50–150 keV) proton irradiation was performed using the ion implanters at QST Takasaki and WERC. Electron irradiation was carried out using the Cockcroft–Walton accelerator at QST Takasaki. Current–voltage output characteristics of the solar cells under light illumination (LIV) before and after irradiation were measured at the Japan Aerospace Exploration Agency (JAXA), Tsukuba Space Center. The LIV measurement was made at 25 °C using a dual-source (xenon and halogen lamps) solar simulator with an Air Mass 0 (AM0) spectrum and light intensity equivalent to the Sun in space around the globe. Figure 2 explains the current-voltage characteristics of a solar cell, which is fundamentally a p–n junction diode and has the rectifying characteristic shown as “Dark I-V” in Figure 2. Once the solar cell is illuminated, a photocurrent is generated and the I-V curve shifts downward (“Light I-V”) since the direction of the photocurrent is the opposite to that of the injected current. Three typical output parameters, the short-circuit current (Isc), open-circuit voltage (Voc), and maximum power (Pmax), are indicated in the figure.
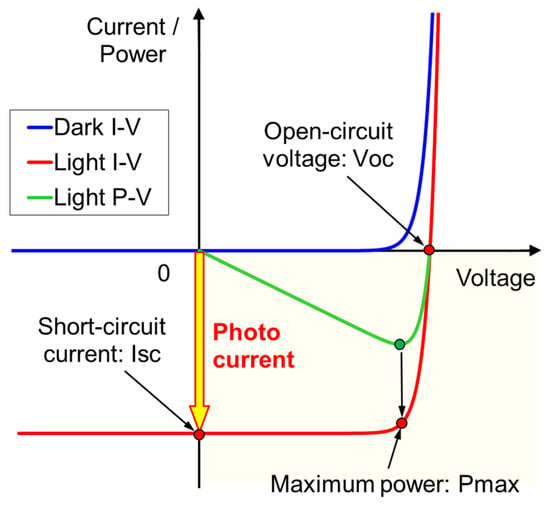
Figure 2.
A typical solar cell’s current-voltage characteristics in the dark (“Dark I-V”) and under illumination (“Light I-V”). Three typical output parameters are indicated: the short-circuit current (Isc), open-circuit voltage (Voc), and maximum power (Pmax).
We carried out two types of radiation experiments. First, we irradiated solar cells with electrons and protons to a specific fluence at different fluence rates. Second, we irradiated solar cells using defocused or scanned proton beams with various proton energies. The sample’s output performance was characterized before and after the irradiation tests, and degradation of the output was compared. Details of the experimental conditions are described in the following sections.
2.1. Fluence Rate
This investigation aims to clarify the effects of the dose rate by fluence (i.e., the fluence rate) on solar cell degradation. The adopted radiation particles are 10 MeV protons or 1 MeV electrons; both are regarded as the standard radiation particles for radiation resistance evaluation of a space solar cell. Since the particles’ energies are sufficiently high to pass through each of the solar cells, irradiation of the particles forms uniform damage throughout the entire device structures. Table 1 lists the beam conditions. The fluence rate was varied over two orders of magnitude in both the 10 MeV proton and 1 MeV electron irradiation experiments: in five levels for the proton beam and in four levels for the electrons. The samples were placed in air for electron irradiation and in a vacuum for proton one.

Table 1.
Beam conditions of high-energy proton and electron experiments for degradation dependence on fluence rate.
In addition, the effects of fluence rate with low-energy protons (50–150 keV) were examined for the 3J solar cell. A 3J cell has a stacked structure with an InGaP top cell, a GaAs middle cell, and a Ge bottom cell as shown in Figure 1b. Low energy protons stop in the cell, so radiation damage is localized around the Bragg peak of the protons. According to the TRIM simulation [3], 50, 100, and 150 keV protons stop in the InGaP top cell, around the interface between the InGaP top cell and GaAs middle cell, and in the GaAs middle-cell, respectively. Therefore, the effects of the damage may differ. Table 2 shows the beam conditions.

Table 2.
Beam conditions of low-energy proton experiment for degradation dependence on fluence rate.
2.2. Beam-Area Expansion Method
This examination determines the difference in solar cell degradation between the two beam-area expansion techniques, scanning and defocusing. Only proton was use in this examination because no electron accelerator capable of providing a defocused beam was available. High (10 MeV) and low (50–100 keV) energy levels were selected for the proton beams. Table 3 and Table 4 summarize these test conditions. In the case of the defocus beam of 10 MeV proton, a primary beam with a Gaussian distribution over a diameter of ~80 mm was uniformized using multipole magnets to form a rectangular exposure area up to 80 mm × 100 mm. This unique technique was developed at QST Takasaki [6,7,8].

Table 3.
Beam conditions of high-energy proton experiment for difference in degradation between scanned and defocused beams.

Table 4.
Beam conditions of low-energy proton experiment for difference in degradation between scanned and defocused beams.
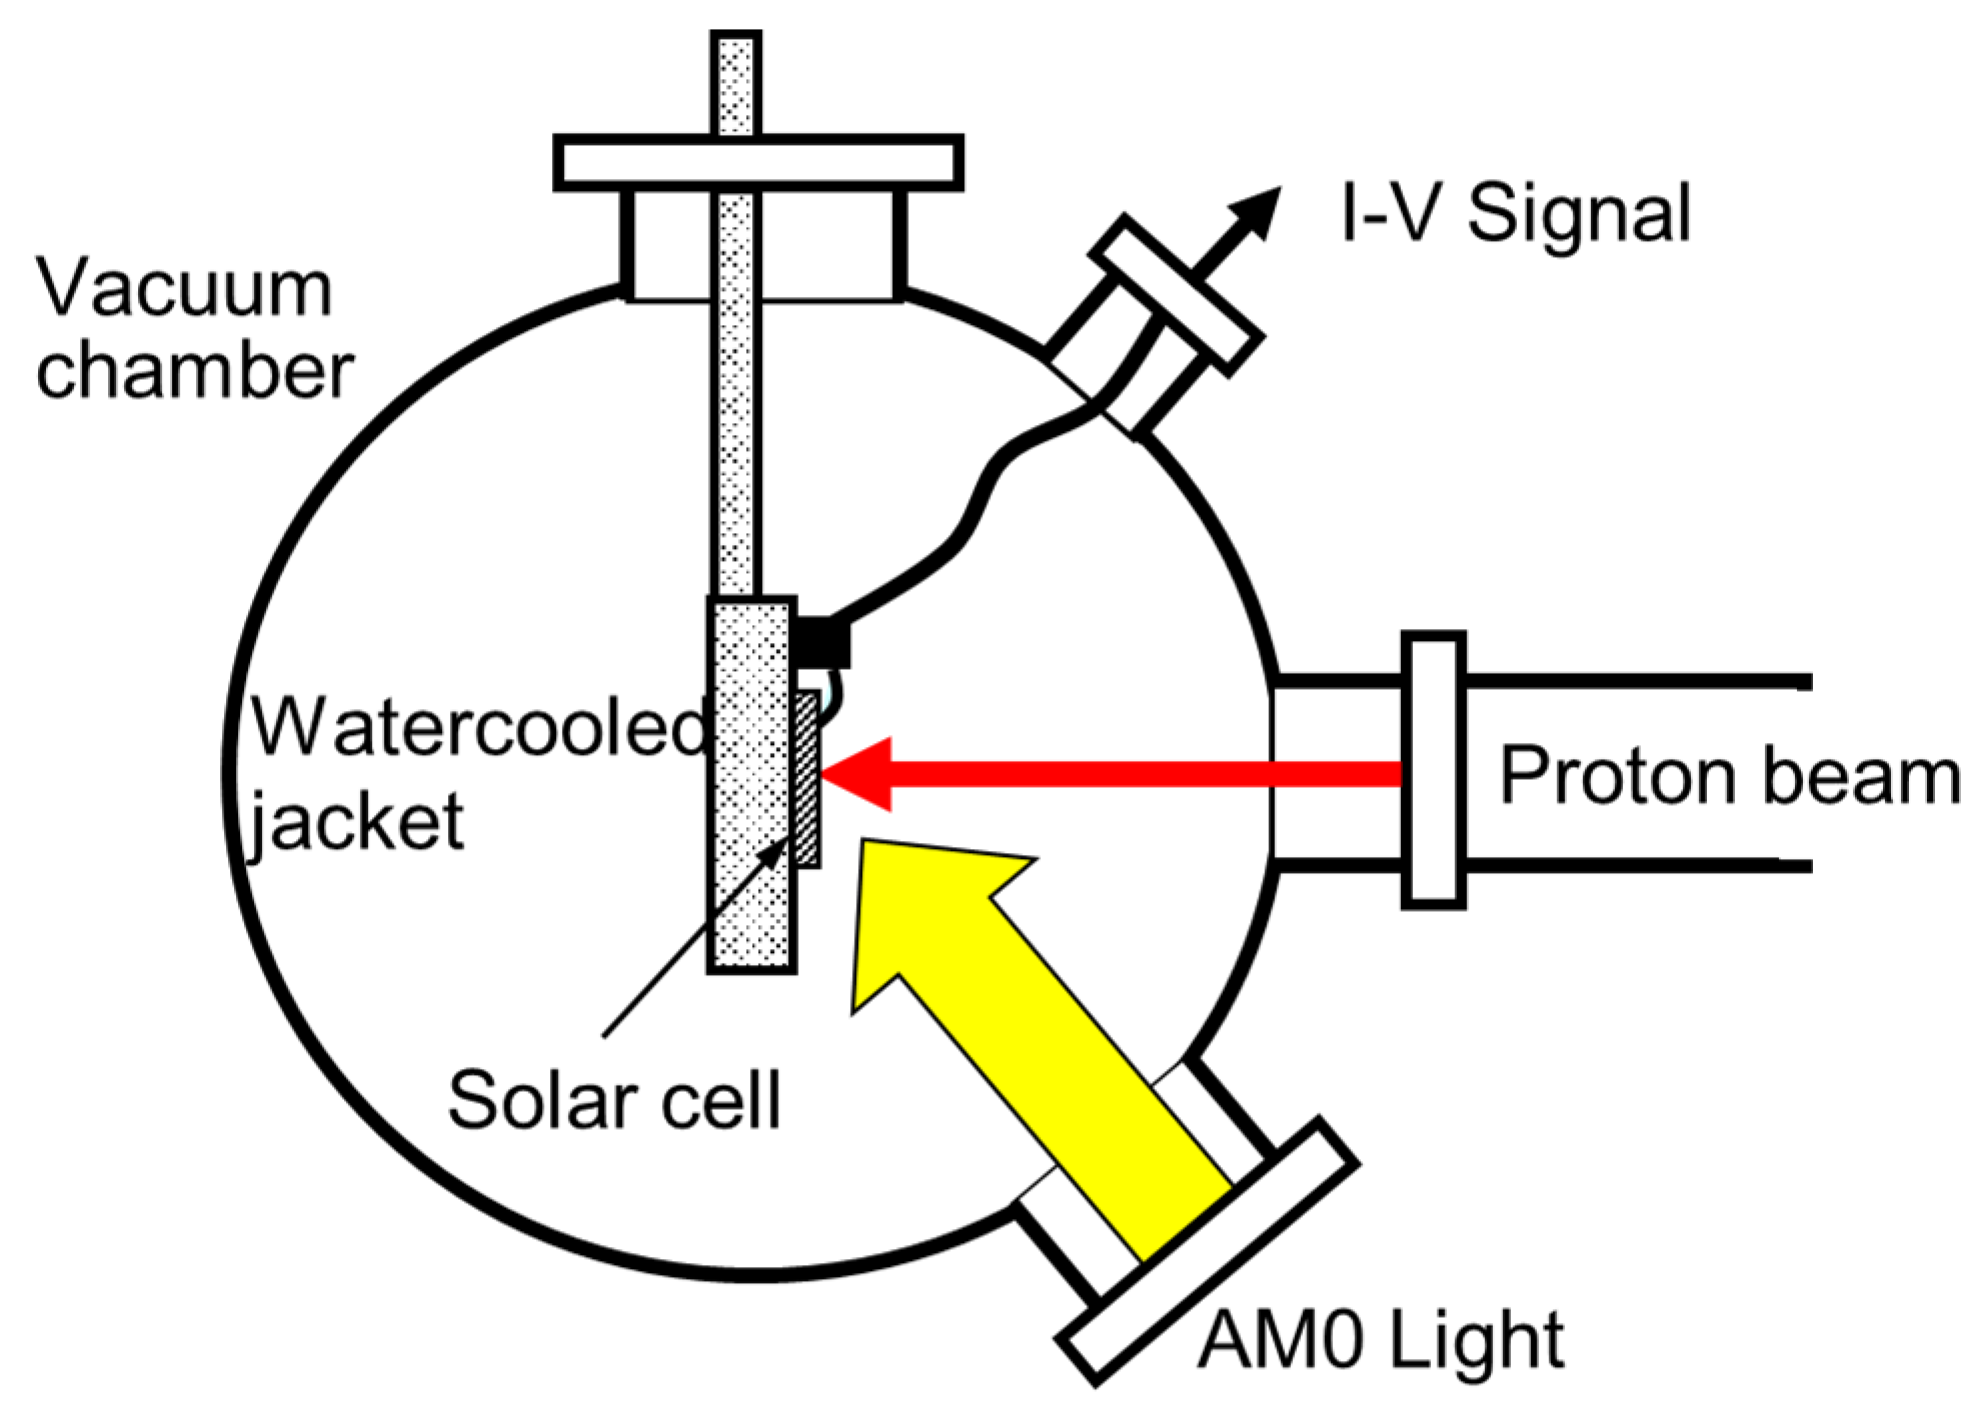
For the 10 MeV proton experiment, proton irradiation and LIV measurements were alternately implemented in an irradiation chamber. Irradiation was interrupted for each fluence step, and LIV measurements were made using a single-source (xenon lamp) AM0 solar simulator. Schematic top-view of the chamber is posted in Figure 3. This unique setup enables us to collect solar cell’s degradation characteristics from a single sample if the obtained data are properly corrected for sample temperature using the temperature coefficients of its output parameters.
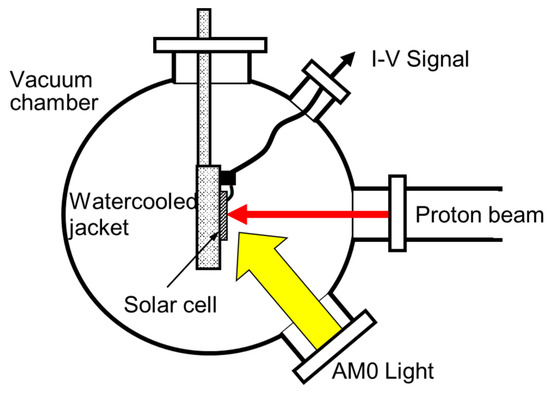
Figure 3.
Schematic top view of the 10 MeV-proton irradiation vacuum chamber. A test solar cell can be illuminated by simulated solar light (AM0) to measure output characteristics instantly.
For both the experiments, beam profiles were observed by using an alumina fluorescent plate right before the irradiations. We confirmed that the adopted scan frequencies and the beam spot sizes provided uniform proton exposure without voids on the entire beam area.
3. Results and Discussion
3.1. Fluence Rate
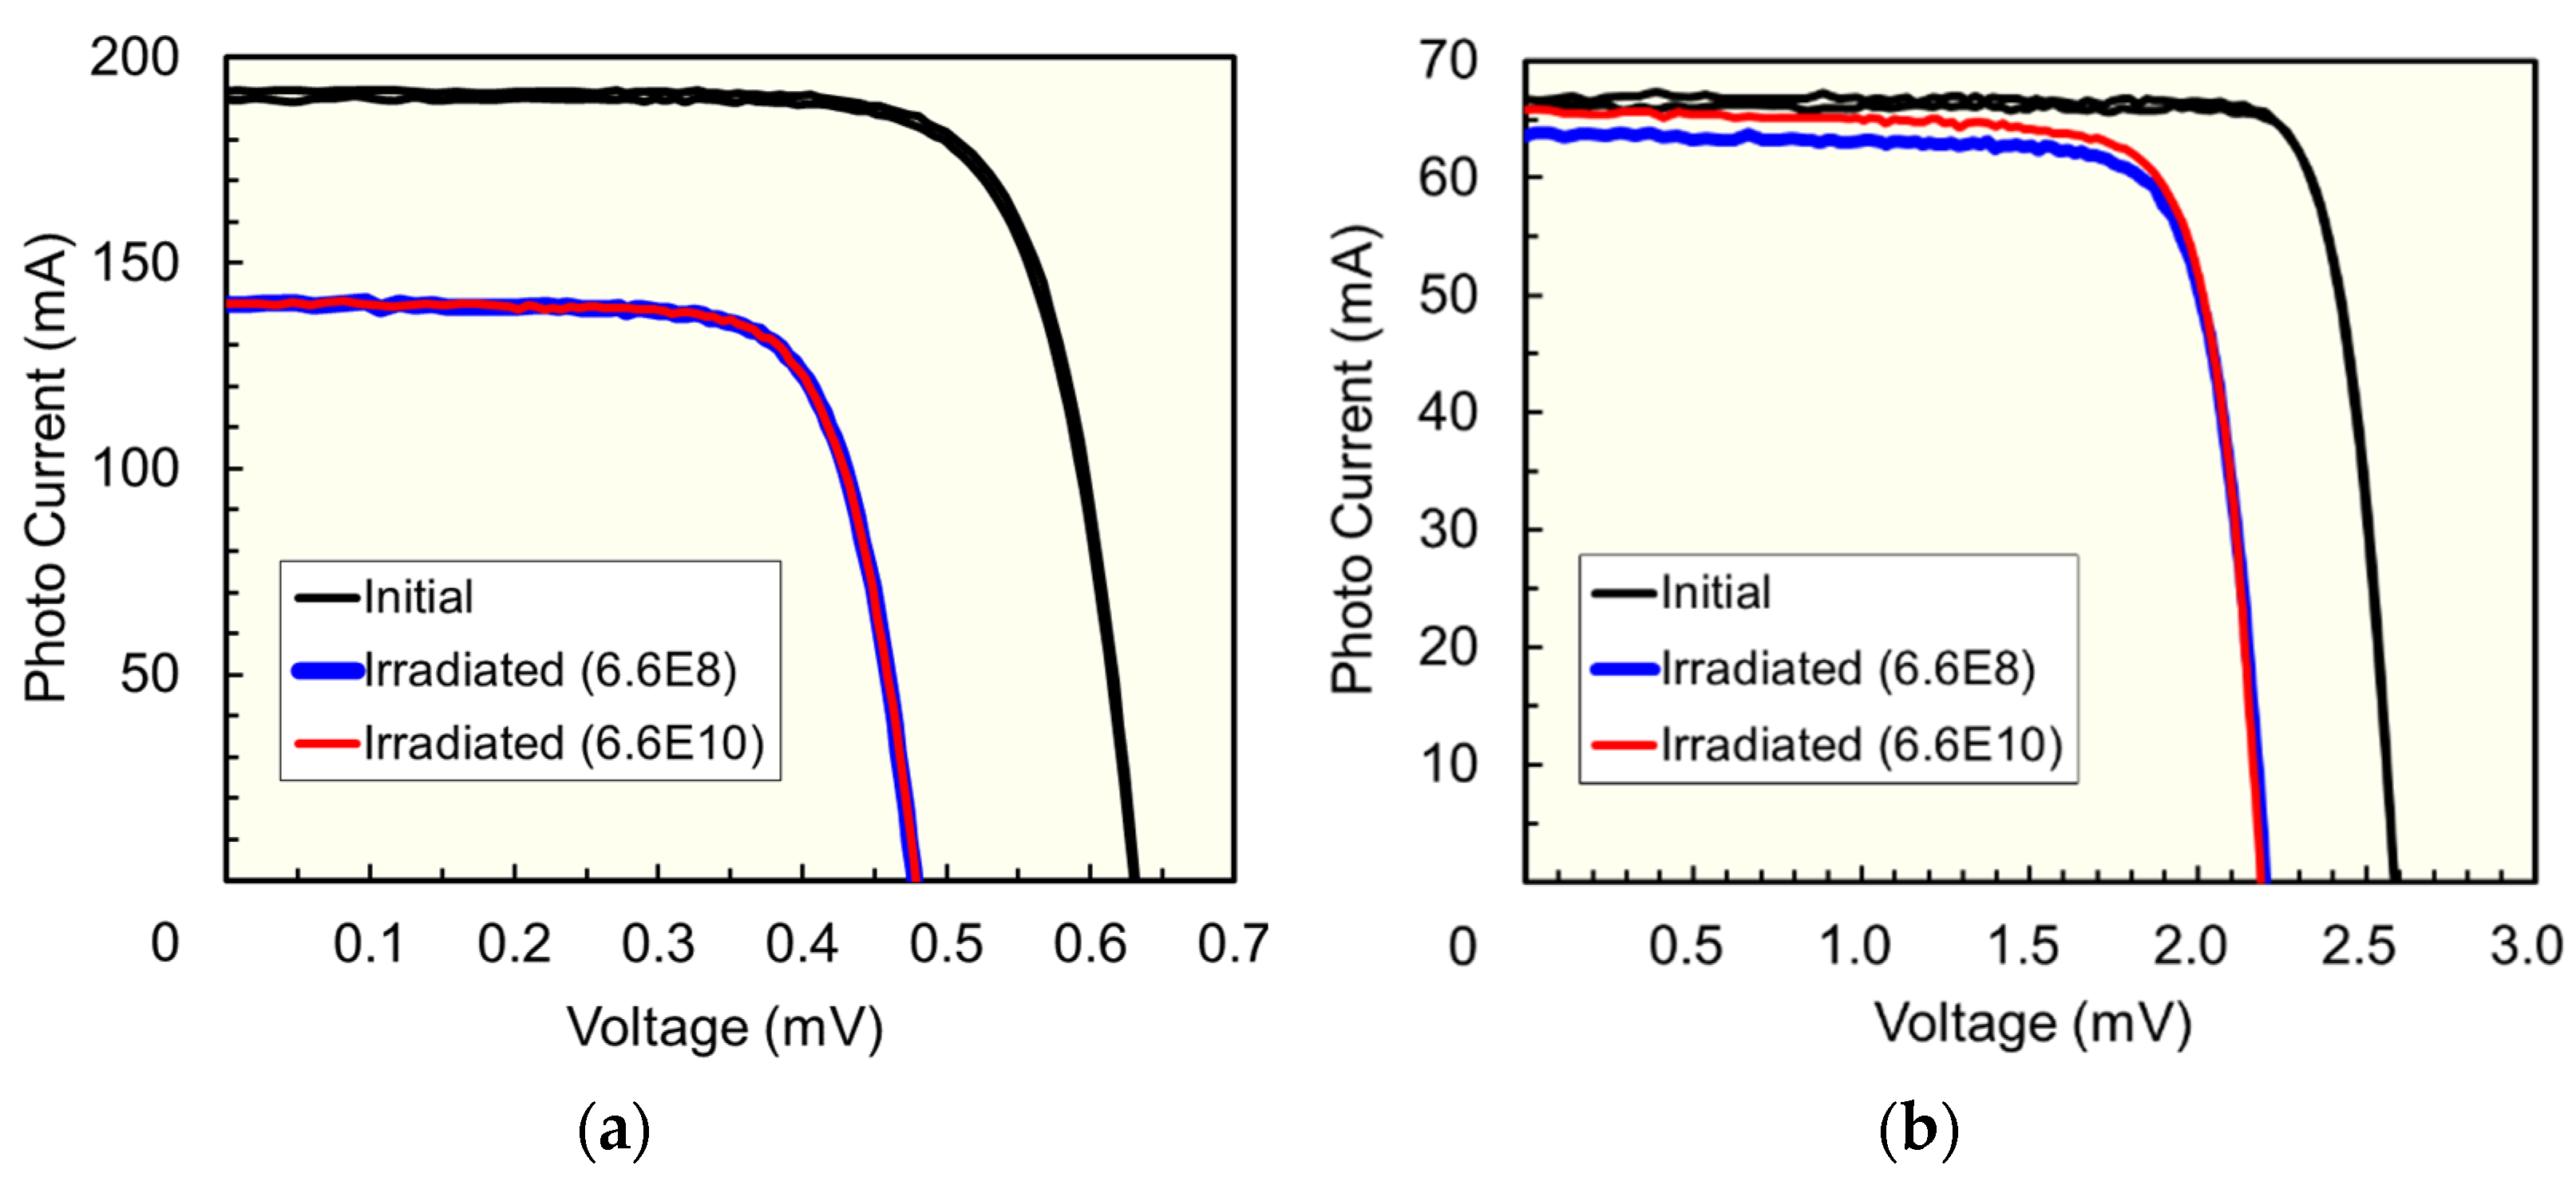
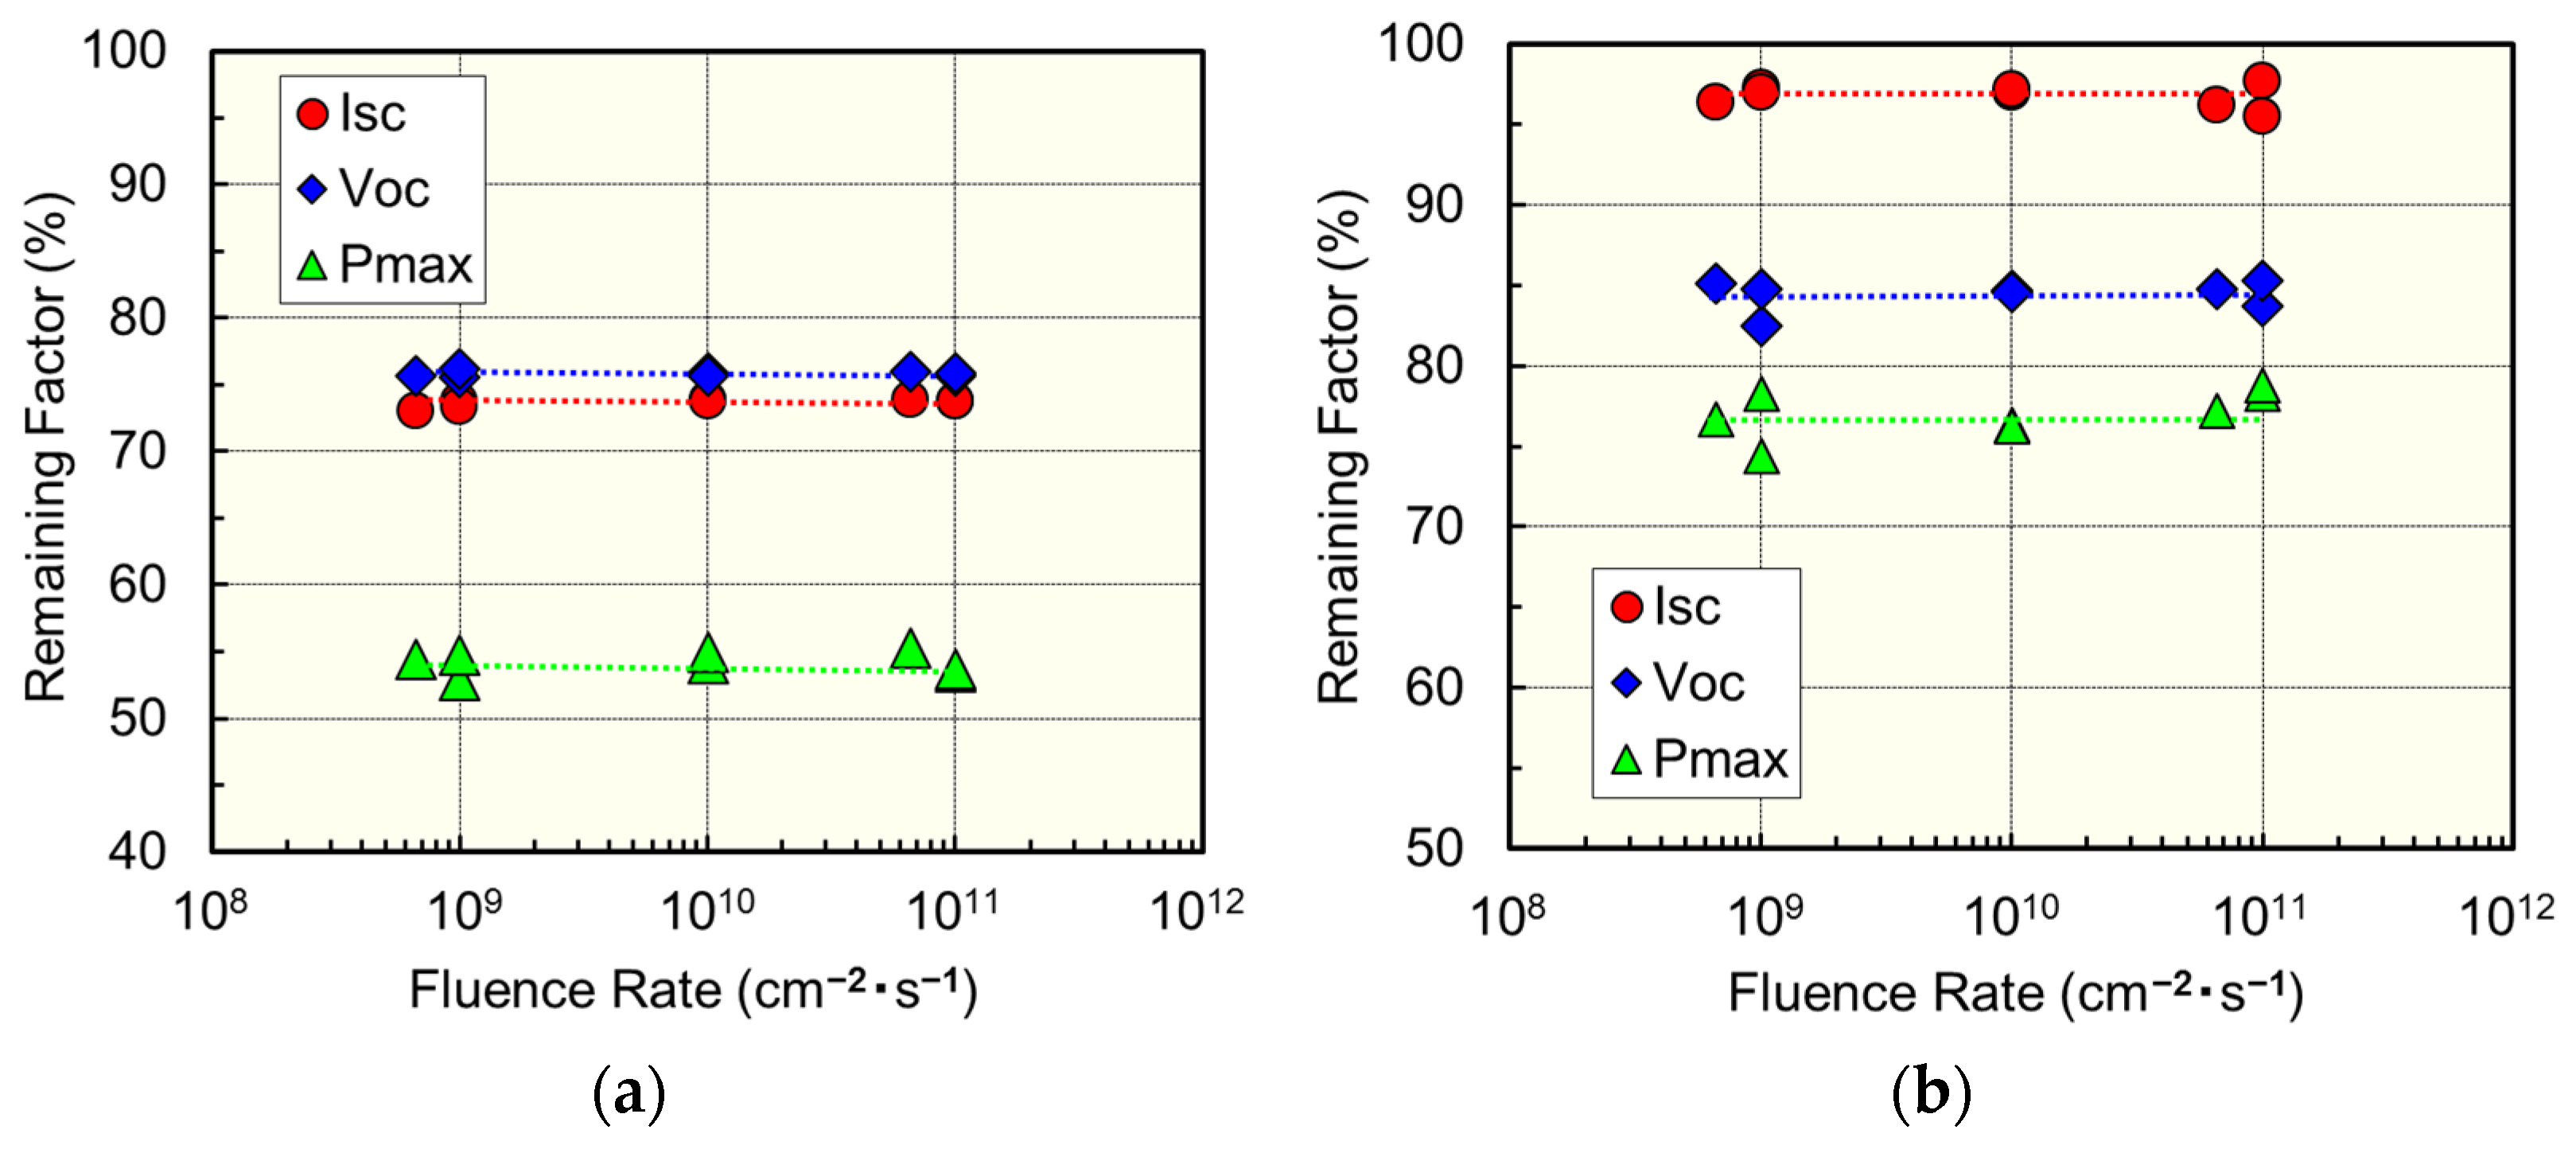
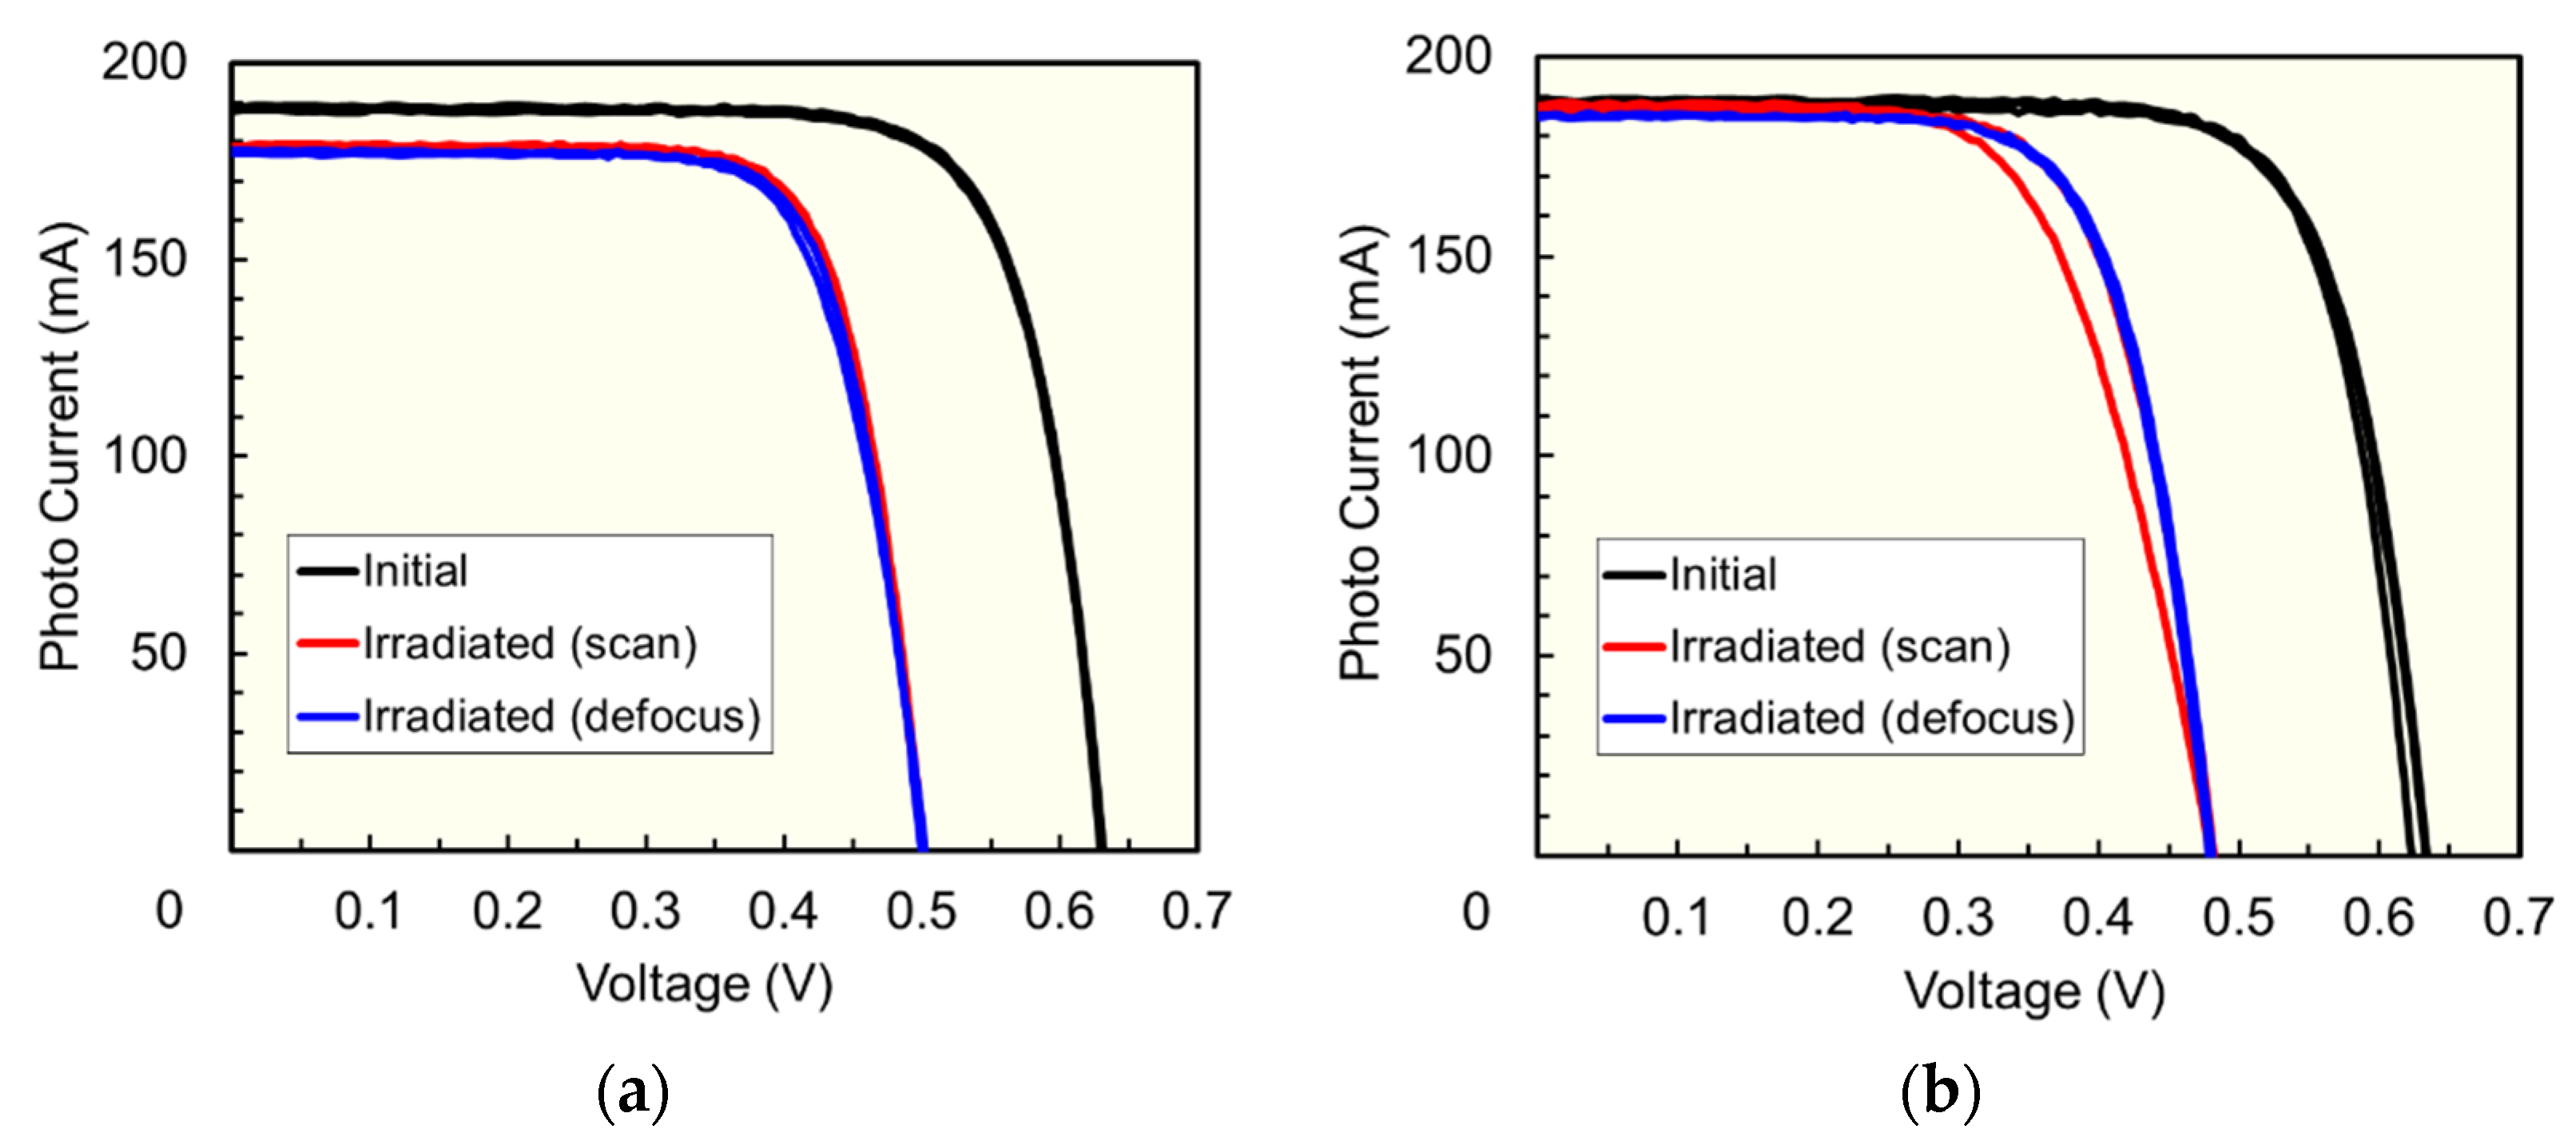
Figure 4 exhibits the LIV characteristics of the (a) Si and (b) 3J solar cells before and after 10 MeV proton irradiation with a fluence of 5.0 × 1012 cm−2. The fluence rates for the blue and red curves are 6.6 × 10⁸ and 6.6 × 1010 cm−2 s−1. The Si cell shows noticeable degradation, but there is no difference in LIV after irradiation. On the other hand, the 3J cell does not degrade as greatly as the Si, but there is a slight difference in Isc after irradiation. Figure 5 indicates the remaining factors of Isc, Voc, and Pmax for the (a) Si and (b) 3J solar cells as a function of 10 MeV proton fluence rate [9]. Two samples were irradiated for each beam condition. From the results, no significant dependence in degradation on fluence rate can be observed within the range of the experiment for either the Si or 3J solar cell. This fact confirms that the difference in Isc observed in Figure 4b is not significant and comes from a fluctuation of the sample characteristics.
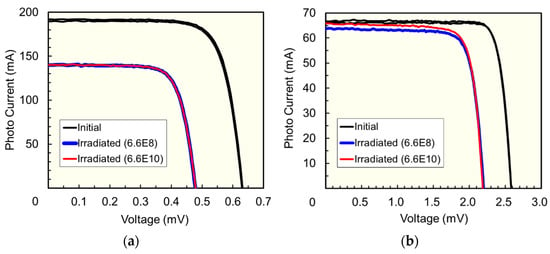
Figure 4.
Light current–voltage characteristics of (a) high-efficiency silicon and (b) InGaP/GaAs/Ge triple-junction solar cells before and after 10 MeV proton irradiation with a fluence of 5.0 × 1012 cm−2. The adopted fluence rates for blue and red curves are 6.6 × 10⁸ (6.6E8) and 6.6 × 10¹⁰ (6.6E10) cm−2 s−1.
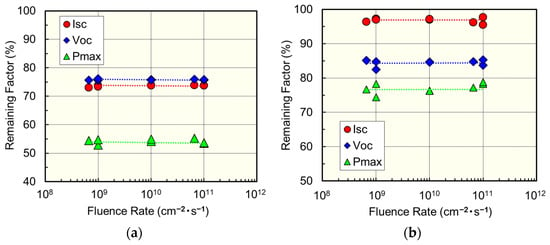
Figure 5.
Remaining factors of short-circuit current (Isc), open-circuit voltage (Voc), and maximum power (Pmax) for (a) high-efficiency silicon and (b) InGaP/GaAs/Ge triple-junction solar cells as a function of 10 MeV proton fluence rate. The fluence is 5.0 × 1012 cm−2.
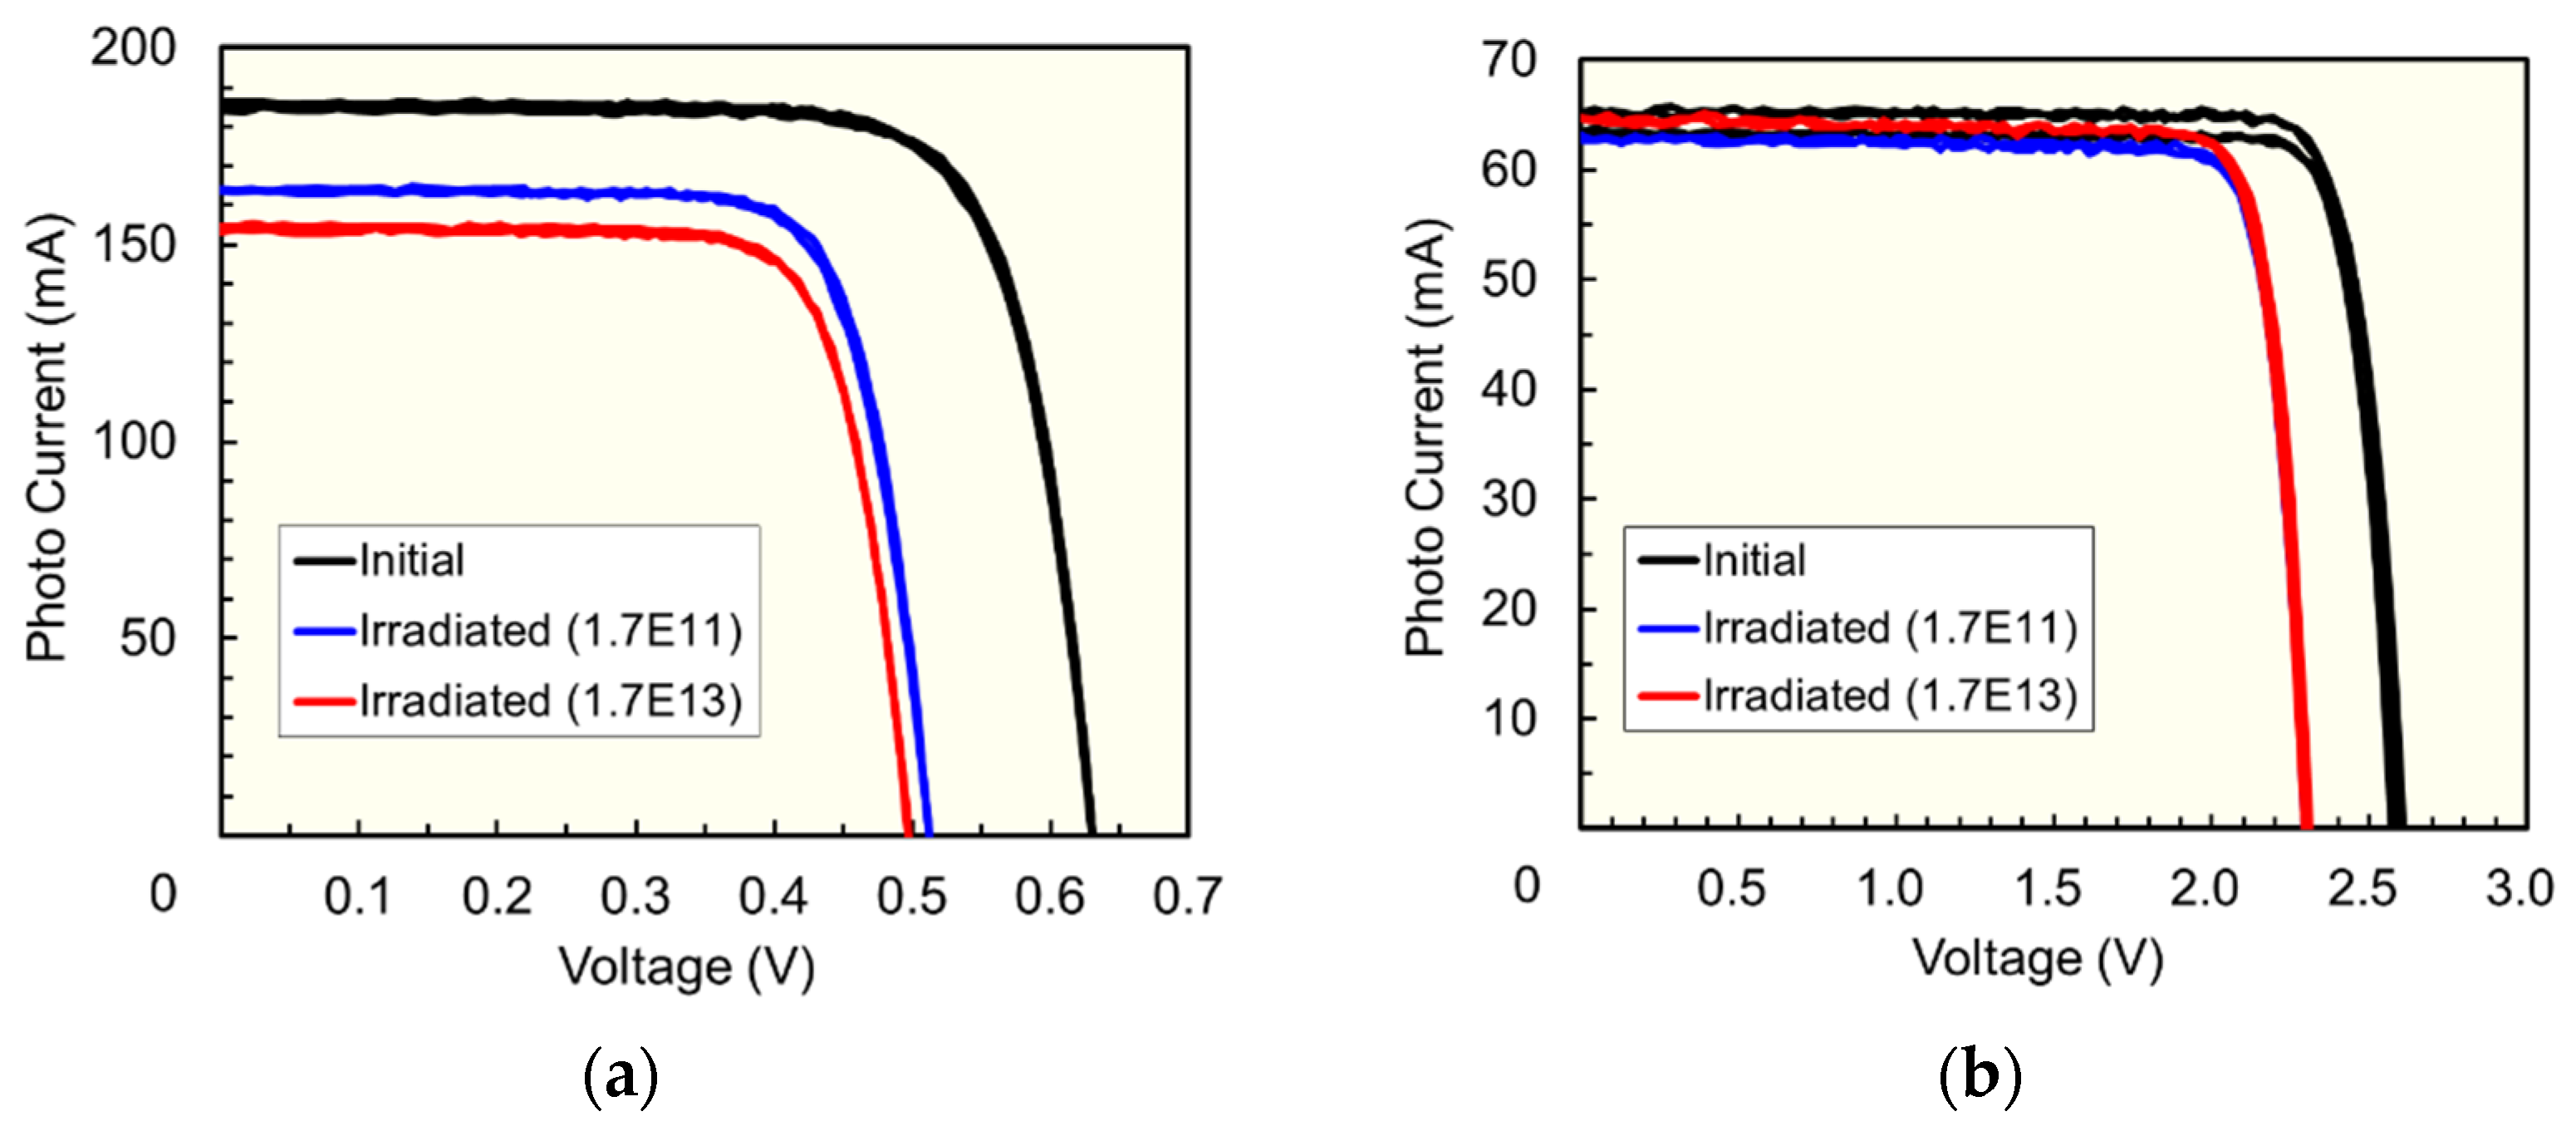
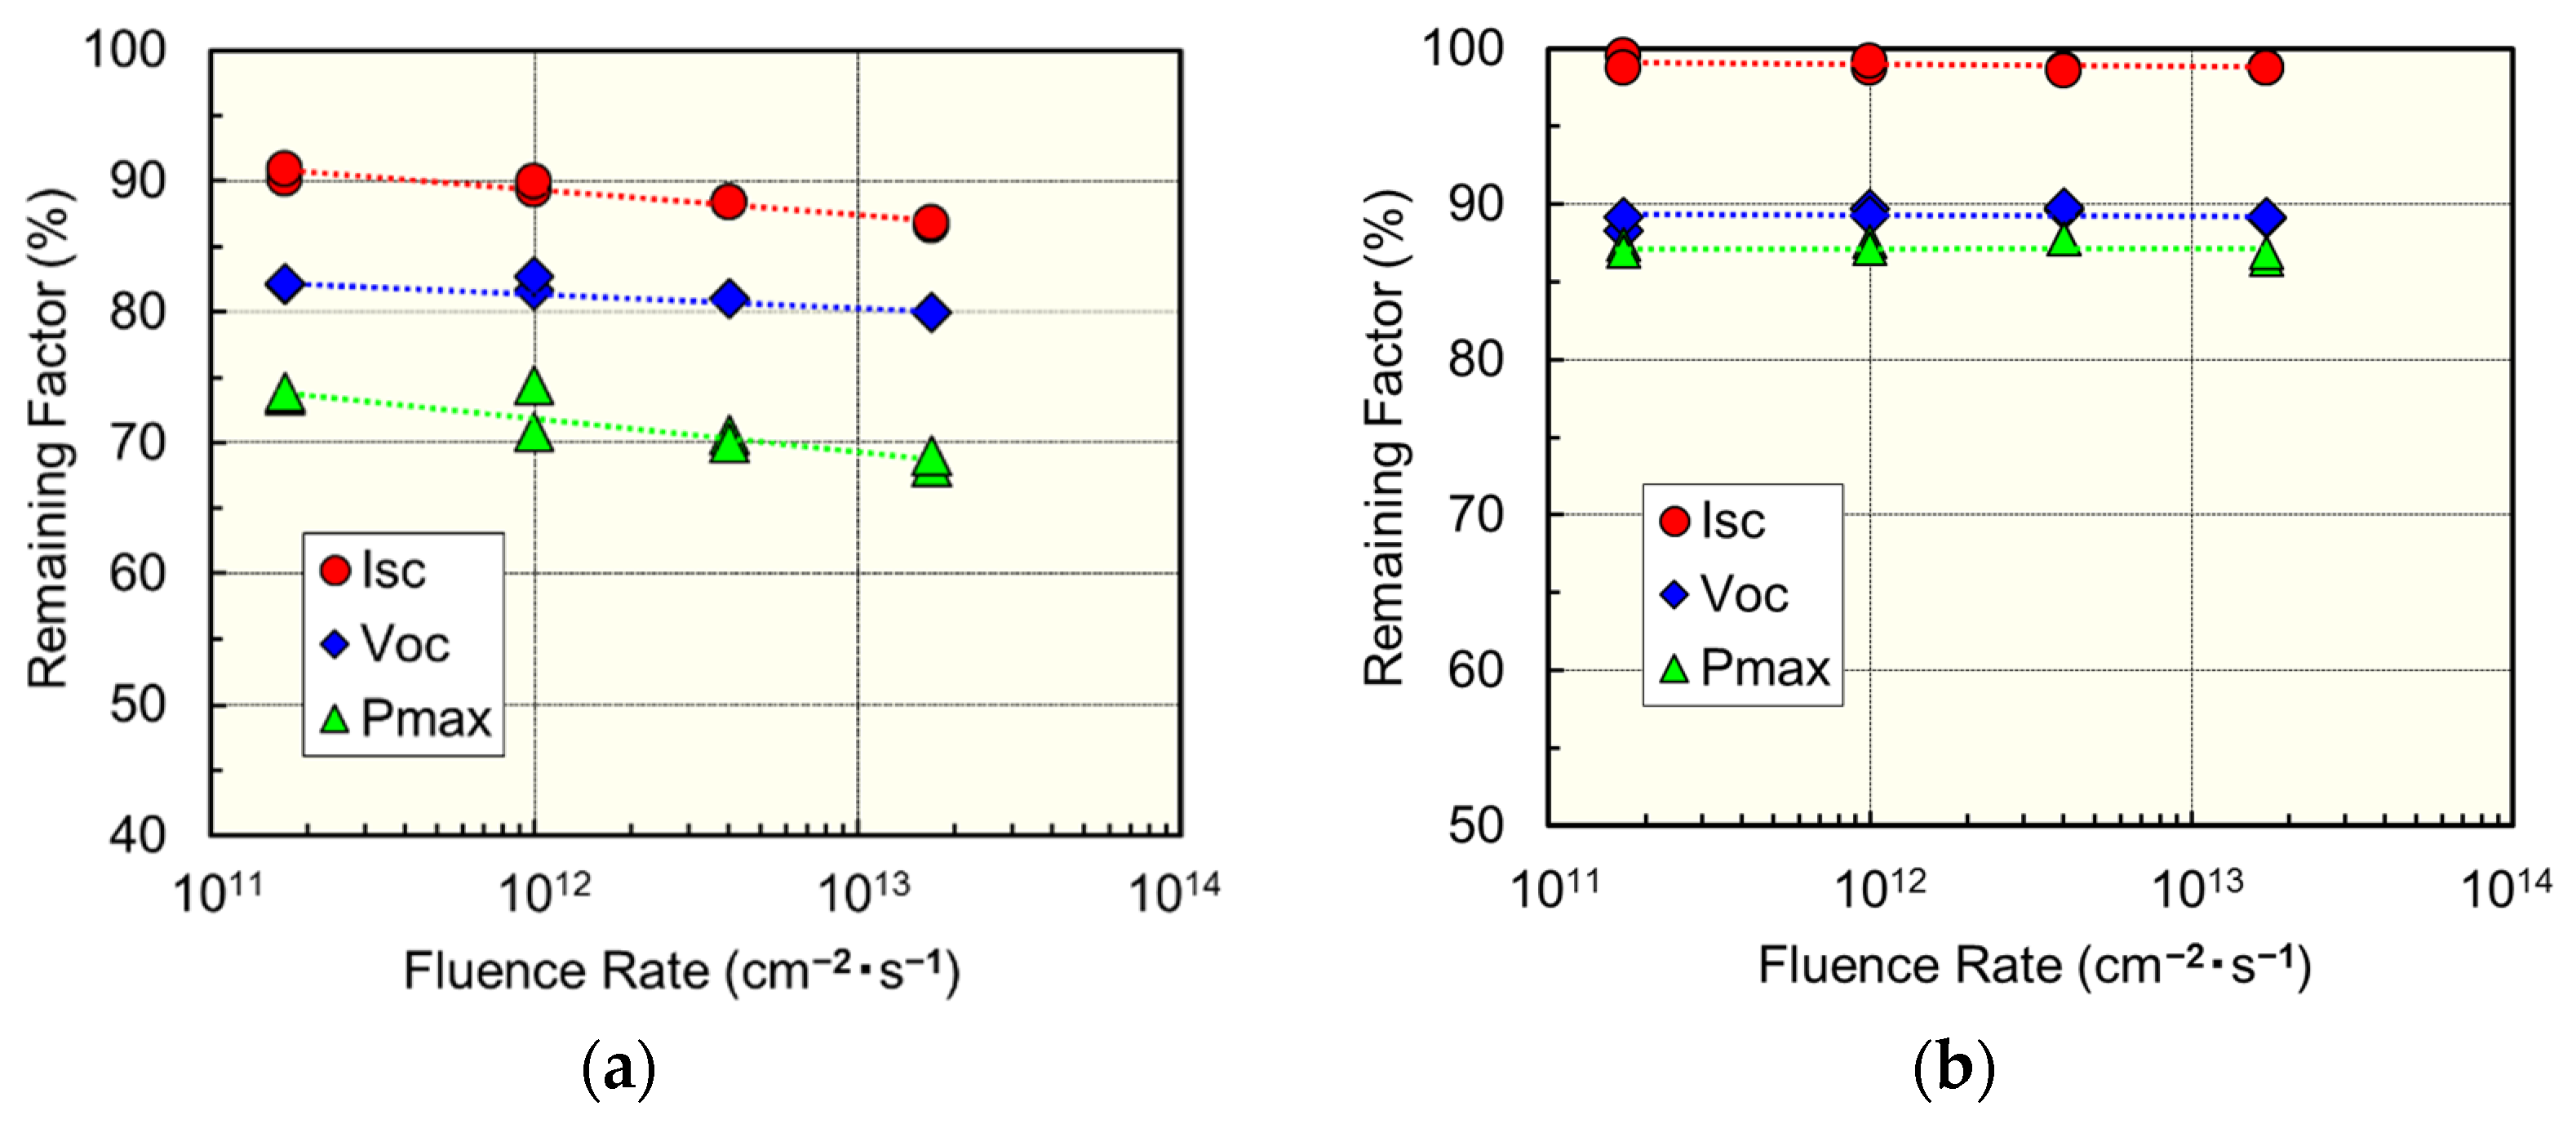
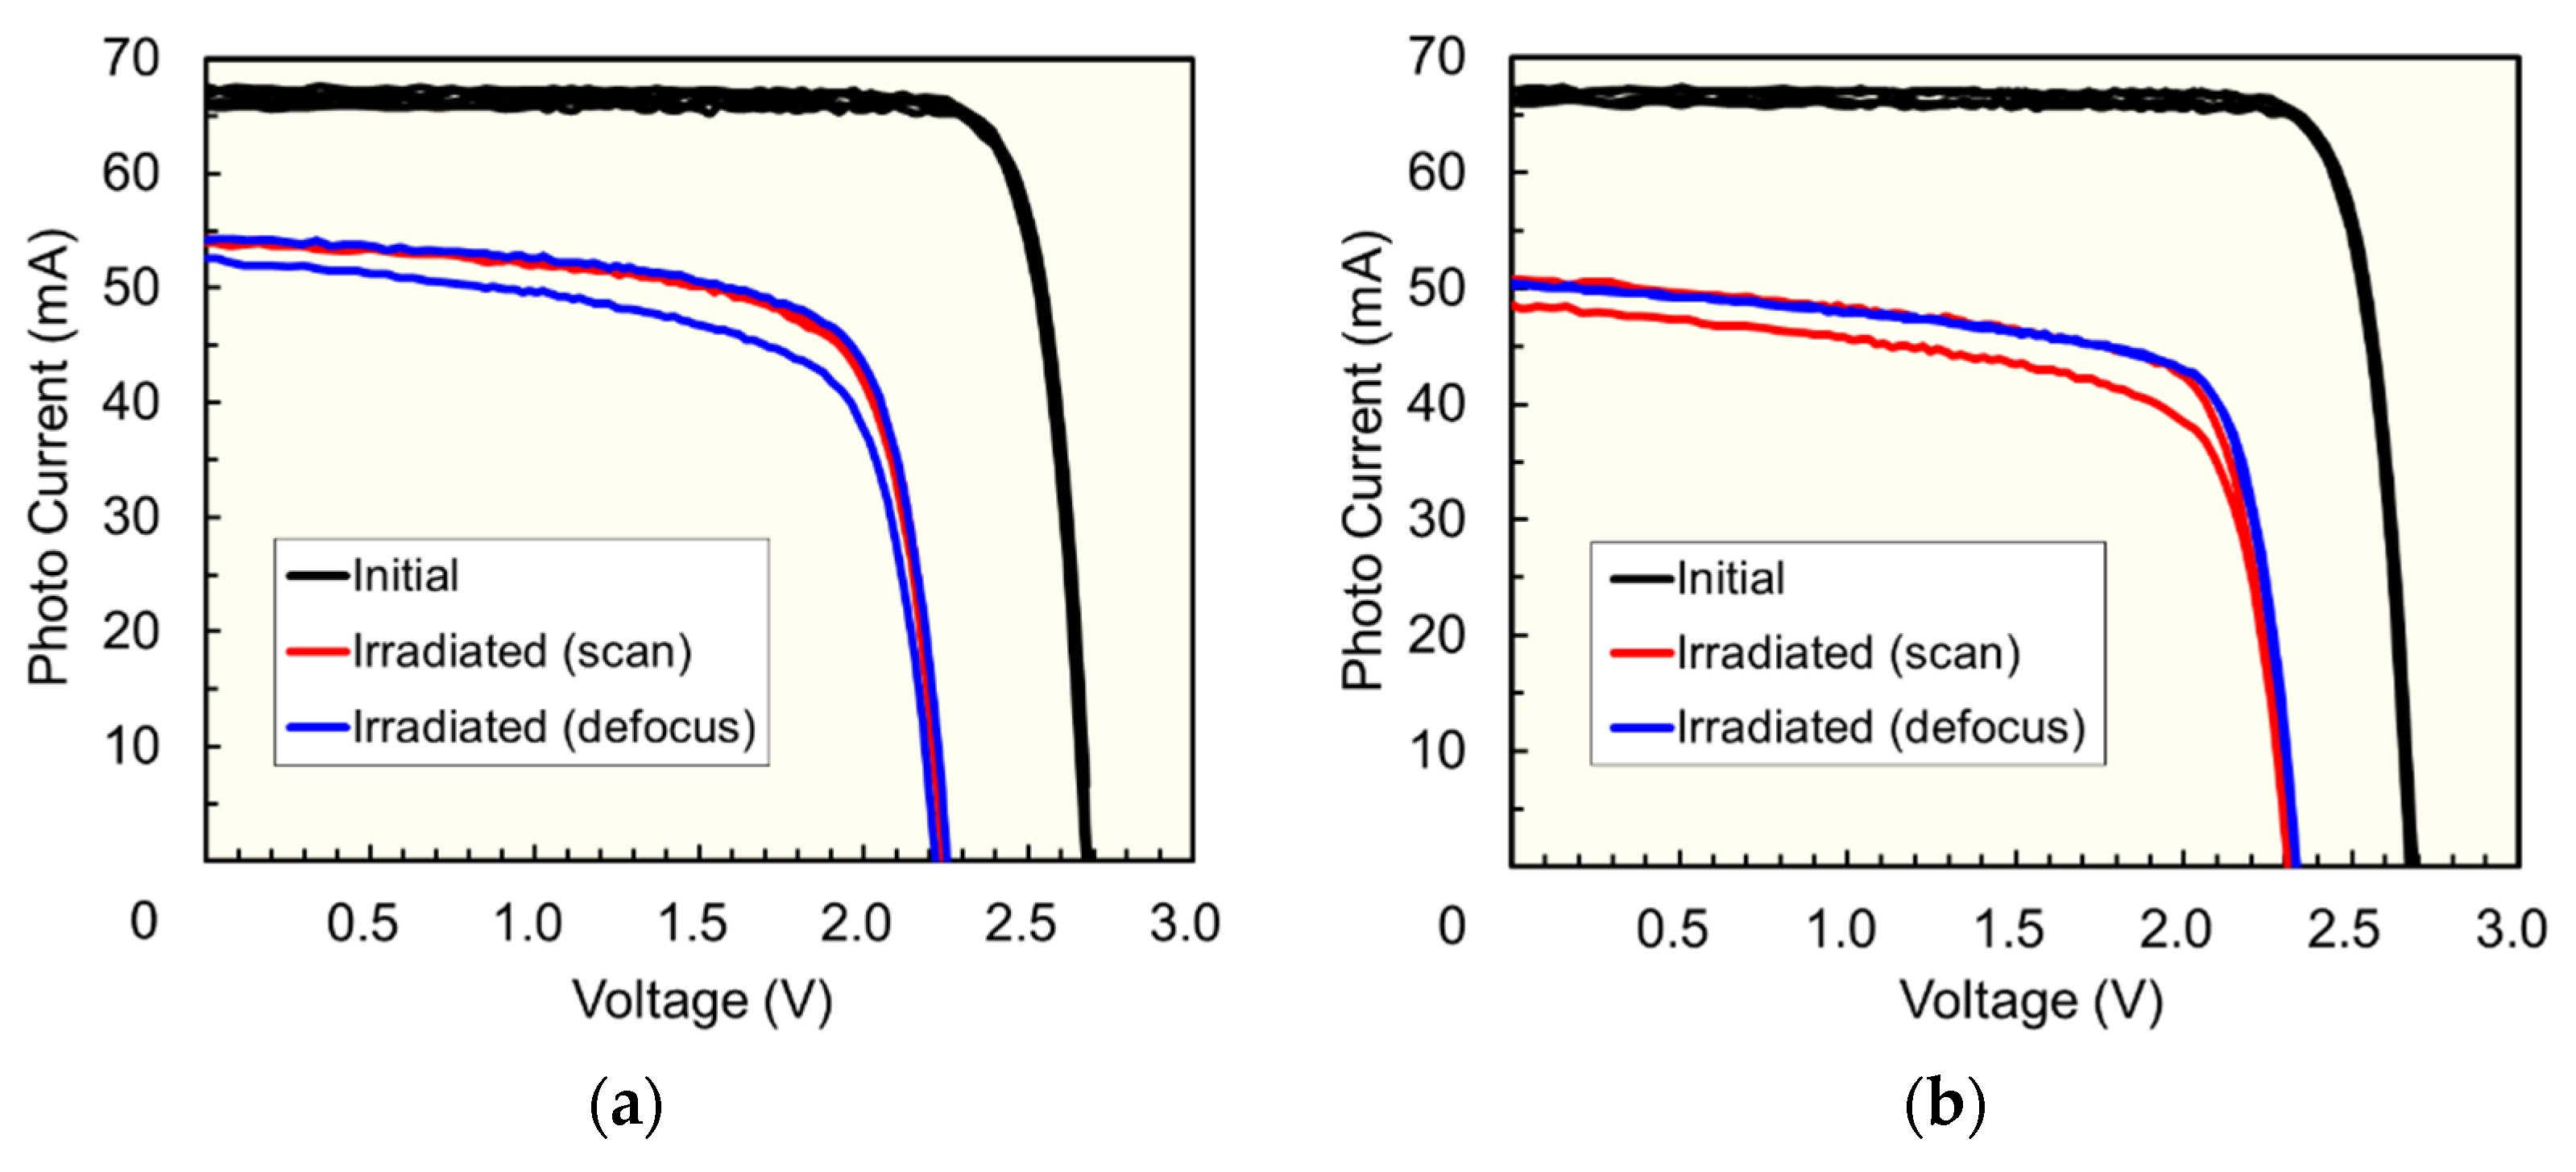
Figure 6 presents the LIV characteristics of the (a) Si and (b) 3J solar cells before and after 1 MeV electron irradiation with a fluence of 1.0 × 1015 cm−2. The fluence rates for blue and red curves are 1.7 × 10¹¹ and 1.7 × 1013 cm−2 s−1. Again, the Si cell shows considerable degradation. Furthermore, there is a clear difference between the blue and red curves. The 3J cell exhibits far less degradation and has no significant difference between its blue and red curves. Figure 7 depicts the remaining factors of Isc, Voc, and Pmax of the (a) Si and (b) 3J solar cells as a function of 1 MeV electron fluence rate [9]. Two samples were used for each beam condition as well. No dependence in degradation on fluence rate is conformed for the 3J cell. However, the degradation in the Si cell becomes greater as the fluence rate increases. We attributed this to the sample temperature rising during the electron irradiation; therefore, this tendency is not pertinent to this study. The sample temperatures were 30 and 90 °C at the fluence rates of 1.7 × 10¹¹ and 1.7 × 1013 cm−2 s−1. Details of this temperature effect have been described elsewhere [9]. However, this fact demonstrates that controlling the sample temperature is important especially for electron irradiation tests on Si solar cells.
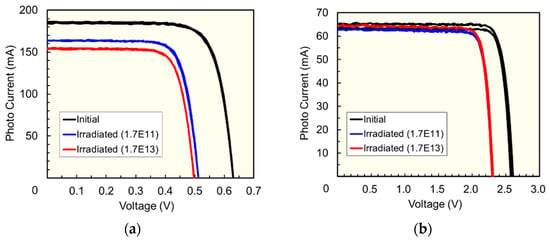
Figure 6.
Light current-voltage characteristics of (a) high efficiency silicon and (b) InGaP/GaAs/Ge triple-junction solar cells before and after 1 MeV electron irradiation with a fluence of 1.0 × 1015 cm−2. The adopted fluence rates for blue and red curves are 1.7 × 10¹¹ (1.7E11) and 1.7 × 10¹³ (1.7E13) cm−2 s−1.
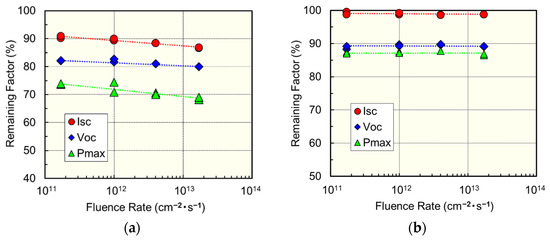
Figure 7.
The remaining factors of short-circuit current (Isc), open-circuit voltage (Voc), and maximum power (Pmax) for (a) high-efficiency silicon and (b) InGaP/GaAs/Ge triple-junction solar cells as a function of 1 MeV electron fluence rate. The fluence is 1.0 × 1015 cm−2.
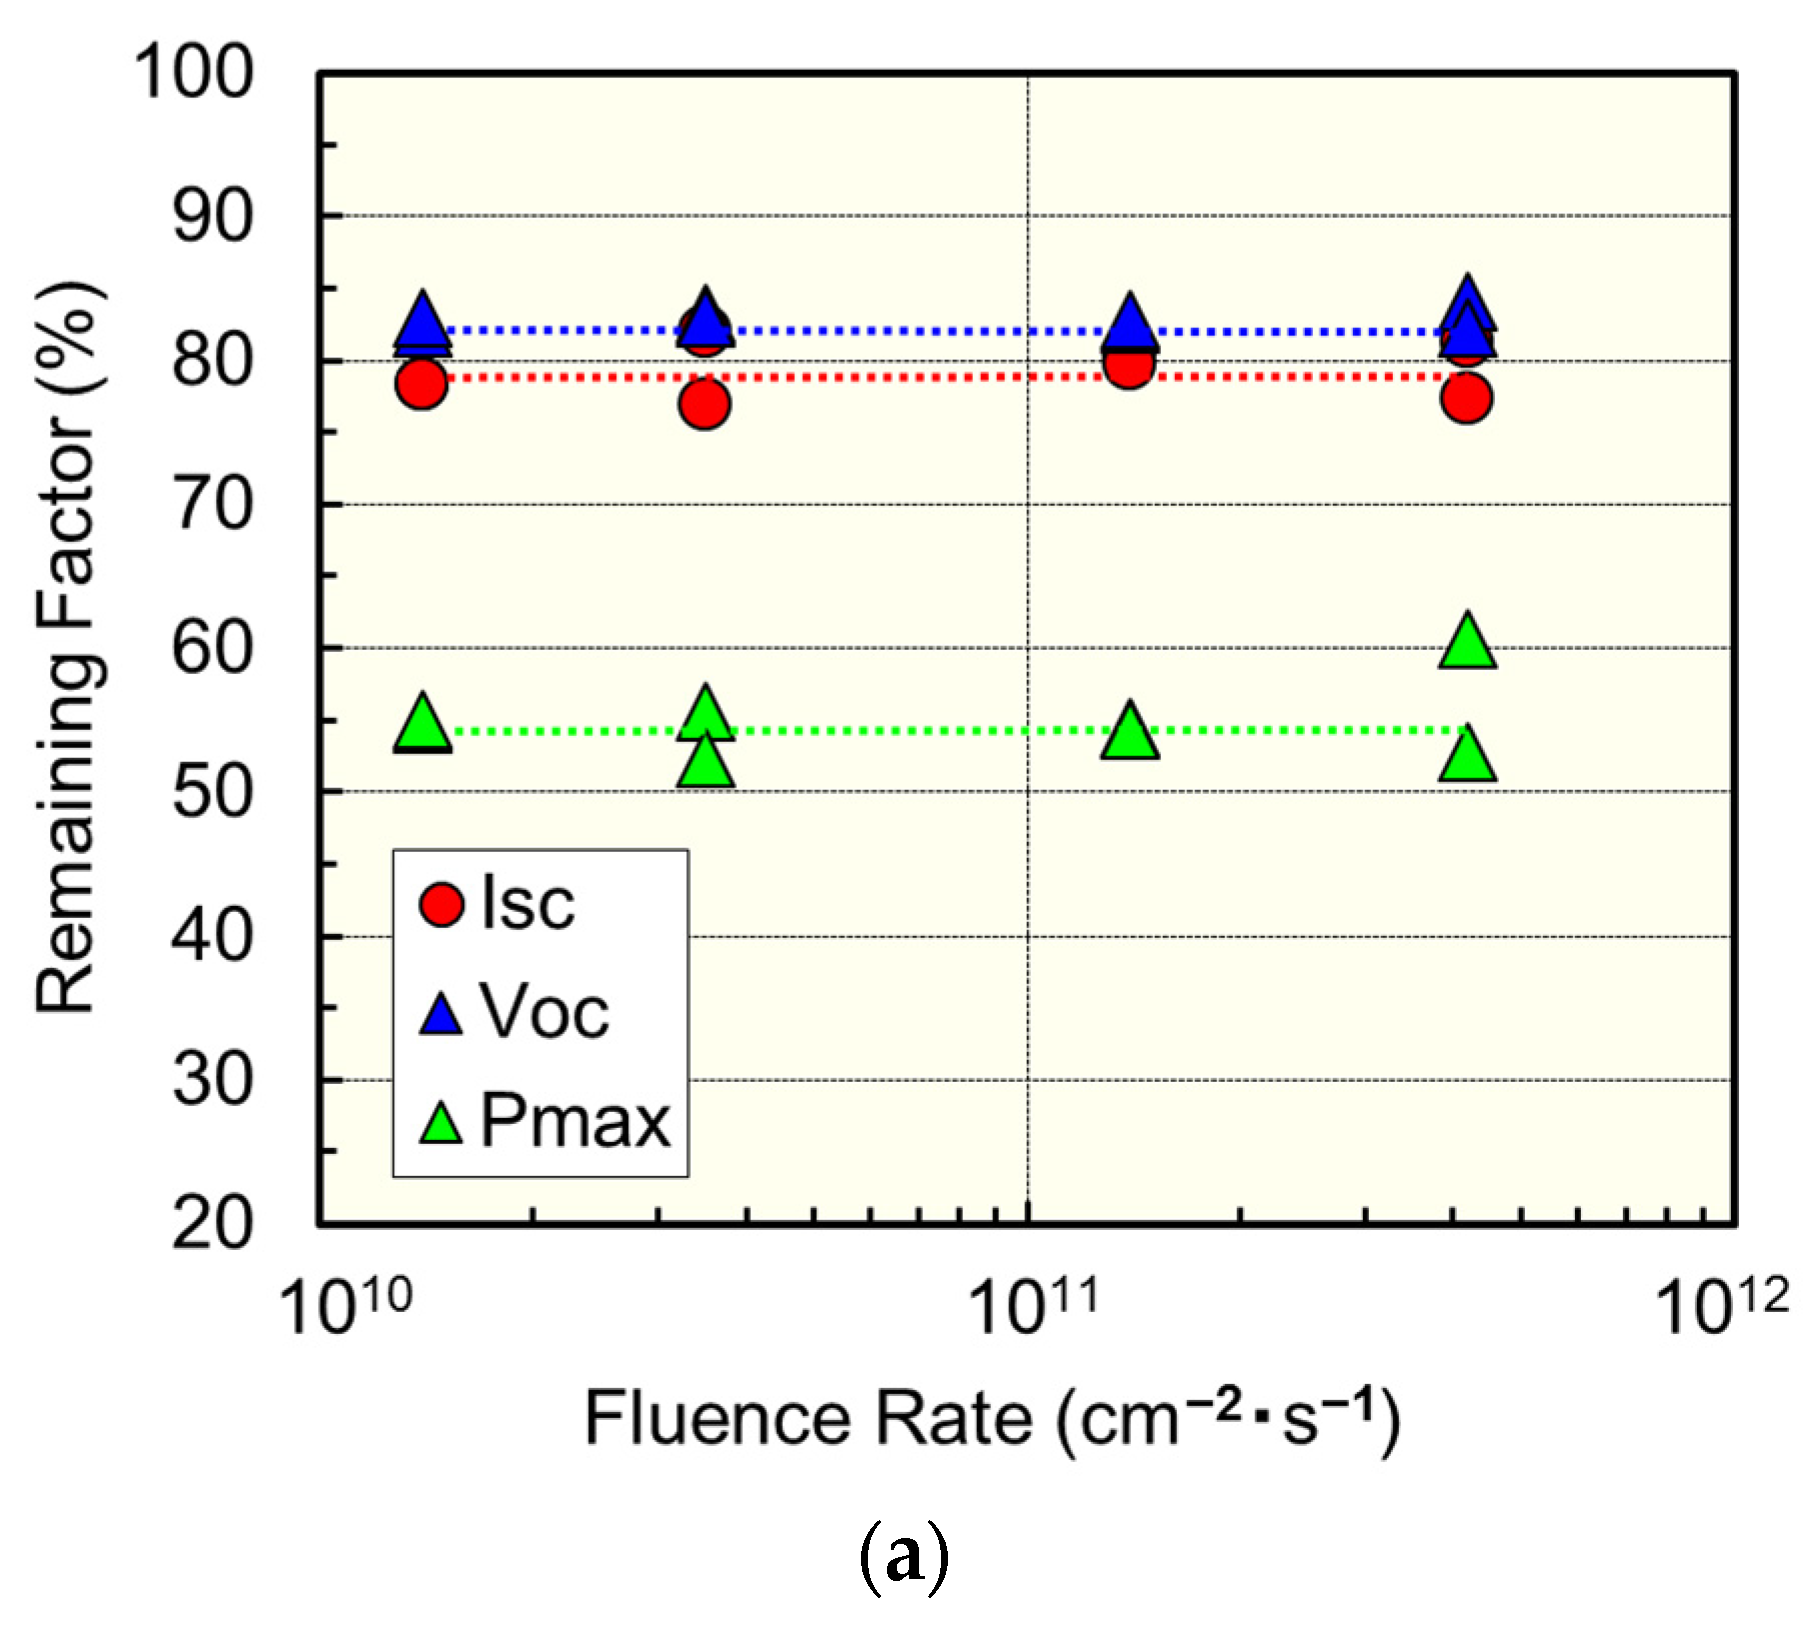
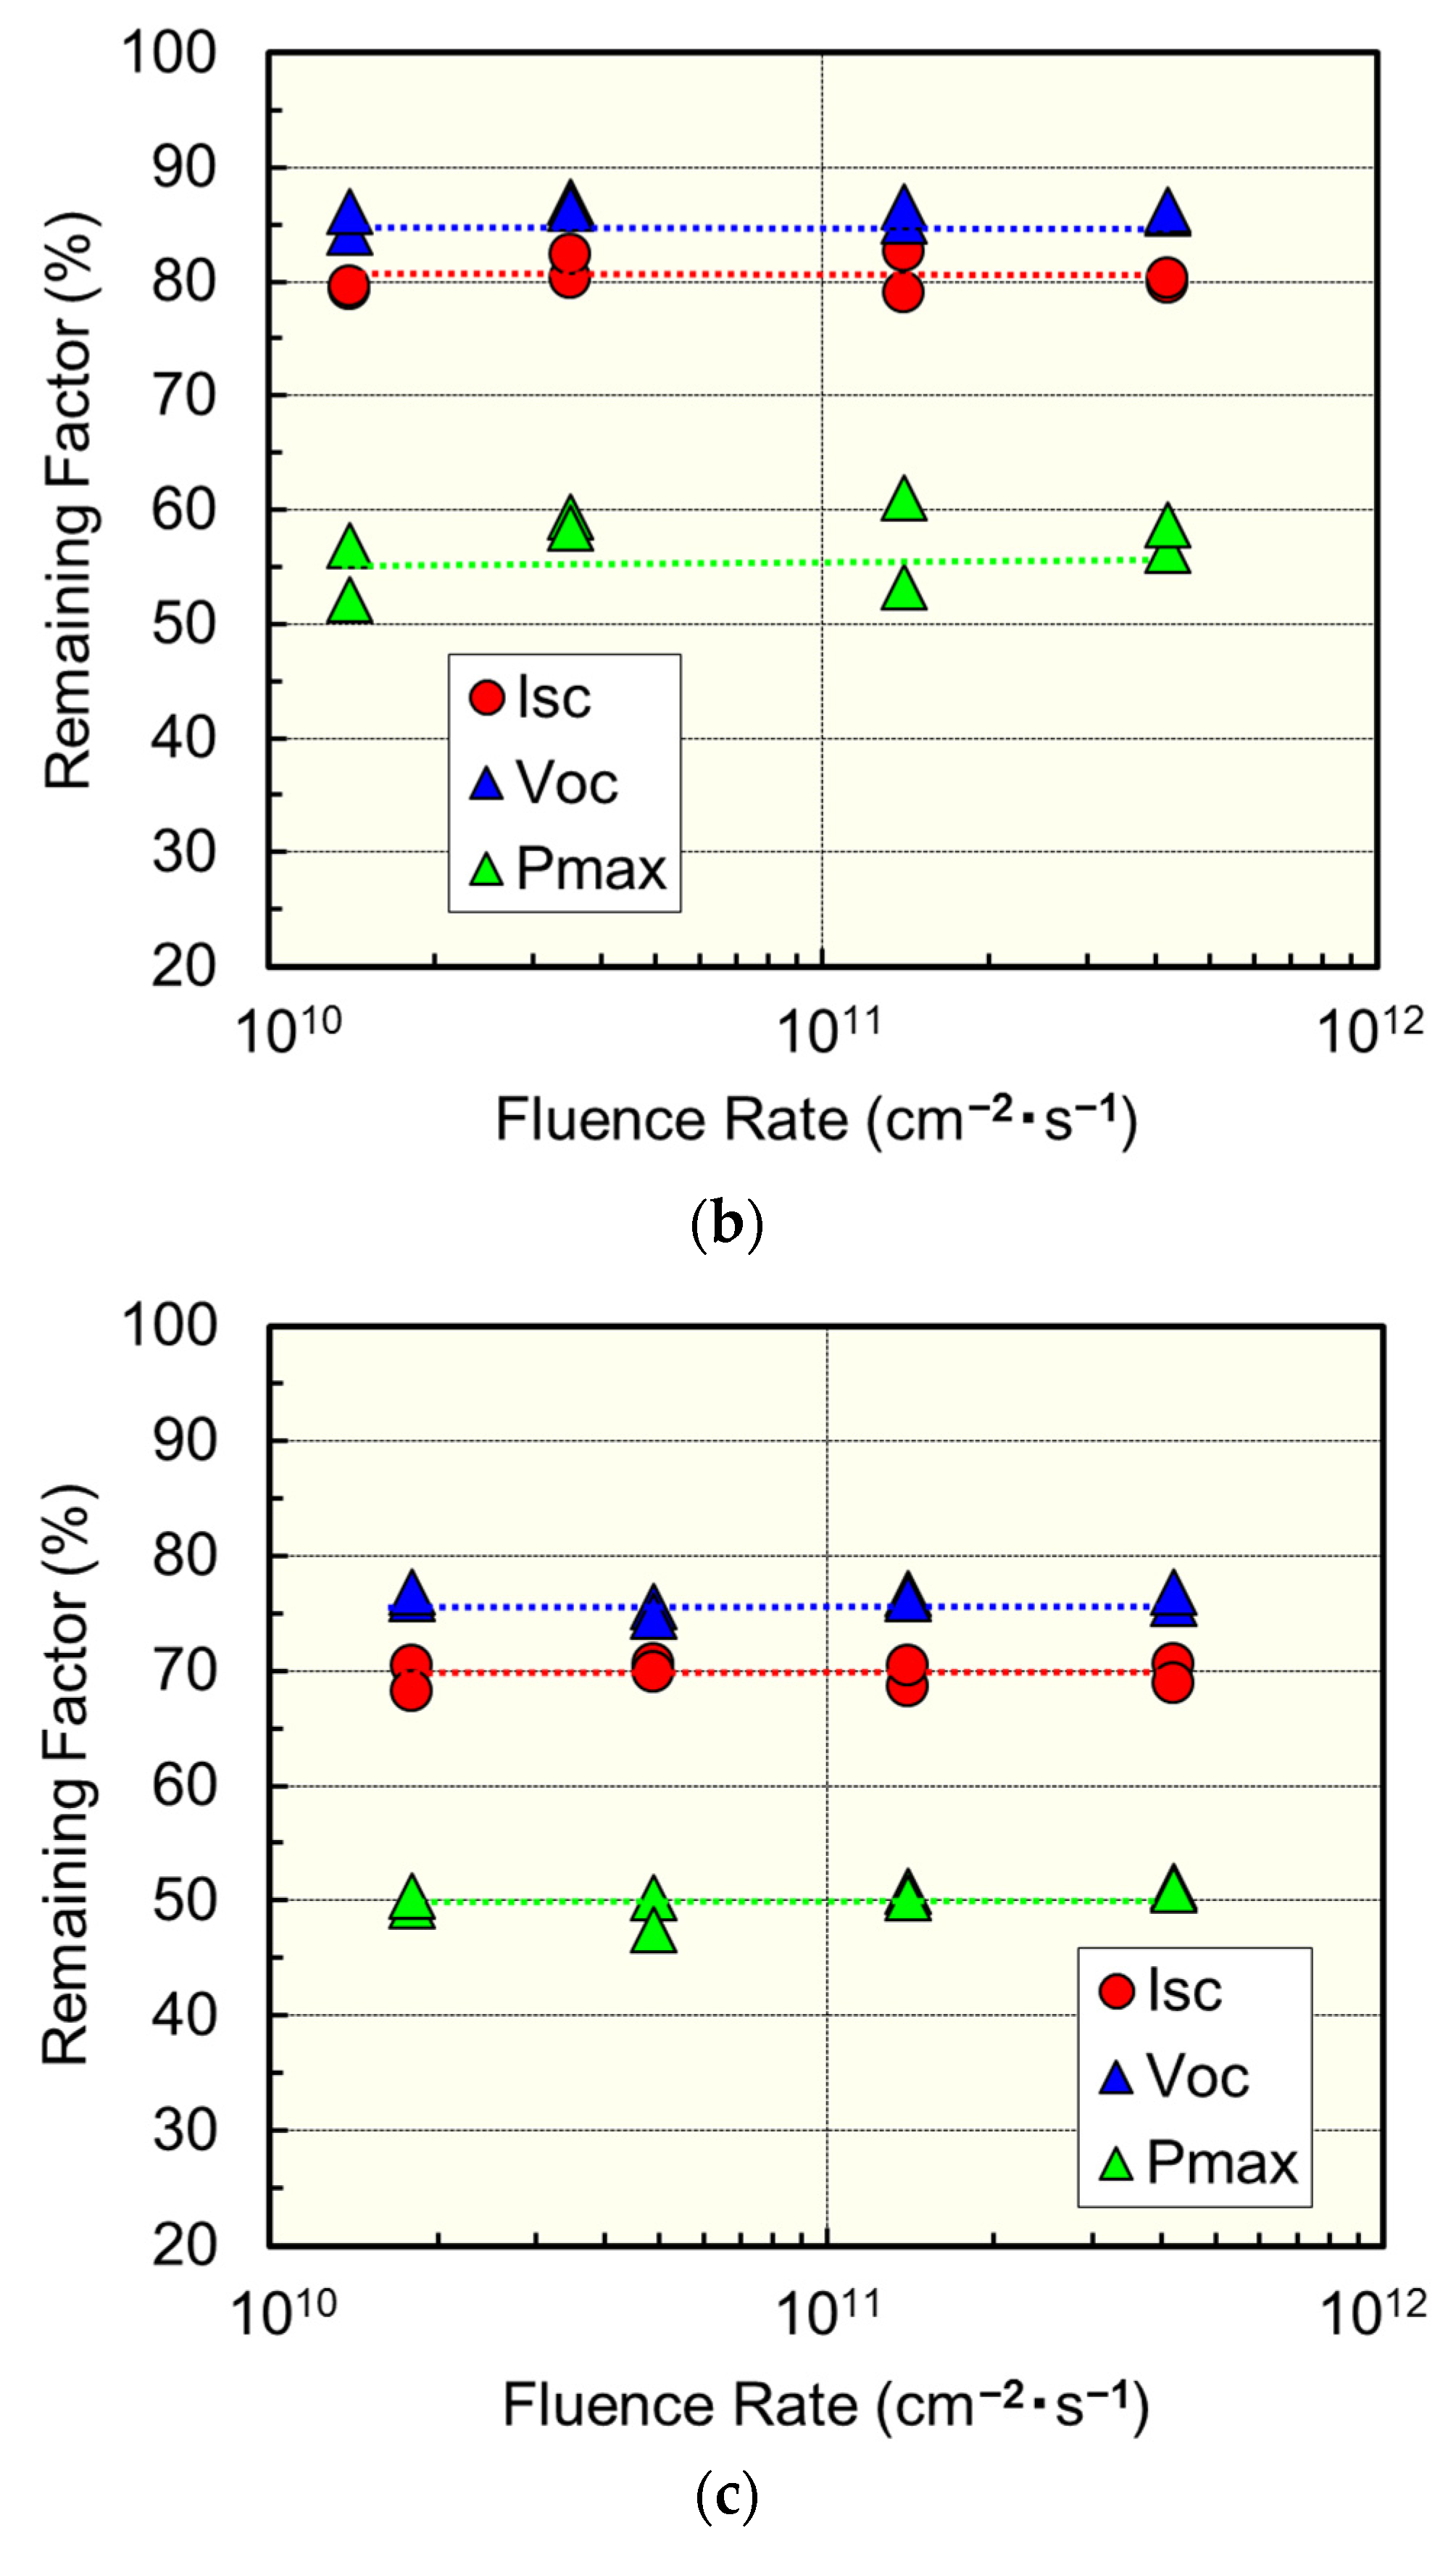
The remaining factors of Isc, Voc, and Pmax of the 3J solar cells as a function of the fluence rate of protons with the energies of (a) 50, (b) 100, and (c) 150 keV are exhibited in Figure 8. Although there is some scattering in the remaining factor of Pmax of the (a) 50 and (b) 100 keV results, the degradation is likely to be independent of the fluence rate in the examined range.
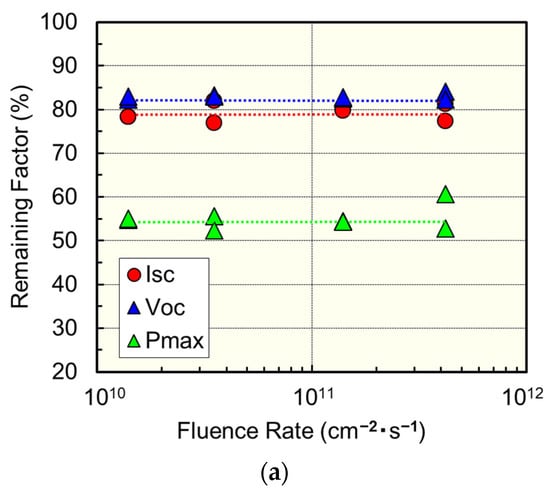
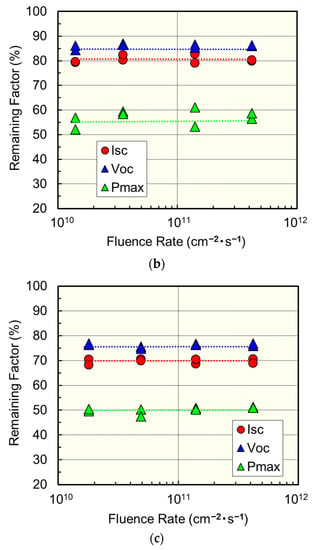
Figure 8.
The remaining factors of short-circuit current (Isc), open-circuit voltage (Voc), and maximum power (Pmax) of InGaP/GaAs/Ge triple-junction solar cell as a function of fluence rate of protons with energies of (a) 50, (b) 100 and (c) 150 keV.
The adopted fluence rates in this investigation are reasonable values for radiation tests of solar cells. The results confirmed that degradation of Si and 3J solar cells due to electrons and protons is insensitive to the fluence rate that is generally used in actual radiation tests. Furthermore, this independence of degradation on fluence rate is established for both uniform and localized damage.
3.2. Beam-Area Expansion Method
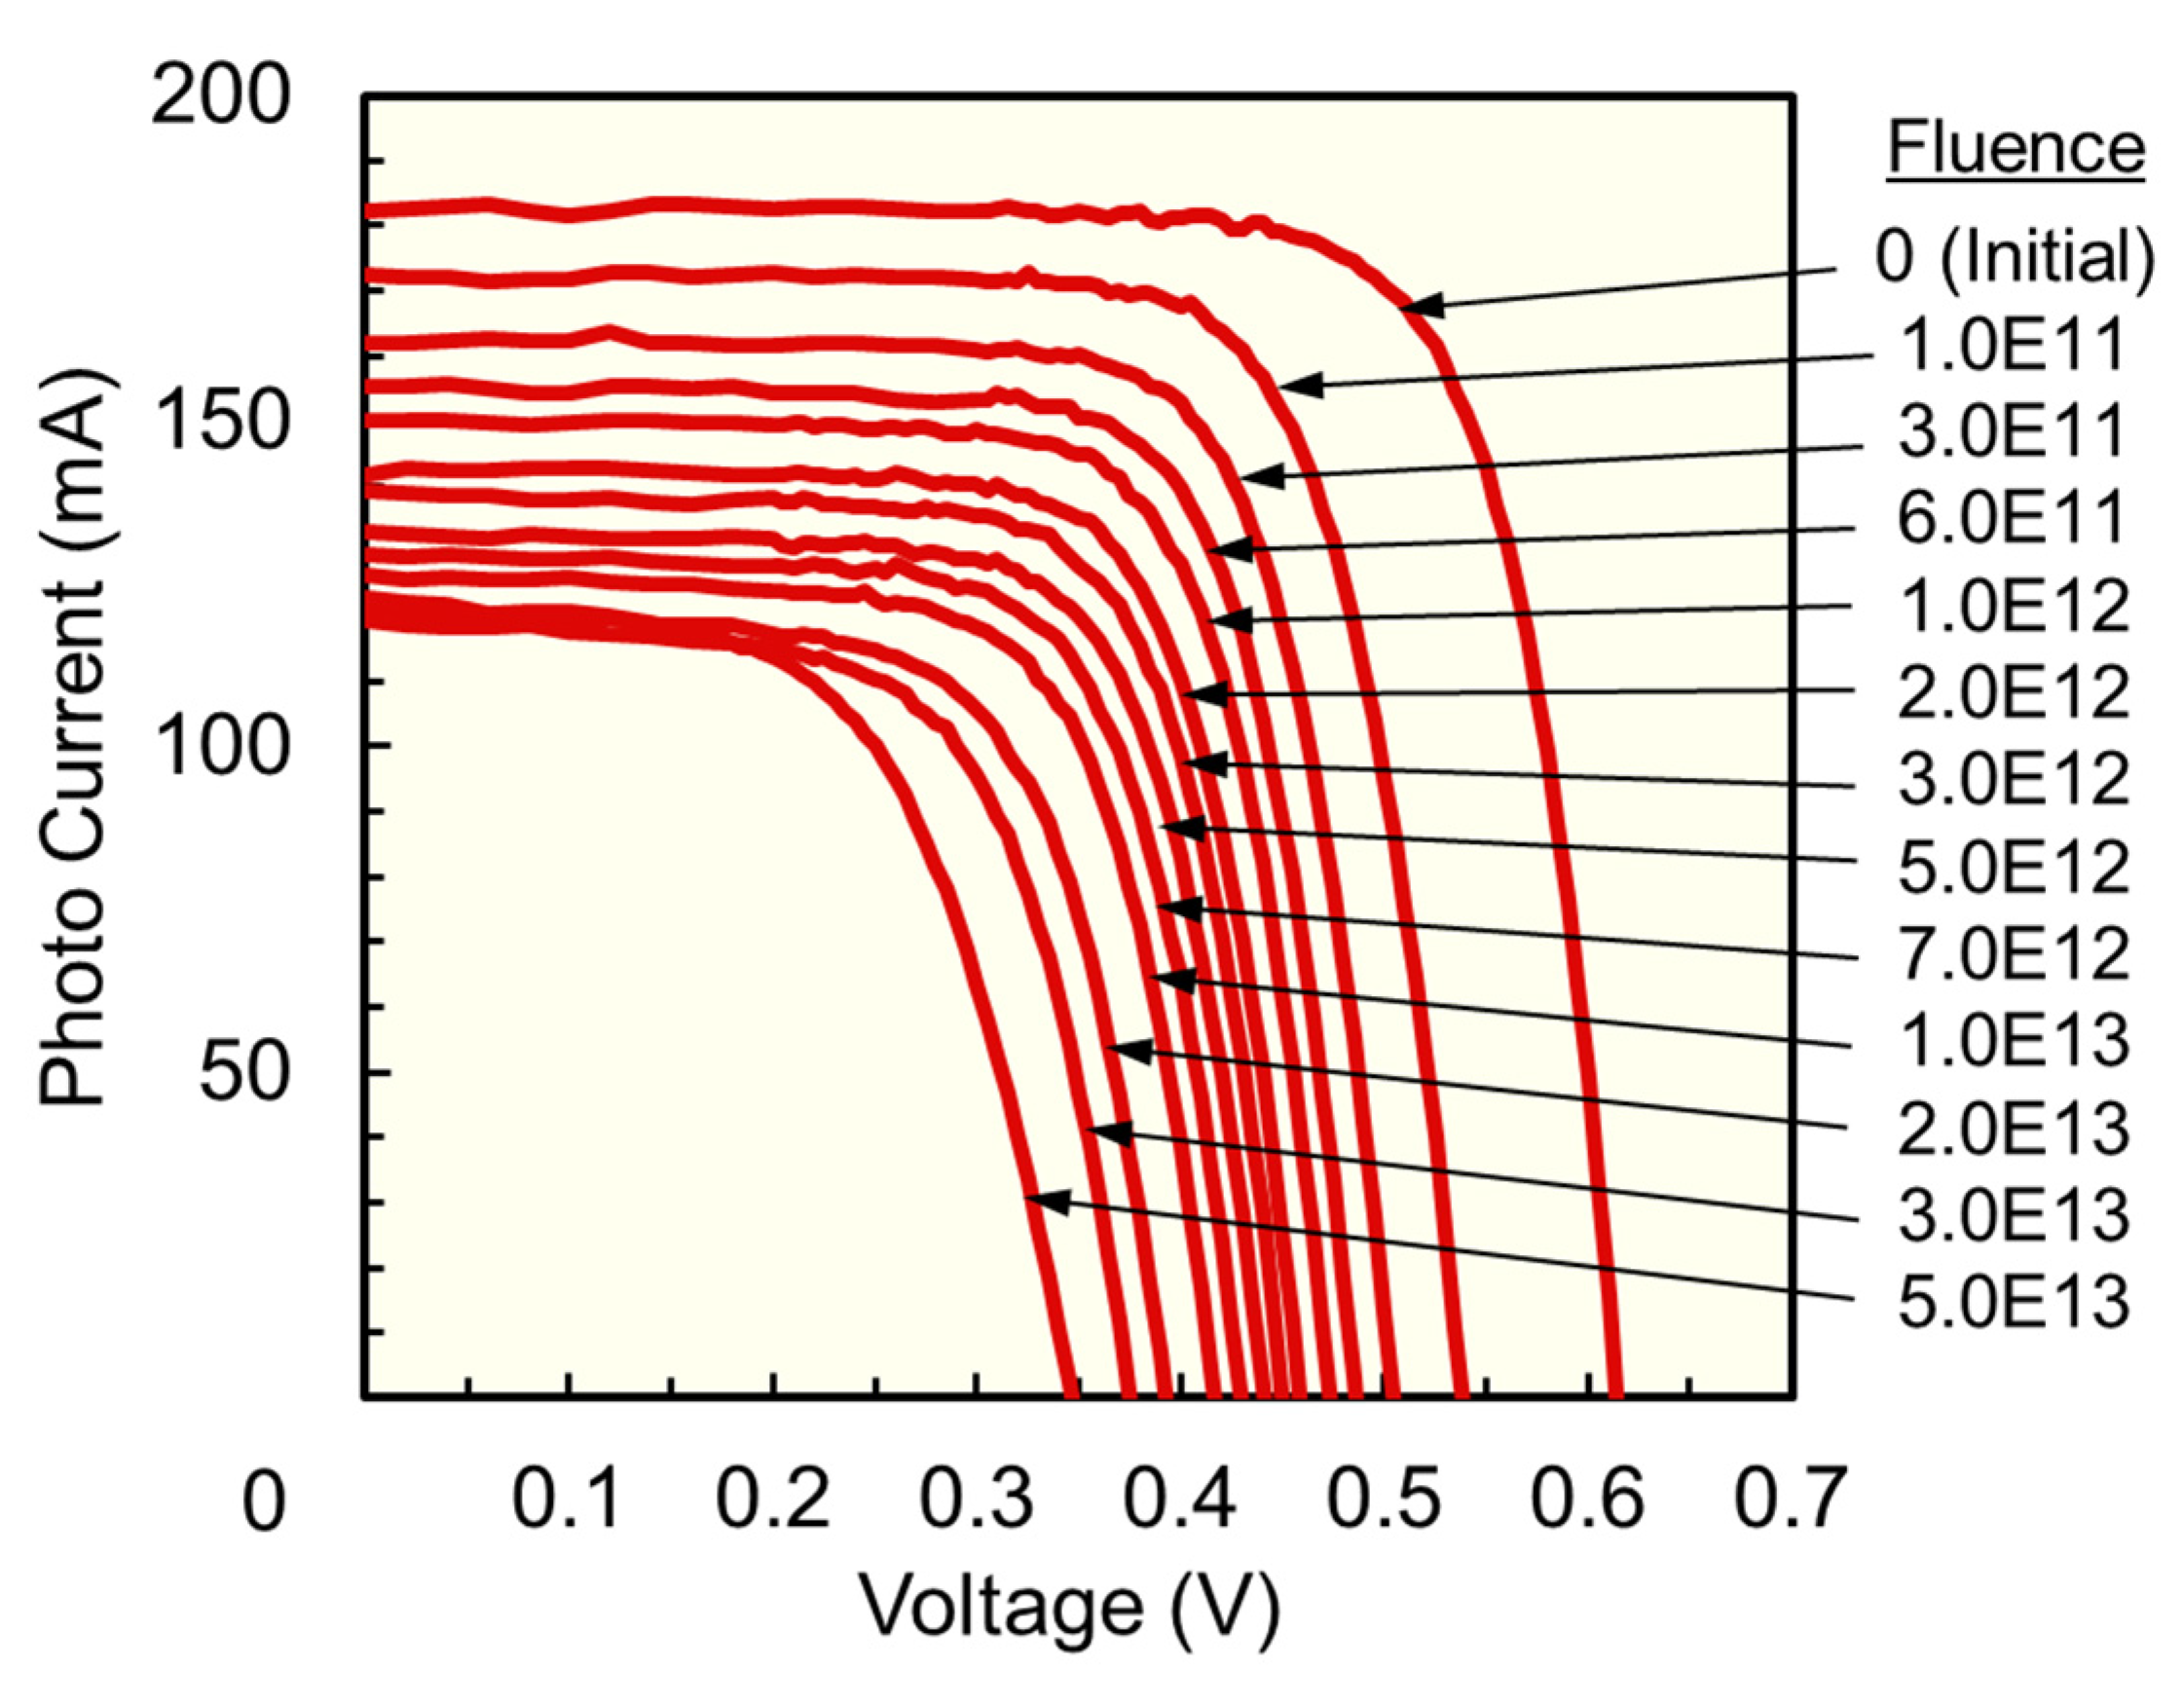
Figure 9 shows a typical set of LIV data collected using the 10 MeV proton irradiation chamber equipped with a solar simulator of the previous section. This is the case of the Si solar cell and the scanned beam, but temperature correction is not applied. Fluence was varied from 0 (initial) to 5.0 × 1013 cm−2 with twelve steps. This figure displays representative deterioration in output as LIV characteristics of a solar cell due to radiation damage.
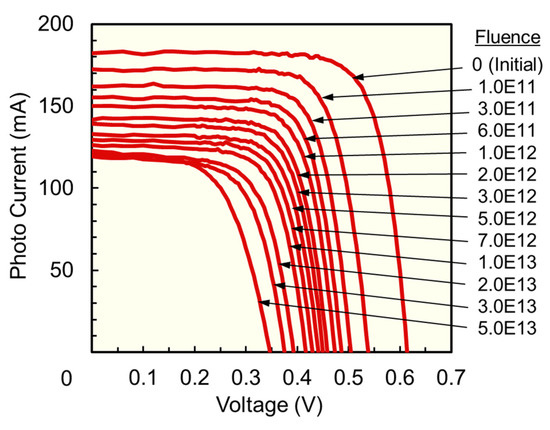
Figure 9.
Typical set of LIV data for high-efficiency silicon solar cell collected using the 10 MeV proton irradiation chamber equipped with a solar simulator. No temperature correction was applied.
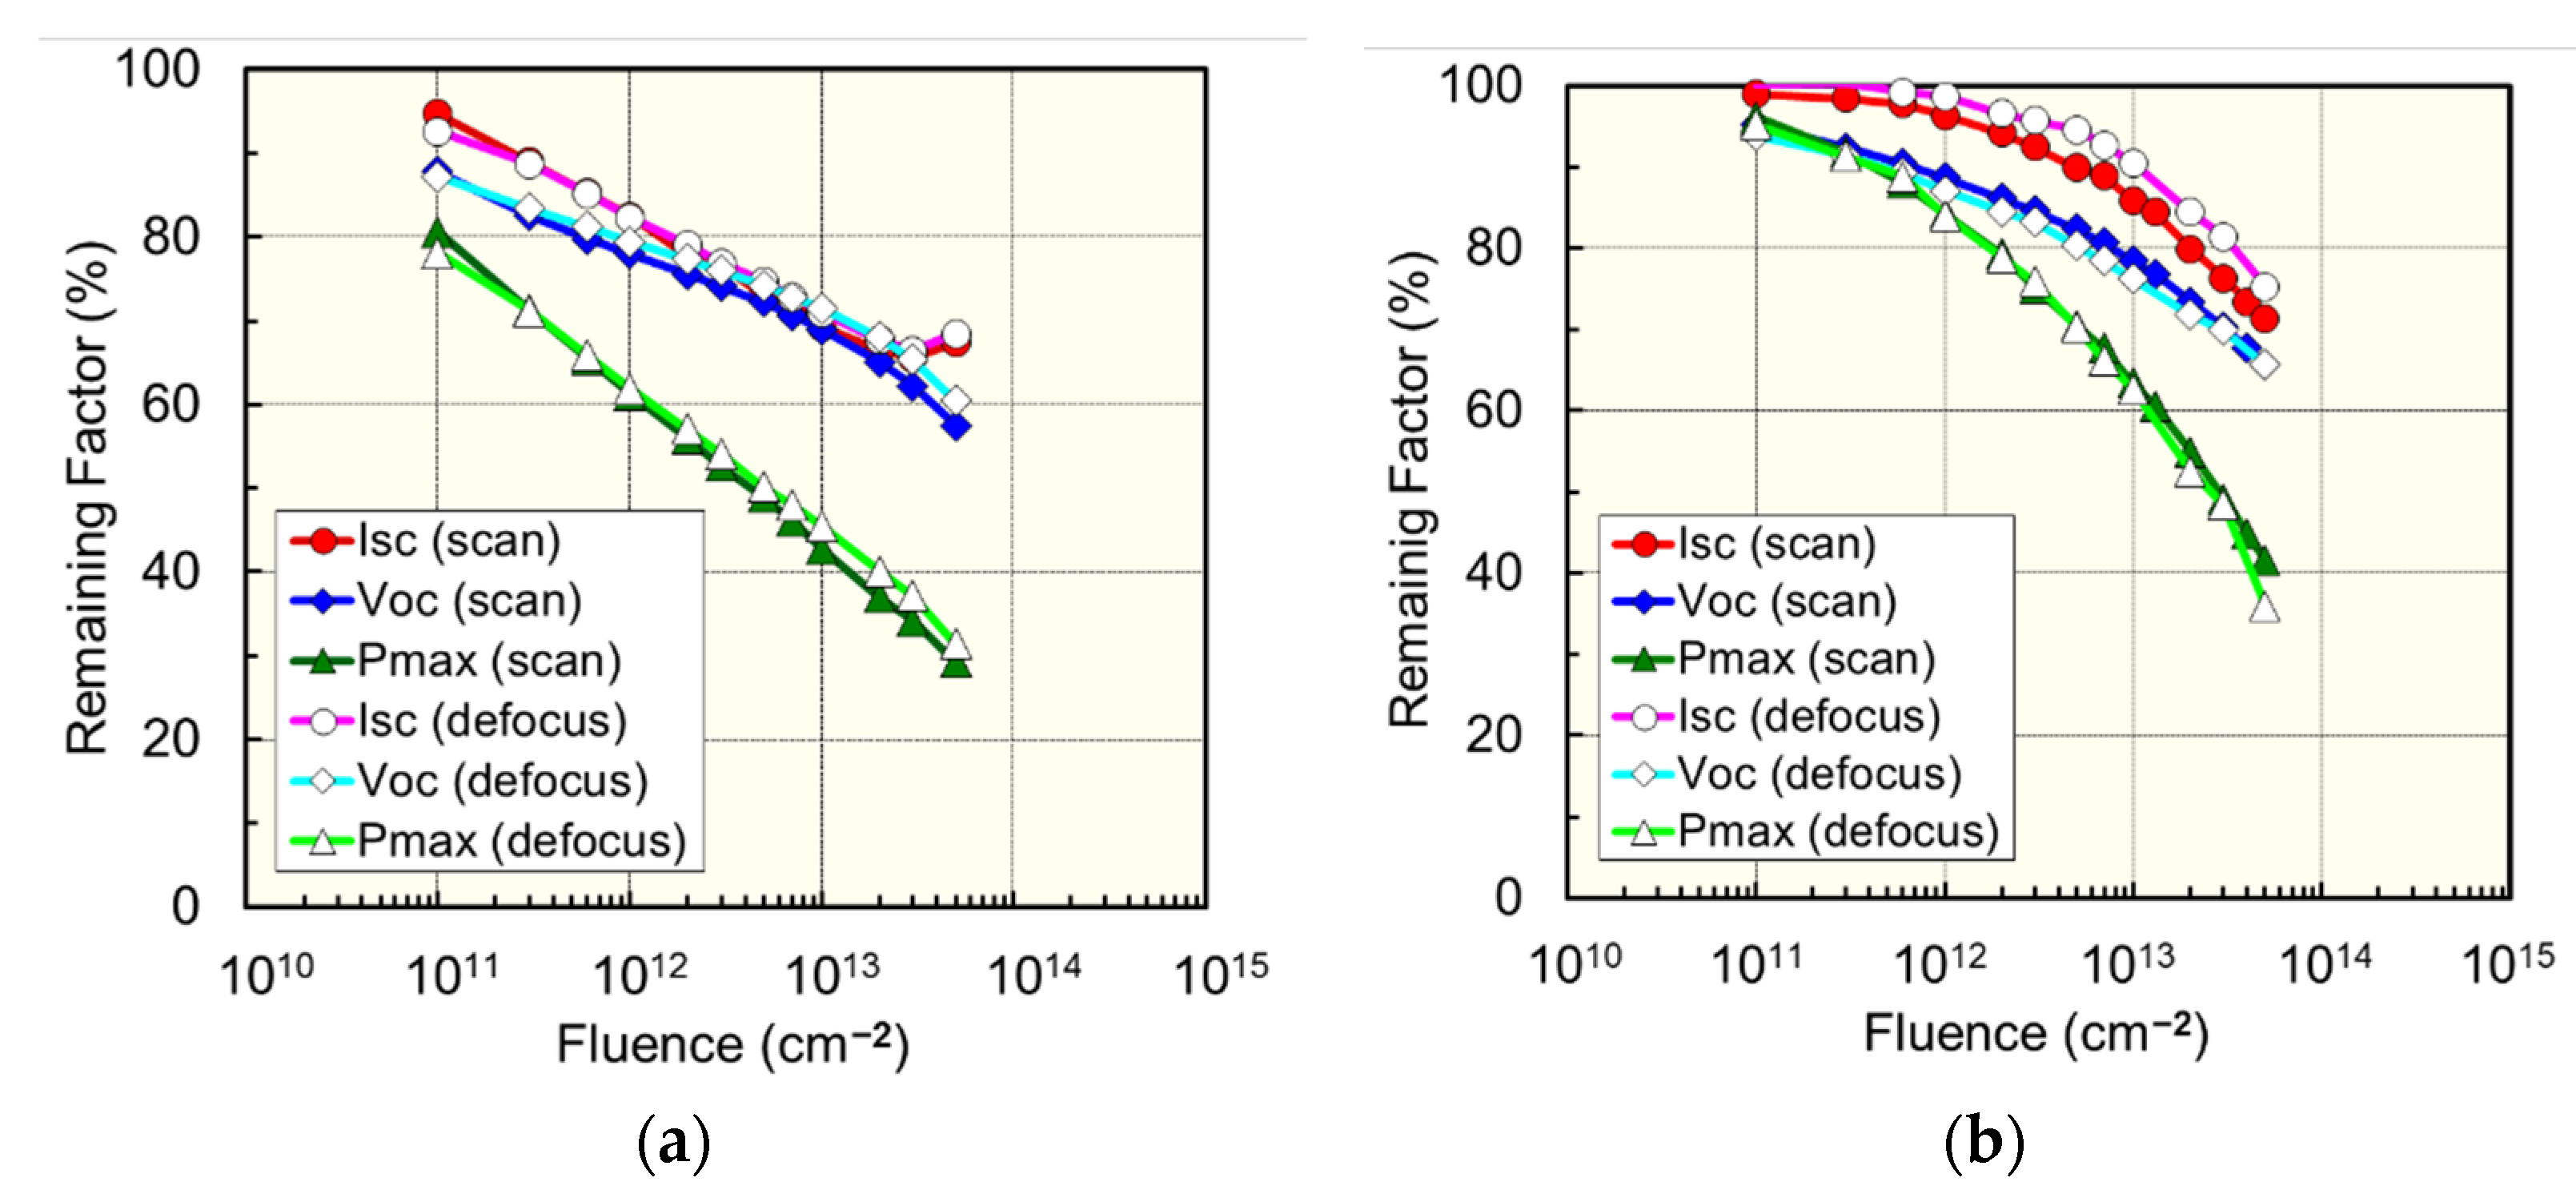
Figure 10 compares the radiation degradation trends of Isc, Voc, and Pmax with scanned (solid symbols) and the defocused (open symbols) beams on the (a) Si and (b) 3J solar cells due to 10 MeV protons. All the degradations in the remaining factors are nearly the same except for Isc of the 3J solar cell. However, the degradation of Pmax, the product of current and voltage, of the 3J cell does not differ between the scan and defocus results. We conclude that the discrepancy in the Isc degradation is insignificant. The Isc of Si solar cell shows an anomalous increase at the last fluence point of 5.0 × 1013 cm−2. This phenomenon can be seen right before a catastrophic degradation of a solar cell [10,11,12]. Thus, it is an indication of the life of the Si solar cell in terms of radiation degradation.
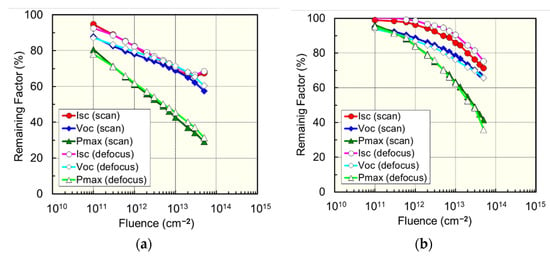
Figure 10.
Comparison of degradation characteristics of short-circuit current (Isc), open-circuit voltage (Voc), and maximum power (Pmax) of (a) high-efficiency silicon and (b) InGaP/GaAs/Ge triple-junction solar cells by irradiations with scanned and defocused 10 MeV proton beams.
Figure 11 and Figure 12 present the degradation of LIV characteristics due to (a) 50 and (b) 100 keV protons with scanned and defocused beams for the Si and 3J solar cells, respectively. The fluence was 1.0 × 1012 cm−2 for both energies. Two samples were used for each condition. In Figure 10a and 11a,b, one result indicates different degradations, but the other three results show almost the same degradation. Therefore, the different degradations of the three solar cells are not thought to be caused by the difference in the beam-area expansion technique. Figure 10 shows that 50 keV protons inflicted greater damage on the Si solar cell than 100 keV protons because the 50 keV protons stop at shallower position in the Si solar cell and create dense defects there. The p–n junction where most photocarriers are generated is located below ~0.5 μm from the surface. Therefore, 50 keV protons induce greater degradation especially on the photocurrent.
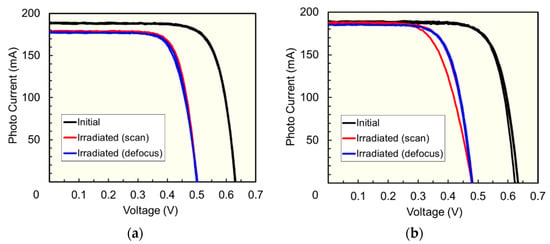
Figure 11.
Light current–voltage characteristics of high-efficiency silicon solar cell before and after (a) 50 and (b) 100 keV proton irradiation with the fluence of 1.0 × 1012 cm−2. The beam-area expansion techniques for red and blue curves are scanning and defocusing, respectively.
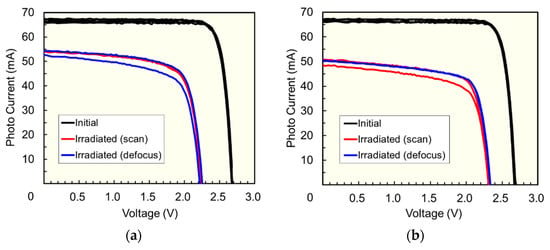
Figure 12.
Light current–voltage characteristics of InGaP/GaAs/Ge triple-junction solar cell before and after (a) 50 and (b) 100 keV proton irradiation with the fluence of 1.0 × 1012 cm−2. The beam-area expansion techniques for red and blue curves are scanning and defocusing, respectively.
The results led us to conclude that there is little difference in solar cell performance degradation between the two beam-area expansion techniques of scanning and defocusing, suggesting that the intense spot beam in the scanning method has no significant influence. We can use either technique for a radiation test of solar cells.
4. Summary
This study investigated the effects of two typical beam conditions in a space solar cell radiation test, the fluence rate, and beam-area expansion techniques (scanning and defocusing) on radiation degradation. Both high-efficiency silicon and InGaP/GaAs/Ge triple-junction solar cells were employed in this study. The 10 MeV protons and 1 MeV electrons were applied with different fluence rates. In addition, low-energy (50–150 keV) protons were irradiated to the triple-junction solar cell to understand the effects of localized damage on its stacked structure. All the results confirmed that the fluence rate did not affect the degradation of output performance of the two kinds of solar cell. However, cell temperature during the irradiation influenced the degradation of the silicon solar cell, a greater degradation arising from higher temperatures. Thus, sample temperature is an essential factor to be controlled in irradiation tests. High- (10 MeV) and low-energy (50 and 100 keV) protons were used with the two beam-area expansion techniques. The two sets of results proved that the radiation degradation is same regardless of the beam-area expansion technique. The obtained information will be reflected in the international standard on radiation test methods for space solar cells.
Author Contributions
Conceptualization, M.I., T.O. and Y.I.; methodology, M.I., Y.Y., K.S. and Y.I.; validation, M.I. and K.S.; formal analysis, M.I.; investigation, M.I. and T.O.; resources, M.I.; data curation, M.I.; writing—original draft preparation, M.I.; writing—review and editing, T.O., Y.Y. and K.S.; visualization, M.I. and Y.Y.; supervision, T.O. and K.S.; project administration, M.I.; funding acquisition, M.I. All authors have read and agreed to the published version of the manuscript.
Funding
This research received no external funding.
Acknowledgments
We would like to express our sincere appreciation to M. Saito of the Advanced Engineering Services Co., Ltd. for his tremendous contribution to the irradiation experiments. We would also like to thank the members of the space photovoltaics community for many fruitful discussions.
Conflicts of Interest
The authors declare no conflict of interest.
References
- Jenkins, P.; Scheiman, D.; Goodbody, C.; Baur, C.; Sharps, P.; Imaizumi, M.; Yoo, H.; Sahlstrom, T.; Walters, R.; Lorentzen, J.; et al. Results from an International Measurement Round Robin of III-V Triple-Junction Solar Cells under Air Mass Zero. In Proceedings of the 2006 IEEE 4th World Conference on Photovoltaic Energy Conference, Waikoloa, HI, USA, 7–12 May 2006; pp. 1968–1970. [Google Scholar] [CrossRef]
- International Standard: IS23038, “Space Systems—Space Solar Cells—Electron and Proton Irradiation Test Methods”; The International Organization for Standardization (ISO): Geneva, Switzerland, 2015.
- Ziegler, J.F. SRIM—The Stopping and Range of Ions in Matter. Available online: http://srim.org/ (accessed on 12 April 2020).
- Kurashima, S.; Satoh, T.; Saitoh, Y.; Yokota, W. Irradiation Facilities of the Takasaki Advanced Radiation Research Institute. Quantum Beam Sci. 2017, 1, 2. [Google Scholar] [CrossRef]
- Hatori, S.; Ishigami, R.; Kume, K.; Suzuki, K. Ion Accelerator facility of the Wakasa Wan Energy Research Center for the Study of Irradiation Effects on Space Electronics. Quantum Beam Sci. 2021, 5, 14. [Google Scholar] [CrossRef]
- Yuri, Y.; Miyawaki, N.; Kamiya, T.; Yokota, W.; Arakawa, K. Uniformization of the transverse beam profile by means of nonlinear focusing method. Phys. Rev. ST Accel. Beams 2007, 10, 104001. [Google Scholar] [CrossRef]
- Yuri, Y.; Yuyama, T.; Ishizaka, T.; Ishibori, I.; Okumura, S. Transformation of the Beam Intensity Distribution and Formation of a Uniform Ion Beam by Means of Nonlinear Focusing. Plasma Fusion Res. 2014, 9, 4406106. [Google Scholar] [CrossRef]
- Yuri, Y.; Fukuda, M.; Yuyama, T. Formation of hollow ion beams of various shapes using multipole magnets. Prog. Theor. Exp. Phys. 2019, 2019, 053G01. [Google Scholar] [CrossRef]
- Saito, M.; Imaizumi, M.; Ohshima, T.; Takeda, Y. Effects of irradiation beam conditions on radiation degradation of solar cells. In Proceedings of the 2010 35th IEEE Photovoltaic Specialists Conference, Honolulu, HI, USA, 20–25 June 2010; pp. 2616–2619. [Google Scholar] [CrossRef]
- Yamaguchi, M.; Taylor, S.J.; Yang, M.; Matsuda, S.; Kawasaki, O.; Hisamatsu, T. High-energy and high-fluence proton irradiation effects in silicon solar cells. J. Appl. Phys. 1996, 80, 4916. [Google Scholar] [CrossRef]
- Taylor, S.J.; Yamaguchi, M.; Yamaguchi, T.; Watanabe, S.; Ando, K.; Matsuda, S.; Hisamatsu, T.; Kim, S.I. Comparison of the effects of electron and proton irradiation on n+–p–p+ silicon diodes. J. Appl. Phys. 1998, 83, 4620. [Google Scholar] [CrossRef]
- Imaizumi, M.; Taylor, S.J.; Yamaguchi, M.; Ito, T.; Hisamatsu, T.; Matsuda, S. Analysis of structure change of Si solar cells irradiated with high fluence electrons. J. Appl. Phys. 1999, 85, 1916. [Google Scholar] [CrossRef]
Publisher’s Note: MDPI stays neutral with regard to jurisdictional claims in published maps and institutional affiliations. |
© 2021 by the authors. Licensee MDPI, Basel, Switzerland. This article is an open access article distributed under the terms and conditions of the Creative Commons Attribution (CC BY) license (https://creativecommons.org/licenses/by/4.0/).

