
High Energy Pulsed Laser Beam to Produce a Thin Layer of Crystalline Silver without Heating the Deposition Substrate and Its Catalytic Effects

 , , ,
, , , 
 , , , , and
Abstract
:1. Introduction
2. Materials and Methods
2.1. Materials
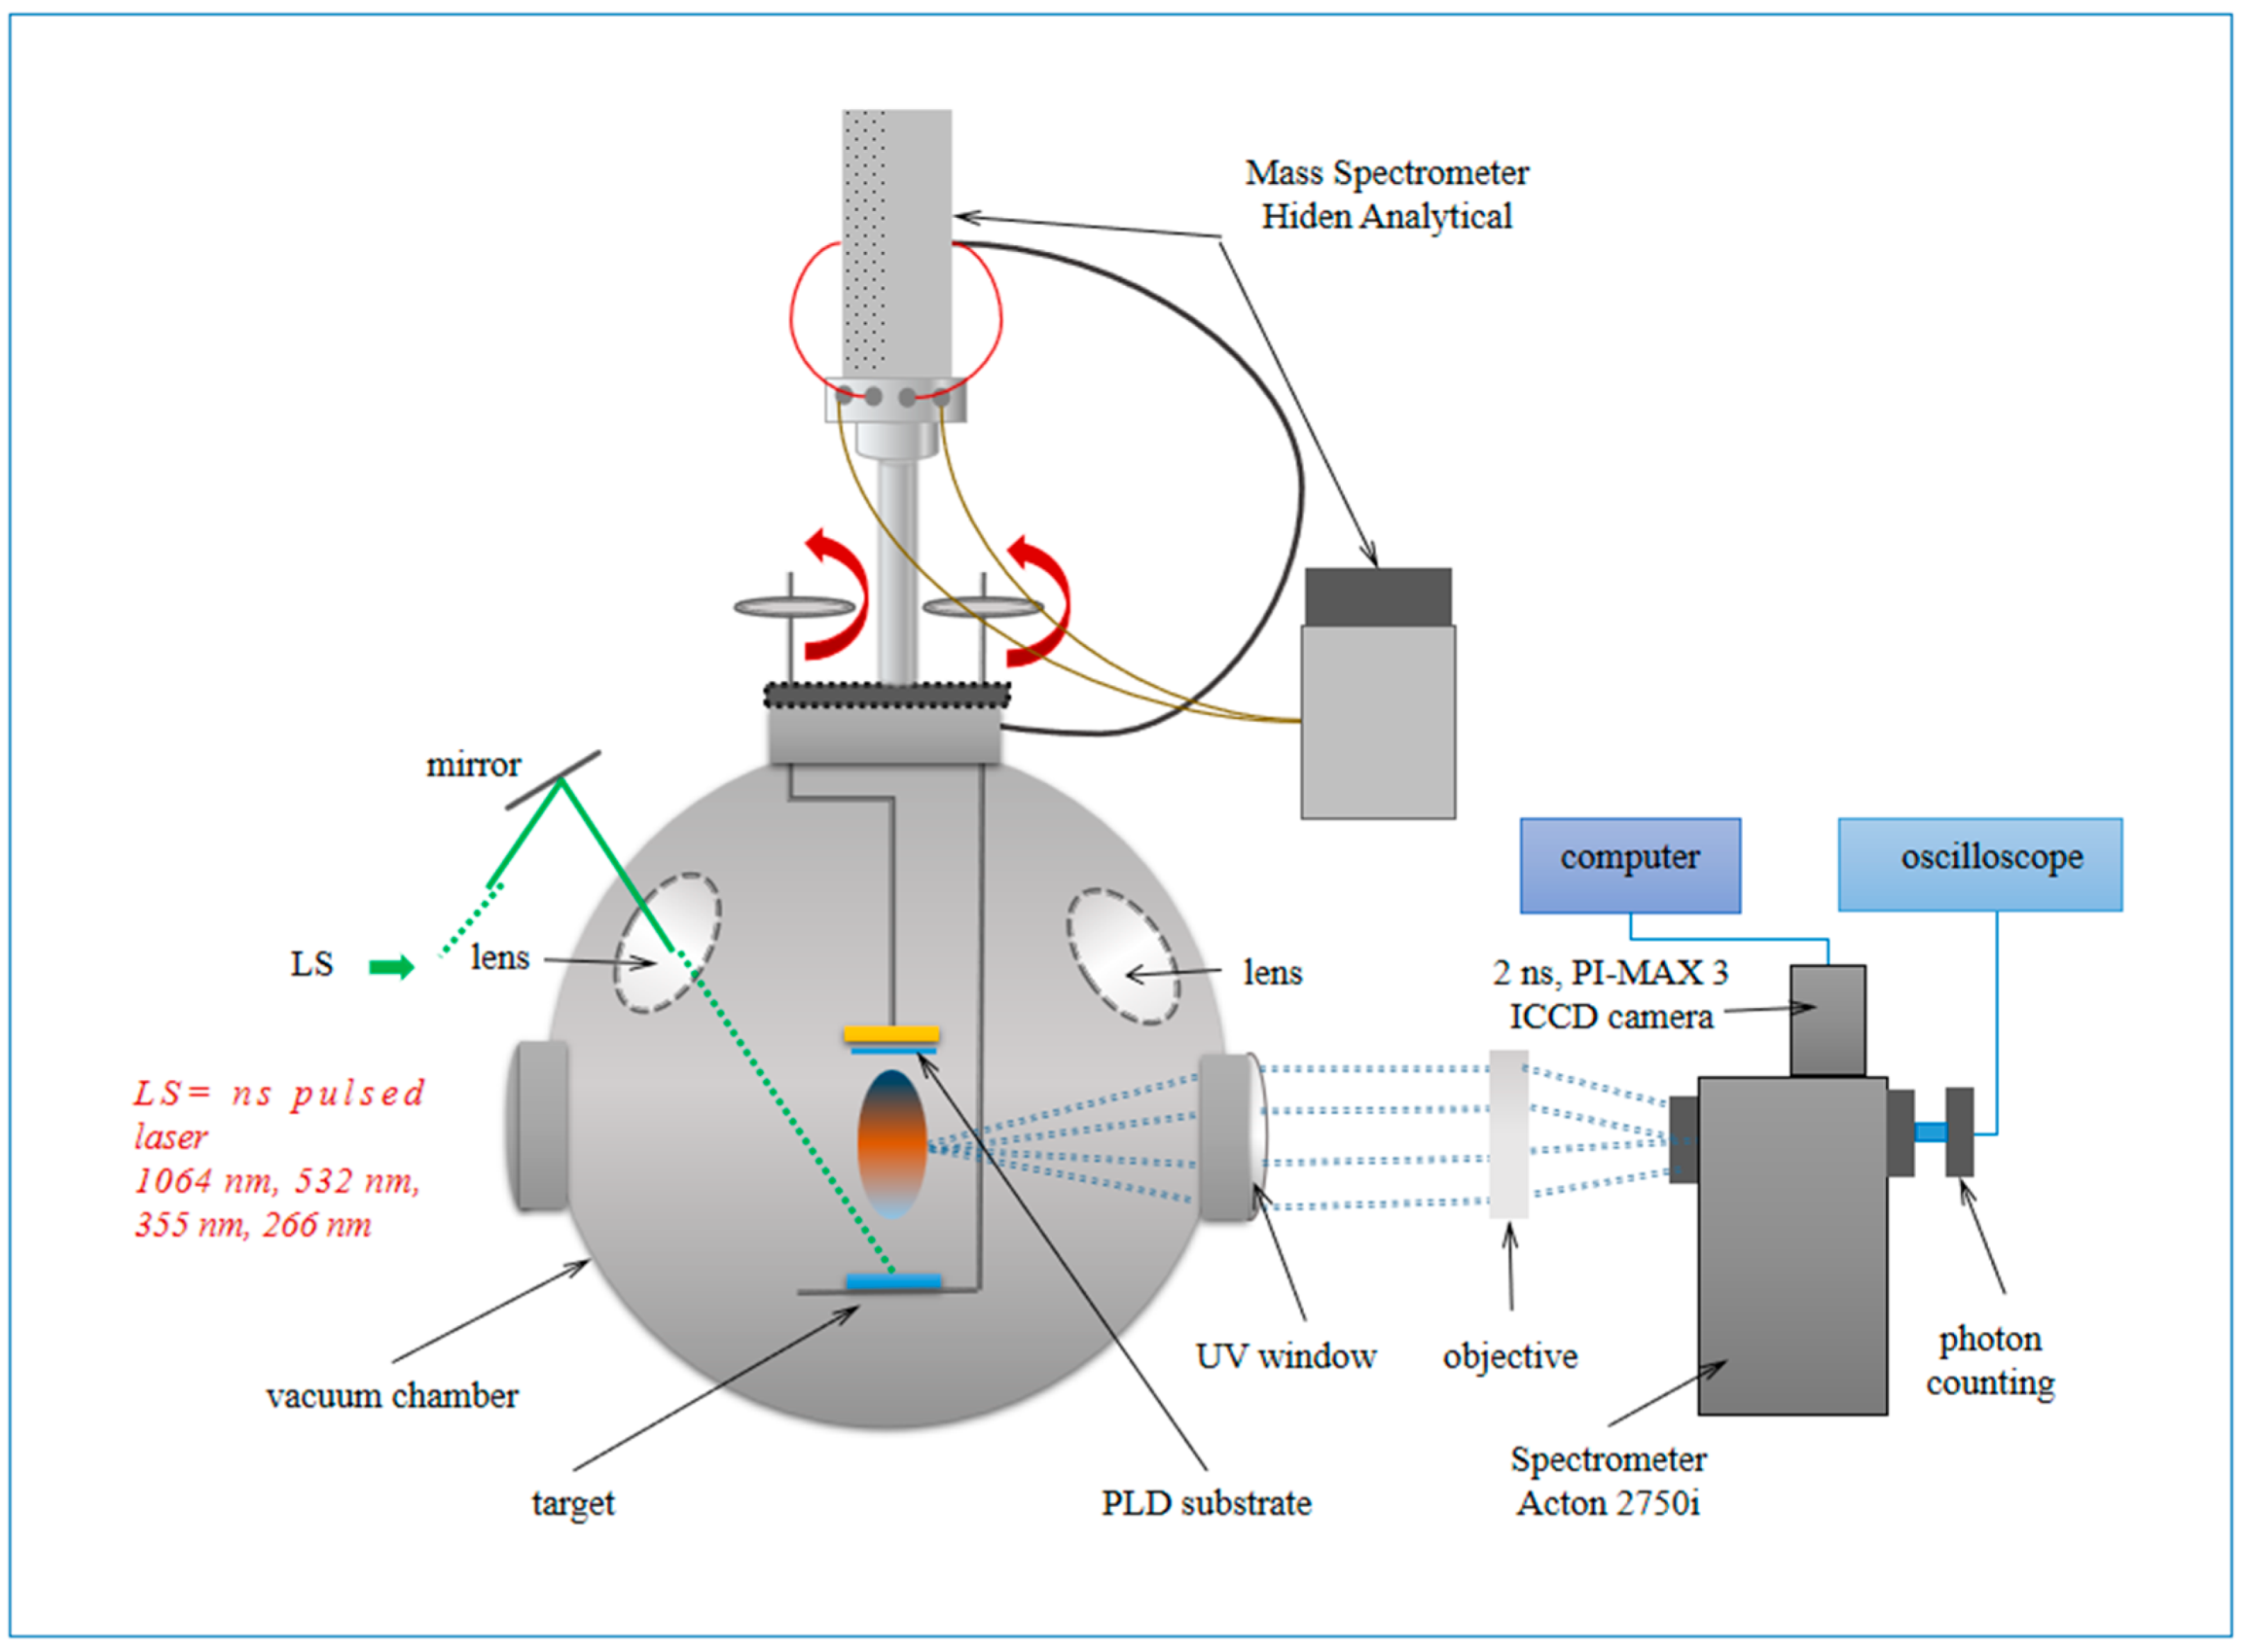
2.2. Method of Work
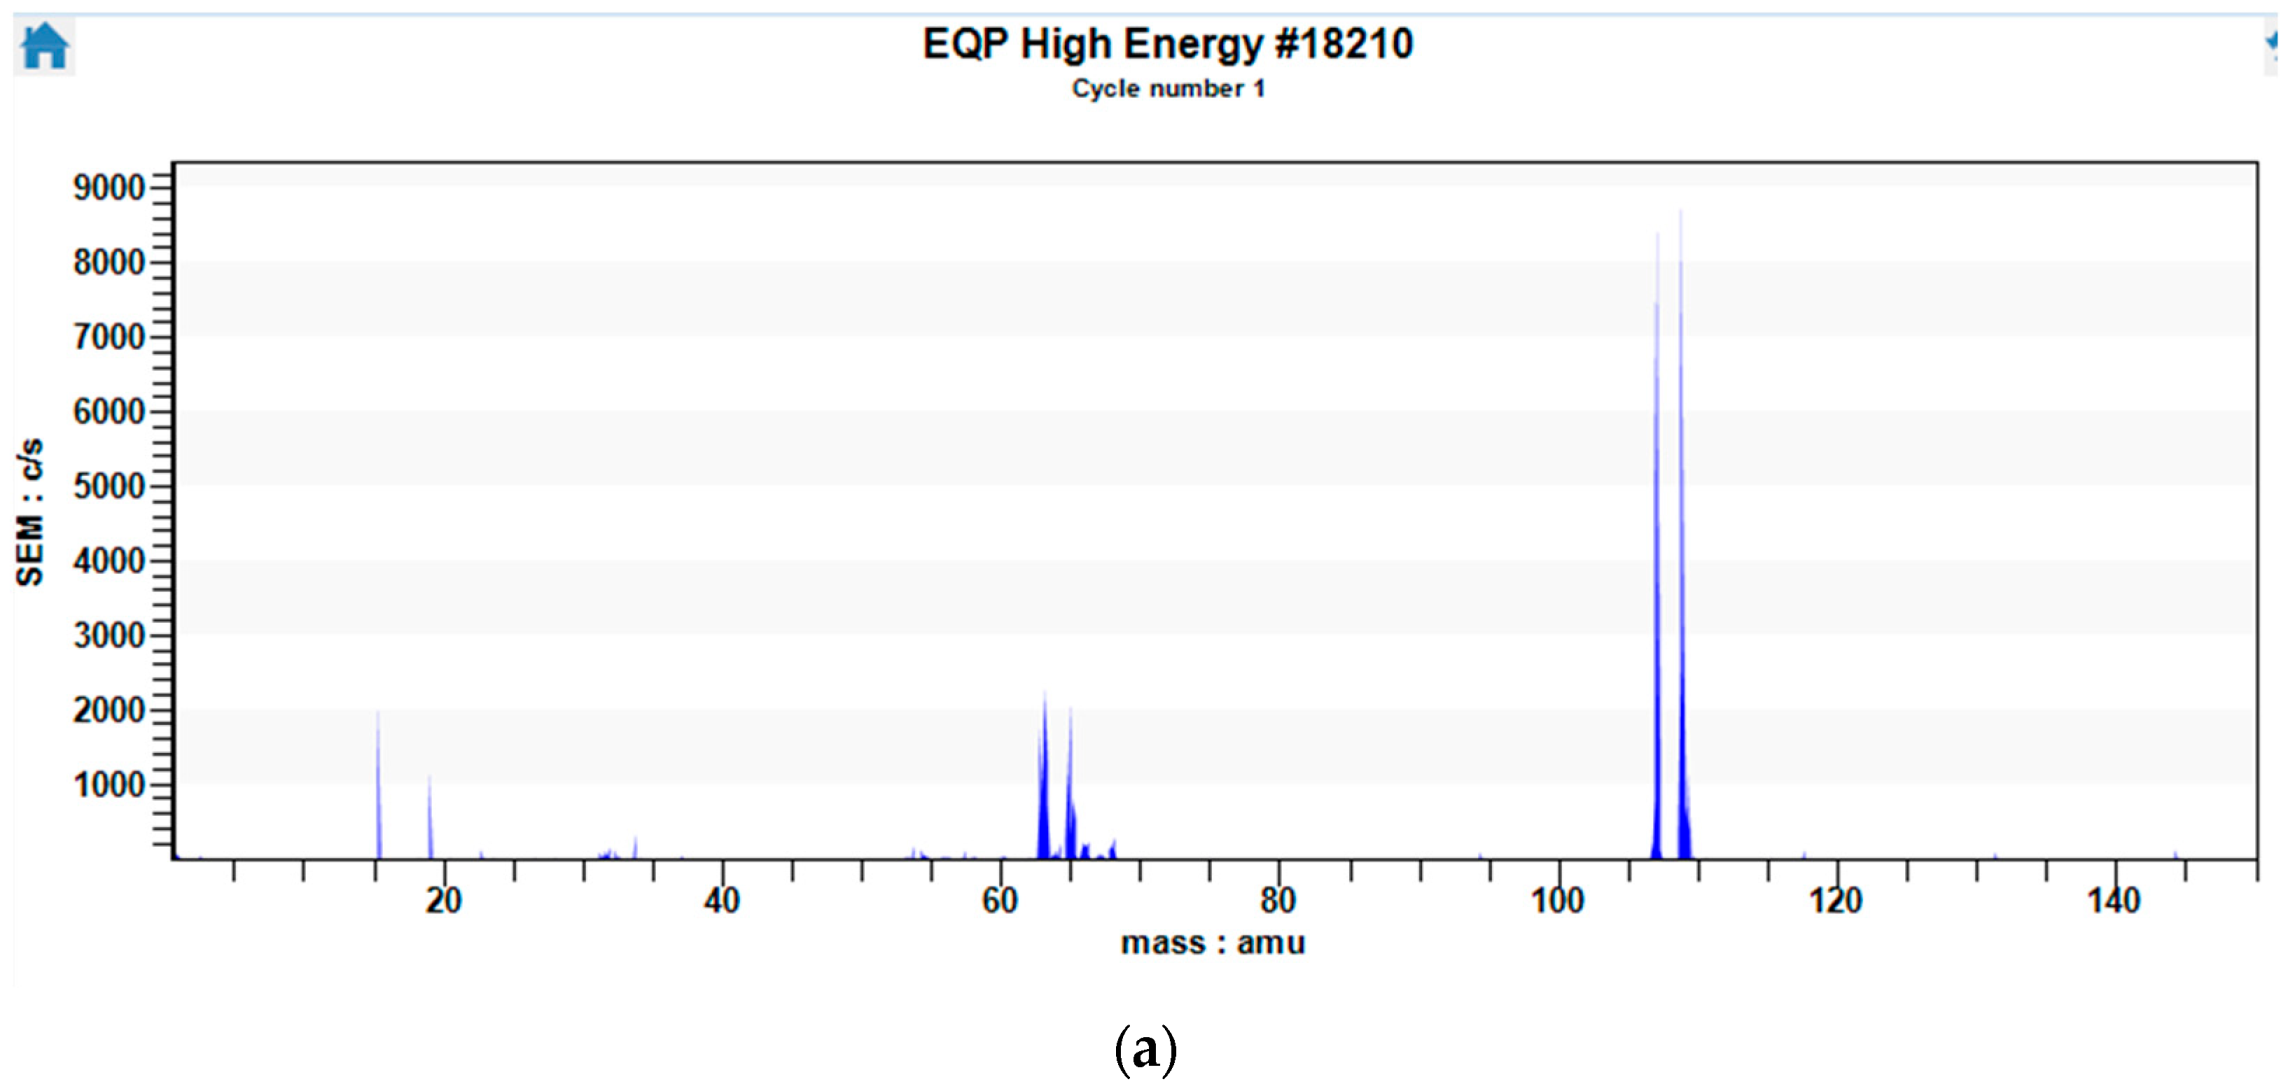
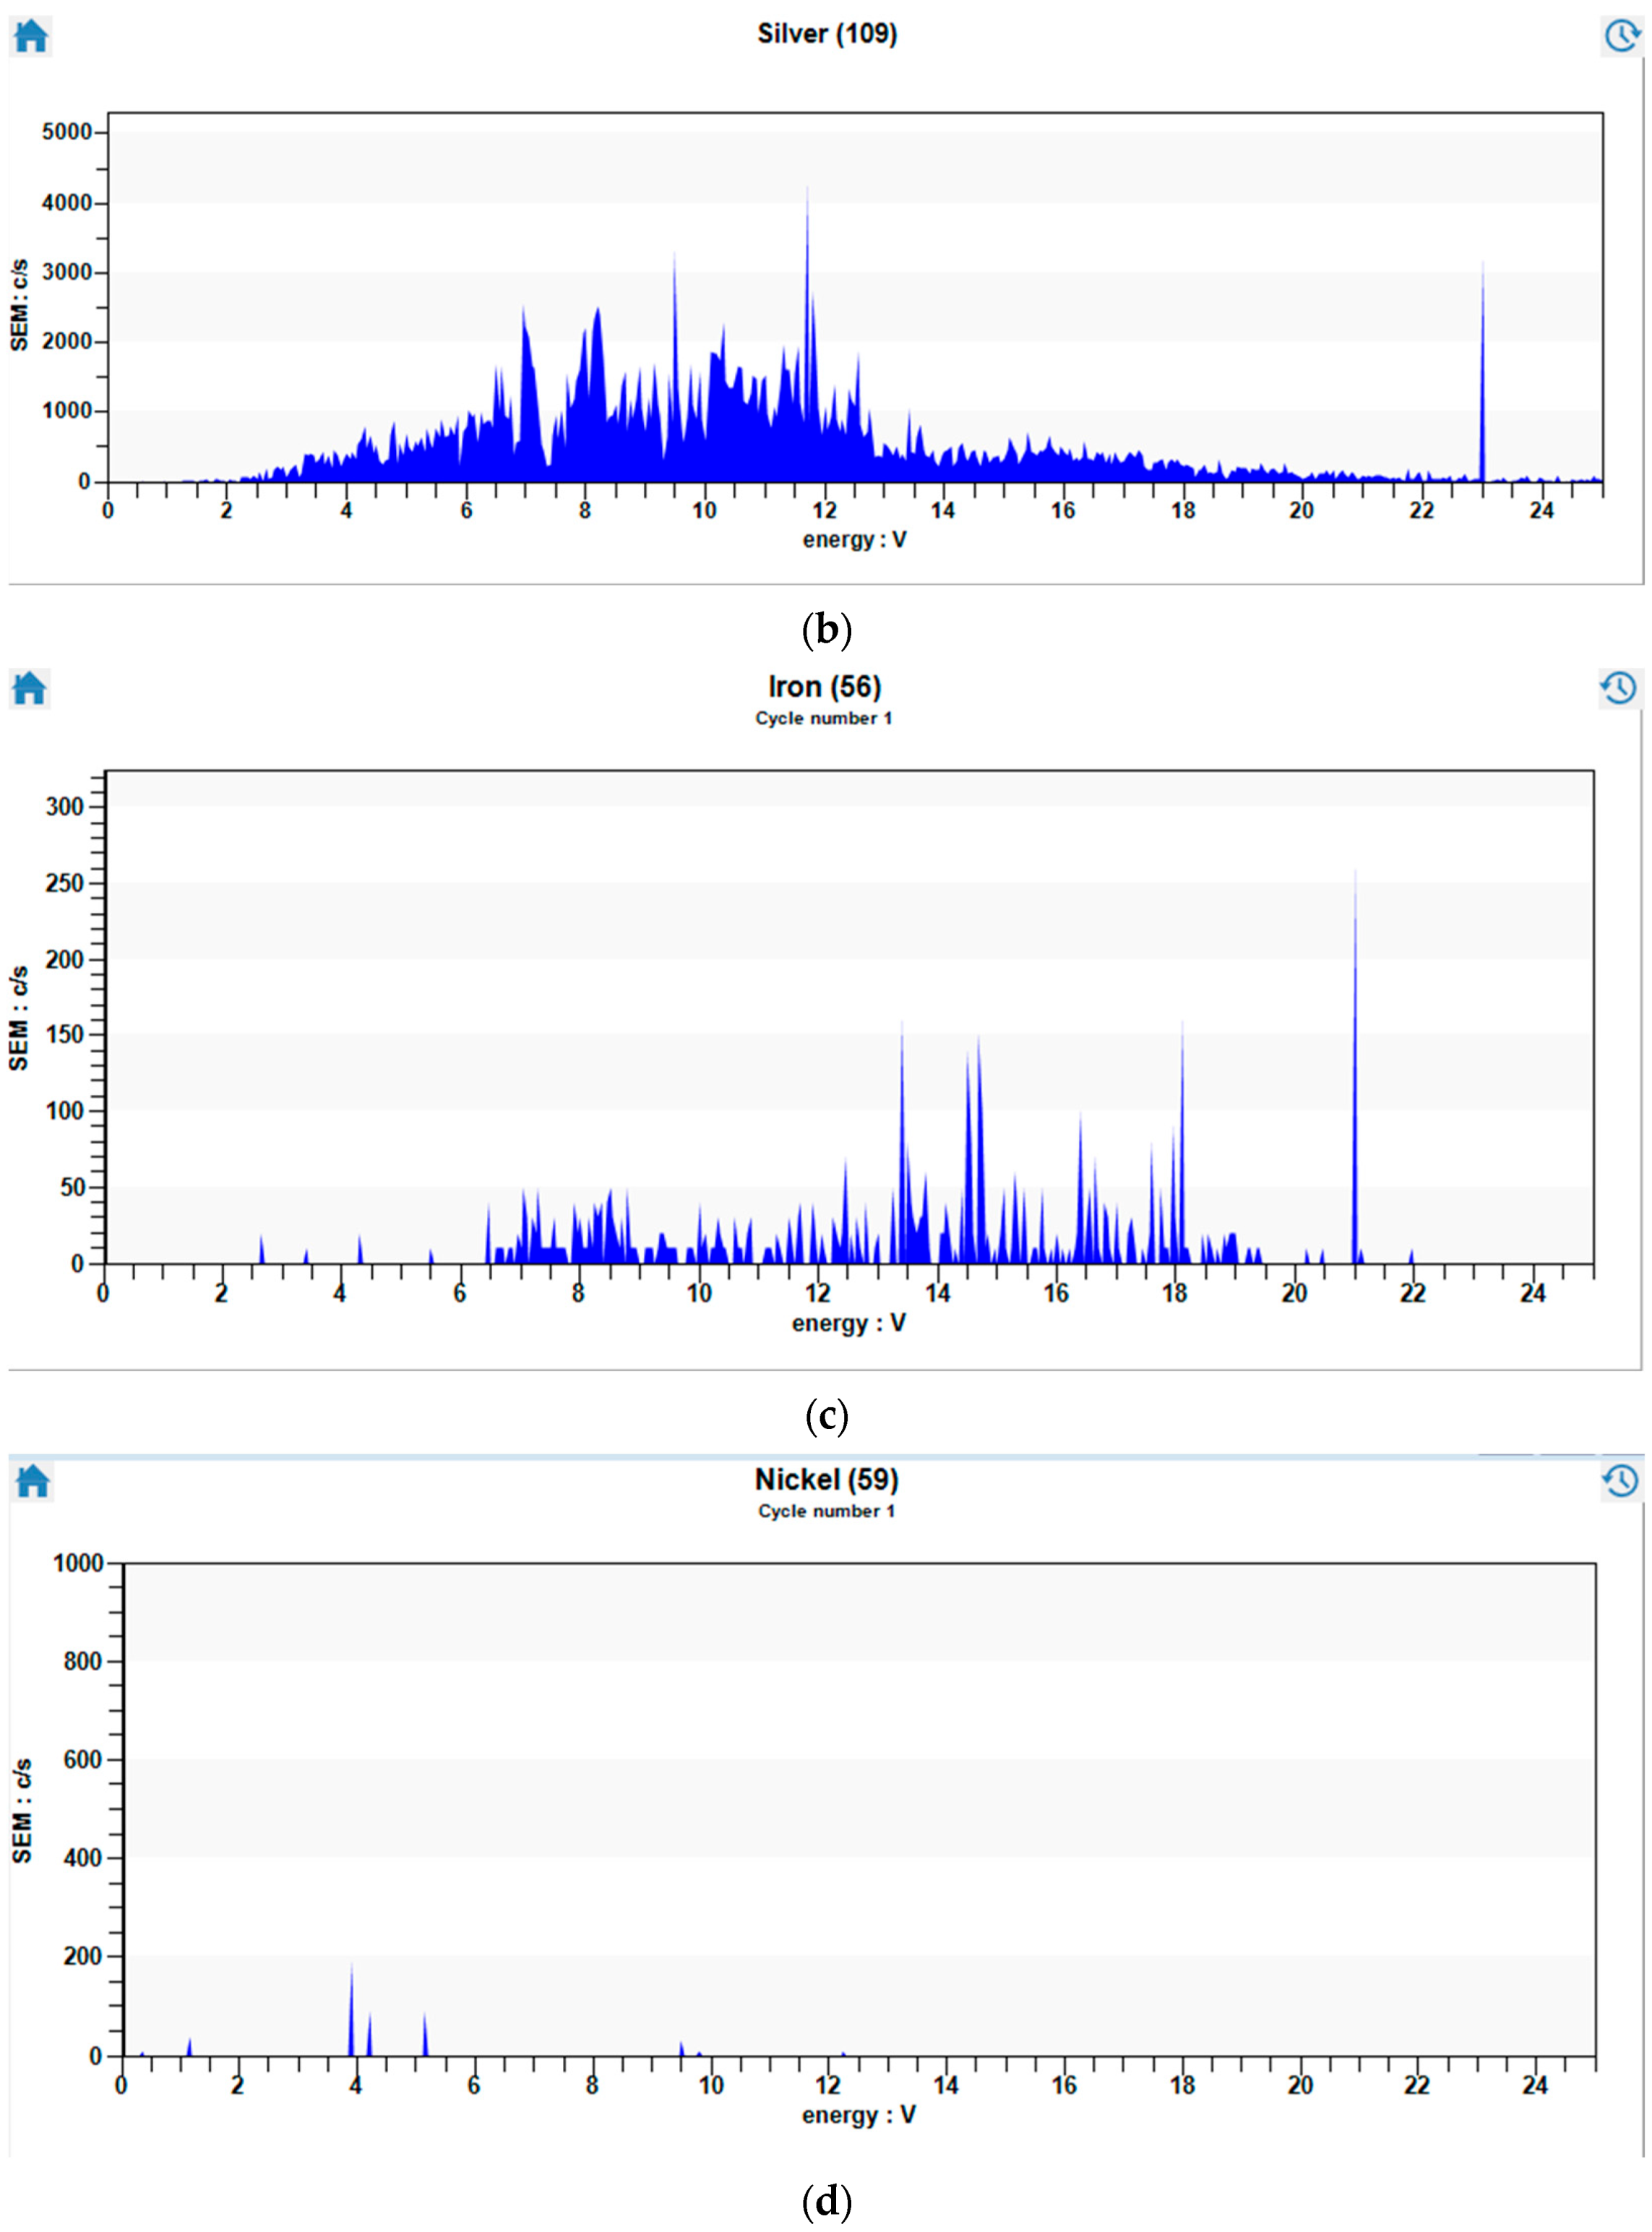
2.3. Methods of Analysis
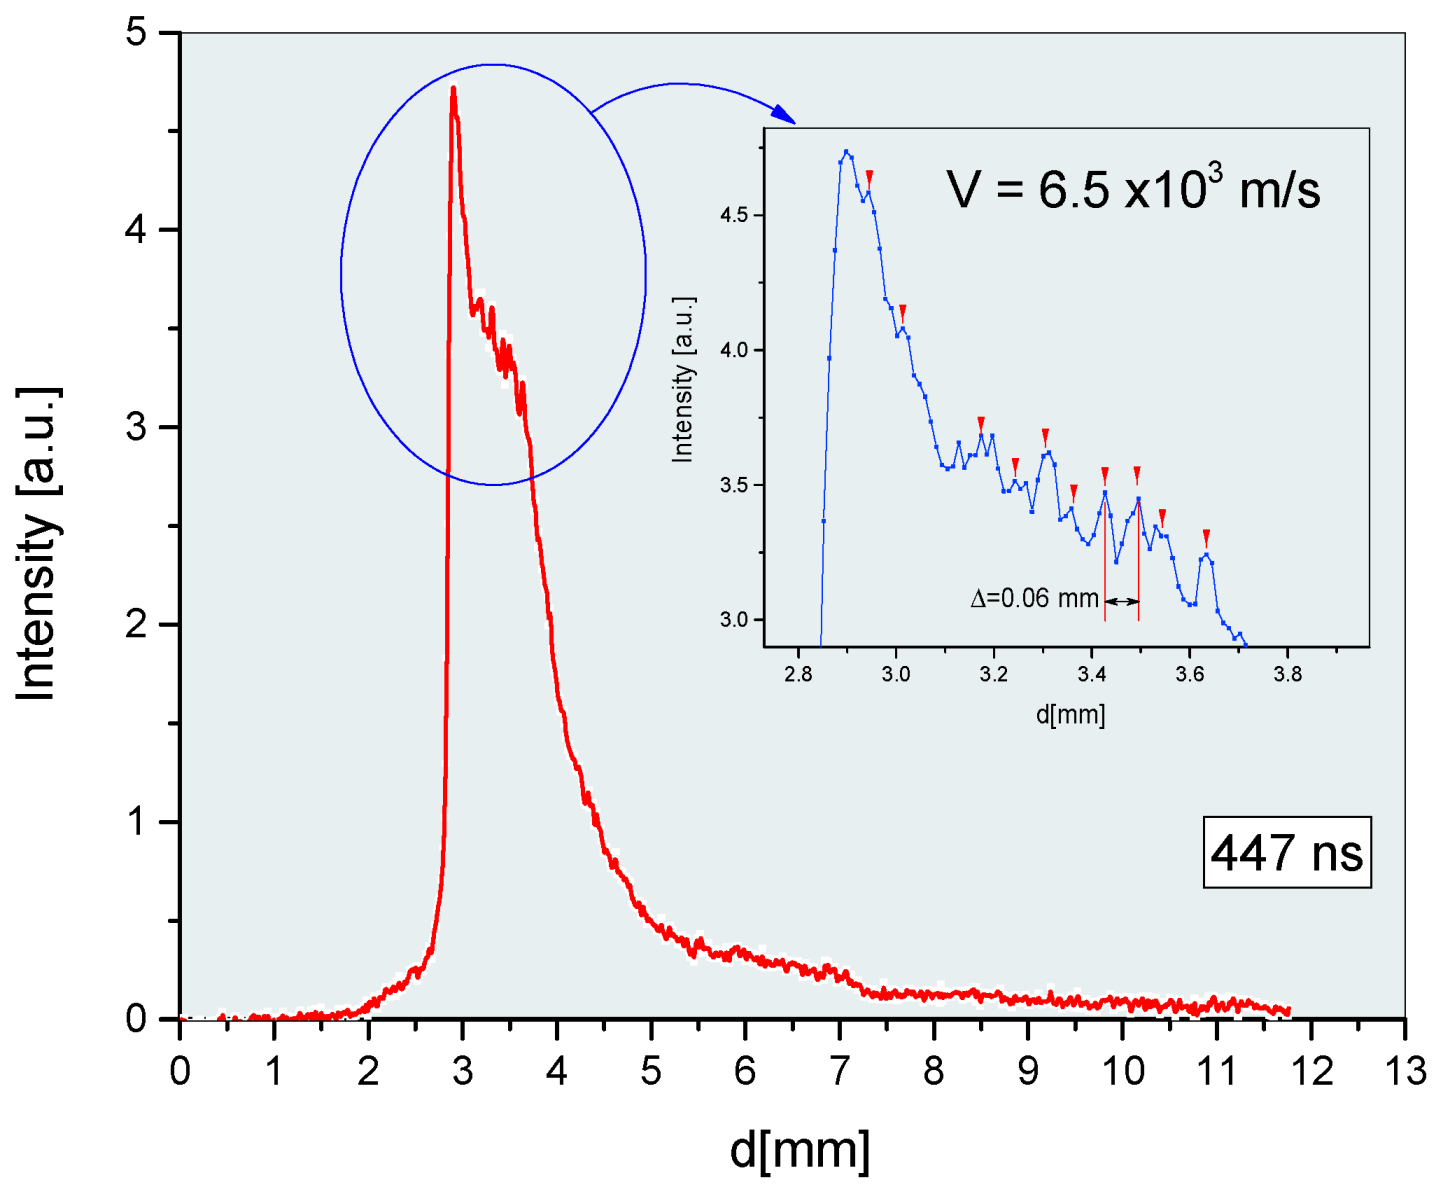
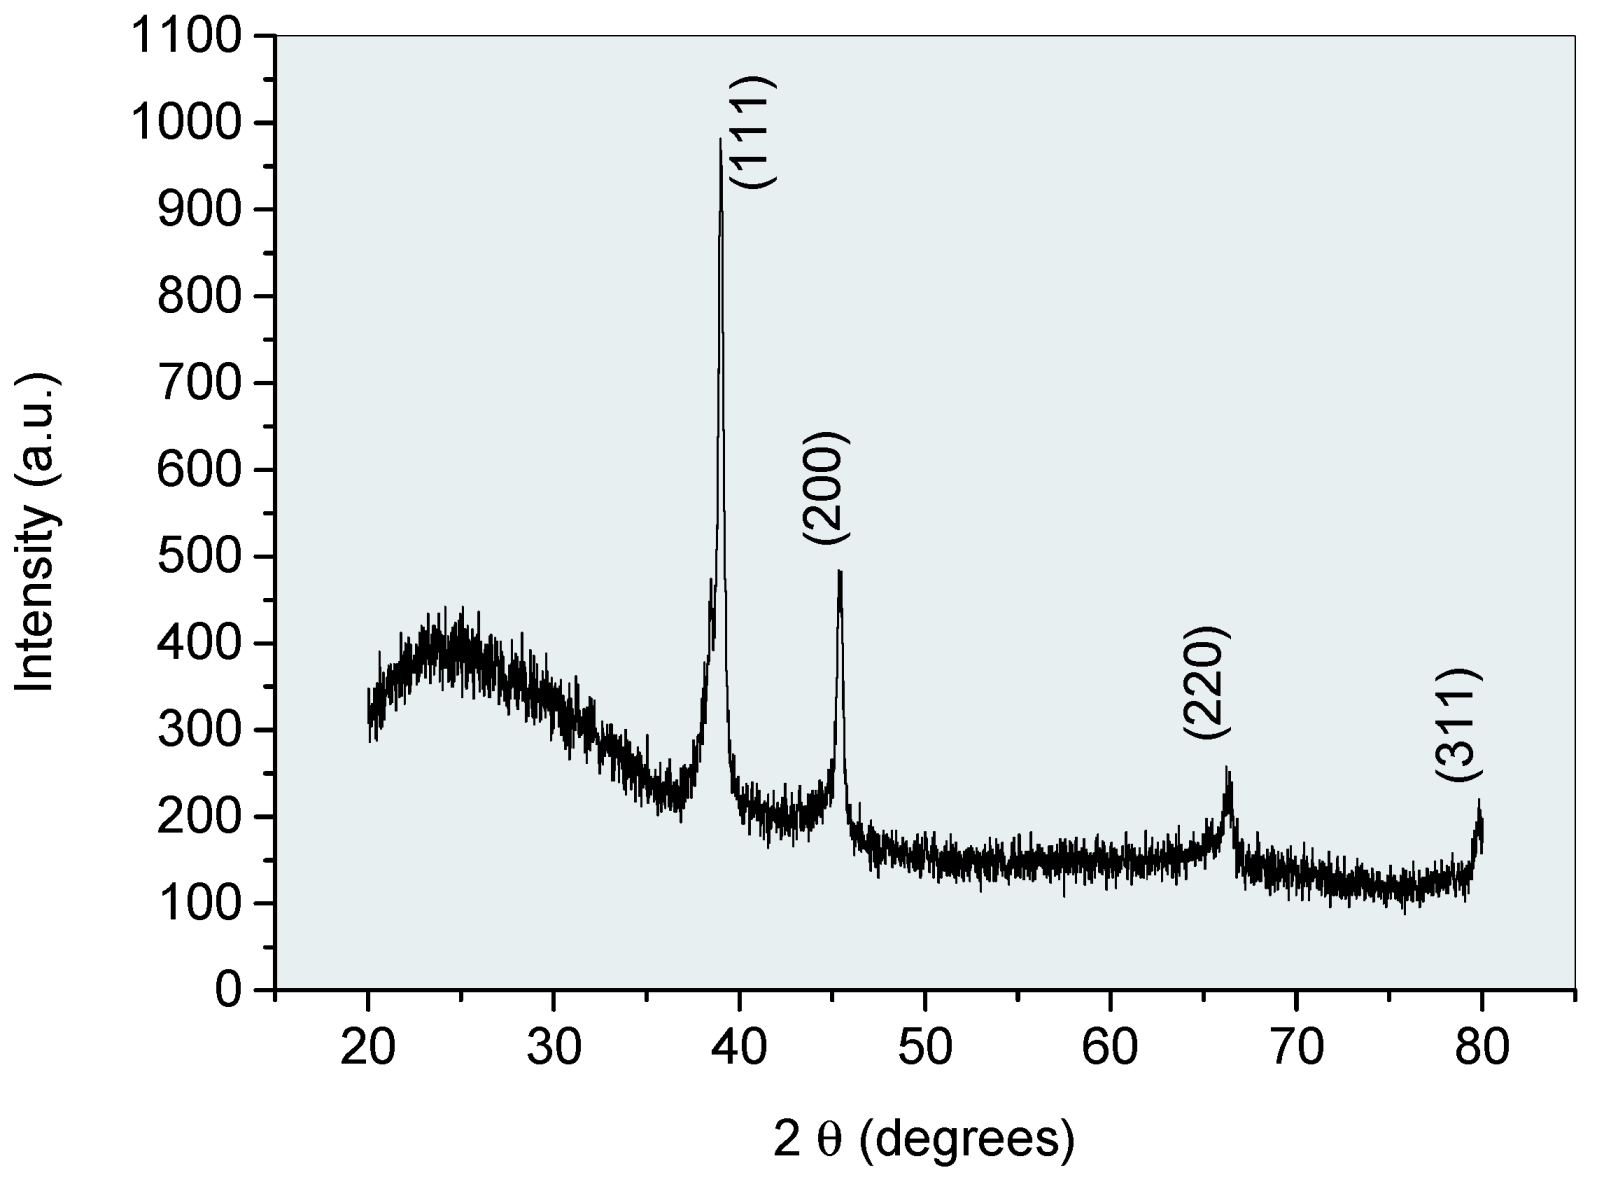
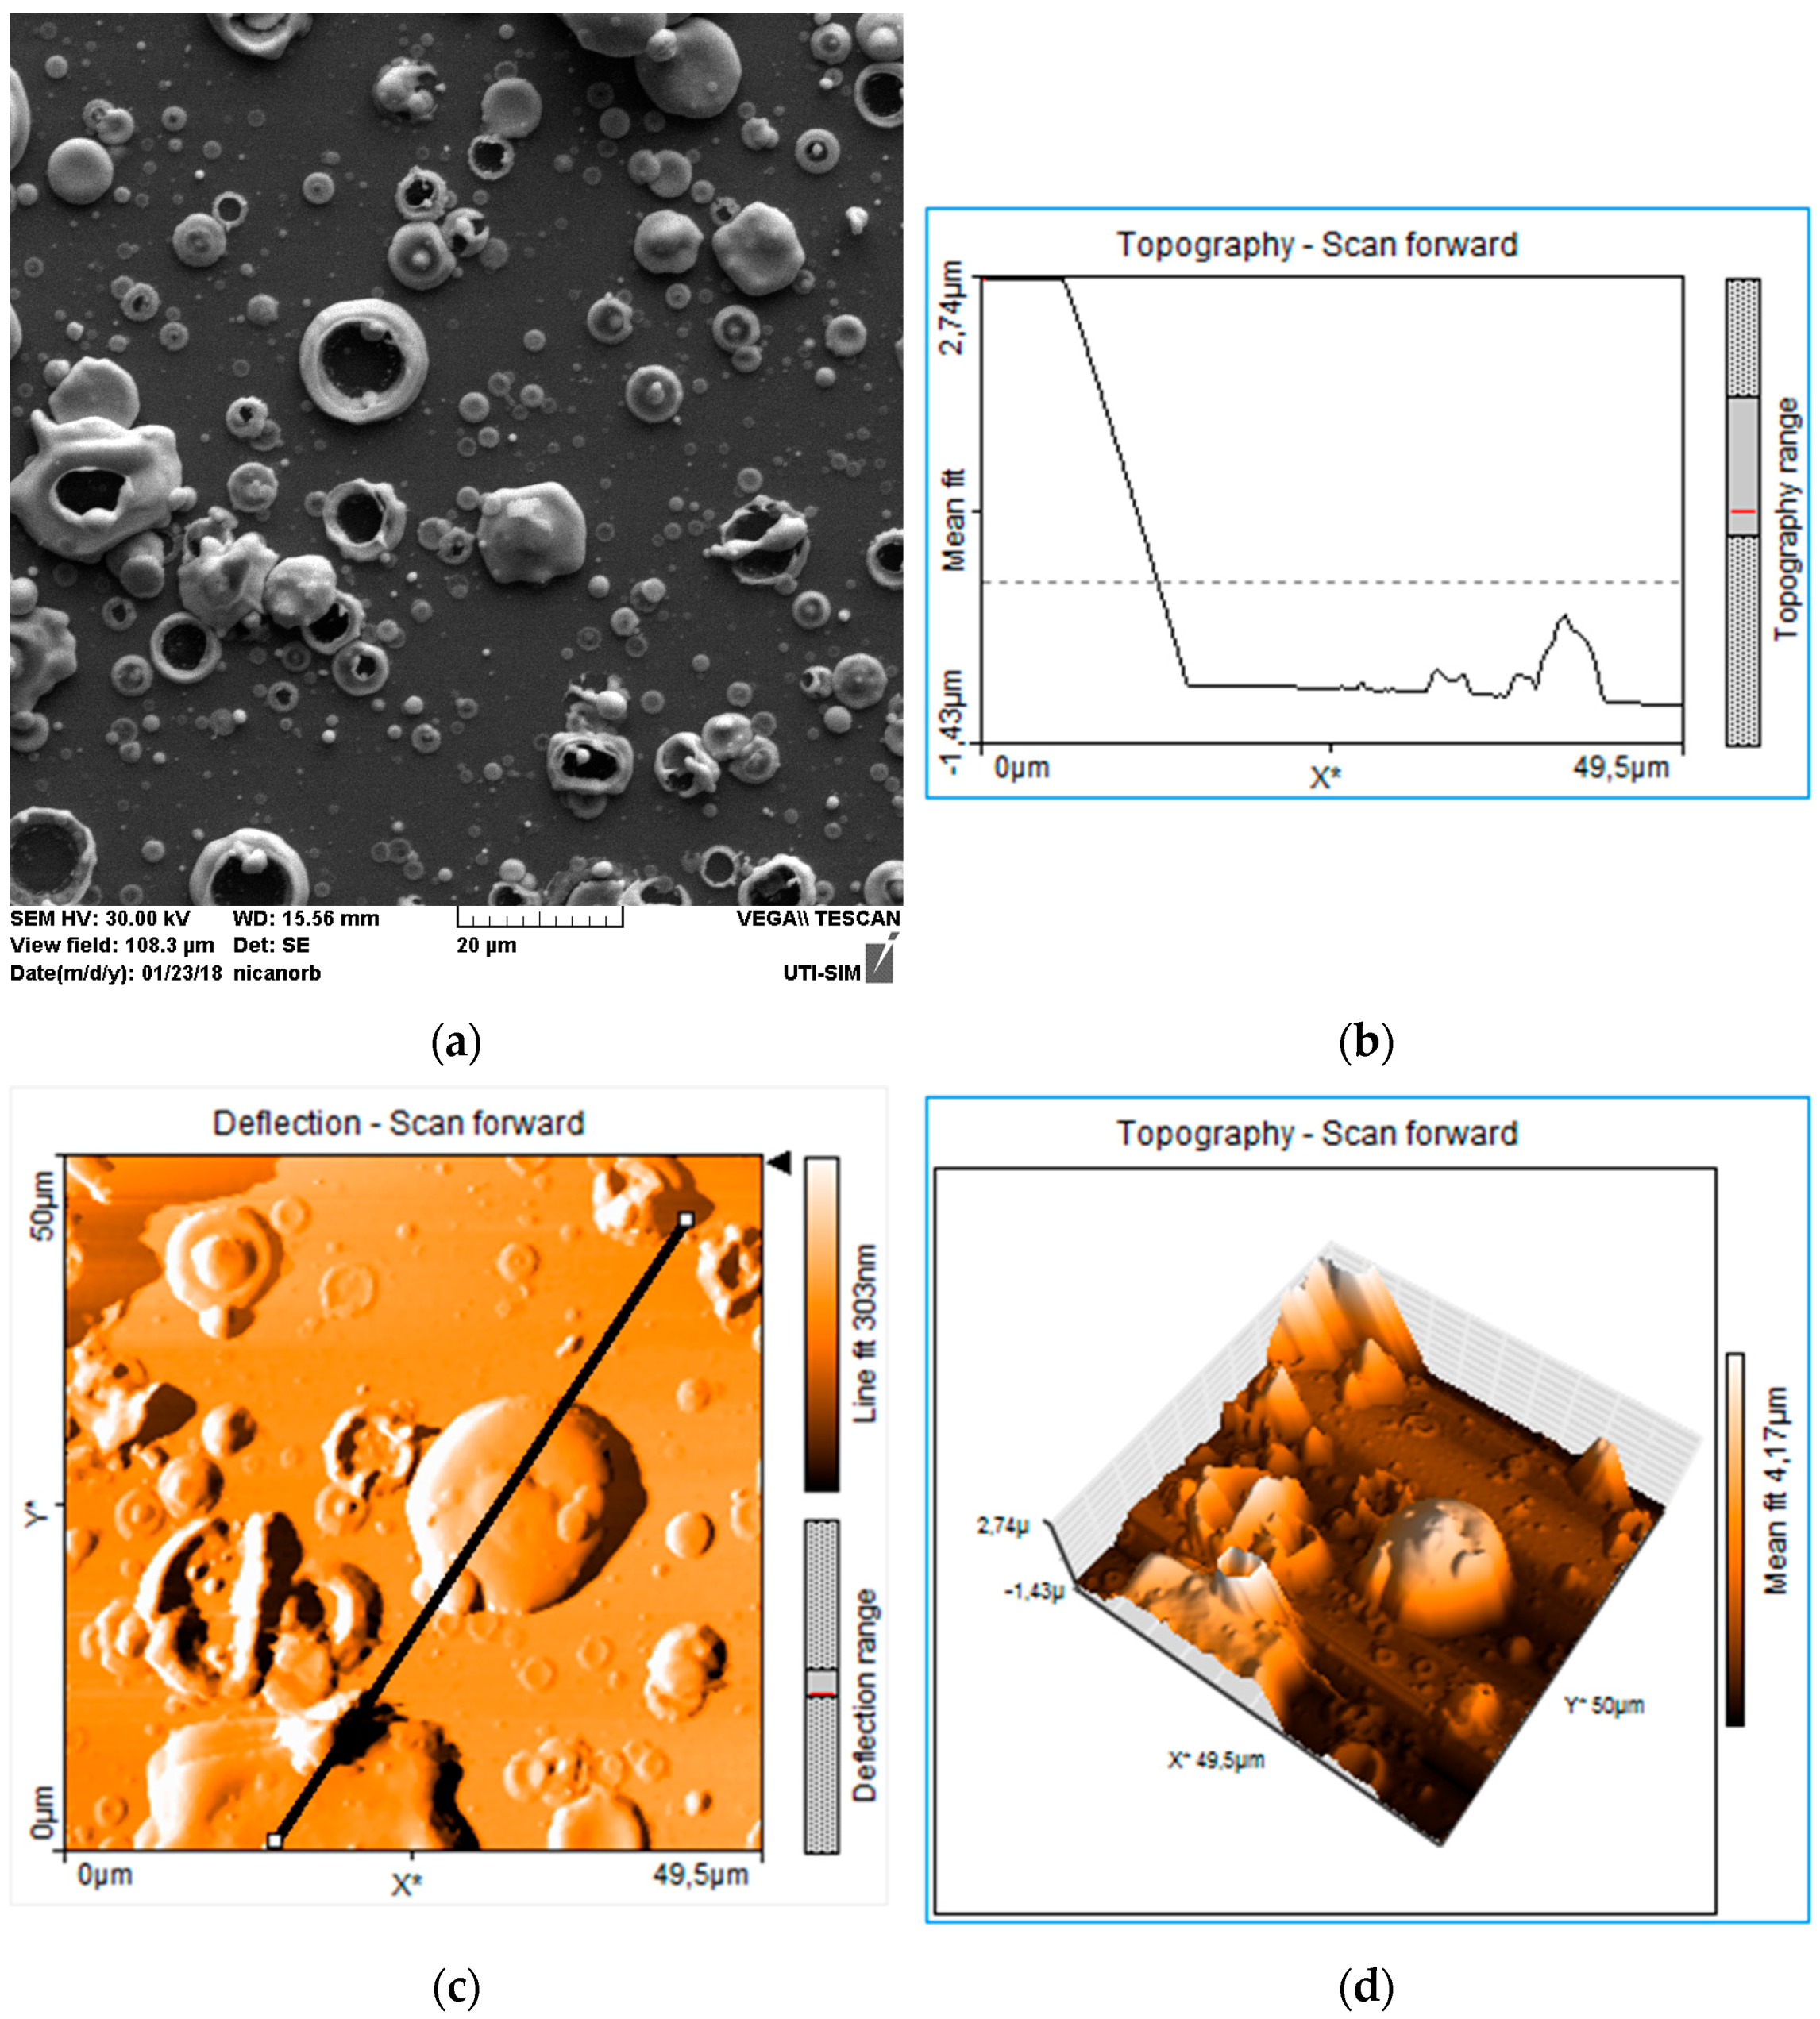
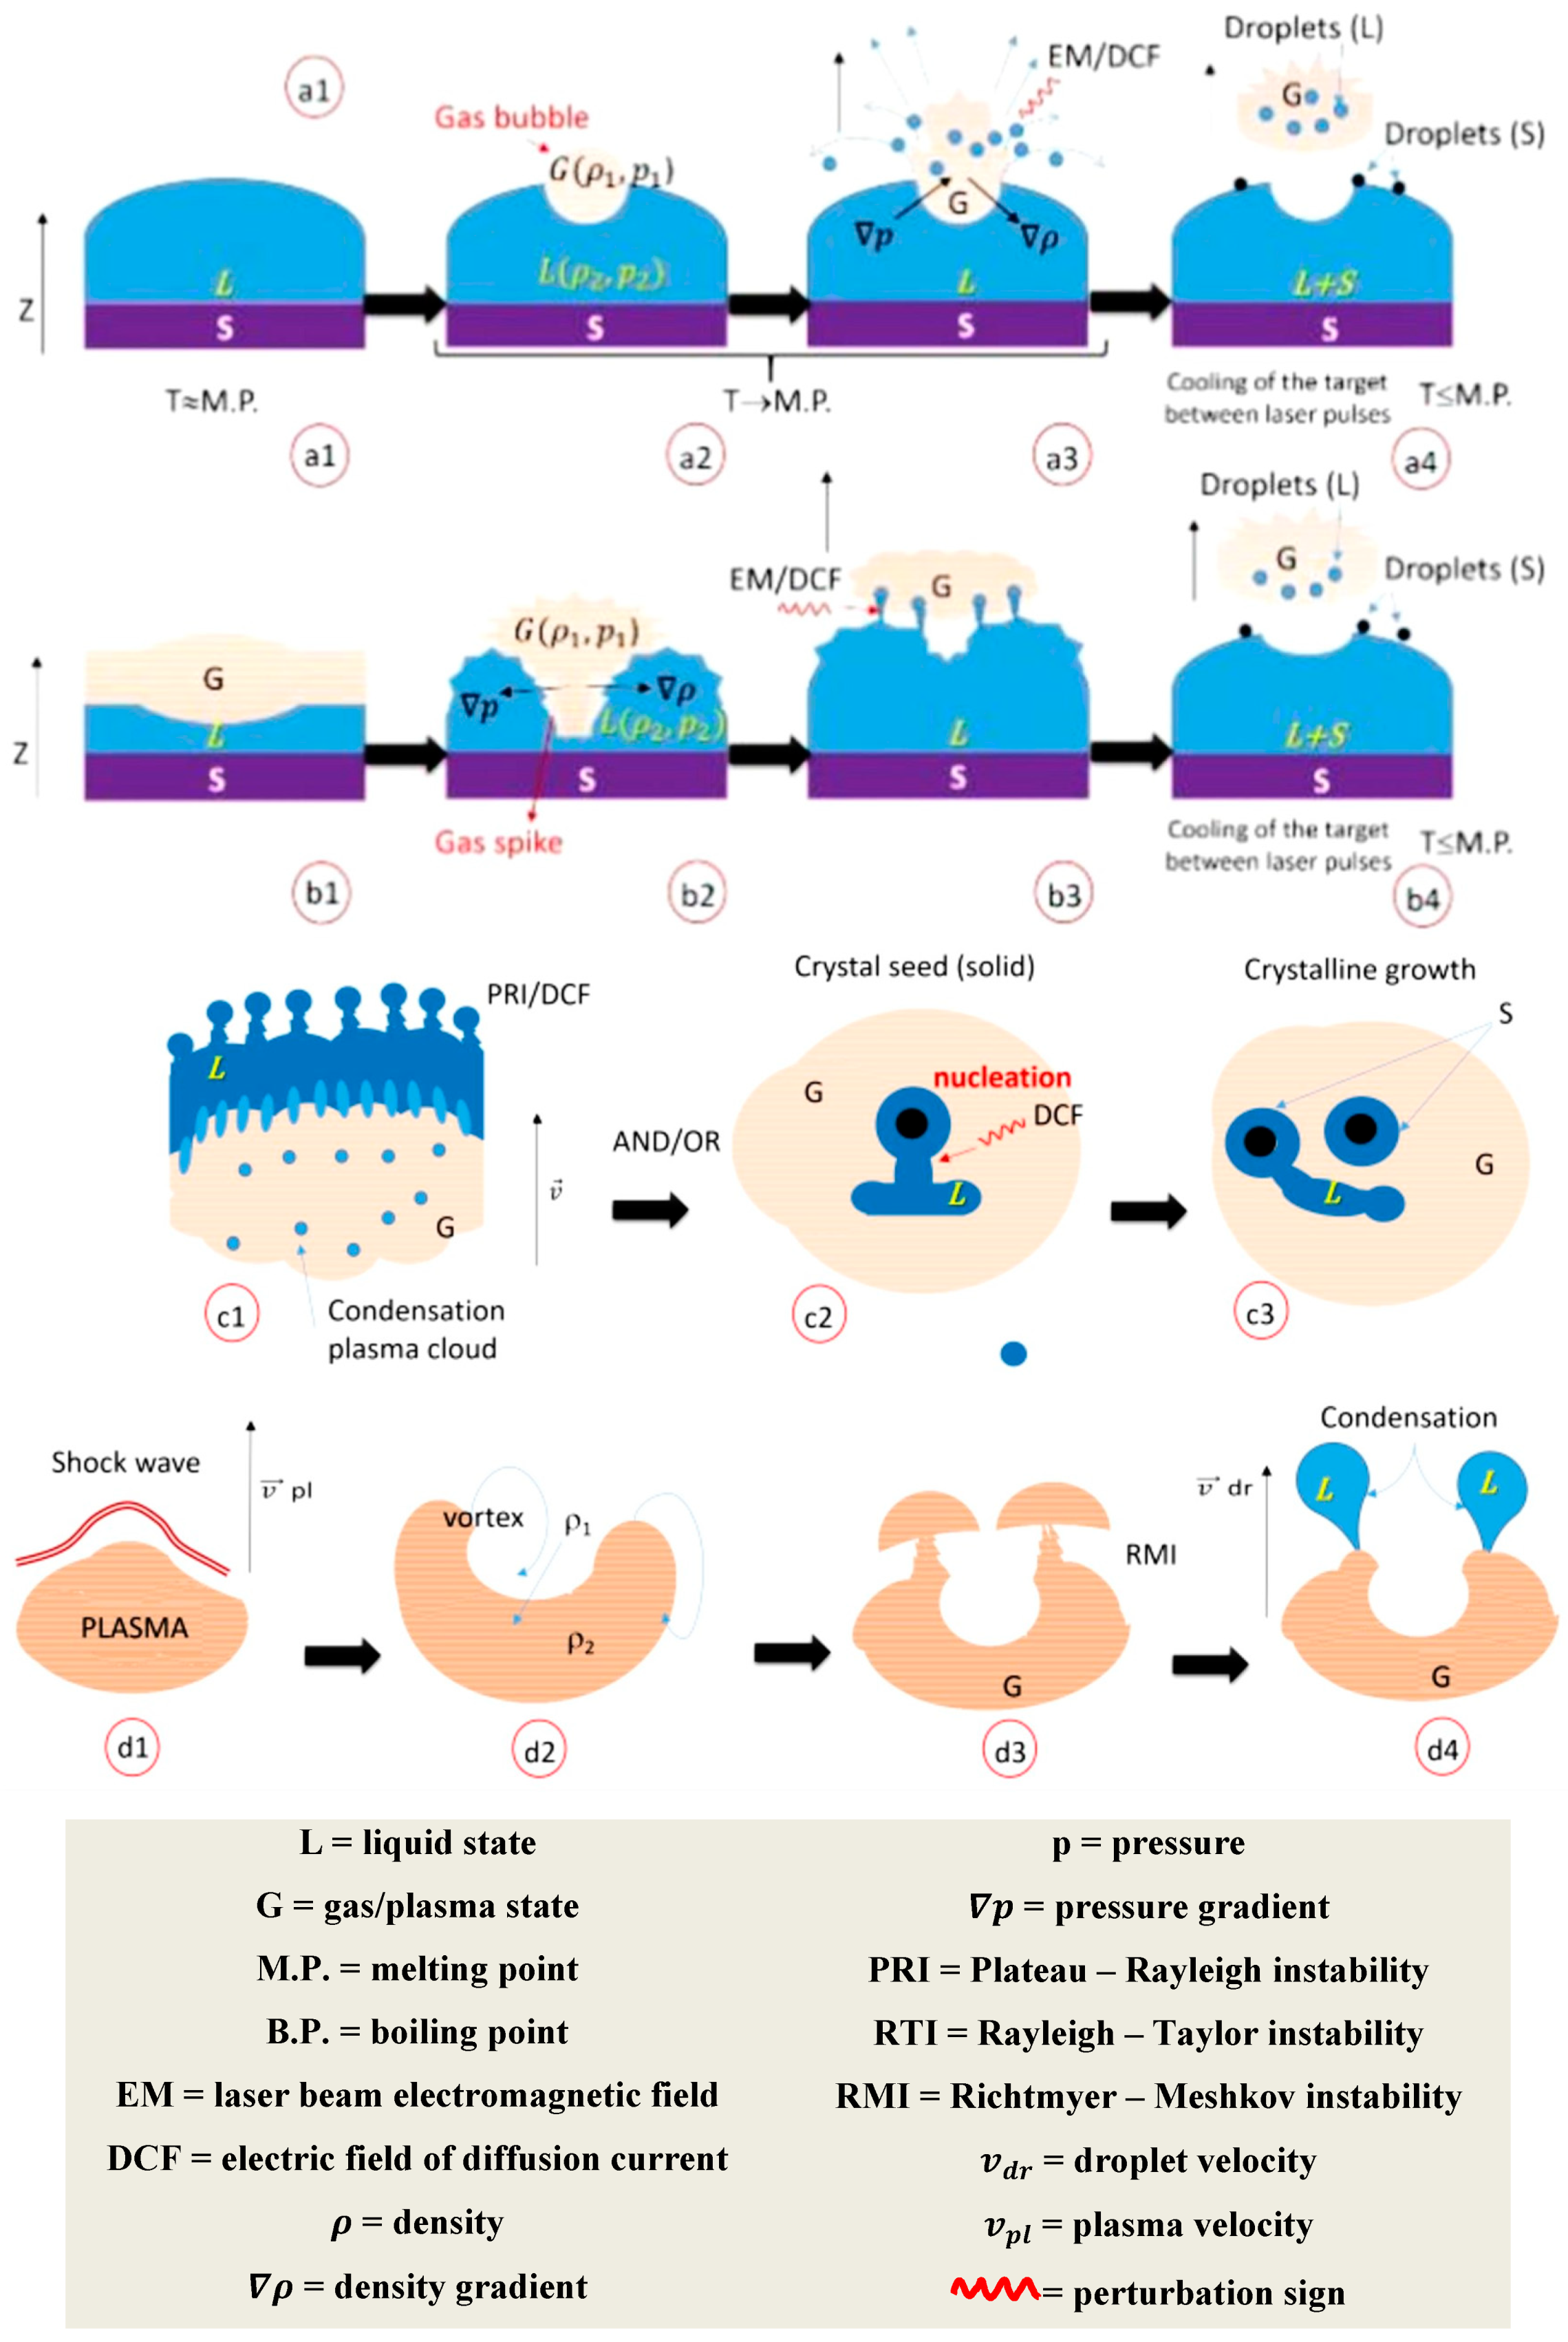
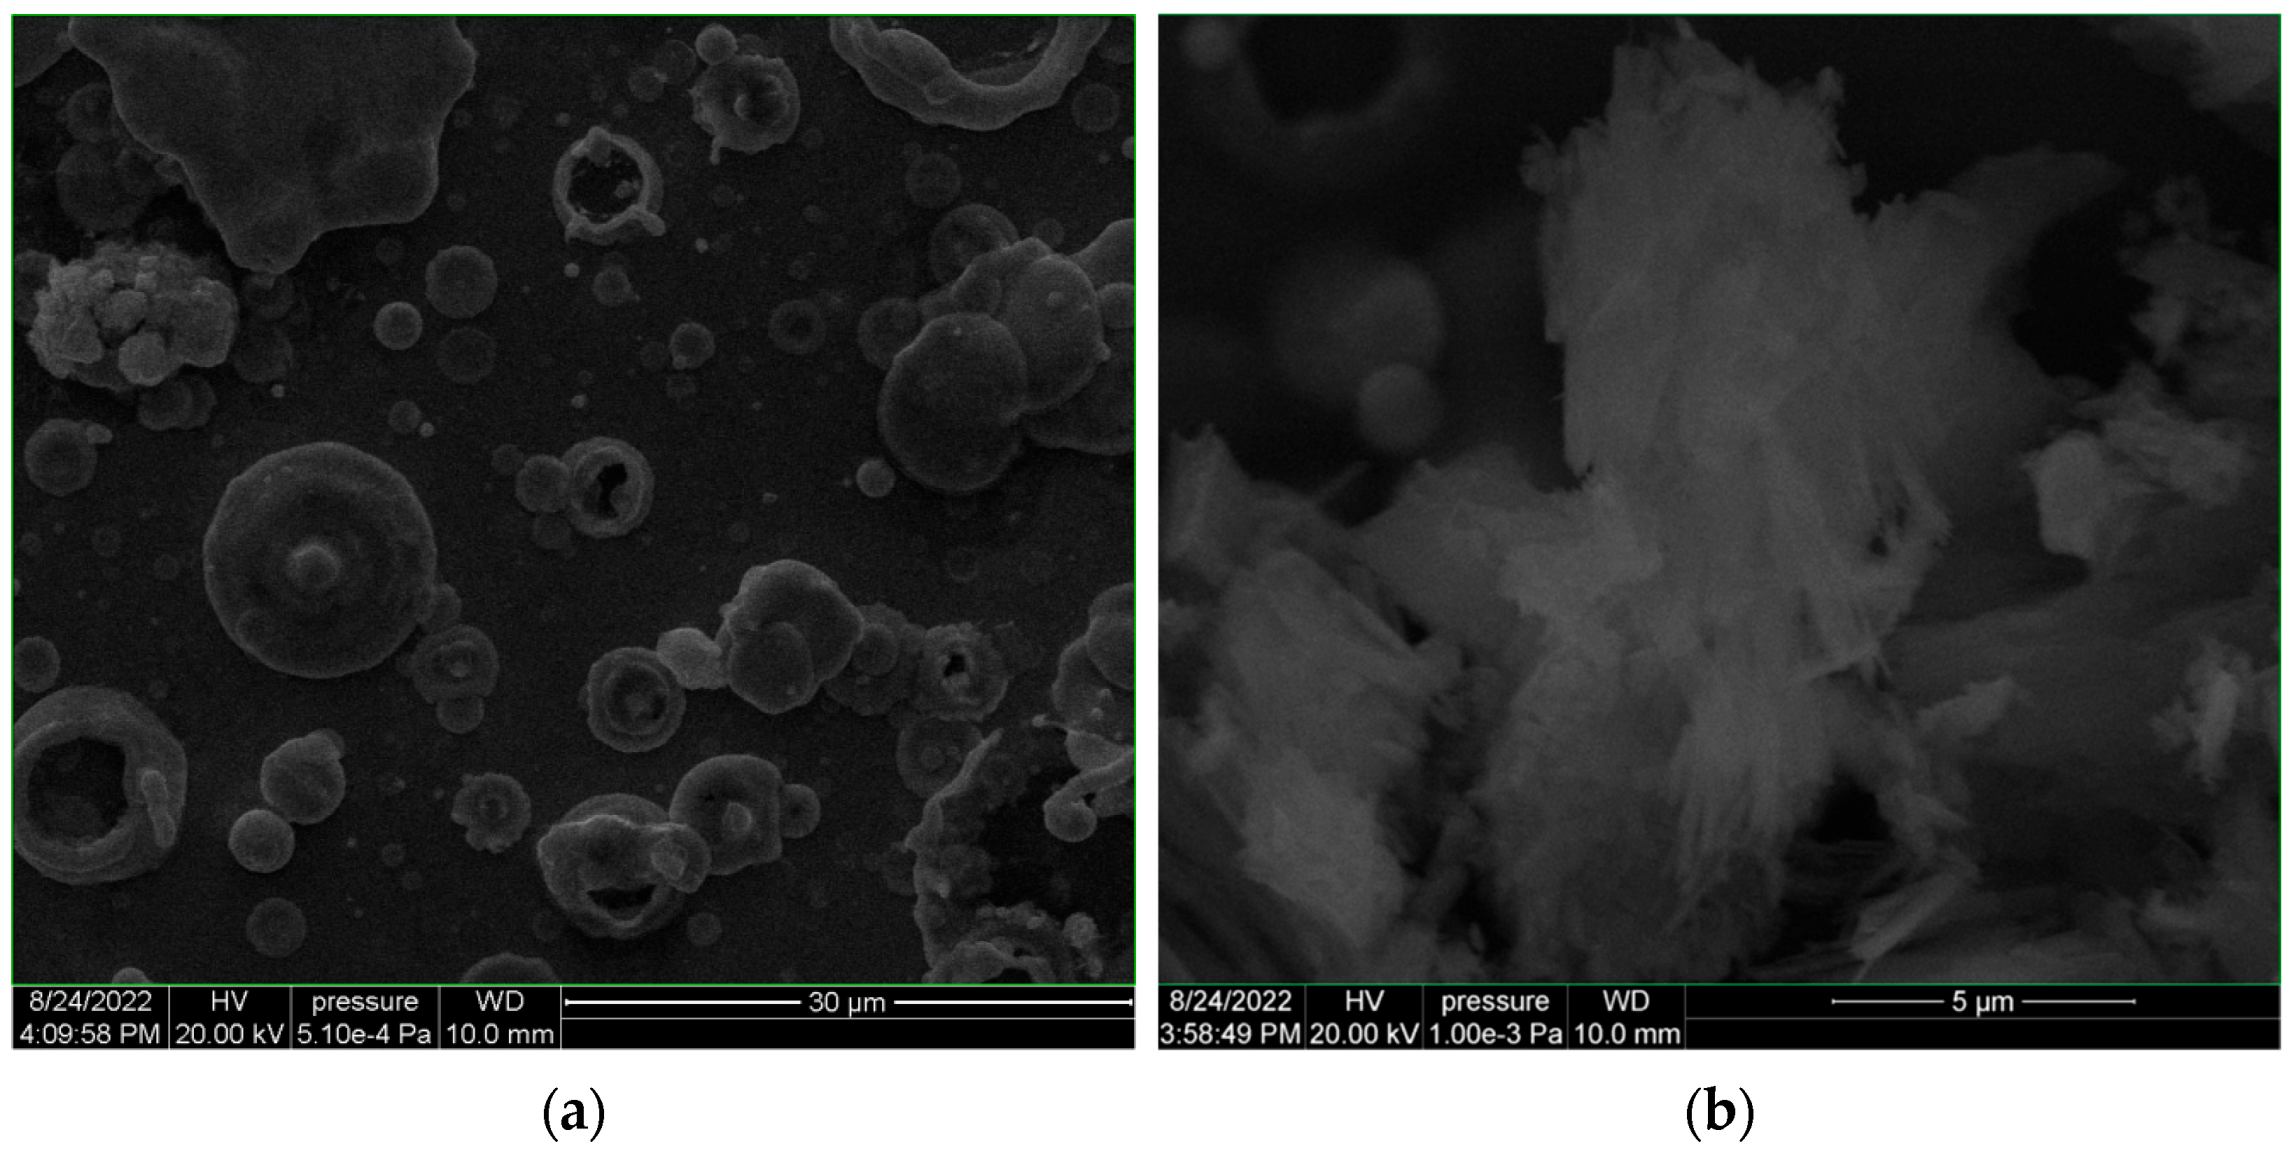
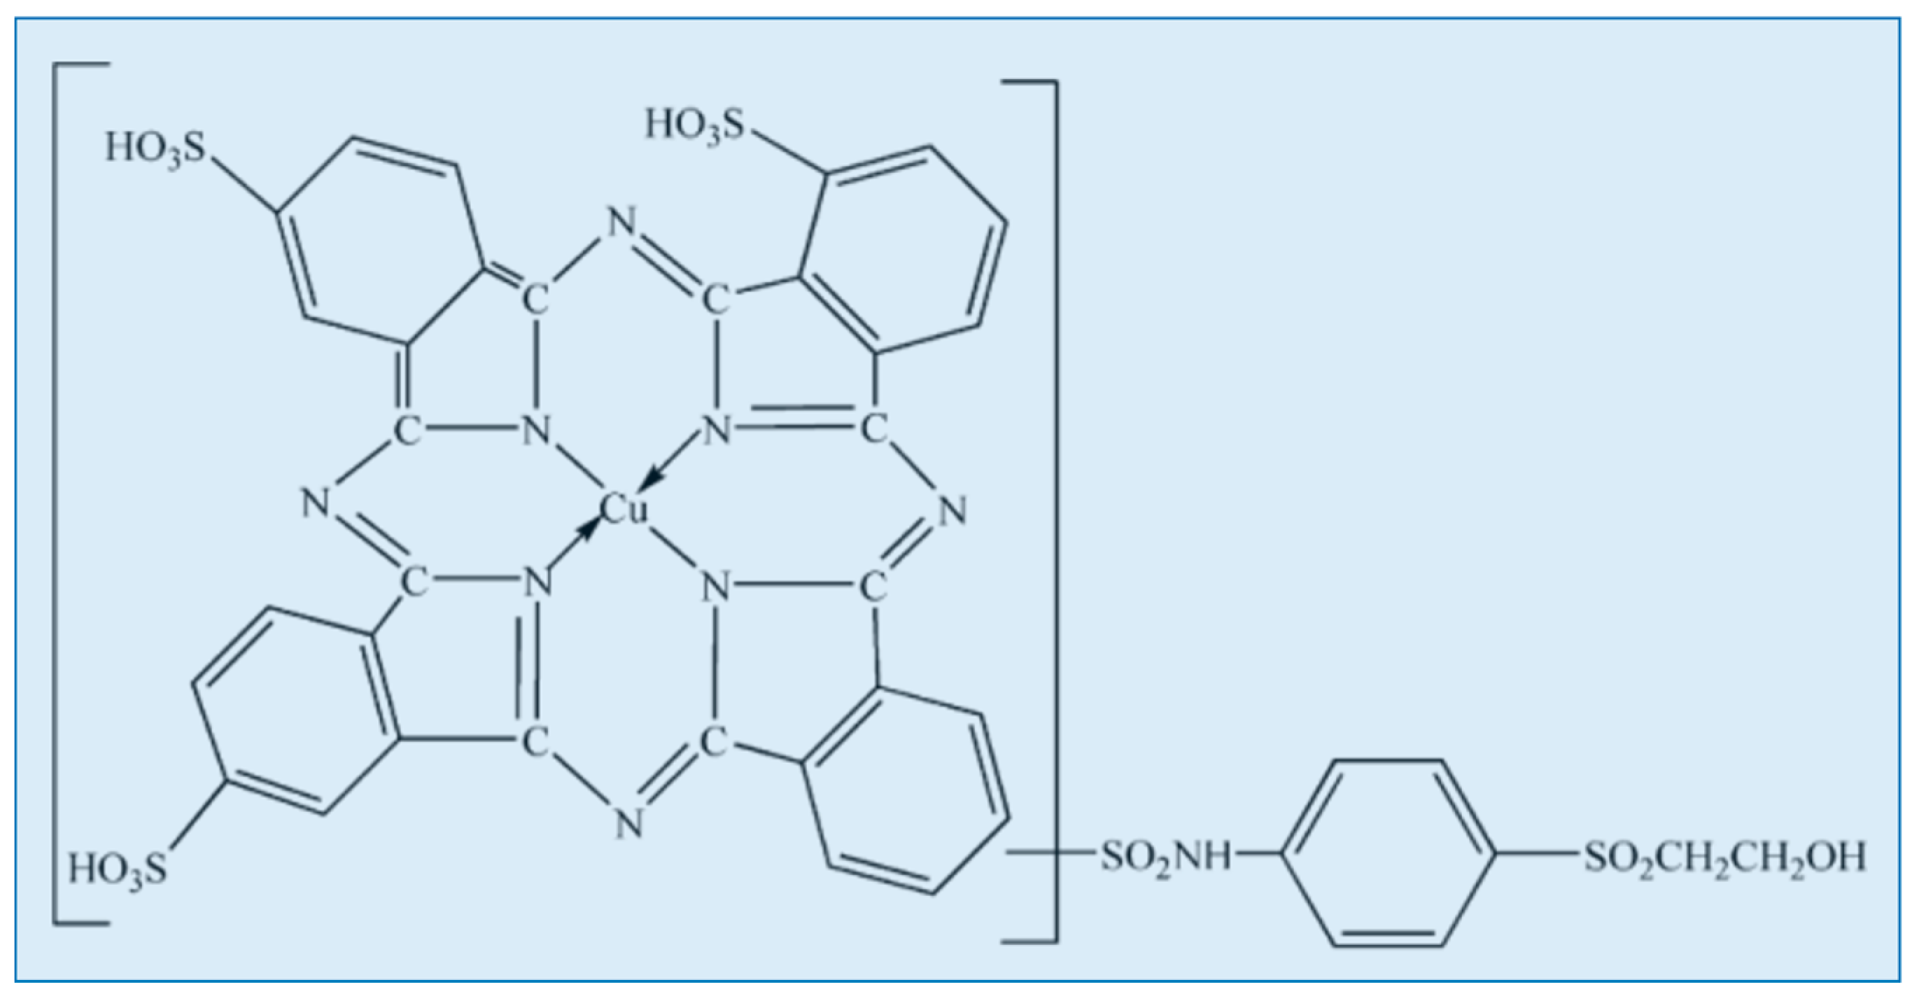
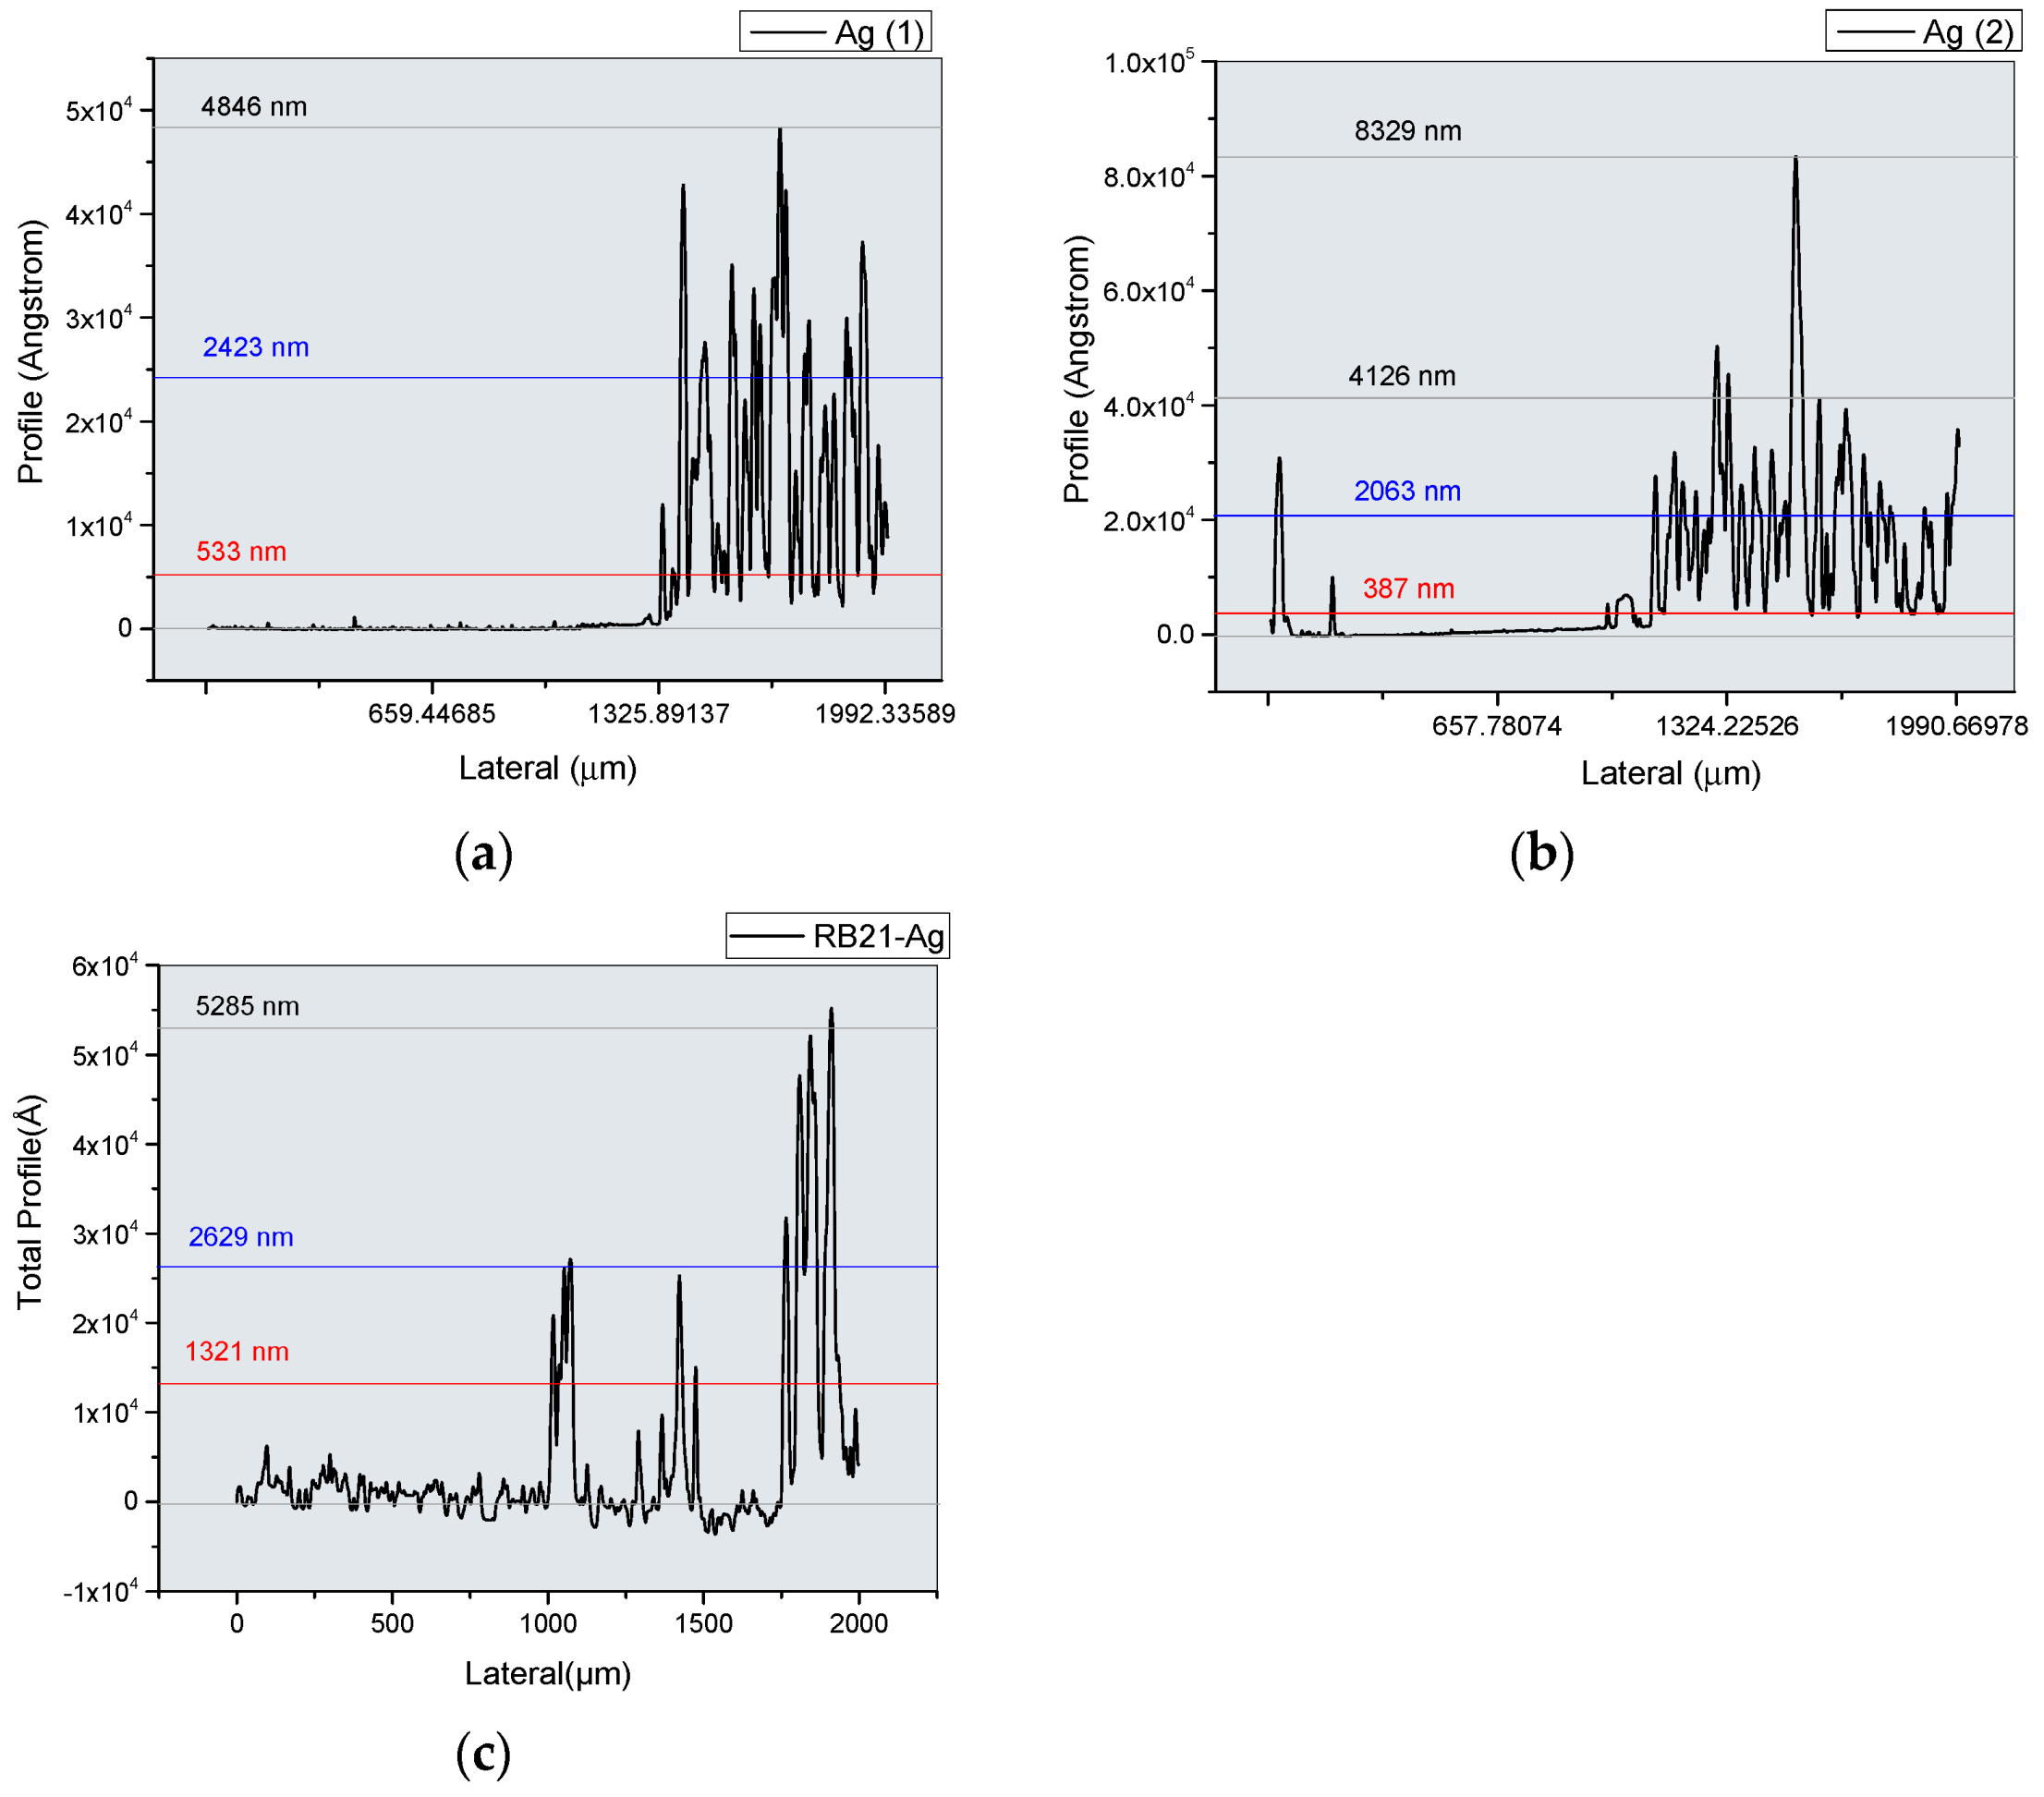
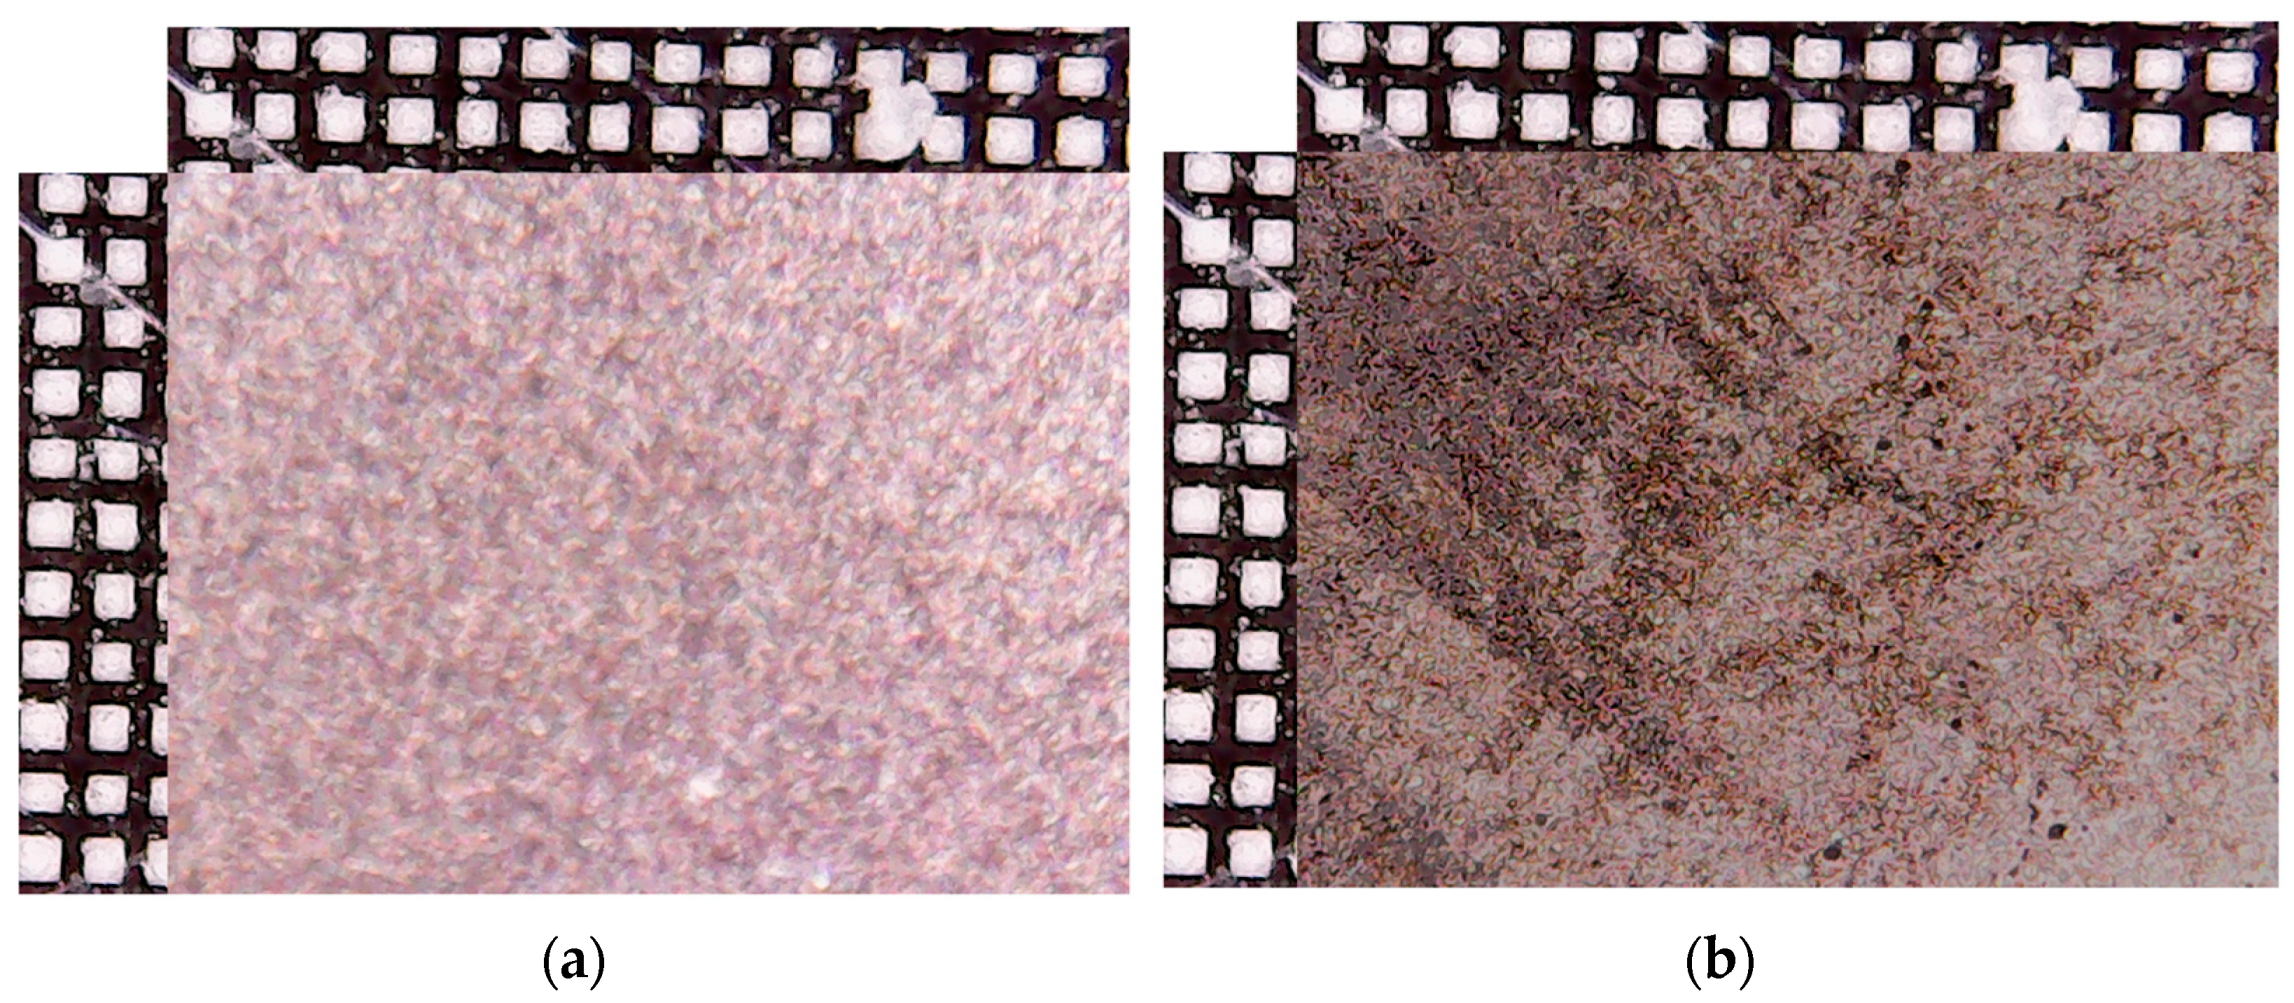
3. Results and Discussion
4. Conclusions
Author Contributions
Funding
Data Availability Statement
Acknowledgments
Conflicts of Interest
References
- Anabitarte, F.; Cobo, A.; Lopez-Higuera, J.M. Laser-Induced Breakdown Spectroscopy: Fundamentals, Applications, and Challenges. Int. Sch. Res. Notices 2012, 2012, 285240. [Google Scholar] [CrossRef]
- Tango, W.J.; Link, J.K.; Zare, R.N. Spectroscopy of K2 Using Laser-Induced Fluorescence. J. Chem. Phys. 1968, 49, 4264–4268. [Google Scholar] [CrossRef]
- Aguilera, J.A.; Aragón, C.; Peñalba, F. Plasma shielding effect in laser ablation of metallic samples and its influence on LIBS analysis. Appl. Surf. Sci. 1998, 127–129, 309–314. [Google Scholar] [CrossRef]
- Fazio, B.; Trusso, S.; Fazio, E.; Neri, F.; Ossi, P.M.; Santo, N. Nanostructured silver thin films deposited by pulsed laser ablation. Radiat. Eff. Defects Solids 2008, 163, 673–683. [Google Scholar] [CrossRef]
- Machmudah, S.; Wahyudiono; Kuwahara, Y.; Sasaki, M.; Goto, M. Pulsed laser ablation in pressurized CO2 for nanoparticles fabrication. In Proceedings of the TENCON 2011–2011 IEEE Region 10 Conference, Bali, Indonesia, 21–24 November 2011; pp. 792–796. [Google Scholar] [CrossRef]
- Mohammed, A.Z.; Menazea, A.A.; Mostafa, A.M.; Al-Ashkar, E.A. Ultra-thin silver nanoparticles film prepared via pulsed laser deposition: Synthesis, characterization, and its catalytic activity on reduction of 4-nitrophenol. Surf. Interfaces 2020, 19, 100438. [Google Scholar] [CrossRef]
- Becker, J.S.; Jakubowski, N. The synergy of elemental and biomolecular mass spectrometry: New analytical strategies in life sciences. Chem. Soc. Rev. 2009, 38, 1969–1983. [Google Scholar] [CrossRef] [PubMed]
- Gurlui, S.; Sanduloviciu, M.; Strat, M.; Strat, G.; Mihesan, C.; Ziskind, M.; Focsa, C. Dynamic space charge structures in high fluence laser ablation plumes. J. Optoelectron. Adv. Mater. 2006, 8, 148–151. [Google Scholar]
- Alonso, J.C.; Diamant, R.; Castillo, P.; Acosta–García, M.C.; Batina, N.; Haro-Poniatowski, E. Thin films of silver nanoparticles deposited in vacuum by pulsed laser ablation using a YAG:Nd laser. Appl. Surf. Sci. 2009, 255, 4933–4937. [Google Scholar] [CrossRef]
- Stafe, M.; Vladoiu, I.; Negutu, C.; Popescu, I.M. Experimental investigation of the nanosecond laser ablation rate of aluminum. Rom. Rep. Phys. 2008, 60, 789–796. [Google Scholar]
- Cocean, A.; Cocean, I.; Gurlui, S.; Iacomi, F. Study of the pulsed laser deposition phenomena by means of Comsol Multiphysics. U.P.B. Sci. Bull. A 2017, 79, 263–274. [Google Scholar]
- Cocean, A.; Cocean, I.; Gurlui, S. Influence of the impurities to the composite materials in laser ablation phenomena. U.P.B. Sci. Bull. A 2021, 83, 225–238. [Google Scholar]
- Cocean, A.; Cocean, I.; Cocean, G.; Postolachi, C.; Pricop, D.A.; Munteanu, B.S.; Cimpoesu, N.; Gurlui, S. Study of Physico-Chemical Interactions during the Production of Silver Citrate Nanocomposites with Hemp Fiber. Nanomaterials 2021, 11, 2560. [Google Scholar] [CrossRef] [PubMed]
- Yang, Y.; Long, C.-L.; Yang, Z.-G.; Li, H.-P.; Wang, Q. Characterization and Determination of Silver Nanoparticle Using Single Particle-Inductively Coupled Plasma-Mass Spectrometry. Chin. J. Anal. Chem. 2014, 42, 1553–1560. [Google Scholar] [CrossRef]
- Becker, J.S.; Becker, J.S. Imaging of metals, metalloids, and non-metals by laser ablation inductively coupled plasma mass spectrometry (LA-ICP-MS) in biological tissues. Methods Mol. Biol. 2010, 656, 51–82. [Google Scholar] [CrossRef] [PubMed]
- Wu, B.; Zoriy, M.; Chen, Y.; Becker, J.S. Imaging of nutrient elements in the leaves of Elsholtzia splendens by laser ablation inductively coupled plasma mass spectrometry (LA-ICP-MS). Talanta 2009, 78, 132–137. [Google Scholar] [CrossRef] [PubMed]
- Pisonero, J.; Günther, D. Femtosecond laser ablation inductively coupled plasma mass spectrometry: Fundamentals and capabilities for depth profiling analysis. Mass Spectrom. Rev. 2008, 27, 609–623. [Google Scholar] [CrossRef] [PubMed]
- Seaman, C. Laser Ablation Inductively Coupled Plasma Mass Spectrometry Imaging of Plant Metabolites. Methods Mol. Biol. 2017, 1618, 125–135. [Google Scholar] [CrossRef] [PubMed]
- Gurlui, S.; Agop, M.; Nica, P.; Ziskind, M.; Focsa, C. Experimental and theoretical investigations of a laser produced aluminum plasma. Phys. Rev. E 2008, 78, 026405. [Google Scholar] [CrossRef] [PubMed]
- Cocean, I.; Cocean, A.; Postolachi, C.; Pohoata, V.; Cimpoesu, N.; Bulai, G.; Iacomi, F.; Gurlui, S. Alpha keratin amino acids BEHVIOR under high FLUENCE laser interaction. Medical applications. Appl. Surf. Sci. 2019, 488, 418–426. [Google Scholar] [CrossRef]
- Cook, M.M.; Lander, J.A. Use of Sodium Borohydride to Control Heavy Metal Discharge in the Photographic Industry. J. Appl. Photogr. Eng. 1979, 5, 144–147. [Google Scholar]
- Cotton, F.A.; Wilkinson, G. Advanced Inorganic Chemistry, 4th ed.; Interscience: New York, NY, USA, 1980. [Google Scholar]
- Lide, D.R. (Ed.) Handbook of Chemistry and Physics, 73rd ed.; CRC Press: Boca Raton, FL, USA, 1992; pp. 10–211. [Google Scholar]
- NIST Chemistry WebBook. Available online: https://webbook.nist.gov/cgi/cbook.cgi?ID=C7440224&Units=SI&Mask=20#Ion-Energetics (accessed on 10 January 2024).
- NIST Chemistry WebBook. Available online: https://webbook.nist.gov/cgi/cbook.cgi?ID=C7439896&Units=SI&Mask=20#Ion-Energetics (accessed on 10 January 2024).
- NIST Chemistry WebBook. Available online: https://webbook.nist.gov/cgi/cbook.cgi?ID=C7440020&Units=SI&Mask=20#ref-5 (accessed on 10 January 2024).
- NIST Chemistry WebBook. Available online: https://webbook.nist.gov/cgi/cbook.cgi?ID=C7440428&Units=SI&Mask=20#Ion-Energetics (accessed on 10 January 2024).
- Cocean, A.; Pelin, V.; Cazacu, M.M.; Cocean, I.; Sandu, I.; Gurlui, S.; Iacomi, F. Thermal Effects Induced by Laser Ablation in Non-Homogeneous Limestone Covered by an Impurity Layer. Appl. Surf. Sci. 2017, 424, 324–329. [Google Scholar] [CrossRef]
- Jyoti, K.; Baunthiyal, M.; Singh, A. Characterization of silver nanoparticles synthesized using Urtica dioica Linn. leaves and their synergistic effects with antibiotics. J. Radiat. Res. Appl. Sci. 2015, 9, 217–227. [Google Scholar] [CrossRef]
- Bagherzade, G.; Tavakoli, M.M.; Namaei, M.H. Green synthesis of silver nanoparticles using aqueous extract of saffron (Crocus sativus L.) wastages and its antibacterial activity against six bacteria. Asian Pac. J. Trop. Biomed. 2017, 7, 227–233. [Google Scholar] [CrossRef]
- Karthik, L.; Kumar, G.; Vishnu Kirthi, A.; Rahuman, A.A.; Bhaskara Rao, K.V. Streptomyces sp. LK3 mediated synthesis of silver nanoparticles and its biomedical application. Bioprocess Biosyst. Eng. 2014, 37, 261–267. [Google Scholar] [CrossRef] [PubMed]
- Hajakbari, F.; Ensandoust, M. Study of Thermal Annealing Effect on the Properties of Silver Thin Films Prepared by DC Magnetron Sputtering. Acta Phys. Pol. A 2016, 129, 680–682. [Google Scholar] [CrossRef]
- Taylor, G.I. The instability of liquid surfaces when accelerated in a direction perpendicular to their planes. I. Proc. R. Soc. Lond. A 1950, 201, 192–196. [Google Scholar] [CrossRef]
- Chavaraddi, K.B.; Chandaragi, P.I.; Gouder, P.M.; Marali, G.B. Effect of Electromagnetic field on Rayleigh-Taylor instability in a power-law fluid in presence of boundary roughness. J. Phys. Conf. Ser. 2021, 1849, 012019. [Google Scholar] [CrossRef]
- Abarzhi, S.I.; Herrmann, M. New Type of the Interface Evolution in the Richtmyer-Meshkov Instability. Available online: https://ntrs.nasa.gov/api/citations/20040027954/downloads/20040027954.pdf (accessed on 19 March 2024).
- Pretch, E.; Bülmann, P.; Badertscher, M. Structure Determination of Organic Compounds. Tables of Spectral Data, 4th ed.; Springer: Berlin, Germany, 2009. [Google Scholar]
- Miller, F.A.; Wilkins, C.H. Infrared Spectra and Characteristic Frequencies of Inorganic Ions. Their Use in Qualitative Analysis. Anal. Chem. 1952, 24, 1253–1294. [Google Scholar] [CrossRef]
- Cocean, G.; Cocean, A.; Postolachi, C.; Garofalide, S.; Bulai, G.; Munteanu, B.S.; Cimpoesu, N.; Cocean, I.; Gurlui, S. High-Power Laser Deposition of Chitosan Polymers: Medical and Environmental Applications. Polymers 2022, 14, 1537. [Google Scholar] [CrossRef] [PubMed]
- Cocean, G.; Cocean, A.; Garofalide, S.; Pelin, V.; Munteanu, B.S.; Pricop, D.A.; Motrescu, I.; Dimitriu, D.G.; Cocean, I.; Gurlui, S. Dual-Pulsed Laser Ablation of Oyster Shell Producing Novel Thin Layers Deposed to Saccharomyces cerevisiae. Polymers 2023, 15, 3953. [Google Scholar] [CrossRef]
- Said, R.B.; Kolle, J.M.; Essalah, K.; Tangour, B.; Sayari, A. A Unified Approach to CO2–Amine Reaction Mechanisms. ACS Omega 2020, 5, 26125–26133. [Google Scholar] [CrossRef]


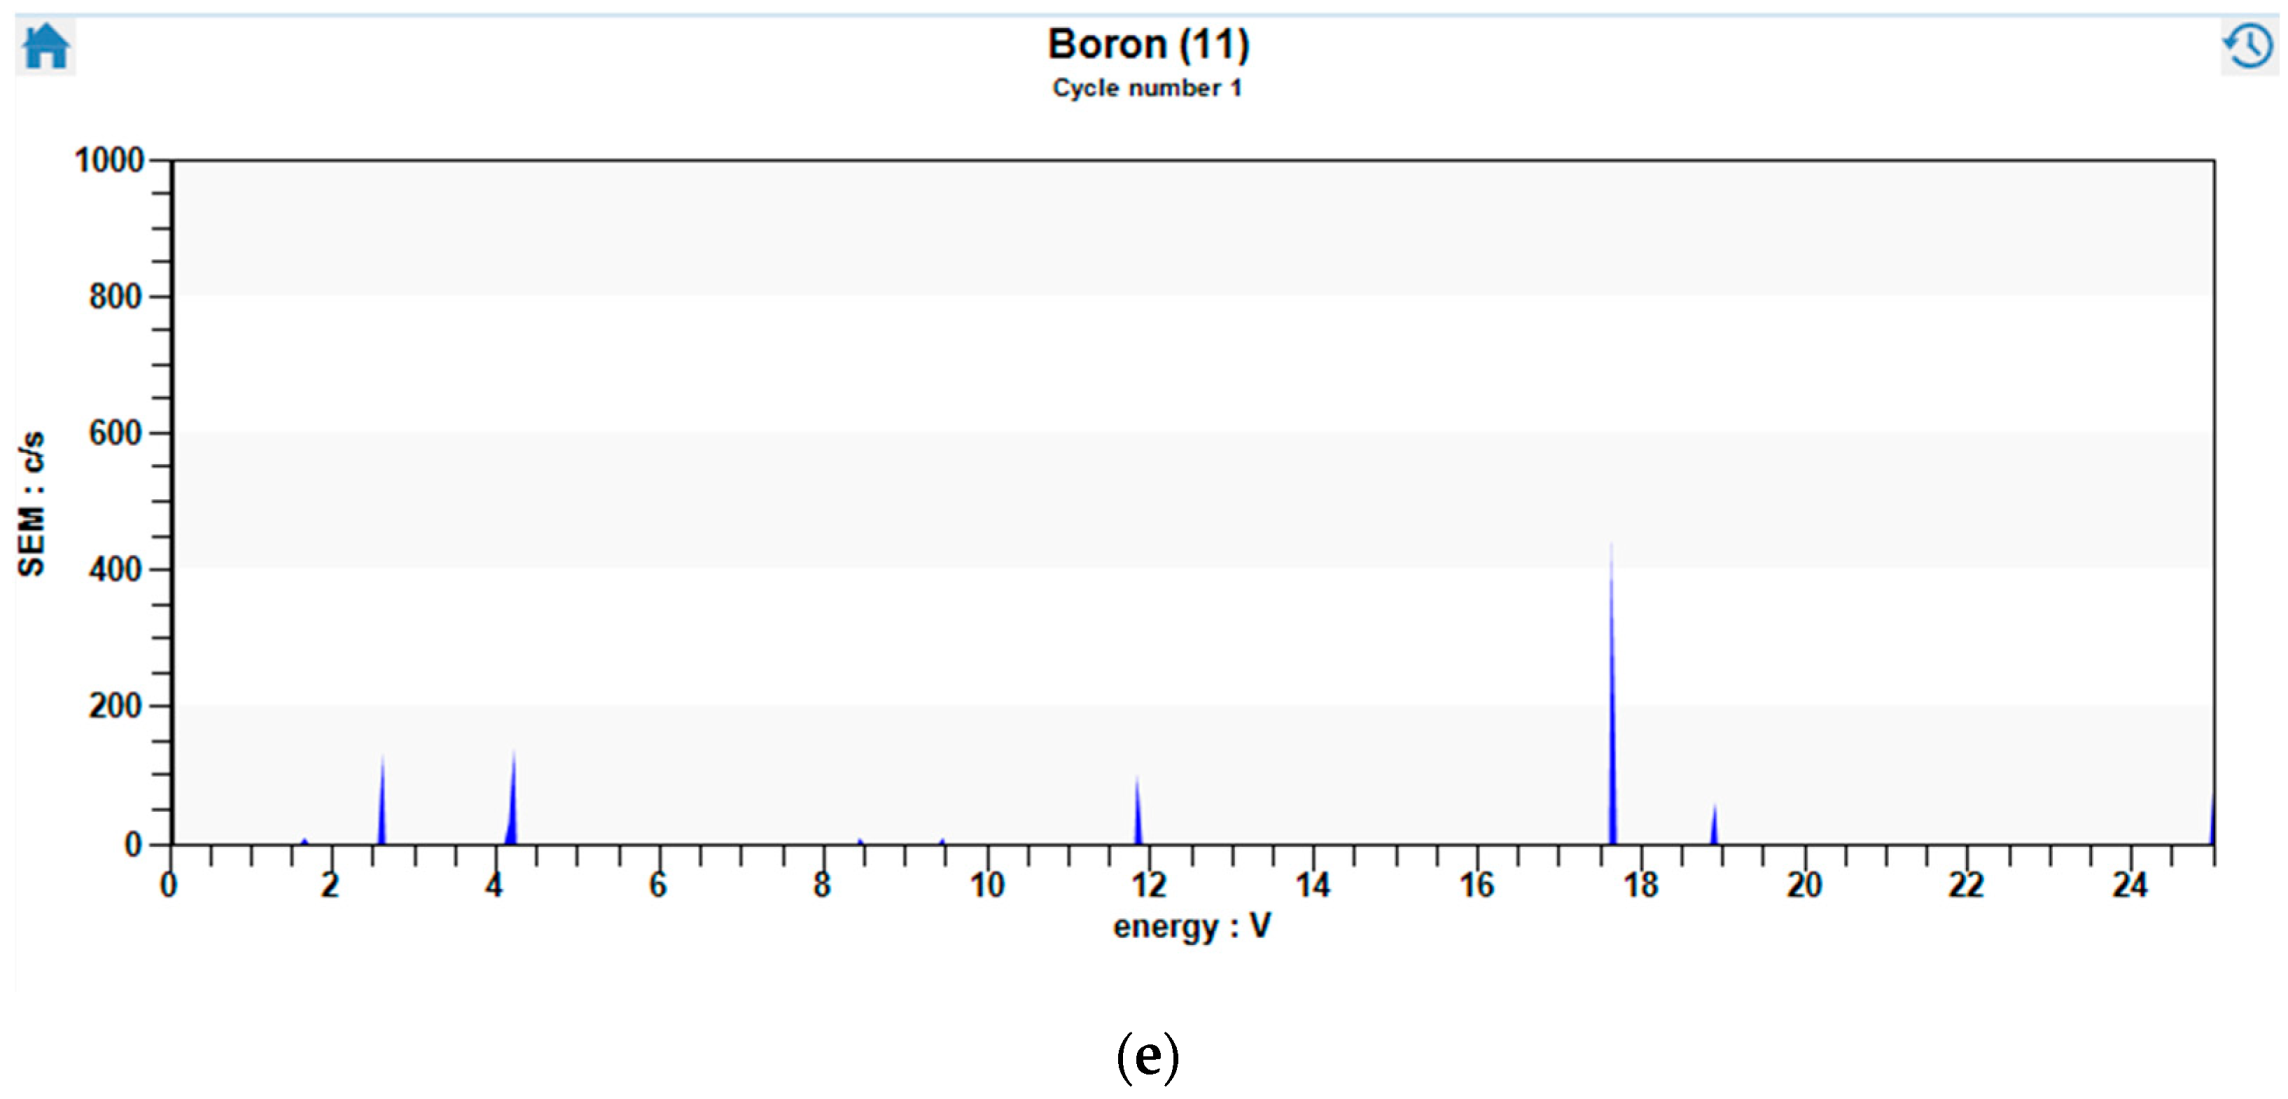
| Element | Melting Point (K) | Boiling Point (K) | Atomic Mass (a.m.u.) | Atomic Number | Heat of Vaporization (kJ/mol) | Ionization Energy (eV) |
|---|---|---|---|---|---|---|
| Ag | 1234 | 2435 | 107.8682 | 47 | 254 | 7.5762 |
| Fe | 1811 | 3134 | 55.845 | 26 | 340 | 7.9024 |
| Ni | 1728 | 2002 | 58.6934 | 28 | 379 | 7.6398 |
| B | 2349 | 4200 | 10.811 | 5 | 508 | 8.29803 |
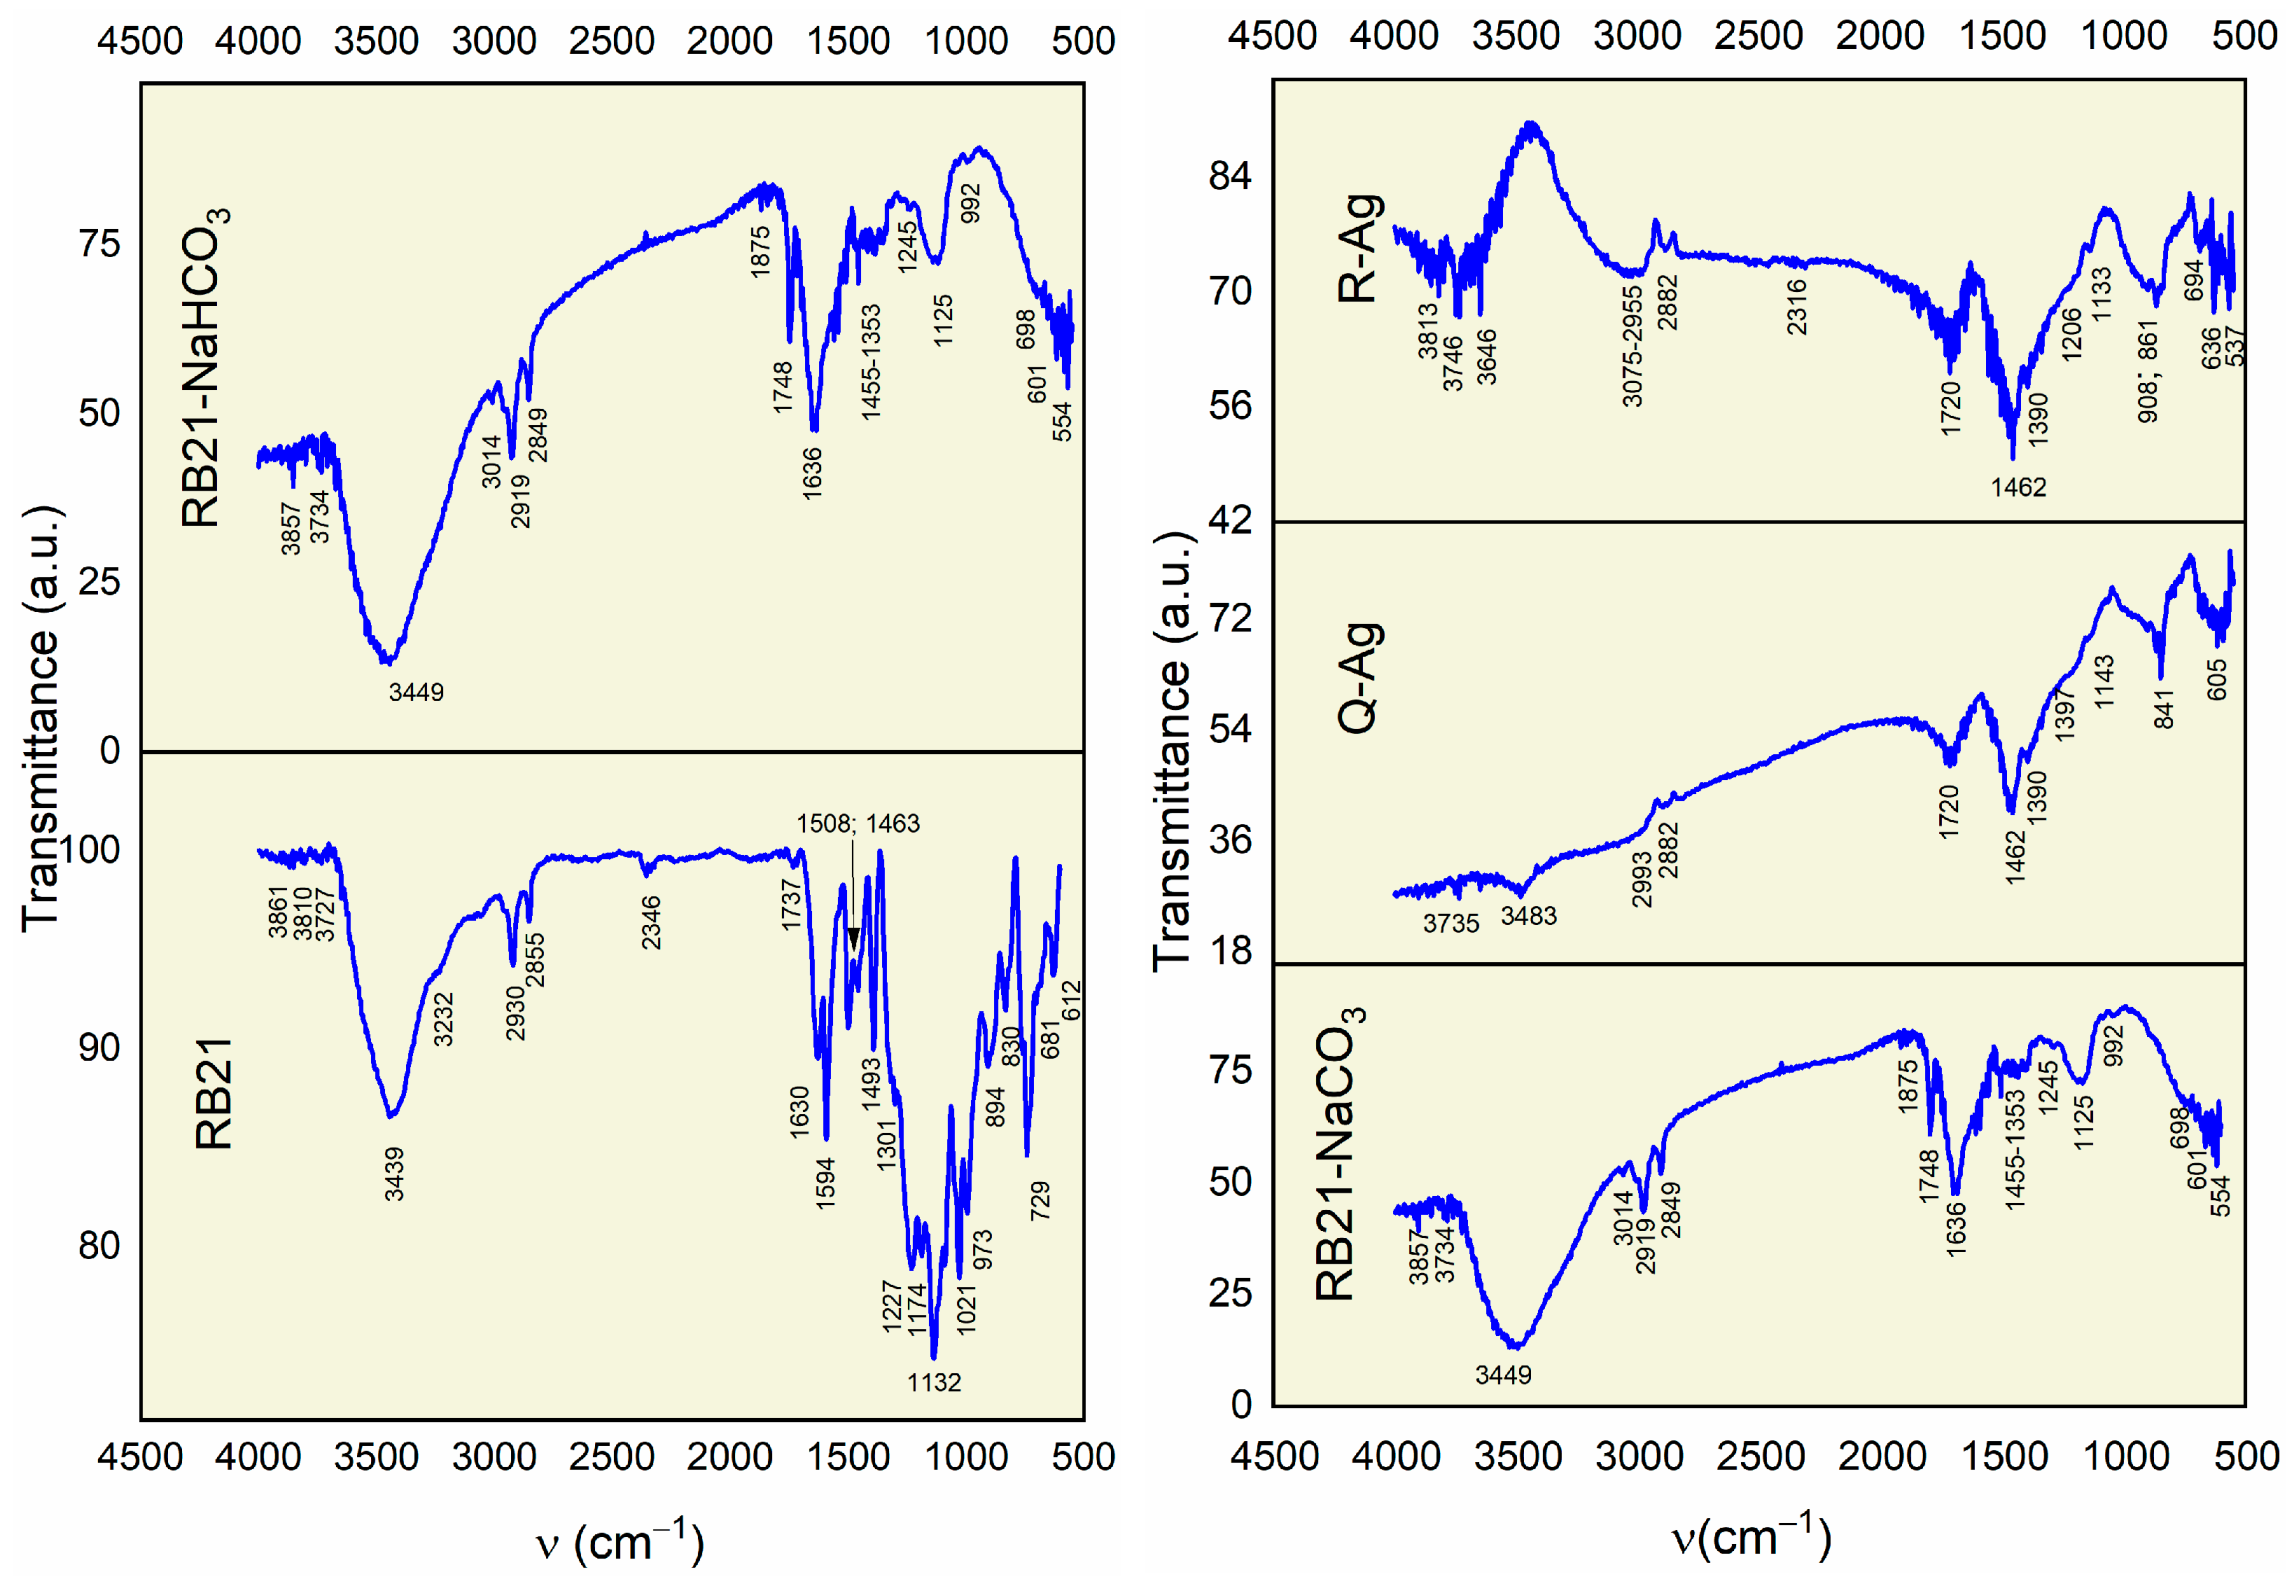
| RB21 | RB21-NaCO3 | R-Ag (Dried RB21-NaCO3 aq after Interaction with Ag-Thin Film) | Q-Ag (Dried Leakage of RB21-NaCO3) | Comments [36,37,38,39] |
|---|---|---|---|---|
| 3861; 3810 v.w. | 3857 v.w. | 3813 v.w. | O-H free str. | |
| 3727 v.w. | 3734 v.w. | 3746 v.w. | 3735 v.w. | O-H free str. |
| 3646 v.w. | O-H free str. | |||
| 3439 s. | 3449 s. | - | 3483 v.w | O-H and N-H free and H-bonded str. |
| 3232 sh. | N-H | |||
| 3014 v.w. | 3075–2955 m. | C-H in aromatic/alkenes | ||
| 2930 m. | 2919 m. | 2993 m. | C-H alifatic | |
| 2855 m. | 2849 m. | 2882 m. | 2883 m. | C-H alifatic |
| 2346 w. | 2316 w. | O=C=O carbon dioxide | ||
| 1875 w. | C=O stretching | |||
| 1737 w. | 1748 m. | 1720 m. | 1720 m. | C=O stretching in carbonate CO32− |
| 1630 s. | 1636 s. | C-H aromatic; N-H bending; SO3 | ||
| 1594 s. | - | - | - | Ring skeleton in pyrrole group; N-H bending in sulfonamide group |
| 1508 s. | - | - | - | N-H bending in sulfonamide group |
| 1493 s. | - | - | - | C in heterocycles |
| 1463 s. | 1455 w. | 1462 s. | 1462 s. | C-C in heterocycles; C=O in (COO)−; C-H aliphatic bending; CO3−2 lattice vibrations |
| 1301 s. | 1353 w. | 1390 m. | 1390; 1397 m. | S=O stretching asymmetric in SO3 of sulfones in chromophore and sulfonamides in chromogen |
| 1227 v.s. | 1245 v.w. | 1206 sh. | - | C-N stretching in amines; C-O stretching in alcohols; S=O stretching symmetric in SO3 in chromophore |
| 1174 v.s. | 1125 m. | 1133 w. | 1143 sh. | SO2 in chromogen |
| 1021 v.s. | - | - | - | C-N bending |
| 973 v.s. | 992 v.w. | 908 m., wide | - | C=C bending |
| 894 s. | - | 861 m. | - | C=C bending; S-O stretching |
| 830 m. | - | - | 841 m. sharp | N-H bending in sulfonamides; C=C bending; S-O stretching |
| 729 s. | - | - | - | N-H bending; S-O stretching |
| 681 m. | 698 m. | 694 w. | - | S-O stretching |
| 612 m | 601 m. | 636 m. sharp | 605 m. (multiple peaks | S-O stretching |
| - | 554 m. | 537 m. sharp | - | S-O stretching |
Disclaimer/Publisher’s Note: The statements, opinions and data contained in all publications are solely those of the individual author(s) and contributor(s) and not of MDPI and/or the editor(s). MDPI and/or the editor(s) disclaim responsibility for any injury to people or property resulting from any ideas, methods, instructions or products referred to in the content. |
© 2024 by the authors. Licensee MDPI, Basel, Switzerland. This article is an open access article distributed under the terms and conditions of the Creative Commons Attribution (CC BY) license (https://creativecommons.org/licenses/by/4.0/).
Share and Cite
Cocean, A.; Cocean, G.; Postolachi, C.; Garofalide, S.; Pricop, D.A.; Munteanu, B.S.; Bulai, G.; Cimpoesu, N.; Motrescu, I.; Pelin, V.; et al. High Energy Pulsed Laser Beam to Produce a Thin Layer of Crystalline Silver without Heating the Deposition Substrate and Its Catalytic Effects. Quantum Beam Sci. 2024, 8, 16. https://doi.org/10.3390/qubs8020016
Cocean A, Cocean G, Postolachi C, Garofalide S, Pricop DA, Munteanu BS, Bulai G, Cimpoesu N, Motrescu I, Pelin V, et al. High Energy Pulsed Laser Beam to Produce a Thin Layer of Crystalline Silver without Heating the Deposition Substrate and Its Catalytic Effects. Quantum Beam Science. 2024; 8(2):16. https://doi.org/10.3390/qubs8020016
Chicago/Turabian StyleCocean, Alexandru, Georgiana Cocean, Cristina Postolachi, Silvia Garofalide, Daniela Angelica Pricop, Bogdanel Silvestru Munteanu, Georgiana Bulai, Nicanor Cimpoesu, Iuliana Motrescu, Vasile Pelin, and et al. 2024. "High Energy Pulsed Laser Beam to Produce a Thin Layer of Crystalline Silver without Heating the Deposition Substrate and Its Catalytic Effects" Quantum Beam Science 8, no. 2: 16. https://doi.org/10.3390/qubs8020016
APA StyleCocean, A., Cocean, G., Postolachi, C., Garofalide, S., Pricop, D. A., Munteanu, B. S., Bulai, G., Cimpoesu, N., Motrescu, I., Pelin, V., Ababei, R. V., Dimitriu, D.-G., Cocean, I., & Gurlui, S. (2024). High Energy Pulsed Laser Beam to Produce a Thin Layer of Crystalline Silver without Heating the Deposition Substrate and Its Catalytic Effects. Quantum Beam Science, 8(2), 16. https://doi.org/10.3390/qubs8020016