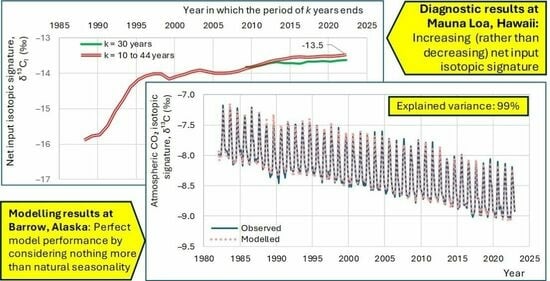
Net Isotopic Signature of Atmospheric CO2 Sources and Sinks: No Change since the Little Ice Age
Abstract
:| We own the science, and we think that the world should know it. |
| Melissa Fleming, Under-Secretary-General for Global Communications at the United Nations during the 2022 World Economic Forum’s Sustainable Development Impact Meetings [1] |
1. Introduction
- Do modern instrumental carbon isotopic data, available for a period of observations of more than 40 years, reflect changes due to human (fossil fuel) CO2 emissions?
- Does the modern period differ, in terms of the net isotopic signature of atmospheric CO2 sources and sinks, from earlier periods since the Little Ice Age?
The decrease [in the specific 14C activity of wood at time of growth during the past 50 years] can be attributed to the introduction of a certain amount of C14-free CO2 into the atmosphere by artificial coal and oil combustion and to the rate of isotopic exchange between atmospheric CO2 and the bicarbonate dissolved in the oceans.
The carbon isotopic (δ13C, PDB) signature of fossil fuel emissions has decreased during the last century, reflecting the changing mix of fossil fuels produced.
Carbon isotopes, 14C and 13C, in atmospheric CO2 are changing in response to fossil fuel emissions and other human activities.[…]Emissions of CO2 from fossil fuel combustion and land use change reduce the ratio of 13C/12C in atmospheric CO2 (δ13CO2). This is because 12C is preferentially assimilated during photosynthesis and δ13C in plant-derived carbon in terrestrial ecosystems and fossil fuels is lower than atmospheric δ13CO2.[…]Cement manufacturing also involves “fossil” carbon in that the source material is geological and therefore free of any 14C.[…]Since the Industrial Revolution, the carbon isotopic composition of atmospheric CO2 has undergone dramatic changes as a result of human activities and the response of the natural carbon cycle to them. The relative amount of atmospheric 14C and 13C in CO2 has decreased because of the addition of 14C- and 13C-depleted fossil carbon.
2. Data
3. Theoretical Framework
4. Diagnostic Results
4.1. Initial Observations
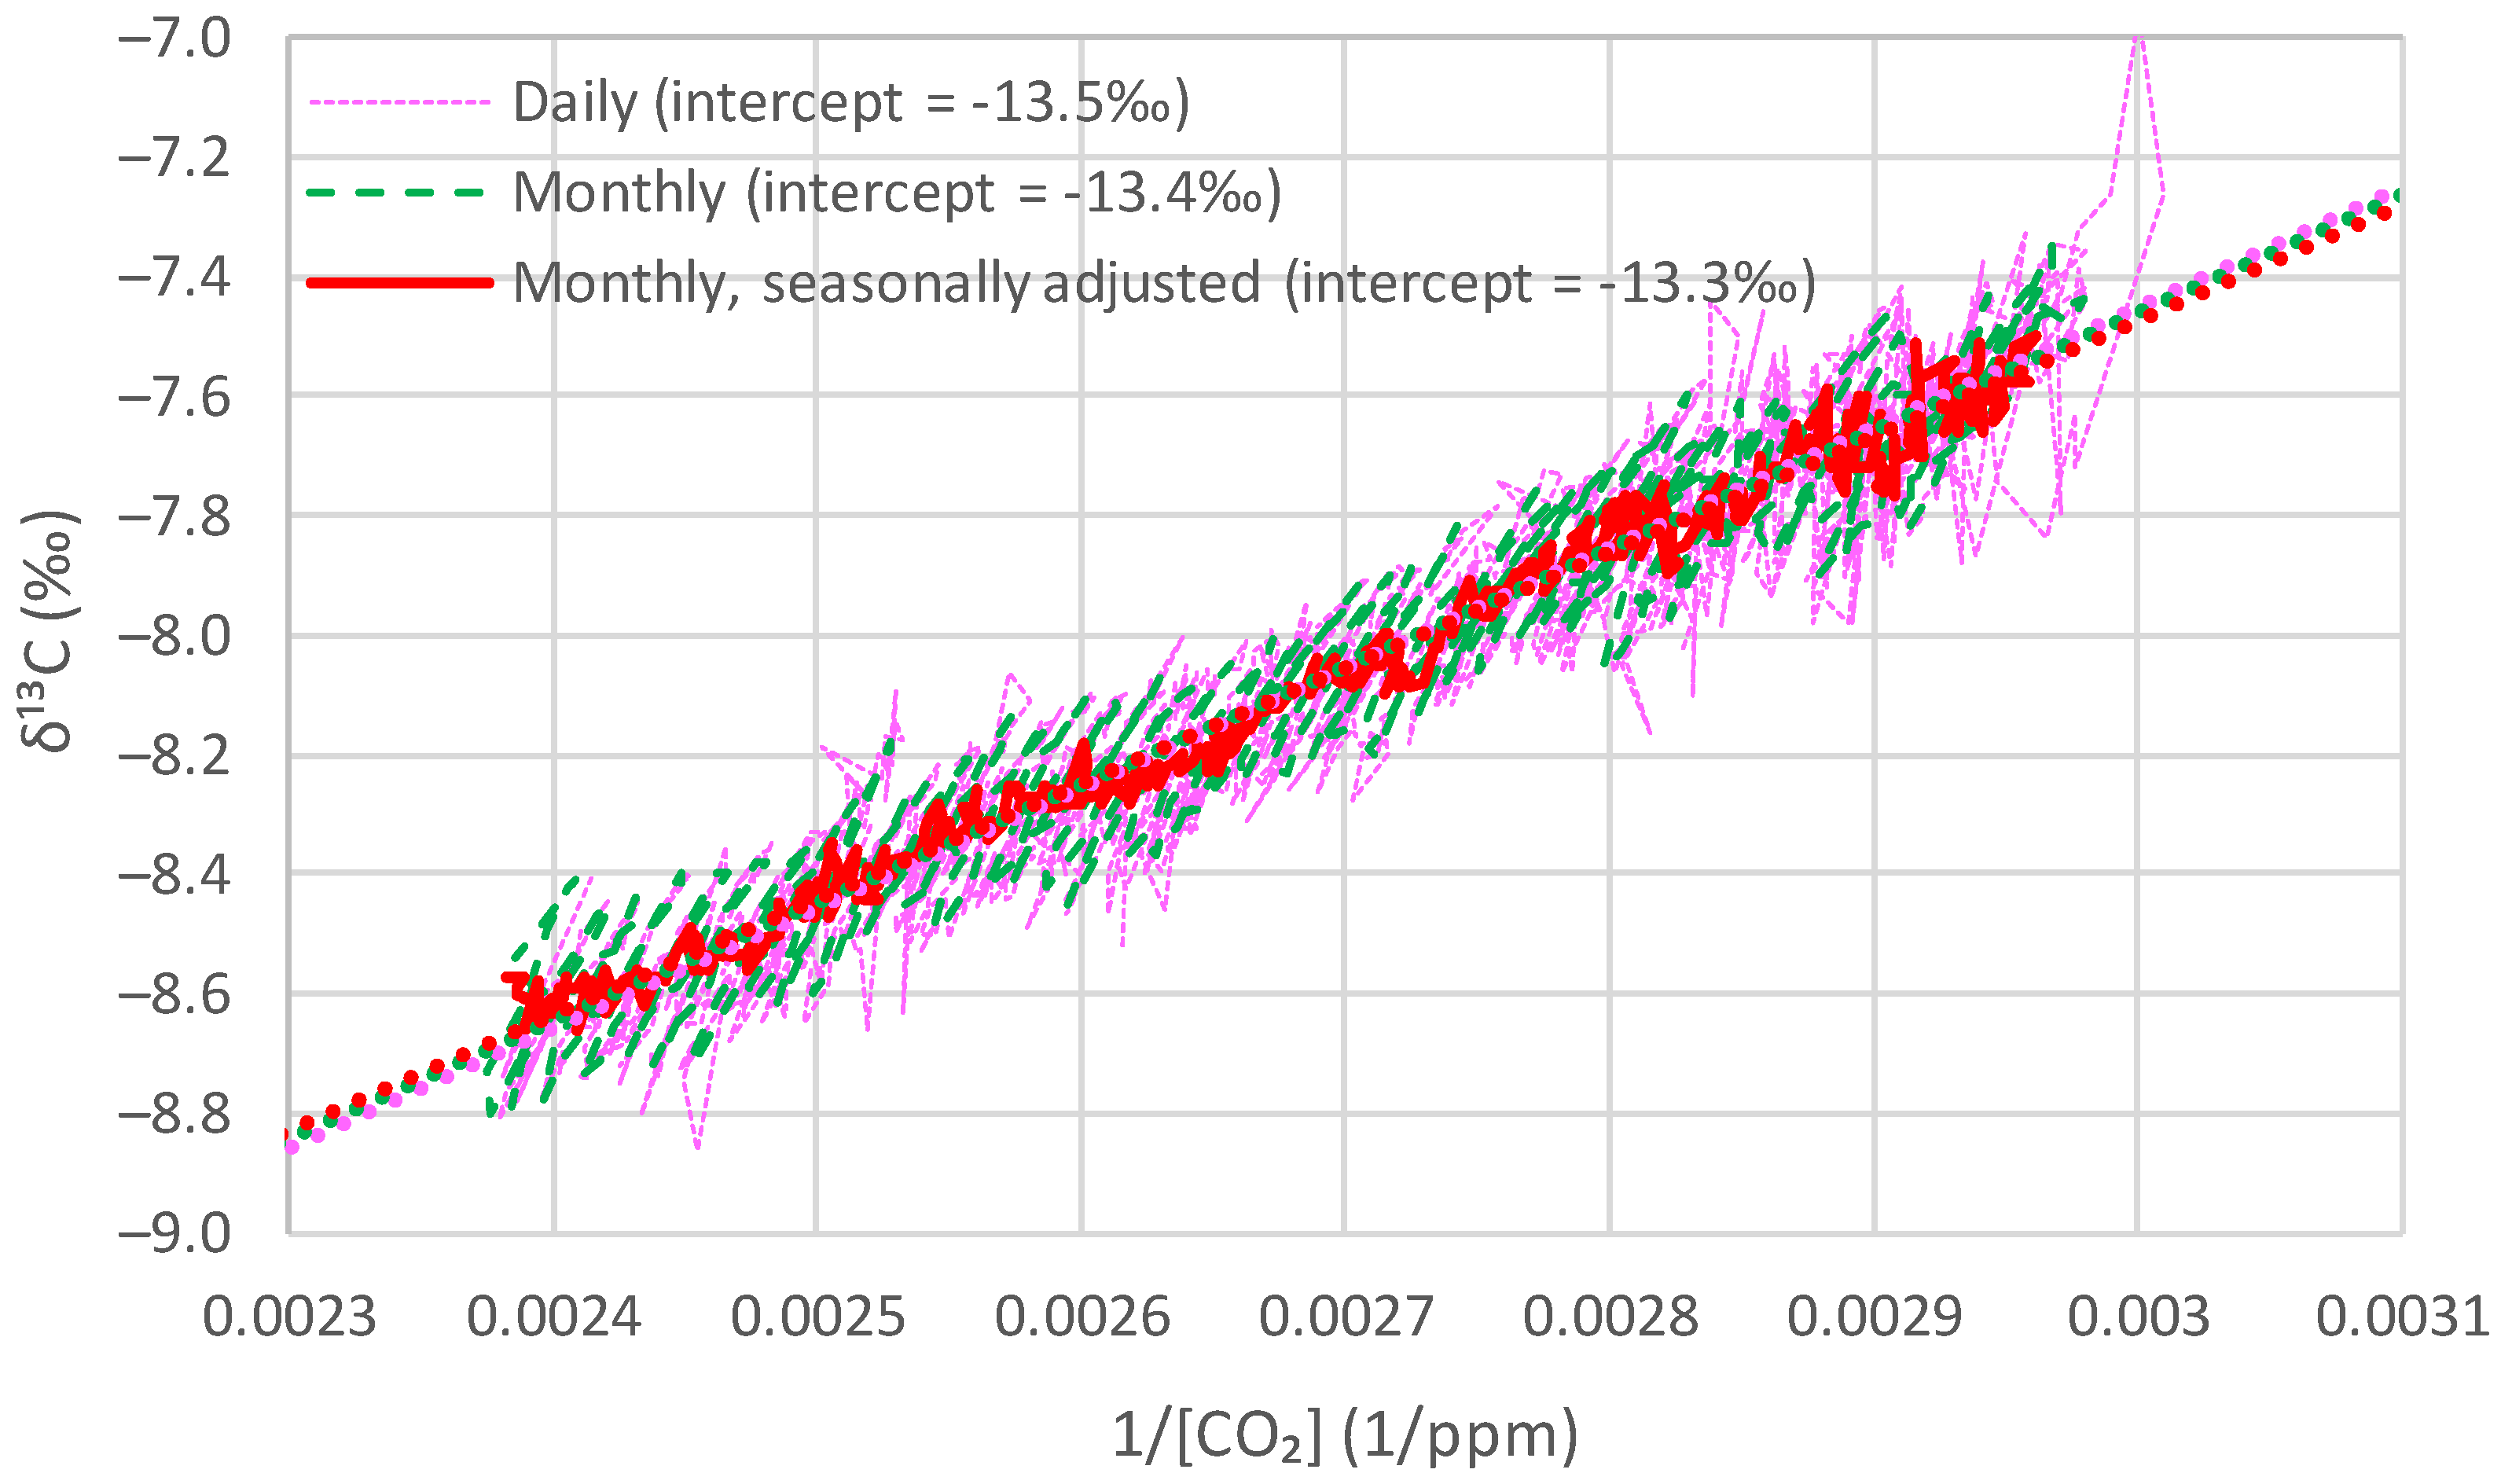
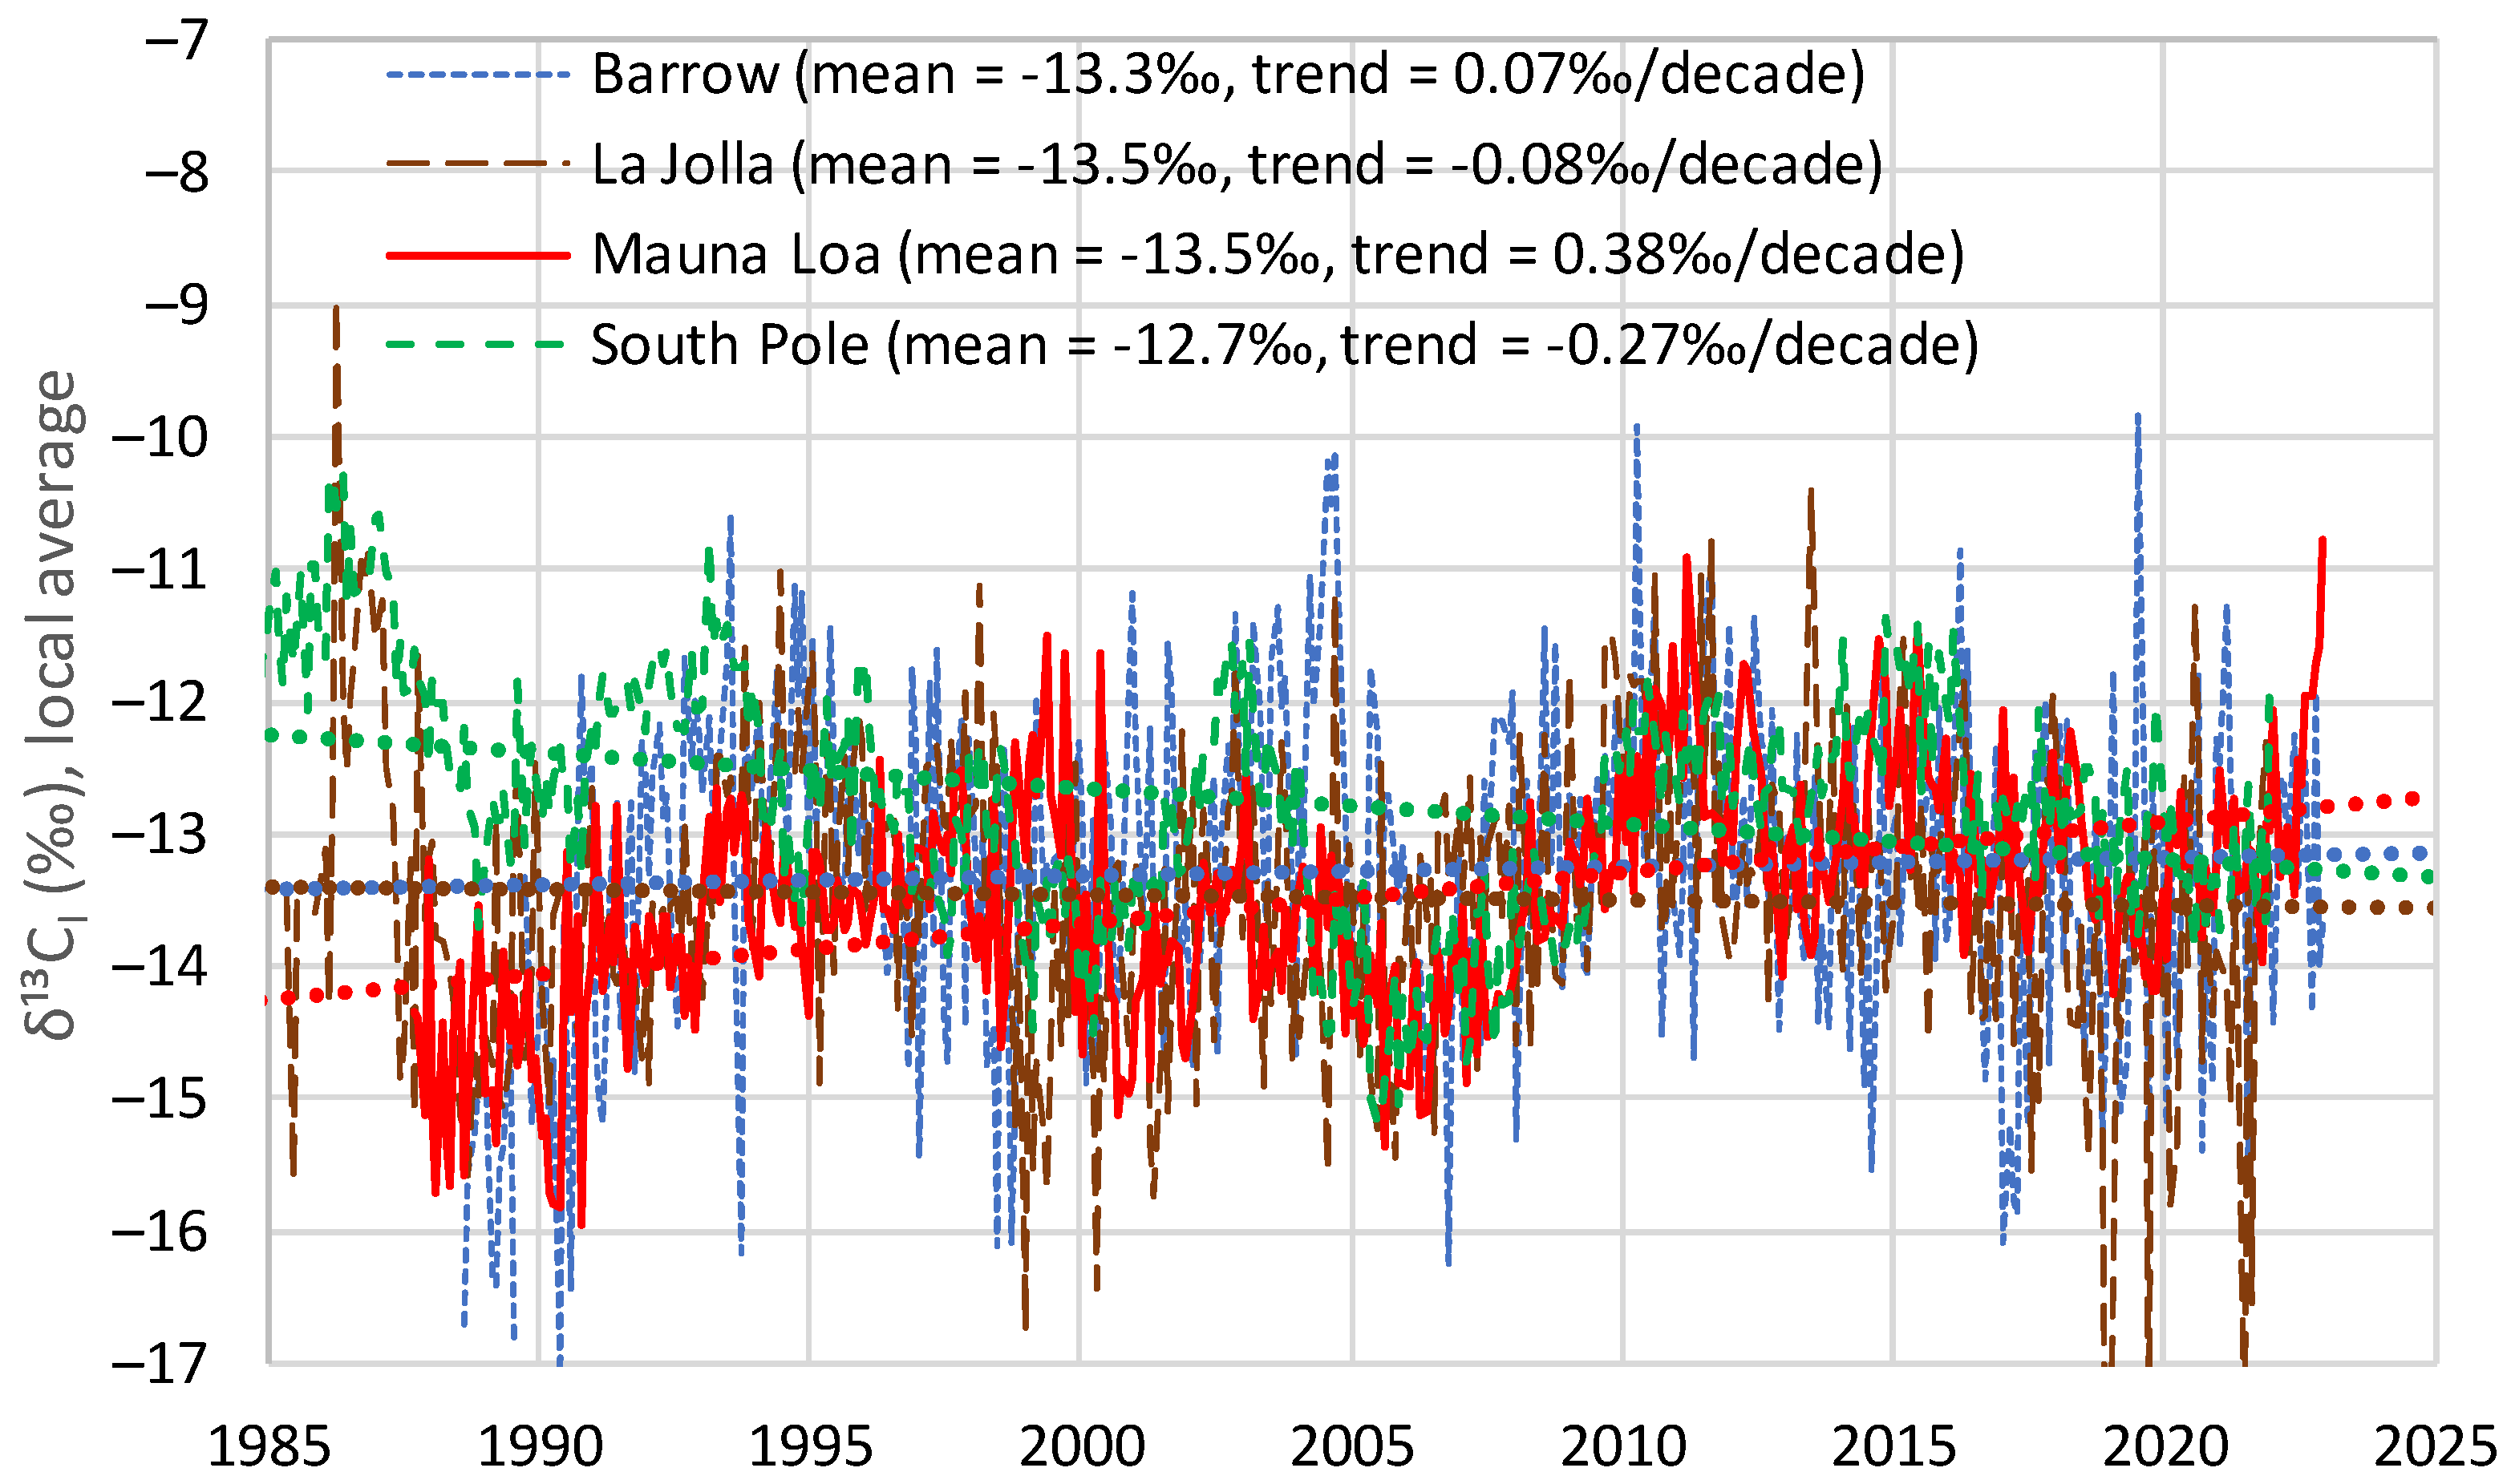
- All four series show a long-term tendency to decrease through the years;
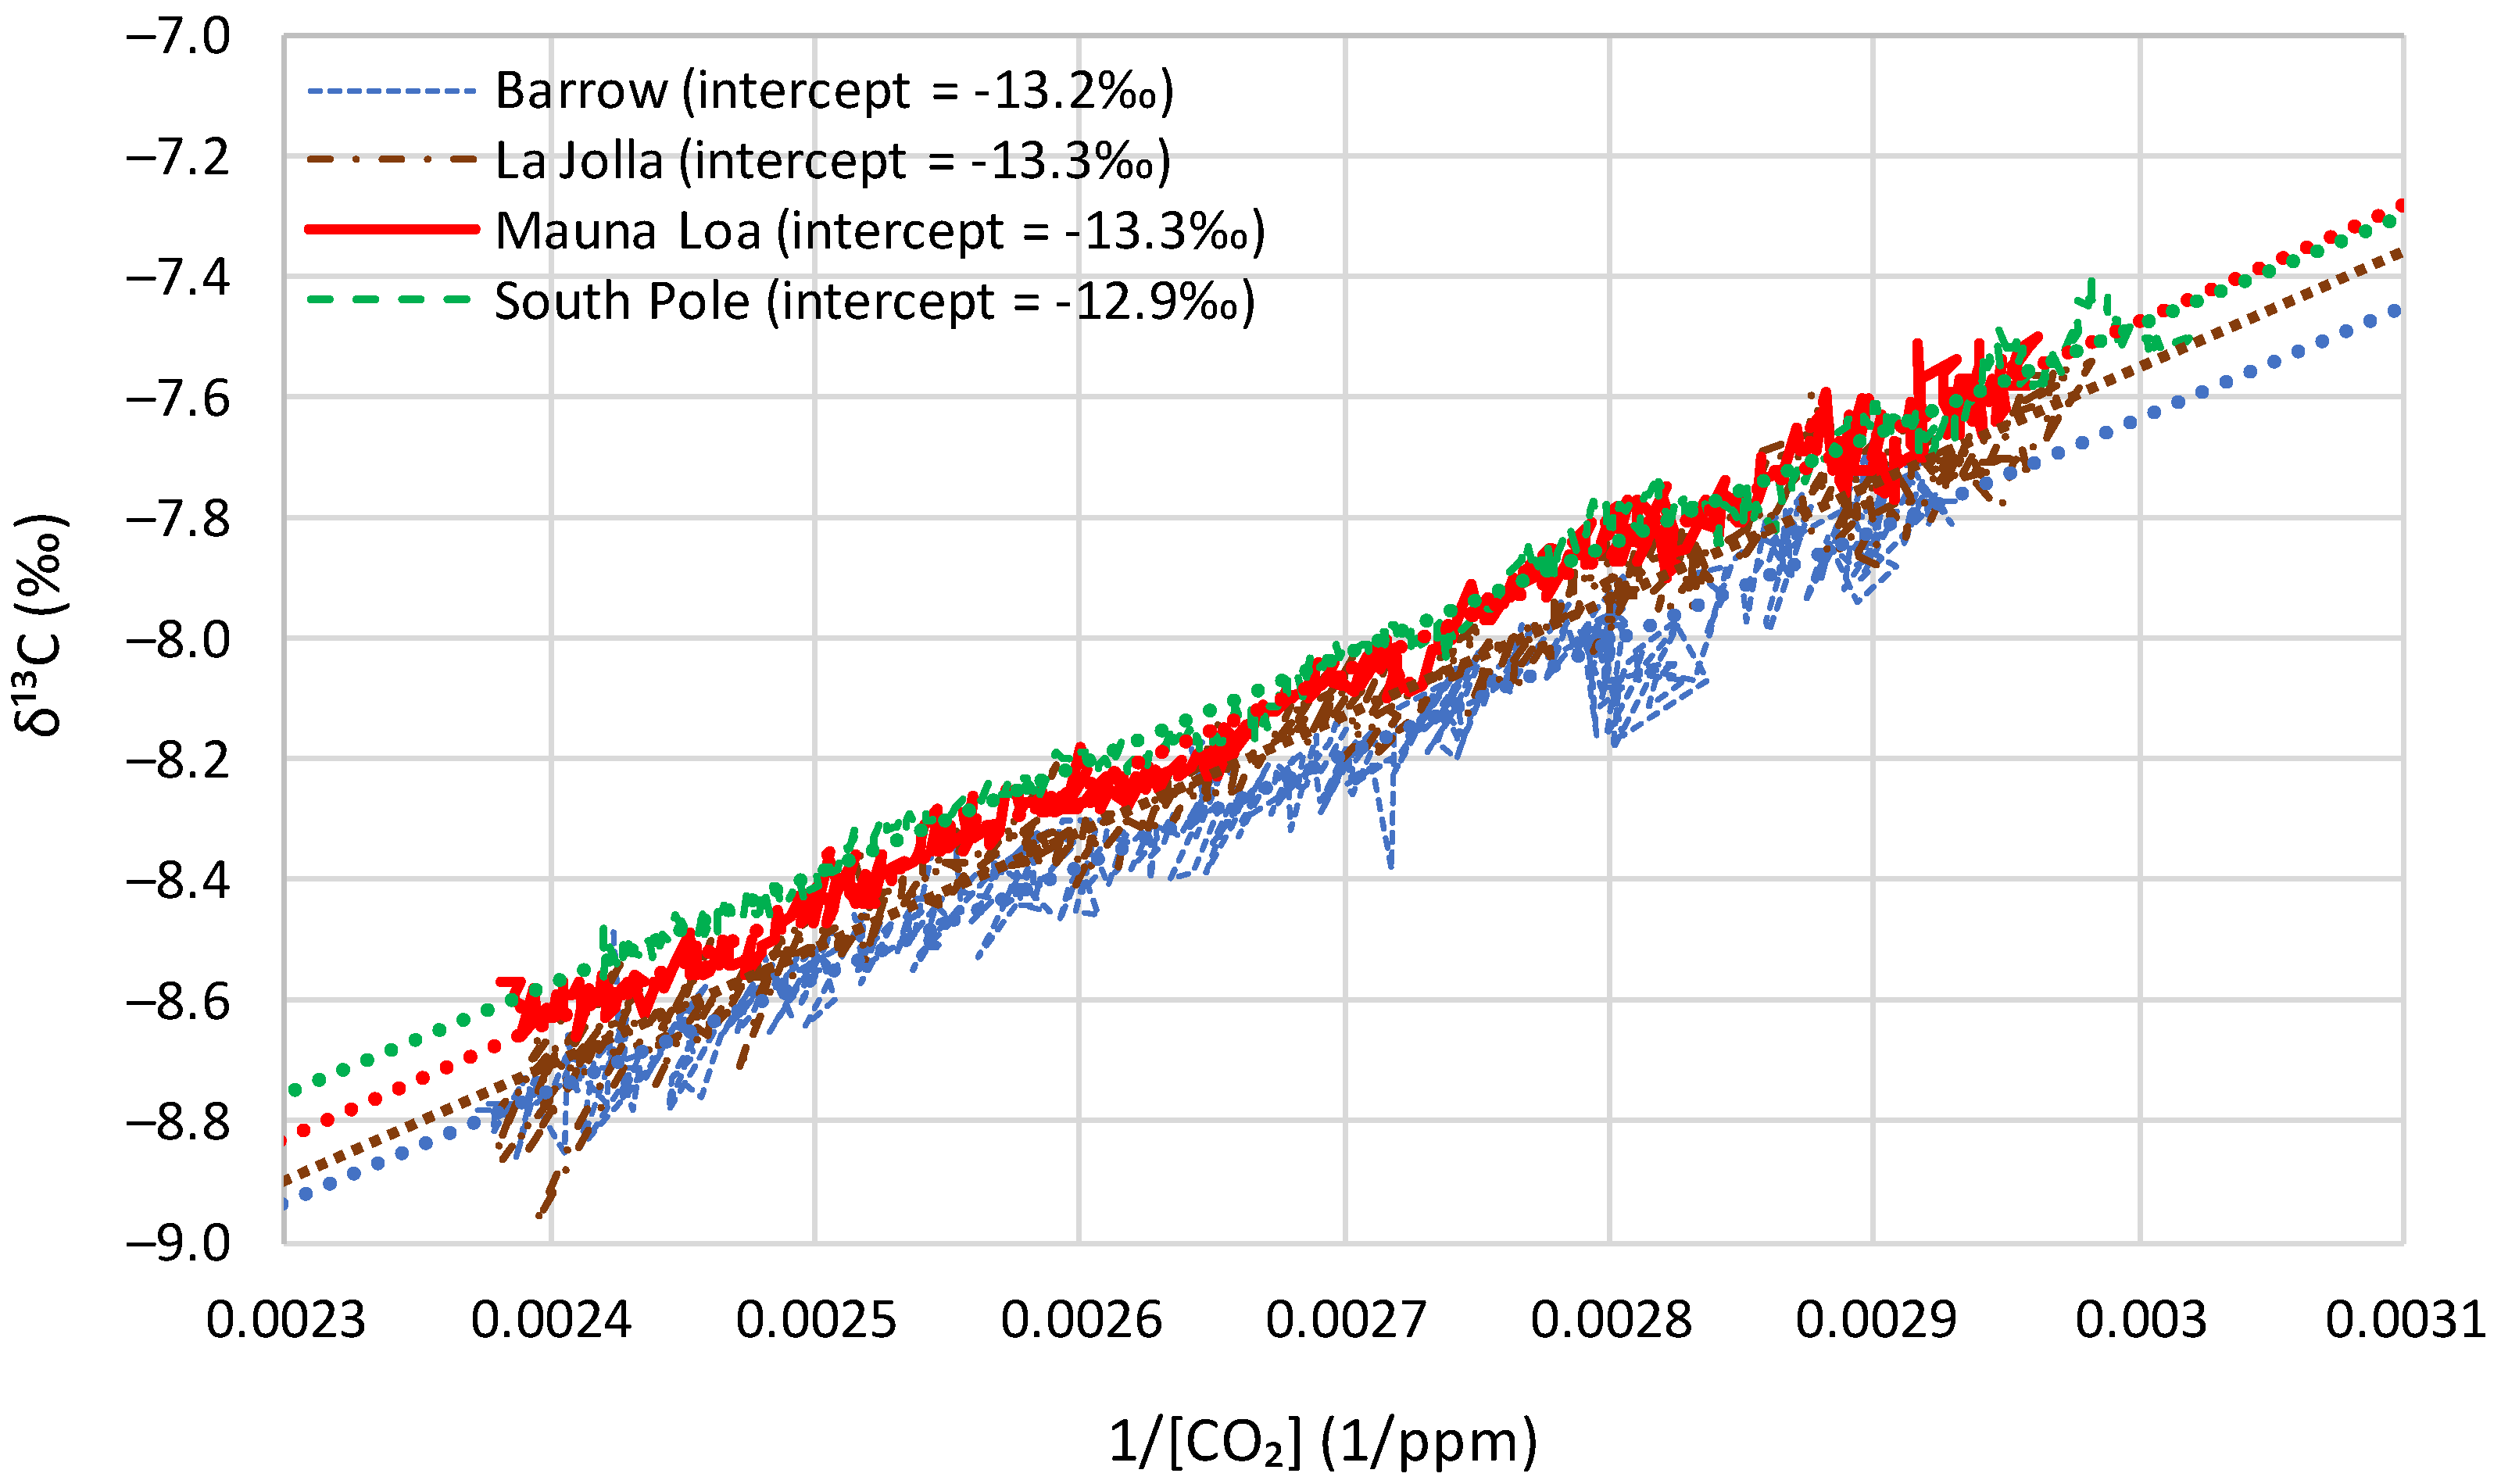
- The time series of Barrow, which is the northernmost site, exhibits a substantial seasonal variation, with an annual range of variation of nearly 1‰, almost equal to the interannual central change through the entire period of observations;
- As we go from north to south, the seasonal variation is reduced and at the South Pole it is minimal;
- Apart from the seasonal variation, the behaviours of all series are similar, as indicated by the long-term slopes in the figure.
4.2. Comparison of the Behaviours at Different Time Scales
4.3. Investigation of Over-Year Changes
4.4. Proxy Data
5. Modelling Results
5.1. Model Premises and Structure
5.2. Model Application to Instrumental Data
5.3. Model Application to Proxy Data
6. Discussion
7. Conclusions
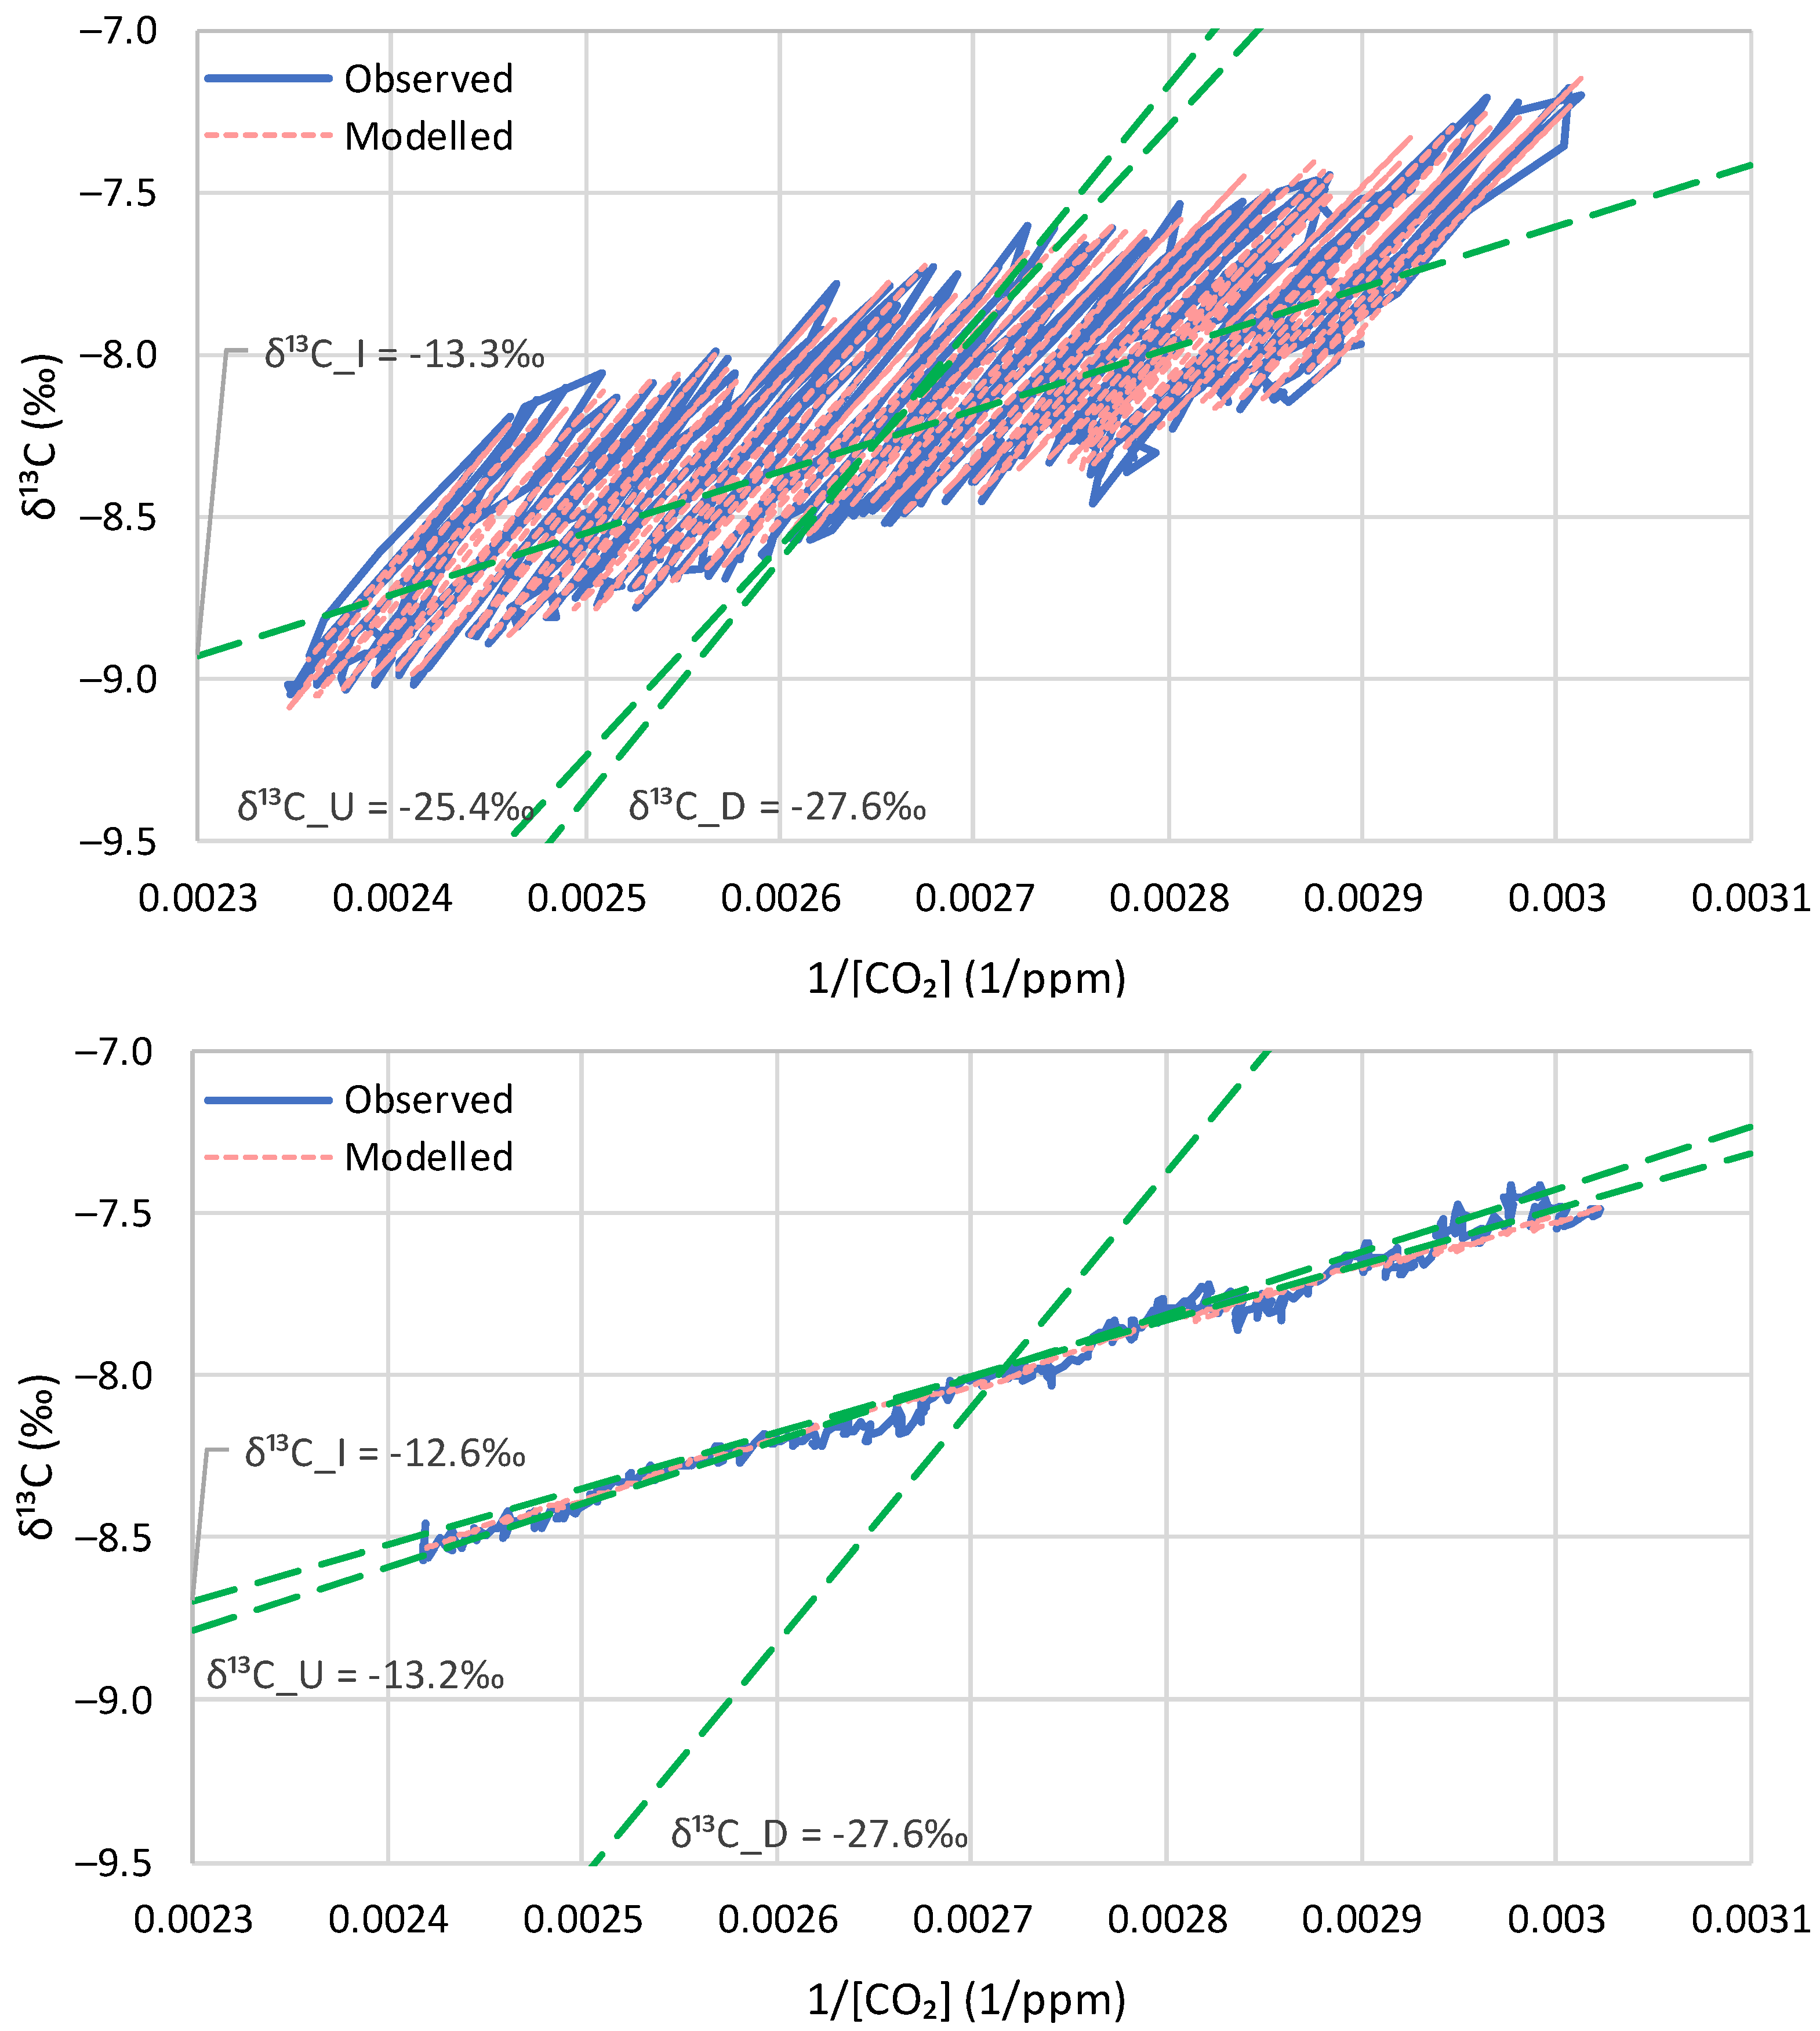
- From modern instrumental carbon isotopic data of the last 40 years, no signs of human (fossil fuel) CO2 emissions can be discerned;
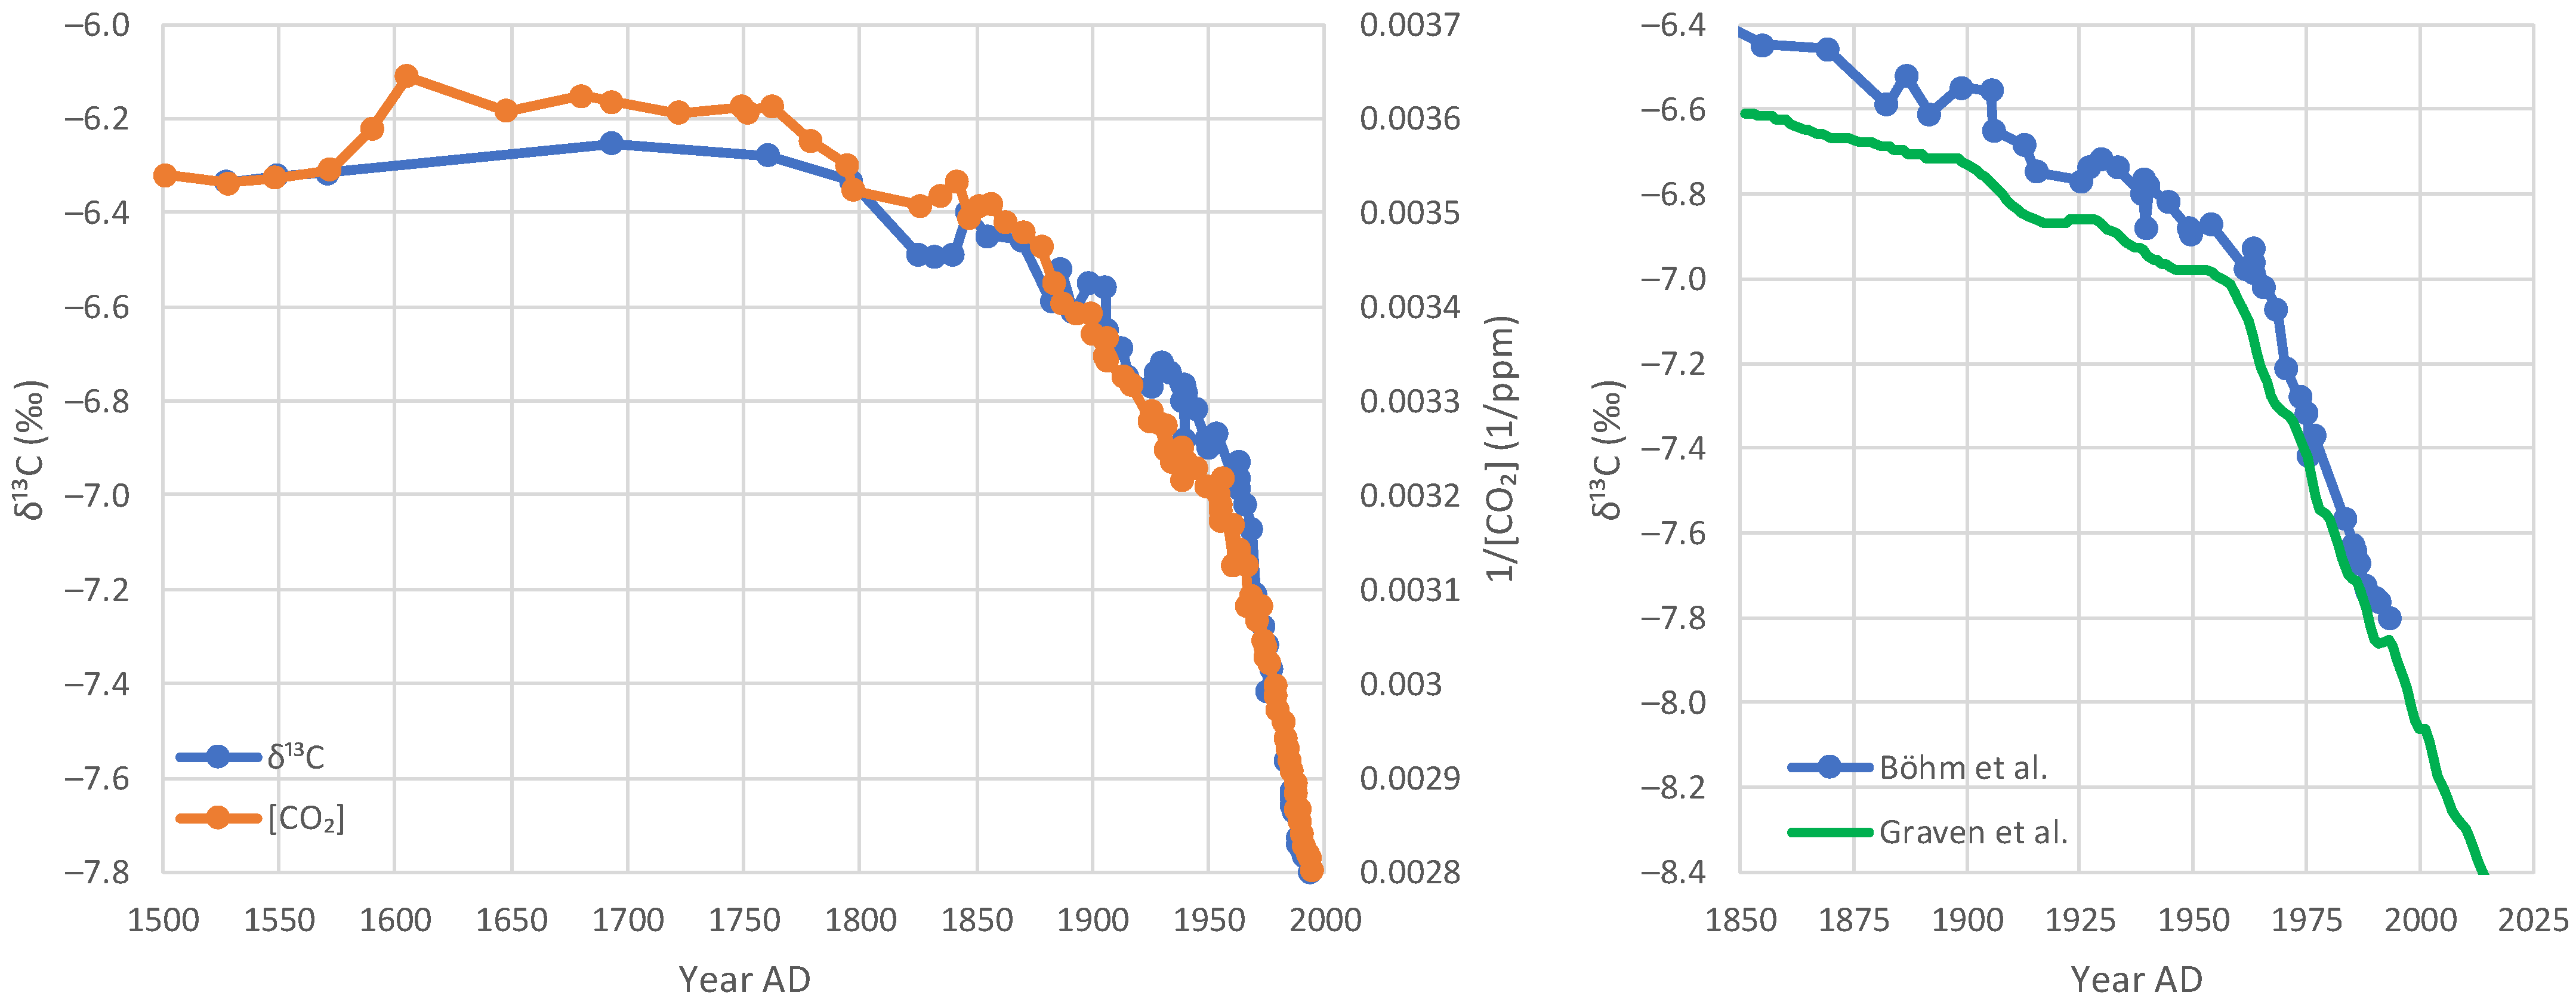
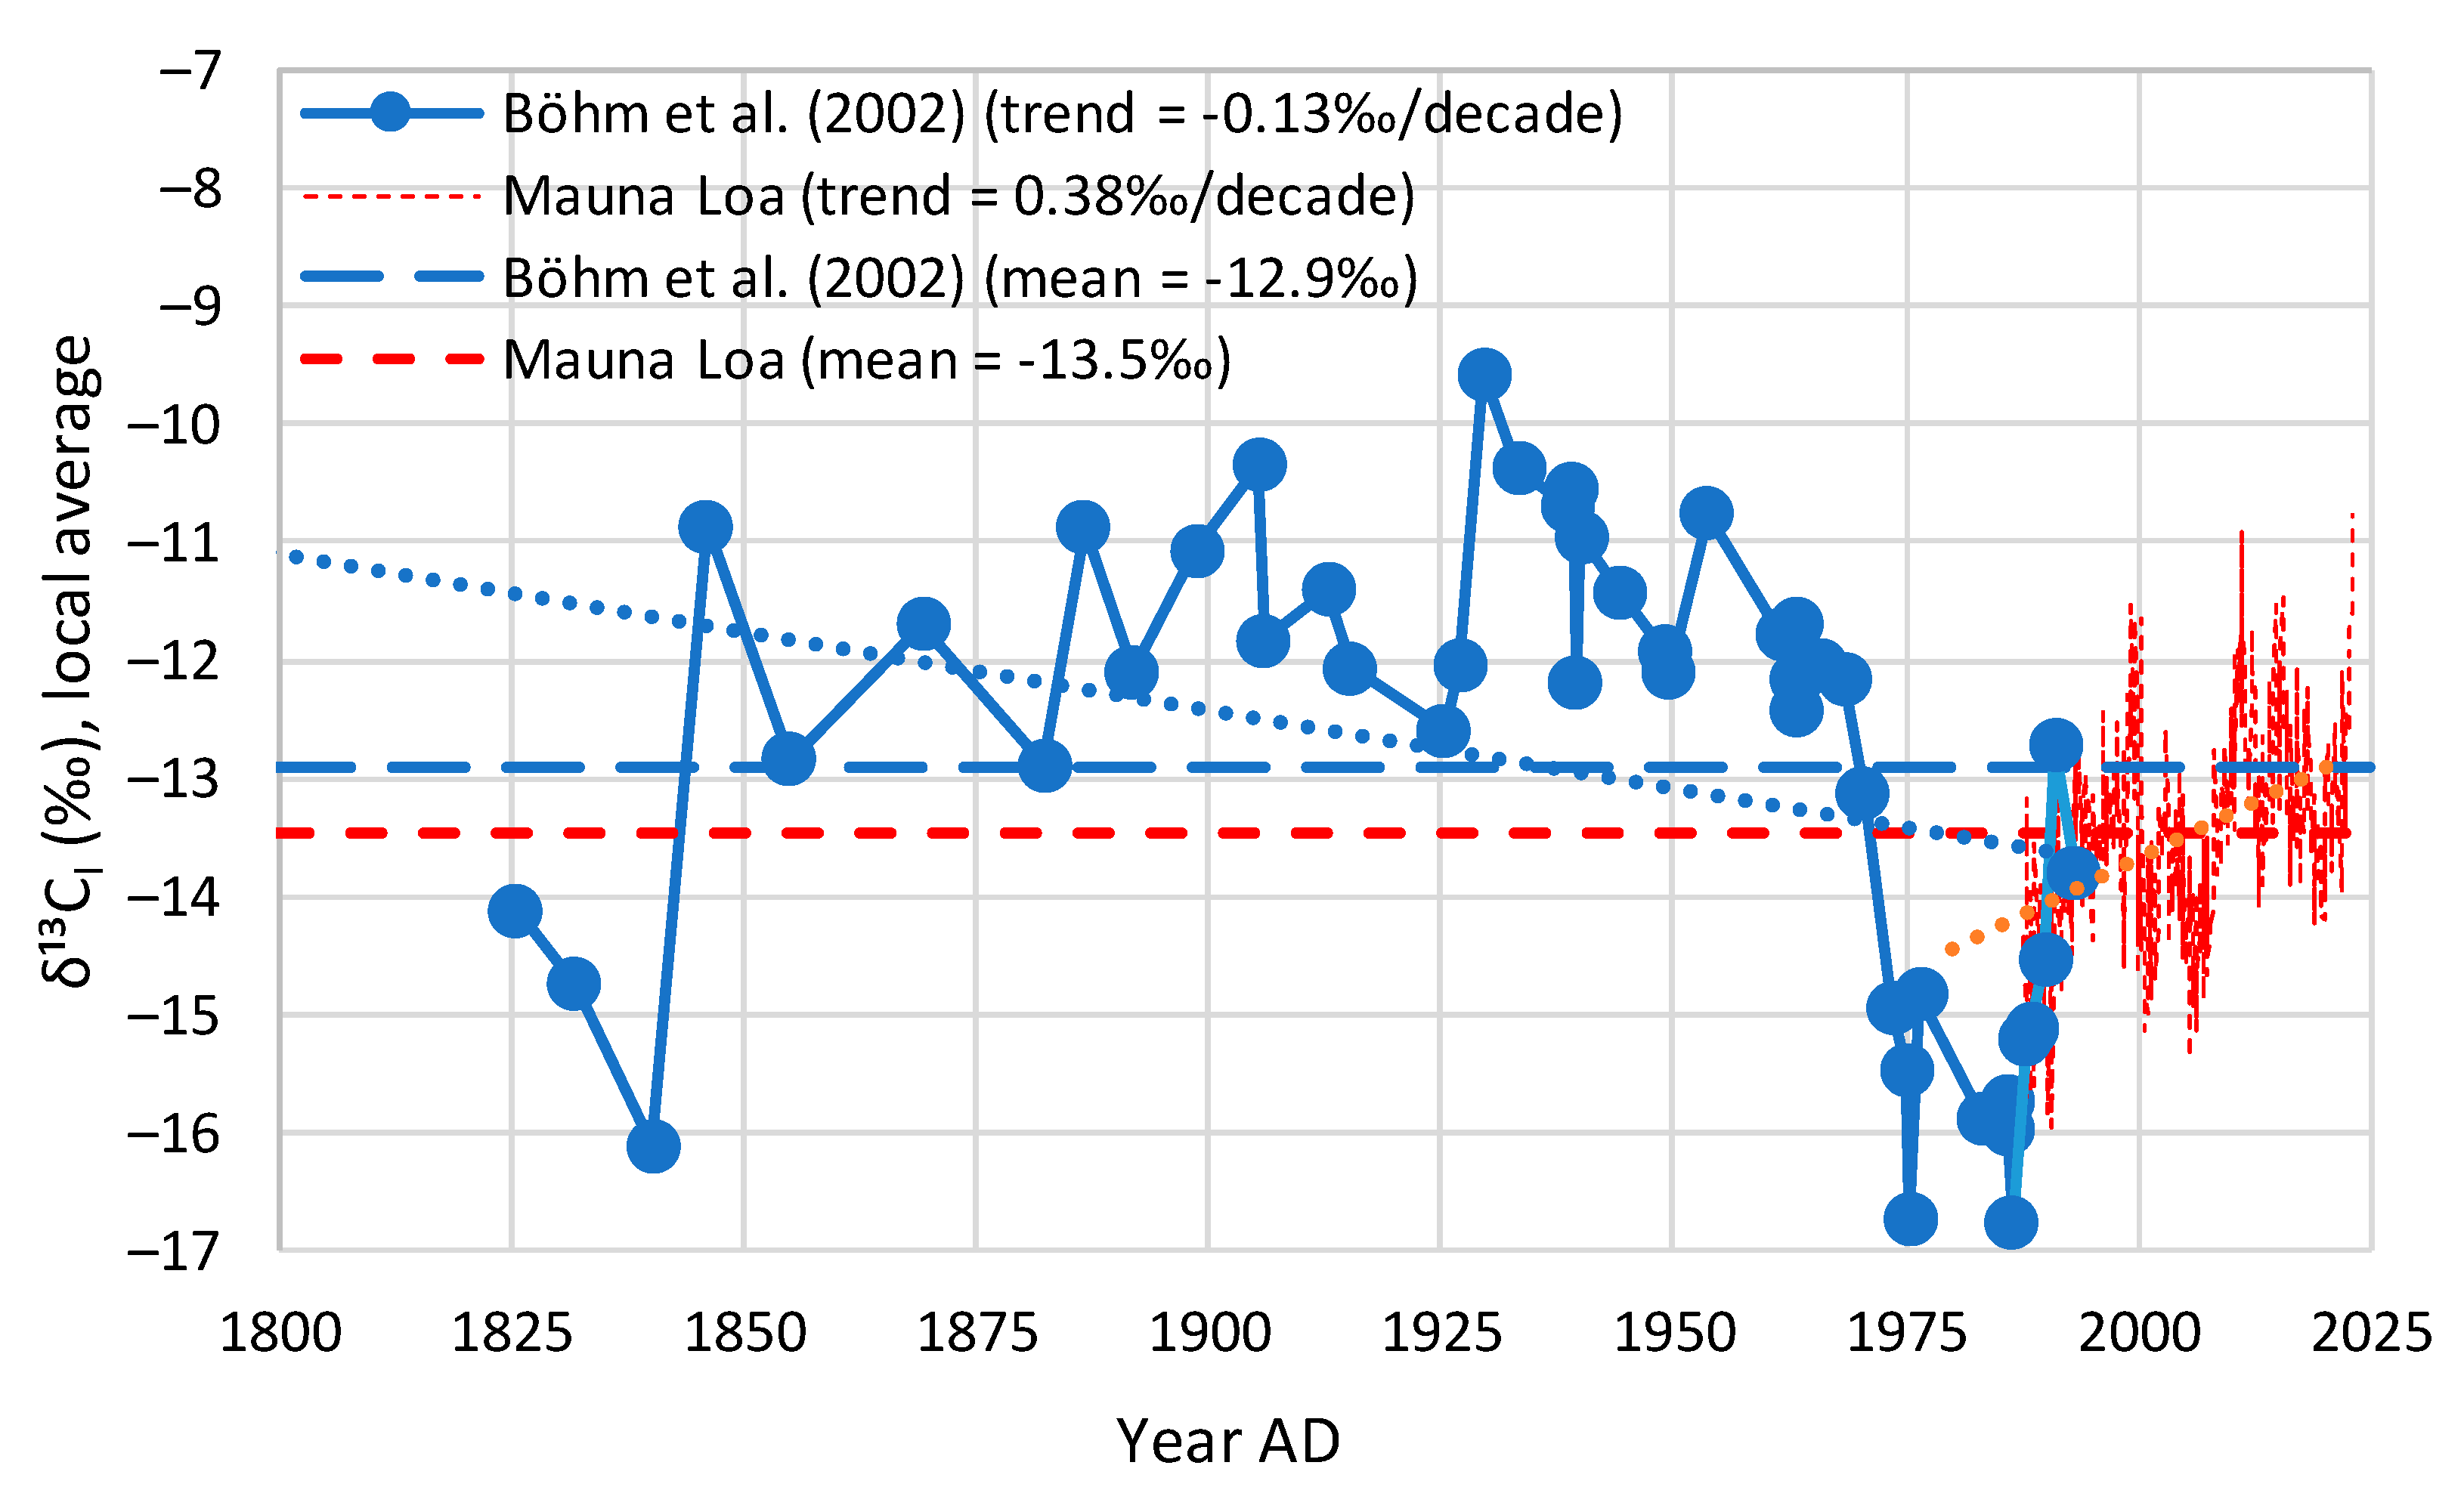
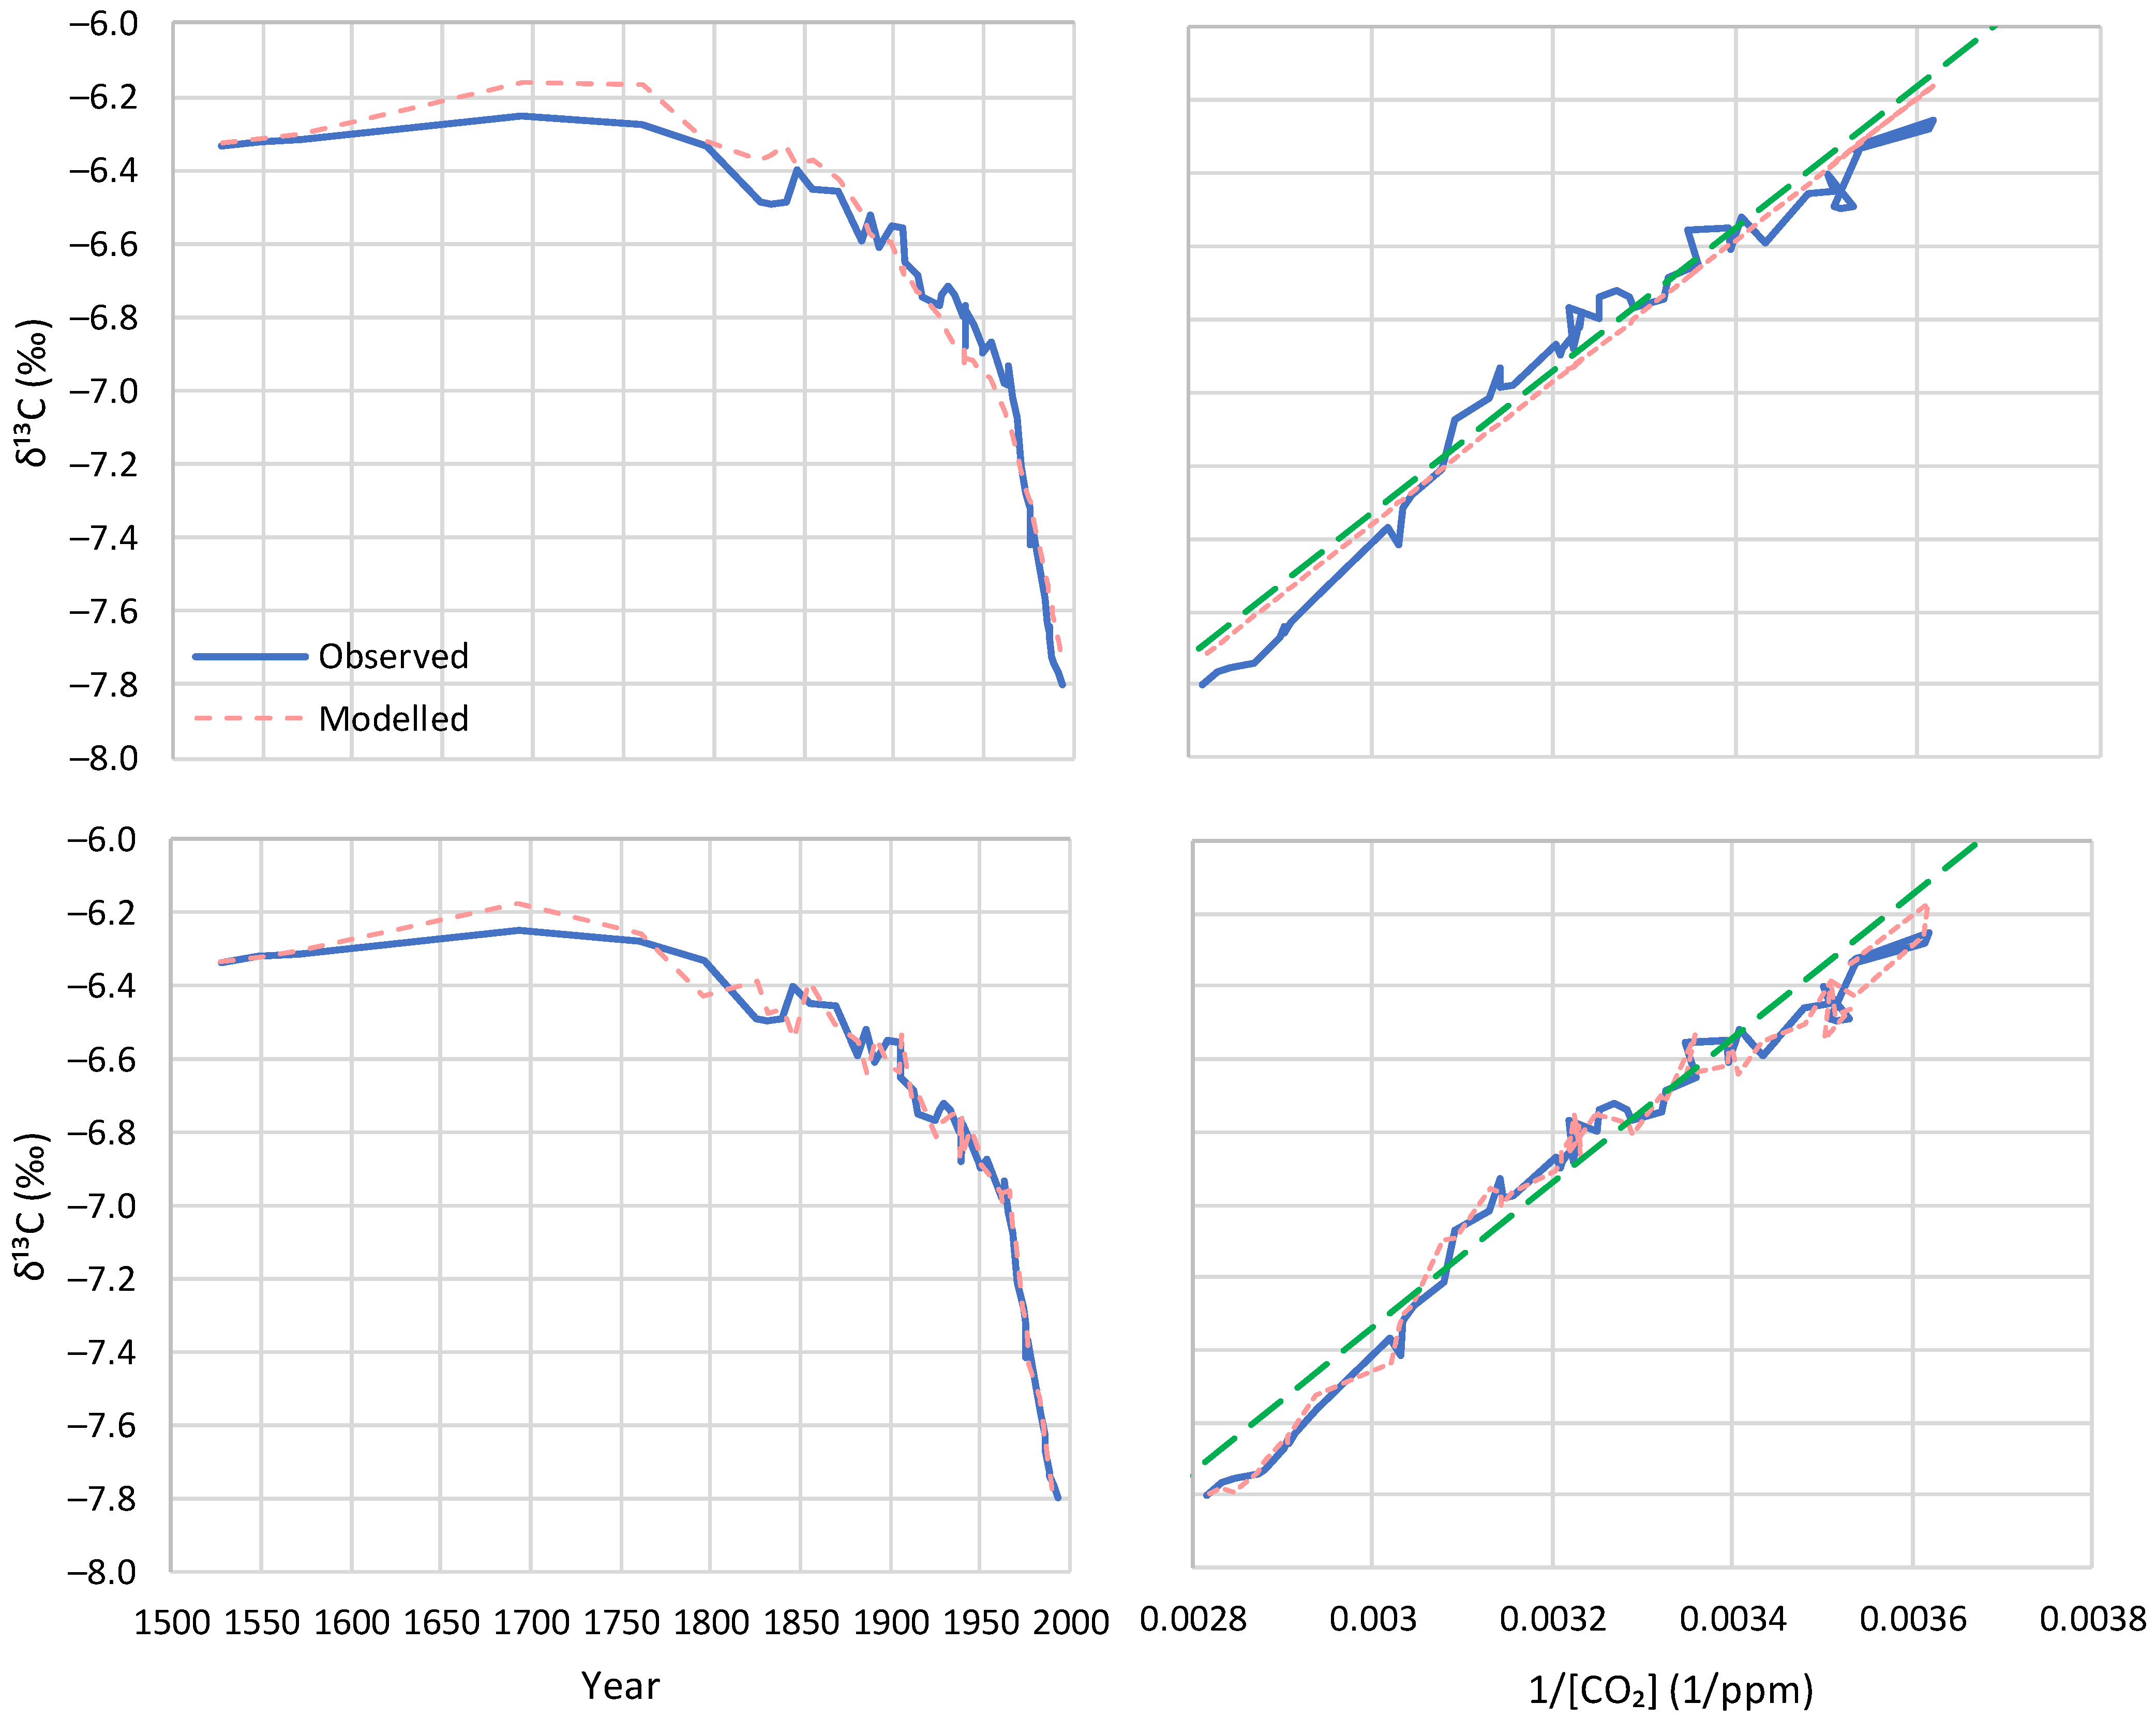
- Proxy data since the Little Ice Age suggest that the modern period of instrumental data does not differ, in terms of the net isotopic signature of atmospheric CO2 sources and sinks, from earlier centuries.
- It the 16th century, Earth entered a cool climatic period, known as the Little Ice Age, which ended at the beginning of the 19th century;
- Immediately after, a warming period began, which has lasted until now. The causes of the warming must be analogous to those that resulted in the Medieval Warm Period around 1000 AD, the Roman Climate Optimum around the first centuries BC and AD, the Minoan Climate Optimum at around 1500 BC, and other warming periods throughout the Holocene;
- As a result of the increased CO2 concentration, the isotopic signature δ13C in the atmosphere has decreased;
- The greenhouse effect on the Earth remained stable in the last century, as it is dominated by the water vapour in the atmosphere [31];
- Human CO2 emissions have played a minor role in the recent climatic evolution, which is hardly discernible in observational data and unnecessary to invoke in modelling the observed behaviours, including the change in the isotopic signature δ13C in the atmosphere.
Funding
Institutional Review Board Statement
Informed Consent Statement
Data Availability Statement
Acknowledgments
Conflicts of Interest
Appendix A. Calculations of a Two-Step Cycle of CO2 Seasonal Change
References
- Bernstein, B.M. U.N. Communications Official Touts Google Search Partnership: ‘We Own the Science’, National Review, 4 October 2022. Available online: https://www.nationalreview.com/news/u-n-communications-official-touts-google-search-partnership-we-own-the-science/ (accessed on 15 December 2023).
- Koutsoyiannis, D.; Kundzewicz, Z.W. Atmospheric temperature and CO2: Hen-or-egg causality? Sci 2020, 2, 83. [Google Scholar] [CrossRef]
- Koutsoyiannis, D.; Onof, C.; Christofides, A.; Kundzewicz, Z.W. Revisiting causality using stochastics: 1. Theory. Proc. R. Soc. A 2022, 478, 20210836. [Google Scholar] [CrossRef]
- Koutsoyiannis, D.; Onof, C.; Christofides, A.; Kundzewicz, Z.W. Revisiting causality using stochastics: 2. Applications. Proc. R. Soc. A 2022, 478, 20210835. [Google Scholar] [CrossRef]
- Koutsoyiannis, D.; Onof, C.; Kundzewicz, Z.W.; Christofides, A. On Hens, Eggs, Temperatures and CO2: Causal Links in Earth’s Atmosphere. Sci 2023, 5, 35. [Google Scholar] [CrossRef]
- Climate Etc. (Judith Curry’s Blog), Causality and Climate. 2023. Available online: https://judithcurry.com/2023/09/26/causality-and-climate/ (accessed on 15 November 2023).
- Christofides, A.; Koutsoyiannis, D.; Onof, C.; Kundzewicz, Z.W. Causality, Climate, Etc. ResearchGate 2023. [Google Scholar] [CrossRef]
- Graven, H.; Keeling, R.F.; Rogelj, J. Changes to carbon isotopes in atmospheric CO2 over the industrial era and into the future. Glob. Biogeochem. Cycles 2020, 34, e2019GB006170. [Google Scholar] [CrossRef] [PubMed]
- Craig, H. Isotopic standards for carbon and oxygen and correction factors for mass spectrometric analysis of carbon dioxide, Geochim. Cosmochim. Acta 1957, 12, 133–149. [Google Scholar] [CrossRef]
- Lueker, T.; Keeling, R.; Bollenbacher, A.; Walker, S.; Morgan, E.; Brooks, M. Calibration Methodology for the Scripps 13C/12C and 18O/16O Stable Isotope Program. 2020. Available online: https://escholarship.org/uc/item/4n93p288 (accessed on 15 November 2023).
- Suess, H.E. Radiocarbon concentration in modern wood. Science 1955, 122, 415–417. [Google Scholar] [CrossRef]
- Graven, H.; Allison, C.E.; Etheridge, D.M.; Hammer, S.; Keeling, R.F.; Levin, I.; Meijer, H.A.; Rubino, M.; Tans, P.P.; Trudinger, C.M.; et al. Compiled records of carbon isotopes in atmospheric CO2 for historical simulations in CMIP6. Geosci. Model Dev. 2017, 10, 4405–4417. [Google Scholar] [CrossRef]
- Ritchie, H.; Roser, M. CO2 Emissions. OurWorldInData.org. 2020. Available online: https://ourworldindata.org/co2-emissions (accessed on 15 December 2023).
- Global Carbon Budget (2023)—With Major Processing by Our World in Data. “Annual CO2 Emissions—GCB” [Dataset]. Global Carbon Project, “Global Carbon Budget” [Original Data]. Available online: https://ourworldindata.org/co2-and-greenhouse-gas-emissions (accessed on 15 December 2023).
- Andres, R.J.; Marland, G.; Boden, T.; Bischof, S. Carbon Dioxide Emissions from Fossil Fuel Consumption and Cement Manufacture, 1751-1991; And an Estimate of Their Isotopic Composition and Latitudinal Distribution (No. CONF-9307181-4); Oak Ridge National Laboratory: Oak Ridge, TN, USA; Oak Ridge Institute for Science and Education: Oak Ridge, TN, USA, 1994. Available online: https://www.osti.gov/servlets/purl/10185357 (accessed on 15 December 2023).
- Andres, R.J.; Marland, G.; Boden, T.; Bischof, S. Carbon dioxide emissions from fossil fuel consumption and cement manufacture, 1751–1991, and an estimate of their isotopic composition and latitudinal distribution. In The Carbon Cycle; Wigley, T.M., Schimel, D.S., Eds.; Cambridge University Press: Cambridge, UK, 2000; pp. 53–62. [Google Scholar]
- Zhu, Z.; Piao, S.; Myneni, R.B.; Huang, M.; Zeng, Z.; Canadell, J.G.; Ciais, P.; Sitch, S.; Friedlingstein, P.; Arneth, A.; et al. Greening of the Earth and its drivers. Nat. Clim. Change 2016, 6, 791–795. [Google Scholar] [CrossRef]
- Chen, C.; Park, T.; Wang, X.; Piao, S.; Xu, B.; Chaturvedi, R.K.; Fuchs, R.; Brovkin, V.; Ciais, P.; Fensholt, R.; et al. China and India lead in greening of the world through land-use management. Nat. Sustain. 2019, 2, 122–129. [Google Scholar] [CrossRef] [PubMed]
- Li, Y.; Li, Z.L.; Wu, H.; Zhou, C.; Liu, X.; Leng, P.; Yang, P.; Wu, W.; Tang, R.; Shang, G.F.; et al. Biophysical impacts of earth greening can substantially mitigate regional land surface temperature warming. Nat. Commun. 2023, 14, 121. [Google Scholar] [CrossRef] [PubMed]
- Keeling, C.D.; Piper, S.C.; Whorf, T.P.; Keeling, R.F. Evolution of natural and anthropogenic fluxes of atmospheric CO2 from 1957 to 2003. Tellus B Chem. Phys. Meteorol. 2011, 63, 1–22. [Google Scholar] [CrossRef]
- Scripps CO2 Program, Sampling Station Records. Available online: https://scrippsco2.ucsd.edu/data/atmospheric_co2/sampling_stations.html (accessed on 15 November 2023).
- Keeling, C.D.; Piper, S.C.; Bacastow, R.B.; Wahlen, M.; Whorf, T.P.; Heimann, M.; Meijer, H.A. Exchanges of Atmospheric CO2 and 13CO2 with the Terrestrial Biosphere and Oceans from 1978 to 2000. I. Global Aspects; SIO Reference Series No. 01-06; Scripps Institution of Oceanography: San Diego, CA, USA, 2001; 28p. [Google Scholar]
- Keeling, C.D.; Piper, S.C.; Bacastow, R.B.; Wahlen, M.; Whorf, T.P.; Heimann, M.; Meijer, H.A. Atmospheric CO2 and 13CO2 exchange with the terrestrial biosphere and oceans from 1978 to 2000: Observations and carbon cycle implications. In A History of Atmospheric CO2 and Its Effects on Plants; Ehleringer, J.R., Cerling, T.E., Dearing, M.D., Eds.; Springer: New York, NY, USA, 2005; pp. 83–113. [Google Scholar]
- Böhm, F.; Haase-Schramm, A.; Eisenhauer, A.; Dullo, W.C.; Joachimski, M.M.; Lehnert, H.; Reitner, J. Evidence for preindustrial variations in the marine surface water carbonate system from coralline sponges. Geochem. Geophys. Geosyst. 2002, 3, 1–13. [Google Scholar] [CrossRef]
- Keeling, C.D. The concentration and isotopic abundance of carbon dioxide in rural areas. Geochim. Cosmochim. Acta 1958, 13, 322–334. [Google Scholar] [CrossRef]
- Keeling, C.D. The concentration and isotopic abundance of carbon dioxide in rural and marine air. Geochim. Cosmochim. Acta 1961, 24, 277–298. [Google Scholar] [CrossRef]
- Miller, J.B.; Tans, P.P. Calculating isotopic fractionation from atmospheric measurements at various scales. Tellus B Chem. Phys. Meteorol. 2003, 55, 207–214. [Google Scholar] [CrossRef]
- Köhler, P.; Fischer, H.; Schmitt, J.; Munhoven, G. On the application and interpretation of Keeling plots in paleo climate research–deciphering δ13C of atmospheric CO2 measured in ice cores. Biogeosciences 2006, 3, 539–556. [Google Scholar] [CrossRef]
- Koutsoyiannis, D. Stochastics of Hydroclimatic Extremes–A Cool Look at Risk, 3rd ed.; Kallipos Open Academic Editions: Athens, Greece, 2023; 391p, ISBN 978-618-85370-0-2. [Google Scholar] [CrossRef]
- IPCC. Climate Change 2021: The Physical Science Basis. In Contribution of Working Group I to the Sixth Assessment Report of the Intergovernmental Panel on Climate Change; Masson-Delmotte, V.P., Zhai, A., Pirani, S.L., Connors, C., Péan, S., Berger, N., Caud, Y., Chen, L., Goldfarb, M.I., Gomis, M., et al., Eds.; Cambridge University Press: Cambridge, UK; New York, NY, USA, 2021; 2391p. [Google Scholar] [CrossRef]
- Koutsoyiannis, D.; Vournas, C. Revisiting the greenhouse effect—A hydrological perspective. Hydrol. Sci. J. 2024, 69, 151–164. [Google Scholar] [CrossRef]
- Chen, X.; Chen, T.; He, B.; Liu, S.; Zhou, S.; Shi, T. The global greening continues despite increased drought stress since 2000. Glob. Ecol. Conserv. 2024, 49, e02791. [Google Scholar] [CrossRef]










| Station Name | Station Code | Latitude | Longitude | Elevation (m) | Dates |
|---|---|---|---|---|---|
| Barrow, Alaska | PTB | 71.3° N | 156.6° W | 11 | 1982–present |
| La Jolla Pier, California | LJO | 32.9° N | 117.3° W | 10 | 1978–present |
| Mauna Loa Observatory, Hawaii | MLO | 19.5° N | 155.6° W | 3397 | 1978–present |
| South Pole | SPO | 90.0° S | 2810 | 1977–present |
| Subperiod | Years | Human CO2 Emissions, Gt C/Year | [CO2], ppm | # Data Points of |
|---|---|---|---|---|
| A | 1520–1898 | 0–0.5 | 283–295 | 16 |
| B | 1899–1976 | 0.5–5 | 296–330 | 27 |
| C | 1977–1997 | >5 | >331 | 10 |
| Time Series | ‰ | , ‰ (Months of Application) | Initial Conditions ‰) | ‰ w/o Update (w/Update) | Bias (%) w/o Update (w/Update) | Explained Variance (%) w/o Update (w/Update) |
|---|---|---|---|---|---|---|
| Barrow | −25.4 | −27.6 (6,7) | −7.9 (−8.4) | −13.3 (−13.3) | 0.0 (0.0) | 98.7 (98.2) |
| La Jolla | −24.6 | −27.6 (6,7) | −7.8 (−8.2) | −13.5 (−13.5) | 0.0 (0.0) | 97.8 (98.2) |
| Mauna Loa | −21.2 | −27.6 (6,7) | −7.6 (−8.0) | −13.3 (−13.3) | 0.0 (0.0) | 98.1 (98.9) |
| South Pole | −13.2 | −27.6 (11,12) | −7.5 (−7.8) | −12.6 (−12.6) | 0.0 (0.0) | 98.6 (99.5) |
| Proxy, Böhm et al. [24] | −13.2 | −13.2 (n/a) | −6.3 (n/a) | −13.2 (−13.2) | 0.0 (0.0) | 95.9 (98.4) |
| Time Series | Keeling Plot Intercept | Mean (and Linear Trend) of Local Averages of | Long-Term Average from Model |
|---|---|---|---|
| Barrow | −13.2 | −13.3 (+0.07) | −13.3 |
| La Jolla | −13.3 | −13.5 (−0.08) | −13.5 |
| Mauna Loa | −13.3 | −13.5 (+0.38) | −13.3 |
| South Pole | −12.9 | −12.7 (−0.27) | −12.6 |
| Proxy, Böhm et al. [24] | −13.3 | −12.9 (−0.13) | −13.2 |
| Average | −13.2 | −13.2 (+0.01) | −13.2 |
Disclaimer/Publisher’s Note: The statements, opinions and data contained in all publications are solely those of the individual author(s) and contributor(s) and not of MDPI and/or the editor(s). MDPI and/or the editor(s) disclaim responsibility for any injury to people or property resulting from any ideas, methods, instructions or products referred to in the content. |
© 2024 by the author. Licensee MDPI, Basel, Switzerland. This article is an open access article distributed under the terms and conditions of the Creative Commons Attribution (CC BY) license (https://creativecommons.org/licenses/by/4.0/).
Share and Cite
Koutsoyiannis, D. Net Isotopic Signature of Atmospheric CO2 Sources and Sinks: No Change since the Little Ice Age. Sci 2024, 6, 17. https://doi.org/10.3390/sci6010017
Koutsoyiannis D. Net Isotopic Signature of Atmospheric CO2 Sources and Sinks: No Change since the Little Ice Age. Sci. 2024; 6(1):17. https://doi.org/10.3390/sci6010017
Chicago/Turabian StyleKoutsoyiannis, Demetris. 2024. "Net Isotopic Signature of Atmospheric CO2 Sources and Sinks: No Change since the Little Ice Age" Sci 6, no. 1: 17. https://doi.org/10.3390/sci6010017
APA StyleKoutsoyiannis, D. (2024). Net Isotopic Signature of Atmospheric CO2 Sources and Sinks: No Change since the Little Ice Age. Sci, 6(1), 17. https://doi.org/10.3390/sci6010017


