Abstract
COVID-19-related restrictions disrupted children’s lifestyle habits, leading to significant changes in health behaviours. The ASOMAD study aimed to analyse the consequences of these restriction in lifestyle habits of children aged 8–12 in Madrid over three waves (three academic years). The results showed that approximately 20% of boys were overweight during and after the pandemic, with similar trends observed in girls (14.7% and 18.2%, respectively). Obesity rates for boys were high in the first wave (20.1%) but dropped to less than 10% in subsequent waves, while girls’ rates remained stable. Physical activity levels decreased significantly, with 87.6% of girls failing to meet daily activity recommendations by the third wave. Boys exhibited worse adherence to recommended screen time limits than girls, particularly on weekends, where over 90% of boys exceeded guidelines. Adherence to the Mediterranean diet remained low, with over 50% of the sample categorized in medium- or low-adherence groups across all waves. In conclusion, lockdown may have increased sedentary behaviour, poor diet, and excessive screen time in children. The damage persistency, due to mobility restriction, affected some of the healthy lifestyle variables in our sample three years after.
1. Introduction
According to the World Health Organization (WHO), in 2022, over 390 million children and adolescents aged 5 to 19 were classified as overweight, of whom 160 million were living with obesity [1]. Beyond the issue of excess weight, these conditions reflect broader challenges related to lifestyle habits and health determinants that are vital for children’s physical, emotional, and social development [2,3,4,5]. Lifestyle patterns established during childhood often persist into adulthood, influencing long-term health and well-being [6,7,8,9,10,11,12,13,14,15,16,17]. The consequences of obesity and unhealthy lifestyles extend beyond physical health, facing higher risks of type 2 diabetes, hypertension, and cardiovascular diseases [18,19,20,21,22]. Addressing these issues early in life is essential not only for preventing chronic diseases but also for fostering overall development, including mental, social, and emotional health [23,24,25,26]. In fact, unhealthy behaviours, such as insufficient physical activity, excessive screen time, poor dietary choices, and inadequate sleep, are associated with psychological risks, including low self-esteem, anxiety, and reduced academic performance [27,28,29,30,31,32,33,34,35,36]. This study highlights the critical need to address unhealthy lifestyles. Implementing structured physical activity programs in schools and communities is essential to combat declining activity levels, while promoting healthy diet, especially in disadvantaged groups. Educating families and schools on setting limits for recreational screen time, is equally important to mitigate its negative effects on physical and emotional well-being. Following Baldassano et al. [37], integrating mindfulness, exercise, and nutrition programs offers a comprehensive approach to improving overall well-being. Regular monitoring of children’s health behaviours is vital to adapt interventions and reduce the long-term impacts of COVID-19, fostering healthier habits from an early age.
The COVID-19 pandemic began in Wuhan, China, in December 2019, leading to its declaration as a global health emergency by the WHO on 30 January 2020, and a pandemic on 11 March 2020. In Spain, the first case was confirmed on 31 January 2020, and a state of alarm was declared on 14 March 2020, initiating a nationwide lockdown [38].
Countries around the world implemented different restrictions to avoid the spreading of the SARS-CoV2 virus, being Spain one of the most restrictive countries in Europe [38]. Before the pandemic, unhealthy patterns among children were already a focus of public health attention, but overweight and obesity rates seemed to be stabilising somewhat in recent years [39,40]. Lockdown measures of COVID-19 further disrupted routines, limiting physical activity opportunities and increasing sedentary behaviours [41,42,43,44]. These effects were particularly pronounced in the city of Madrid (Spain), a densely populated city with over 3.2 million residents [45], where strict lockdown measures were carried out [46,47]. This situation combined with the city’s socioeconomic diversity, created unique challenges for promoting healthy lifestyles, as limited resources in some areas compounded the impact of the pandemic [48]. The COVID-19 pandemic has significantly influenced children’s health and lifestyle habits, exacerbating pre-existing concerns while also impacting other vulnerable populations, such as adolescents and postpartum women. Increased screen time, reduced physical activity, and heightened anxiety and depression were common issues, with postpartum women additionally facing caregiving burdens, limited healthcare access, and isolation. These findings align with this study, highlighting the need for targeted interventions, such as mental health support, structured activity programs, and enhanced social support systems, to address the long-term effects of lockdowns. Including data on these groups would provide a broader understanding of the pandemic’s psychological impact [2,3,4,5,6,7,8].
The aim of this study is to describe and analyse the lifestyle habits of children living in Madrid after the lockdown and during the following years.
2. Materials and Methods
2.1. Study Design and Participants
The ASOMAD study represents a cross-sectional cohort study designed to assess lifestyle habits, sedentary behaviours, and health status among a representative sample of school-aged children (8 to 12 years old), in the city of Madrid, and their evolution over time. Through a descriptive, exploratory, and incidental approach, this study utilized a multi-stage and random allocation method to select the target population. Three waves’ data were collected during the academic years 2020–2021, 2021–2022, and 2022–2023 late fall-winter seasons.
The summary of data collection timetable is shown in Figure 1. Children in Spain were confined to their homes from 14 March 2020, when a state of alert was declared due to COVID-19, until 26 April 2020, when they were allowed out for the first time for short trips [48]. During this total confinement of 43 days, they could only leave their homes for essential needs, such as medical care or food shopping. Initial actions included school closures, access to playground was forbidden, and a shift to remote learning, from March to May 2020. School classes re-started in September 2020 under strict security measures. As restrictions eased, protocols such as mandatory face masks for children aged six and above, increased ventilation in classrooms, and the introduction of classroom bubbles in early education and primary schools were enforced (ASOMAD 1 data collection, Figure 1). The restrictions coinciding with the second wave of measurements (ASOMAD 2, Figure 1) were medium restrictions in the playgrounds, keeping smaller groups in the classrooms, and the use of face masks [46,47]. By January 2022, quarantine policies were relaxed, limiting isolation to seven days and discontinuing full-class quarantines for single positive cases. In Spain, COVID-19 vaccination campaigns for children began in stages. Adolescents aged 12 and older started receiving vaccines in June 2021. During the measures in the third wave, playgrounds and public spaces reopening was phased, with limited capacity and regular disinfection protocols initially in place, that started in. Over time, these measures were eased to restore normal activities while addressing the emotional and social needs of children following prolonged restrictions [48].
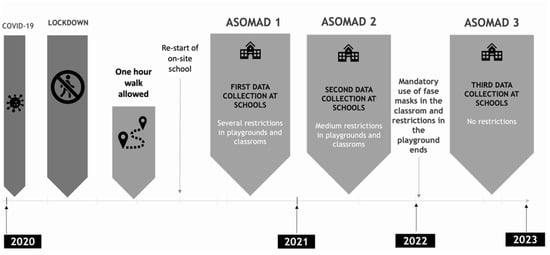
Figure 1.
Data collection timetable ASOMAD Study.
2.2. Sample Size and School Selection
To fulfil the project objectives, a population sampling of 8-to-12-year-olds in Madrid was conducted by zones and/or districts. Figure 2 shows the process to get the target population. The 21 districts of Madrid city were considered as the first level of population grouping. From here, clusters of districts meeting the condition of being at a similar mid-level income (3 levels) and geographically close were formed (map explanation in Figure 2). These 21 districts were reduced to 10 clusters of homogeneous income and geographic proximity. A study of demographic data was conducted to gain knowledge of the total population and differences in the child/adult population ratio and other elements to consider for subsequent analyses according to the Institute of Statistics of the Madrid Community and Madrid City Council [45].
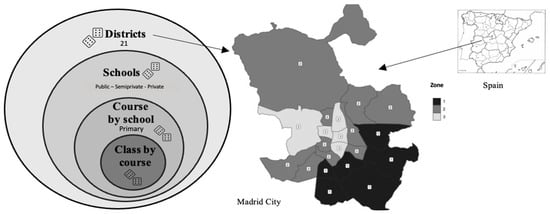
Figure 2.
Multistage randomisation to obtain target sample.
Upon this classification of 10 zones, the identification of the distribution of the school space in primary education corresponding to the study population was performed. This includes the number of schools that would form the target population and their classification by ownership.
The sample was estimated on classrooms of 25 pupils. This is the limit of students per classroom established by Spanish law at this educational stage [49]. A minimum of 70% response rate was considered, and an expected compliance of 360 final subjects, which has been achieved in all waves. The final sampling was affected by circumstances such as boosting the number of private or charter schools in some districts and having to use those from the district assigned to their area. In some schools, due to the low number of children in the selected course, it was decided to modify the course in which measurements were taken, always trying to balance the sample. The Income Indicator factor (3 levels) was taken as the most determining factor to identify homogeneous populations and for the sampling to be technically feasible with guarantees a population balance in terms of age and school ownership. In each of the 3 clusters of districts by Income, around 120 students were estimated to be necessary to complete the sample, to which 40 additional cases (10%) were added to ensure the sample in case of loss of estimated population.
Next, the distribution of courses (3rd, 4th, 5th, 6th) and school ownership (public, semiprivate, private) necessary for the sample to be representative of the population was calculated with the given size. Primary students in the city of Madrid presented the following distribution by school ownership: 40% public schools, 40% charter schools, and 20% private schools. It is considered similar across courses [45].
The census of schools in the city of Madrid characterized by their ownership and district group (categorization into 10 clusters) was considered, and a possible class to be interviewed was randomly assigned to them. Some were reserved for those guaranteeing their participation. This assignment was balanced by ownership and district group. Each of these participating schools belonged to a district of the city of Madrid (or in its adjoining district area, in those cases where there were no centres willing to participate in the district).
Once the school’s administration approved participation, a senior researcher from the ImFINE research group delivered the documentation to the school to be passed on to the families, and once signed, the informed consent was returned to the school [49].
Researchers were vaccinated, and every 10 days, all researchers underwent serum IgG and IgM antibody COVID-19 testing, in addition to using PPE (Personal Protective Equipment), such as FFP2 masks and gloves. Additional safety measures, such as ventilating the rooms where the data was collected and measuring environmental CO2, as well as the proper disinfection of measurement devices and computers after each subject’s use, were also performed.
2.3. Inclusion and Exclusion Criteria
Children who were enrolled in a participating school were eligible for inclusion. Pupils with a severe intellectual disability that would have prevented them from responding to the lifestyle questionnaires would have been excluded from the study; however, no such cases were present.
2.4. Materials
Anthropometric measurements were carried out using validated instruments. For height: SECA 217 Stadiometer, and waist circumference measurements with the SECA 201 measuring tape, with a precision of 0.1 cm (SECA, Hamburg, Germany). Bioimpedance analysis (BIA): Using the Tanita DC-240MA system (TANITA, Tokyo, Japan) providing weight, and percentage of body fat and water. Subsequently, the BMI was calculated as body mass (kg) divided by height (m2), and the weight status of the children was classified according to the cut-off points established by the WHO [50].
Furthermore, in this study encompassed various aspects of lifestyle variables, utilizing self-reported questionnaires validated by scientific literature and completed by the children themselves on-site in schools, under controlled conditions with support from the research team and school staff at each centre. Without influencing their responses, the following data were collected:
Moderate to Vigorous Physical Activity (MVPA) was assessed using the PAU7-S questionnaire [51]. This instrument collects information on the duration of MVPA over a period of seven days, providing insight into participants’ physical activity levels throughout the week. The children with a low level of physical activity would be those who do not meet the minimum recommendations of 60 min of MVPA per day according to the WHO for these ages [52].
Mediterranean diet adherence (MDA) was evaluated using the KidMED Index questionnaire. This tool is used to assess the quality of the diet in children and adolescents. It is based on a 16-item questionnaire that evaluates different aspects of diet, focusing on adherence to the Mediterranean diet. The standard classification of the KidMED Index defines three categories: low adherence (0–3 points), medium adherence (4–7 points), and high or optimal adherence (8–12 points) [53]. For this study, results were classified into two categories: optimal adherence (≥8) and suboptimal adherence (<8).
Screen time on weekdays (WK) and weekends (WD) were examined using the SSBQ (Screen Sedentary Behaviour Questionnaire) [54]. This questionnaire captures participants’ daily screen time habits, including time spent on activities such as watching TV, using computers, playing video games, and the use of smartphones, offering insights into sedentary behaviour patterns, according to the WHO [52].
Emotional well-being (EW) and self-perceived health were assessed using the Kidscreen-10 questionnaire. This questionnaire gauge participants’ emotional well-being and self-perceived health status, respectively, providing valuable information on mental and physical health outcomes. The Kidscreen-10 is a self-report questionnaire used to assess health-related quality of life in children and adolescents. Scores close to 50 are considered within the average range, suggesting no significant issues related to quality of life. Scores below 50 (−1 SD or more) indicate a perceived quality of life lower than 16% of the normative population. This could serve as a warning sign to investigate potential problems in areas such as emotional state or physical well-being [55].
Sleep time on weekdays (WK) and weekends (WD) were analysed using the SHSA (Sleep Habits Survey for children) test. The sleep time was calculated based on the time of waking up and going to bed reported by each child for WK and WD [56]. Children aged 8 to 12 should aim for 9 to 12 h of sleep per night, with consistent sleep routines, a screen-free environment before going to bed, and a cool, dark room to support physical and cognitive development according to the AASM (American Academy of Sleep Medicine, Centers for Disease Control and Prevention, National Sleep Foundation) [57].
Handgrip strength was measured using the TAKEI T.K.K. 5001 GRIP A (Takei, Tokyo, Japan) analogue hand dynamometer (2018) with a measuring range of 0 to 100 kg. This device provides an objective assessment of participants’ hand grip strength, a proxy for overall muscle strength and physical fitness. The risk of strength (HSR) in children was analysed based on strength test results, with children who fell into the 25th percentile or lower considered at risk [58].
2.5. Statistical Analysis
Exhaustive data analysis was conducted using IBM SPSS Statistics Software (Version 28.0, released by IBM Corp. in 2023, Armonk, NY, USA) and Python 3.12. Descriptive statistics were initially calculated to provide an overview of the sample across three cross-sectional waves, with data stratified by sex. This analysis included means, standard deviations (SD), and percentages to assess the adherence rates to health guidelines (sleep, screen time, Mediterranean diet and physical activity) and evaluated risk levels associated with strength (as measured by dynamometry). Descriptive statistics served to identify trends and variations within the sample, facilitating comparisons across different waves and between males and females.
For inferential analysis, an analysis of variance (ANOVA) was applied to continuous health-related variables to examine the effects of either sex or time (waves differences) on these variables. The aim was to detect significant changes across the three waves and to determine whether these changes differed between boys and girls. In those cases where significant effects were observed, Bonferroni post hoc analyses were conducted to identify specific differences between waves. For categorical variables, the Chi-Square test was employed to assess the associations between sex and health-related outcomes across the three waves. Post hoc comparisons were carried out to locate significant differences and clarify where the associations varied over time. A linear mixed model (LMM) was carried out to assess differences in the variables by sex in each of the waves of the study, focusing on the interaction term time × sex. Using LMMs, instead of the more common repeated measures ANOVA, allowed us to handle imbalances in sample sizes across groups and to more accurately model unexplained variability by incorporating random effects associated with the data structure. Additionally, the LMM provides greater statistical robustness, making more reliable and generalizable estimates.
These analyses allowed for a comprehensive evaluation of trends and sex-specific differences in health-related outcomes across the study period.
3. Results
The final sample of the ASOMAD study comprised 384 subjects (51% girls) in the first wave (ASOMAD 1), a total of 468 children (49% girls) in the second wave (ASOMAD 2), and 385 subjects (46% girls) in the third wave (ASOMAD 3). Descriptives are shown in Table 1. The number of subjects varies according to the number of positive consents in each wave, independently of each other. The flow chart can be observed in Figure 3.

Table 1.
Descriptive sample.
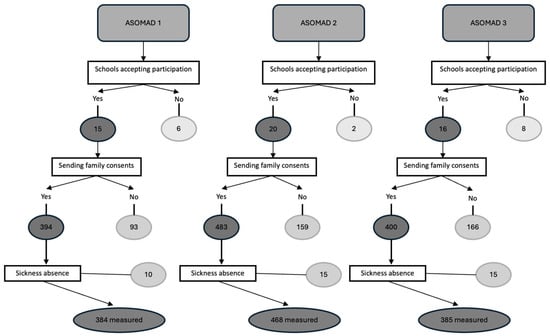
Figure 3.
Flow chart on sample collection ASOMAD 1,2,3.
BMI: Significant differences were found in BMI categories across the three waves (χ2(4) = 17.356, p = 0.002), showing a trend toward increased overweight prevalence and stabilization in obesity cases (Table 1). Boys exhibited higher rates of overweight and obesity compared to girls, particularly in the first wave, where 20% of boys were classified as obese versus 8.7% of girls (p < 0.001). Post hoc analysis revealed a significant increase in overweight prevalence in the second wave, with time and sex having a significant influence on BMI variation (p < 0.001).
Strength Risk (HSR): Chi-square analysis was used to examine the effect of time and sex on the HSR variable. Regarding the wave, no significant differences were observed in the distribution of HSR (χ2(2) = 1.202, p = 0.548). This suggests that the percentage of boys and girls with and without risk remained constant over the three waves of evaluation, with no relevant changes. In terms of sex, significant differences were identified in the HSR variable (χ2(1) = 11.498, p < 0.001). Boys showed a significantly higher percentage of risk compared to girls in all waves (Table 1). The likelihood ratio test (p < 0.001) and the linear-by-linear association (p < 0.001) confirmed these differences. Additionally, Fisher’s exact test also yielded significant results (p < 0.001), reinforcing the robustness of the association between sex and the presence of HSR.
MDA: The analysis of MDA revealed significant results in relation to the three waves and sex (Table 1). The mean KIDMED index for both sexes across all measurement waves indicated suboptimal adherence (<8 points in the index). In the first wave, 59% of boys and 55.4% of girls were classified as having suboptimal adherence (KIDMED groups 1 and 2; Table 1). Although the percentages of suboptimal MDA decreased in subsequent waves, they remained above 50%: for boys, 53.4% in the second wave and 51% in the third wave, while for girls, these percentages were 45.6% in the second wave and 43.3% in the third wave. This yields a significant effect of time (p = 0.039) and sex (p = 0.001), evidencing those girls consistently scored higher on the KIDMED index compared to boys across all analysed waves. The interaction between time and sex was not significant (p = 0.339). Although, as shown in Figure 4, the adherence trend among girls has been consistently better across all waves, with steady progress nearing the optimal score compared to boys.
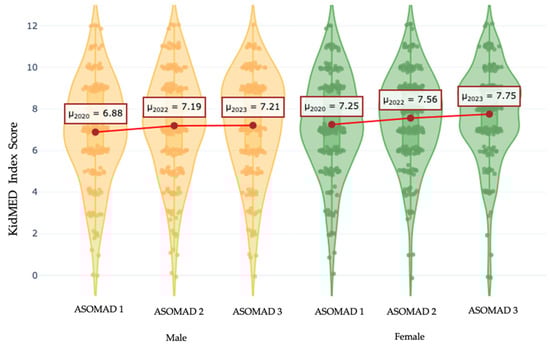
Figure 4.
Distribution of adherence to Mediterranean diet by sex and time (2020–2023). Means (μ) are highlighted in red for each group and wave. A linear mixed model analysis was conducted, indicating no statistically significant differences between groups (F = 0.38, p = 0.537). Data for males are shown in orange, and data for females are shown in green.
Screen and Sleep Time WD and WK: The analysis of screen time during WD revealed a decreasing trend over the three waves of study. The two-way ANOVA indicated a significant effect of both wave (p = 0.022) and sex (p < 0.001). However, no significant interaction was observed between these factors (p = 0.903), suggesting that the variation in screen use was not dependent on the combination of wave and sex. The post hoc analysis showed a marginally significant difference between the first and third waves (p = 0.050), indicating a change in screen usage patterns over time. Despite these trends, over half of the sample did not comply with screen time recommendations in any of the analysed waves. Boys exhibited a higher percentage of non-compliance compared to girls, with a mean difference of approximately 10% in all waves (Table 1). Regarding WK, no significant differences in usage time were identified over the time (p = 0.265), although marked differences between sexes were observed (p < 0.001). Boys consistently exhibited higher screen use compared to girls in all evaluated waves, with no significant interaction between time and sex (p = 0.533). Over the three waves, more than 90% of boys did not comply with screen time recommendations during WK, a significantly higher percentage compared to girls, who showed around 80% non-compliance (Table 1), being exceptionally high in both sexes.
The sleep results were positive, generally meeting the recommendations. There was a low percentage of children, both boys and girls (Table 1), who did not meet the recommendations across all three waves of measurement.
MVPA: Significant differences were found in the ANOVA. Weekly MVPA levels were influenced by time, sex, and the interaction between both factors (p < 0.001). The post hoc analysis revealed a significant decrease in MVPA between wave 1 and both waves 2 and 3 (p < 0.001 in both cases), while no significant differences were observed between waves 2 and 3. Regarding the influence of sex, girls showed a greater increase in minutes per day of MVPA during the evaluated period (p < 0.05).
The significant interaction between time and sex (p = 0.003) suggests that the evolution of physical activity over time varies according to sex (Figure 5). Table 1 shows high percentages of non-compliance with MVPA recommendations over the 7-day week for both sexes throughout the study period. For boys, 70.2% did not meet the recommendations in the first wave, decreasing to 59.2% in the second wave, only to slightly increase again to 61.5% in the third one. In contrast, girls exhibited an upward trend in non-compliance, with 80.6% in the first wave, 83.0% in the second wave, and 87.6% in the third wave. These results reflect a decreasing trend at weekly MVPA over time, particularly in the female population, leading to an increase in the percentage of girls not meeting MVPA recommendations during the week. Despite the slight improvement observed in boys during the second wave, the percentage of non-compliance remains high.
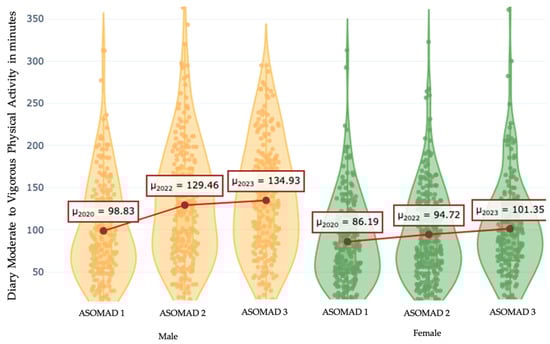
Figure 5.
Distribution of daily moderate to vigorous physical activity in minutes by sex and time (2020–2023). Means (μ) are highlighted in red for each group and wave. A linear mixed model analysis was conducted, indicating statistically significant differences between groups (F = 8.57, p = 0.00348). Data for males are shown in orange, and data for females are shown in green.
EW: In the ANOVA conducted for the Kidscreen-10 variable, differences in the subjective well-being of children were examined based on the wave of evaluation and the sex of the participants. The ANOVA indicated no statistically significant differences in Kidscreen-10 scores between the different waves (p = 0.501), nor between sexes (p = 0.295). Additionally, no significant interaction between time and sex was found in the LMM (p = 0.339).
4. Discussion
According to the MAPFRE study [59], during the COVID-19 pandemic, Spain presented a relatively low restriction index compared to other European countries. Italy imposed much stricter restrictions, as did Greece, which recorded some of the highest restriction indices. In contrast, countries such as the United Kingdom and Spain showed similar levels of restriction, as did Chile in South America. Some Asian countries, New Zealand and Iceland, however, had much lower indices. Nevertheless, in the specific case of Madrid city, the restrictions were more stringent than in other regions of Spain, which could have had a differentiated impact on children’s lifestyle habits. Comparing these data with those from other countries allows for a better understanding of the possible similarities and differences in observed lifestyle changes, with the policies of restriction likely playing a significant role in shaping children’s behaviour.
The findings in our study reveal a notable increase in overweight prevalence, particularly among boys, and a stabilisation in obesity rates. Sex and the timing of evaluations influenced patterns in the different variables measured.
In relation to BMI, our results align with national findings from PASOS 2019 [60], ALADINO 2019 [39,61], and PESCA studies [62], which previously documented gender-specific trends in overweight and obesity among Spanish children (in the PESCA study, overweight is considered both overweight and obesity for data; results are shown according to the International Obesity Task Force). PASOS 2019 reported normal-weight prevalence at 65.1%, with overweight at 20.7% and obesity at 14.2% (children aged 6–12 years), particularly among boys [60]. Similarly, ALADINO 2019 indicated 24.7% overweight in girls and 21.9% in boys, aligning with our findings in which girls retained similar overweight and obesity rates as those reported before the pandemic [39]. Conversely, boys showed a significant rise in overweight immediately post-lockdown, reaching 28.3% overweight and 20.3% obesity in the first post-lockdown wave. Similarly, PESCA (2018–2021) showed a progressive increase in overweight (from 17.8% in 2018 to 26.57% in 2021) [62].
This increase underscores the distinct impact of the lockdown, leading to nearly 50% of boys in our sample presenting excess weight, which was notably higher than data reported pre-pandemic and in the PESCA study [62,63]. In relation to European data, a study performed in Italy (similar cross-sectional study with a similar children age) evidenced a similar increase from 10.8% to 17.6% in the first wave, with a slight reduction to 15% in the second [41]. However, obesity in this study increased significantly, from 7.8% to 20.5% over two waves (2019 to 2021) [41]. The WHO’s COSI 2018–2020 data illustrate a heightened prevalence of overweight and obesity in Mediterranean countries, with countries like Cyprus and Greece reporting overweight and obesity rates of 48% and 44% in boys, respectively [64]. By comparison, ASOMAD study data showed post-lockdown prevalence (overweight and obesity together) for boys at 48.6%, with a stabilisation to 36.2% in the second wave. This trend suggests a significant yet temporary increase following lockdown, with gradual improvement as restrictions lifted. When compared to England’s data [64], where combined overweight and obesity reached 35.2% pre-pandemic and rose to 37.8% post-lockdown, the Madrid child population appears to have experienced a more pronounced BMI increase post-lockdown, particularly among boys [64].
Our findings on MVPA and screen time raise significant concerns [60]. The post-lockdown period showed a continued decline in MVPA, particularly among girls (8–16 years), with 87.6% non-meeting physical activity guidelines by the third wave. The PESCA study reported data of physical activity defined as the percentage of participants who report engaging in physical activity, excluding the teaching hours of the physical education subject at school. A significant increase in those non-meeting the recommendations has been observed between the second and the third-wave data collection (14.5 to 28.10%) [62], while in Italy, MVPA compliance dropped from 8.6% before COVID-19 to 29.4% during the pandemia [41]. The COSI study also highlights varied compliance with MVPA recommendations, with higher MVPA observed in Croatia (10%) compared to lower rates in Greece (19% boys, 30% girls) [64]. These declines coincide with the restrictions imposed during lockdown and the challenges in returning to previous activity levels, particularly among girls, as reflected in both PESCA and ASOMAD studies [62]. Our non-compliance rates are significantly higher compared to other studies; however, it is important to note that our criteria for compliance require adherence across all seven days of the week. These trends suggest a potential long-term reduction in physical activity levels, possibly influenced by limited opportunities for structured physical activity post-lockdown. In regard to the screen time, boys showed elevated on both WD and WK, with 90% exceeding screen time recommendations on WK. This pattern is consistent with PASOS 2019 [60], where 56.5% of boys did not meet screen time recommendations on WD, rising to 85.3% on WK (8–12 years). Screen use, extensively documented in PESCA study [62], also emerges as a relevant factor. Although there were improvements in screen time among younger children in the third year of [62], the overall increase when including those over 10 years old highlights a shared problem between studies from Italy and ASOMAD [41], where screen-related sedentary behaviour seemed to have significantly impacted children’s health. For screen time, data show moderate compliance, with countries like Croatia reporting 45% of boys not meeting screen time recommendations [64], contrasting sharply with our findings in Madrid, where non-compliance was much higher, particularly in boys. However, Italy, a Mediterranean country with similar lockdown stringency, revealed an alarming increase in screen time during the pandemic. One study showed that 75% of children exceeded screen time recommendations, with boys reporting higher usage than girls, similarly, in Greece, pre-pandemic estimates of non-compliance with screen time limits (approximately 60%) rose to nearly 85% during the lockdowns, emphasizing how pandemic restrictions amplified sedentary behaviours across the Mediterranean region [41,43,64].
In the same way, MDA in our sample showed suboptimal levels, with an average score on the KIDMED index below 8 for both sexes throughout the evaluated waves. These results are consistent with previous studies, such as ALADINO 2019 and MUGI Project [61,65], which found that more than 75% of children presented insufficient MDA, highlighting an ongoing issue in children’s dietary habits in Spain even before the lockdown. While some studies reported a slight improvement in MDA during the lockdown [65], in our research, the percentage of children with optimal MDA remained below 15% in the third wave, suggesting that post-pandemic challenges, such as limited access to fresh foods and changes in eating patterns, may have negatively affected adherence to a healthy diet. At the national level, the PASOS study [60] indicated an average MDA of 6.86 for boys and 6.68 for girls, with values ranging between 6.5 and 7 points for both sexes, demonstrating that no group achieved the optimal average of 8 points at any stage [3]. In this context, 41.9% of boys and 38.8% of girls were classified as having a low level of adherence (<8 points on the KIDMED index). When differentiated by waves, the percentage of boys and girls reaching a high level in PASOS study was only 45.7% [60], which aligns with the low levels observed in our sample and reinforces the notion that adherence to healthy dietary patterns was low even before the pandemic. At the European level, At the European level, Palermi et al., reported an increase in the consumption of unhealthy foods during the pandemic compared to previous periods [41]. Also, the COSI study by the WHO reported low adherence to healthy diets in children aged 6 to 9 years, with less than 50% of children consuming fruit daily and only 22.6% consuming fresh vegetables regularly before the COVID-19 [64]. The data regarding adherence to healthy diets reflect notable variations between countries, being higher in the Mediterranean area like San Marino (80.8%) and Italy (72.6%) [64], compared to regions in Central Asia, where daily fruit consumption is significantly lower, such as in Kyrgyzstan (18.1%) [64]. These differences are also observed between sexes, with a greater tendency for girls to consume fruit daily compared to boys, a pattern also seen in our sample.
Regarding EW, our findings show a general stability in emotional health levels over the evaluation period, suggesting a notable resilience in children despite lifestyle changes brought about by the pandemic. However, studies such as PASOS have presented data broken down by specific items [60], offering a more detailed view of emotional aspects like sadness and loneliness. This focused analysis by PASOS identified a worrying increase in feelings of sadness and loneliness over time, showing that a high percentage of children felt lonely and sad as the post-lockdown period progressed [60]. This rise in negative emotions is significant, as it suggests that, while general well-being data may appear stable, a more granular breakdown could reveal substantial emotional challenges that warrant attention [3,60]. Our findings, by not addressing these specific items, may underestimate emotional health aspects that require targeted interventions. Future studies should take a closer look at the details of EW, especially when it comes to understanding how the pandemic has affected children’s mental health over time [1,3,60]. Conversely, HSR analysis indicated that boys exhibited a higher risk compared to girls across all evaluation waves, consistent with existing literature that identified biological factors contributing to greater muscular strength in boys [58] Notably, there were no significant changes in HSR over the three waves, implying that pandemic-related restrictions did not significantly impact this area of health [27,66,67,68].
5. Conclusions
In conclusion, this study suggest that COVID-19 mobility restrictions may have negatively impacted the health habits and lifestyles of children in the city of Madrid, with a possible increase in the prevalence of overweight, and a potential decline in physical activity levels, especially in girls. There may also have been suboptimal MDA and excessive screen time, particularly among boys. While HSR showed no significant changes, the results suggest that unhealthy habits may have persisted even three years after the lockdown, especially for boys. These findings highlight the need for public health interventions that promote physical activity, improve dietary habits, and regulate screen time, with a particular focus on boys.
The behavioural risks identified in this study highlight the need for long-term public policies that promote sustainable habit changes. Given the time required to modify behaviours, interventions must reach as many people as possible and be tailored to gender-specific needs. Reducing screen time, particularly in boys, requires coordinated efforts through education, structured leisure activities, and school regulations. In contrast, increasing MVPA in girls calls for targeted initiatives, such as inclusive physical activity programmes and team-based sports. Additionally, improving adherence to the MDA, especially in boys, necessitates school-based nutrition education and enhanced access to fresh foods. These policies are essential to fostering lifelong healthy habits and mitigating the negative effects identified.
One limitation of this study is the lack of pre-pandemic data specific to the study area, which prevents a direct comparison of trends before and after COVID-19. Instead, we rely on findings from national studies such as PASOS and ALADINO, which reported similar behavioural patterns in Spanish children prior to the pandemic. While our results suggest that the pandemic may have exacerbated sedentary lifestyles and unhealthy behaviours, these trends were already present, making it difficult to attribute them exclusively to COVID-19. Future research should consider longitudinal designs that include pre-pandemic data to better isolate the effects of the pandemic on children’s health and lifestyles.
Another limitation of this study is that the questionnaires administered in some cases may suffer from a certain bias, despite explanations and attention from the researchers, the questionnaire is self-reported by young children who may not have fully understood some of the questions.
Author Contributions
Conceptualization, A.P.-R.; M.G.-G. and A.G.Z.; data curation, C.Q.-G., M.G.-G., A.G.Z., A.P.-R. and A.N.; formal analysis, A.P.-R. and C.Q.-G.; funding acquisition, M.G.-G.; investigation, A.P.-R.; methodology, A.P.-R., A.N., M.G.-G., A.G.Z. and E.G.; project administration, M.G.-G. and A.G.Z.; resources, A.P.-R. and M.G.-G.; software, C.Q.-G.; supervision, A.P.-R. and M.G.-G.; validation, A.P.-R., M.G.-G. and A.G.Z.; visualization, A.P.-R., A.G.Z. and M.G.-G.; writing—original draft preparation, A.P.-R.; writing—review and editing, A.P.-R., M.G.-G., E.G., A.N. and A.G.Z. All authors have read and agreed to the published version of the manuscript.
Funding
Universidad Politécnica de Madrid and Área Delegada de Deportes Ayuntamiento de Madrid (P2211600345). Red EXERNET-RED DE EJERCICIO FISICO Y SALUD (RED2022-134800-T) Agencia Estatal de Investigación (Ministerio de Ciencias e Innovación). Red de Ejercicio Físico y Salud EXERNET (EXP 99828), Redes de Investigación en Ciencias del Deporte, Consejo Superior de Deportes (Ministerio de Educación, Formación Profesional y Deportes).
Institutional Review Board Statement
ASOMAD protocol meets the criteria of the Declaration of Helsinki of the World Medical Association (64th General Assembly, Fortaleza, Brazil, October 2013) for research on human beings, of the Oviedo Convention on Human Rights Man and Biomedicine (Council of Europe, 1997). And was approved by the Ethics Committee of the Universidad Politécnica de Madrid (number 20200727-1).
Informed Consent Statement
Informed consent was obtained from all subjects’ parents or legal guardians involved in the study.
Data Availability Statement
The ASOMAD study is now complete, and data collection has ceased. The data presented in this study are available on request from the corresponding author. The data are not publicly available due to privacy and ethical restrictions, as they include sensitive information derived from medical records and clinical examinations.
Acknowledgments
The authors are grateful for the support provided by students, parents, teachers, schools and municipalities for their cooperation and participation in this study.
Conflicts of Interest
The authors declare no conflicts of interest.
References
- World Health Organization. Nutrition, Physical Activity, Well-Being and COVID-19; World Health Organization: Copenhagen, Denmark, 2023. [Google Scholar]
- La Rosa, V.L.; Oddo-Sommerfeld, S.; Schermelleh-Engel, K.; Commodari, E. From Lockdown to Cradle: Navigating the Psychological Challenges of Childbirth during the COVID-19 Pandemic in Italy–Evidence from a 3-Year Analysis. Curr. Psychol. 2024, 43, 35616–35629. [Google Scholar] [CrossRef]
- Gómez, S.F.; Lorenzo, L.; Ribes, C. Physical Activity, Sedentarism, Lifestyles and Obesity in Spanish Youth. PASOS 2022. 2022. Available online: www.gasolfoundation.org (accessed on 18 December 2024).
- Michels, N. Poor Mental Health Is Related to Excess Weight via Lifestyle: A Cross-Sectional Gender- and Age-Dependent Mediation Analysis. Nutrients 2021, 13, 406. [Google Scholar] [CrossRef] [PubMed]
- Pereira, S.; Katzmarzyk, P.T.; Hedeker, D.; Maia, J. Change and Stability in Sibling Resemblance in Obesity Markers: The Portuguese Sibling Study on Growth, Fitness, Lifestyle, and Health. J. Obes. 2019, 2019, 2432131. [Google Scholar] [CrossRef] [PubMed]
- Esposito, S.; Giannitto, N.; Squarcia, A.; Neglia, C.; Argentiero, A.; Minichetti, P.; Cotugno, N.; Principi, N. Development of Psychological Problems Among Adolescents During School Closures Because of the COVID-19 Lockdown Phase in Italy: A Cross-Sectional Survey. Front. Pediatr. 2021, 8, 628072. [Google Scholar] [CrossRef]
- Orgilés, M.; Morales, A.; Delvecchio, E.; Mazzeschi, C.; Espada, J.P. Immediate Psychological Effects of the COVID-19 Quarantine in Youth From Italy and Spain. Front. Psychol. 2020, 11, 579038. [Google Scholar] [CrossRef]
- Ajanovic, S.; Garrido-Aguirre, J.; Baro, B.; Balanza, N.; Varo, R.; Millat-Martínez, P.; Arias, S.; Fonollosa, J.; Perera-Lluna, A.; Jordan, I.; et al. How Did the COVID-19 Lockdown Affect Children and Adolescent’s Well-Being: Spanish Parents, Children, and Adolescents Respond. Front. Public Health 2021, 9, 746052. [Google Scholar] [CrossRef]
- Child Mind Institute. El Impacto de la Pandemia de COVID-19 en la Salud Mental de los Niños: Qué Sabemos Hasta Ahora. [Online]. 2021. Available online: https://childmind.org/wp-content/uploads/2021/10/CMI_CMHR_2021_Spanish_vF_AB.pdf (accessed on 25 November 2024).
- Schröder, H.; Benitez Arciniega, A.; Soler, C.; Covas, M.I.; Baena-Díez, J.M.; Marrugat, J. Validity of Two Short Screeners for Diet Quality in Time-Limited Settings. Public Health Nutr. 2012, 15, 618–626. [Google Scholar] [CrossRef]
- Sánchez, J.; Rodríguez, A.; Gómez, M.; Hernández, R. Sedentarismo y beneficios de la actividad física en los adolescentes: Una revisión sistemática. Mentor 2022, 2, 315–331. [Google Scholar] [CrossRef]
- Mariscal-Arcas, M.; Rivas, A.; Velasco, J.; Ortega, M.; Caballero, A.M.; Olea-Serrano, F. Evaluation of the Mediterranean Diet Quality Index (KIDMED) in children and adolescents in Southern Spain. Public Health Nutr. 2009, 12, 1408–1412. [Google Scholar] [CrossRef]
- Martínez-Gómez, D.; Gómez-Martínez, S.; Ruiz, J.R.; Díaz, L.E.; Ortega, F.B.; Widhalm, K.; Vicente-Rodríguez, G.; Rey-López, J.P.; Castillo, R.; Sjöström, M.; et al. Objectively-measured and self-reported sedentary time in female adolescents: Comparison in different European countries. Scand. J. Med. Sci. Sports 2012, 23, 311–318. [Google Scholar] [CrossRef]
- Pachay Arriaga, M.P.; Masaquiza Masaquiza, E.V.; Jaya Correa, M.C.; Barcia Briones, M.F. The family context in the emotional state of children in initial education. Pol. Con. (Edición Núm. 83) 2023, 8, 470–485. Available online: https://dialnet.unirioja.es/descarga/articulo/9152481.pdf (accessed on 10 February 2025).
- Aymerich de Franchesci, C.M.; Miguel Miguel, C.; Arroba Basanta, M.L.; Arana Cañedo-Argüelles, C.; Cabello Ballesteros, L. Sleep patterns of healthy children at age four: Social factors and parenting styles. Rev. Pediatr. Aten. Primaria 2019, 21, 343–356. [Google Scholar]
- Alves, J.M.; Yunker, A.G.; DeFendis, A.; Xiang, A.H.; Page, K.A. Associations between Affect, Physical Activity, and Anxiety Among US Children During COVID-19. Medrxiv Prepr. Serv. Health Sci. 2020, 16, e12786. [Google Scholar] [CrossRef]
- Rosa, A.; García Cantó, E.; Carrillo, P.J. Percepción de salud, actividad física y condición física en escolares. Cuad. Psicol. Deporte 2018, 18, 179–189. Available online: http://scielo.isciii.es/scielo.php?script=sci_arttext&pid=S1578-84232018000300013&lng=es (accessed on 18 December 2024).
- Twig, G.; Yaniv, G.; Levine, H.; Leiba, A.; Goldberger, N.; Derazne, E.; Ben-Ami Shor, D.; Tzur, D.; Afek, A.; Shamiss, A.; et al. Body-mass index in 2.3 million adolescents and cardiovascular death in adulthood. N. Engl. J. Med. 2016, 25, 2430–2440. [Google Scholar] [CrossRef]
- Twig, G.; Afek, A.; Shamiss, A.; Derazne, E.; Rabbi, M.L.; Tzur, D.; Gordon, B.; Tirosh, A. Adolescence BMI and trends in adulthood mortality: A study of 2.16 million adolescents. J. Clin. Endocrinol. Metab. 2014, 99, 2095–2103. [Google Scholar] [CrossRef][Green Version]
- Abdullah, A.; Wolfe, R.; Stoelwinder, J.U.; de Courten, M.; Stevenson, C.; Walls, H.L.; Peeters, A. The number of years lived with obesity and the risk of all-cause and cause-specific mortality. Int. J. Epidemiol. 2011, 40, 985–996. [Google Scholar] [CrossRef]
- Pollock, N.K. Childhood obesity, bone development, and cardiometabolic risk factors. Mol. Cell Endocrinol. 2015, 410, 52–63. [Google Scholar] [CrossRef]
- Nakhleh, A.; Sakhnini, R.; Furman, E.; Shehadeh, N. Cardiometabolic risk factors among children and adolescents with overweight and Class 1 obesity: A cross-sectional study. Insights from stratification of Class 1 obesity. Front. Endocrinol. 2023, 14, 1108618. [Google Scholar] [CrossRef]
- Puhl, R.M.; Lessard, L.M. Weight Stigma in Youth: Prevalence, Consequences, and Considerations for Clinical Practice. Curr. Obs. Rep. 2020, 9, 402–411. [Google Scholar] [CrossRef]
- Braddock, A.; Browne, N.T.; Houser, M.; Blair, G.; Williams, D.R. Weight Stigma and Bias: A Guide for Pediatric Clinicians. Obes. Pillars 2023, 6, 100058. [Google Scholar] [CrossRef] [PubMed]
- Kansra, A.R.; Lakkunarajah, S.; Jay, M.S. Childhood and Adolescent Obesity: A Review. Front. Pediatr. 2021, 8, 581461. [Google Scholar] [CrossRef] [PubMed]
- Abdeen, Z.; Hamid, Z.A.; Abu-Rmeileh, N.M.; Acosta-Cazares, B.; Acuin, C.; Adams, R.J.; Aekplakorn, W.; Afsana, K.; Aguilar-Salinas, C.A.; Agyemang, C.; et al. Worldwide Trends in Body-Mass Index, Underweight, Overweight, and Obesity from 1975 to 2016: A Pooled Analysis of 2416 Population-Based Measurement Studies in 128·9 Million Children, Adolescents, and Adults. Lancet 2017, 390, 2627–2642. [Google Scholar] [CrossRef]
- Pulgarón, E.R. Childhood Obesity: A Review of Increased Risk for Physical and Psychological Comorbidities. Clin. Ther. 2013, 35, A18–A32. [Google Scholar] [CrossRef]
- Ali, M.M.; Fang, H.; Rizzo, J.A. Body Weight, Self-Perception and Mental Health Outcomes among Adolescents. J. Ment. Health Policy Econ. 2010, 13, 53–63. [Google Scholar]
- González-Gross, M.; Meléndez, A. Sedentarism, Active Lifestyle and Sport: Impact on Health and Obesity Prevention. Nutr. Hosp. 2013, 28 (Suppl. S5), 89–98. [Google Scholar]
- Carpena Lucas, P.J.; Sánchez-Cubo, F.; Vargas, M.V.; Jiménez, J.M. Influence of Lifestyle Habits in the Development of Obesity during Adolescence. Int. J. Environ. Res. Public Health 2022, 19, 4124. [Google Scholar] [CrossRef]
- Wong, S.L.; Scott, T.L. Association Between Sedentary Behavior, Physical Activity, and Obesity: Inactivity Among Active Kids; USA. 2009; Volume 6. Available online: http://www.cdc.gov/pcd/issues/2009/jan/07_0242.htm (accessed on 18 December 2024).
- Landry, B.W.; Driscoll, S.W. Physical Activity in Children and Adolescents. PM R 2012, 4, 826–832. [Google Scholar] [CrossRef]
- Sampasa-Kanyinga, H.; Colman, I.; Goldfield, G.S.; Janssen, I.; Wang, J.; Hamilton, H.A.; Chaput, J.-P. Associations between the Canadian 24 h Movement Guidelines and Different Types of Bullying Involvement among Adolescents. Child Abus. Negl. 2020, 108, 104638. [Google Scholar] [CrossRef]
- Gupta, P.; Srivastava, N.; Gupta, V.; Tiwari, S.; Banerjee, M. Association of Sleep Duration and Sleep Quality with Body Mass Index among Young Adults. J. Fam. Med. Prim. Care 2022, 11, 3251. [Google Scholar] [CrossRef]
- Chaput, J.P.; Dutil, C. Lack of Sleep as a Contributor to Obesity in Adolescents: Impacts on Eating and Activity Behaviors. Int. J. Behav. Nutr. Phys. Act. 2016, 13, 103. [Google Scholar] [CrossRef] [PubMed]
- Gruber, J.; Anna Clark, L.; Abramowitz, J.S.; Aldao, A.; Chung, T.; Forbes, E.E.; Nagayama Hall, G.C.; Hinshaw, S.P.; Hollon, S.D.; Klein, D.N.; et al. Mental Health and Clinical Psychological Science in the Time of COVID-19: Challenges, Opportunities, and a Call to Action. Am. Psychol. 2021, 76, 409–426. [Google Scholar] [CrossRef] [PubMed]
- Baldassano, S.; Alioto, A.; Amato, A.; Rossi, C.; Messina, G.; Bruno, M.R.; Stallone, R.; Proia, P. Fighting the Consequences of the COVID-19 Pandemic: Mindfulness, Exercise, and Nutrition Practices to Reduce Eating Disorders and Promote Sustainability. Sustainability 2023, 15, 2120. [Google Scholar] [CrossRef]
- Gobierno de España. Real Decreto 463/2020, de 14 de Marzo, Por El Que Se Declara El Estado de Alarma Para La Gestión de La Situación de Crisis Sanitaria Ocasionada Por El COVID-19. 2020. Available online: https://www.boe.es (accessed on 10 December 2024).
- Agencia Española de Seguridad Alimentaria y Nutrición (AESAN). Estudio Sobre La Alimentación, Actividad Física, Desarrollo Infantil y Obesidad En España 2019. Madrid 2020. Available online: https://www.aesan.gob.es/AECOSAN/web/nutricion/detalle/aladino_2023.htm (accessed on 10 December 2024).
- Ortega Anta, R.M.; López Sobaler, A.M.; Aparicio Vizuete, A.; González Rodríguez, L.G.; Navia Lombán, B.; Perea Sánchez, J.M. Estudio de Vigilancia Del Crecimiento, Alimentación, Actividad Física, Desarrollo Infantil y Obesidad En España. 2013. Available online: https://www.aesan.gob.es/AECOSAN/web/nutricion/detalle/aladino_2023.htm (accessed on 10 December 2024).
- Palermi, S.; Vecchiato, M.; Pennella, S.; Marasca, A.; Spinelli, A.; De Luca, M.; De Martino, L.; Fernando, F.; Sirico, F.; Biffi, A. The Impact of the COVID-19 Pandemic on Childhood Obesity and Lifestyle—A Report from Italy. Pediatr. Rep. 2022, 14, 410–418. [Google Scholar] [CrossRef]
- Ochoa-Moreno, I.; Taheem, R.; Woods-Townsend, K.; Chase, D.; Godfrey, K.M.; Modi, N.; Hanson, M. Projected Health and Economic Effects of the Increase in Childhood Obesity during the COVID-19 Pandemic in England: The Potential Cost of Inaction. PLoS ONE 2024, 19, e0296013. [Google Scholar] [CrossRef]
- Pietrobelli, A.; Fearnbach, N.; Ferruzzi, A.; Vrech, M.; Heo, M.; Faith, M.; Pecoraro, L.; Zoller, T.; Antoniazzi, F.; Piacentini, G.; et al. Effects of COVID-19 Lockdown on Lifestyle Behaviors in Children with Obesity: Longitudinal Study Update. Obes. Sci. Pract. 2022, 8, 525–528. [Google Scholar] [CrossRef]
- Chaabane, S.; Doraiswamy, S.; Chaabna, K.; Mamtani, R.; Cheema, S. The Impact of COVID-19 School Closure on Child and Adolescent Health: A Rapid Systematic Review. Children 2021, 8, 415. [Google Scholar] [CrossRef]
- Censo de Población y Viviendas 2021—Ayuntamiento de Madrid. Available online: https://www.madrid.es/portales/munimadrid/es/Inicio/El-Ayuntamiento/Estadistica/Areas-de-informacion-estadistica/Demografia-y-poblacion/Censos-de-Poblacion/Censo-de-Poblacion-y-Viviendas-2021/?vgnextfmt=default&vgnextoid=772b6f7c0af08810VgnVCM1000001d4a900aRCRD&vgnextchannel=583011fc98916410VgnVCM2000000c205a0aRCRD (accessed on 26 November 2024).
- Comunidad de Madrid. DECRETO 29/2020, de 26 de Octubre, de La Presidenta de La Comunidad de Madrid, Por El Que Se Establecen Las Medidas de Contención Adoptadas Para Hacer Frente a La COVID-19, En Aplicación Del Real Decreto 926/2020, de 25 de Oc- Tubre, Del Consejo de Ministros, Por El Que Se Declara El Estado de Alarma Para La Propagación de Infecciones Causadas Por El SARS-CoV-2. 2020. Available online: https://www.bocm.es/boletin/CM_Orden_BOCM/2020/10/26/BOCM-20201026-206.PDF (accessed on 10 December 2024).
- Comunidad de Madrid. DECRETO 4/2021, de 22 de Enero, de La Presidenta de La Comunidad de Madrid, Por El Que Se Establecen Medidas Temporales Para Hacer Frente a La COVID-19, En Del Real Decreto 926/2020, de 25 de Octubre, Del Consejo de Minis- Tros, Por El Que Se Declara El Estado de Alarma Para Contener La Propagación de Infecciones Causadas Por El SARS-CoV-2. 2021. Available online: https://www.bocm.es/boletin/CM_Orden_BOCM/2021/01/23/BOCM-20210123-1.PDF (accessed on 10 December 2024).
- Gobierno de España. Real Decreto 286/2022, de 19 de Abril, Por El Que Se Modifica La Del Uso de Mascarillas Durante La Situación de Crisis Sanitaria Por La COVID-19. 2022. Available online: https://www.boe.es/buscar/doc.php?id=BOE-A-2022-6449 (accessed on 10 December 2024).
- Núm. Real Decreto 132/2010, de 12 de Febrero, Por El Que Se Establecen Los Requisitos de Los Centros Que Impartan Las Enseñanzas Del Segundo Ciclo de La Infantil, La Educación Primaria y La Educación Secundaria. 2010. Available online: https://www.boe.es/boe/dias/2010/03/12/pdfs/BOE-A-2010-4132.pdf (accessed on 10 December 2024).
- European Health Information Gateway. Cut-Off for BMI According to WHO Standards. Available online: https://gateway.euro.who.int/en/indicators/mn_survey_19-cut-off-for-bmi-according-to-who-standards/#id=32083 (accessed on 21 April 2024).
- Schröder, H.; Subirana, I.; Wärnberg, J.; Medrano, M.; González-Gross, M.; Gusi, N.; Aznar, S.; Alcaraz, P.E.; González-Valeiro, M.A.; Serra-Majem, L.; et al. Validity, reliability, and calibration of the physical activity unit 7 item screener (PAU-7S) at population scale. Int. J. Behav. Nutr. Phys. Act. 2021, 18, 116. [Google Scholar] [CrossRef]
- Organización Mundial de la Salud. Directrices de La OMS Sobre Actividad Física y Hábitos Sedentarios: De Un Vistazo (WHO Guidelines on Physical Activity and Sedentary Behaviour: At a Glance); Organización Mundial de la Salud: Ginebra, Switzerland, 2020. [Google Scholar]
- Serra-Majem, L.; Ribas, L.; Ngo, J.; Ortega, R.M.; García, A.; Pérez-Rodrigo, C.; Aranceta, J. Food, Youth and the Mediterranean Diet in Spain. Development of KIDMED, Mediterranean Diet Quality Index in Children and Adolescents. Public Health Nutr. 2004, 7, 931–935. [Google Scholar] [CrossRef]
- Rey-López, J.P.; Ruiz, J.R.; Ortega, F.B.; Verloigne, M.; Vicente-Rodriguez, G.; Gracia-Marco, L.; Gottrand, F.; Molnar, D.; Widhalm, K.; Zaccaria, M.; et al. Reliability and Validity of a Screen Time-Based Sedentary Behaviour Questionnaire for Adolescents: The HELENA Study. Eur. J. Public Health 2012, 22, 373–377. [Google Scholar] [CrossRef]
- Ravens-Sieberer, U.; Erhart, M.; Rajmil, L.; Herdman, M.; Auquier, P.; Bruil, J.; Power, M.; Duer, W.; Abel, T.; Czemy, L.; et al. Reliability, Construct and Criterion Validity of the KIDSCREEN-10 Score: A Short Measure for Children and Adolescents’ Well-Being and Health-Related Quality of Life. Qual. Life Res. 2010, 19, 1487–1500. [Google Scholar] [CrossRef] [PubMed]
- Wolfson, A.R.; Carskadon, M.A.; Acebo, C.; Seifer, R.; Fallone, G.; Labyak, S.E.; Martin, J.L. Evidence for the Validity of a Sleep Habits Survey for Adolescents. Sleep 2002, 26, 213–216. [Google Scholar] [CrossRef] [PubMed]
- Tremblay, M.S.; Carson, V.; Chaput, J.-P.; Connor Gorber, S.; Dinh, T.; Duggan, M.; Faulkner, G.; Gray, C.E.; Gruber, R.; Janson, K.; et al. Canadian 24-Hour Movement Guidelines for Children and Youth: An Integration of Physical Activity, Sedentary Behaviour, and Sleep. Appl. Physiol. Nutr. Metab. 2016, 41 (Suppl. S3), S311–S327. [Google Scholar] [CrossRef] [PubMed]
- Ruiz, J.R.; España Romero, V.; Castro Piñero, J.; Artero, E.G.; Ortega, F.B.; Cuenca García, M.; Jiménez Pavón, D.; Chillón, P.; Girela Rejón, J.M.; Mora, J.; et al. Batería Alpha-Fitness: Test de Campo Para La Evaluación de La Condición Física Relacionada Con La Salud En Niños y Adolescentes. Nutr. Hosp. 2011, 26, 1210–1214. [Google Scholar] [CrossRef]
- MAPFRE Economics. COVID-19: Un Análisis Preliminar de Los Impactos Demográficos y Sobre El Sector Asegurador; MAPFRE Economics: Madrid, Spain, 2022. [Google Scholar]
- Gómez, F.S.; Lorenzo, L.; Ribes, C.; Homs, C. Physical Activity, Sedentarism and Obesity of Spanish Youth. Estudio PASOS 2019; Gasol Foundation: Los Angeles, CA, USA, 2019. [Google Scholar]
- López-Sobaler, A.M.; Aparicio, A.; Salas-González, M.D.; Loria Kohen, V.; Bermejo López, L.M. Childhood obesity in Spain and associated factors. Nutr. Hosp. 2021, 38, 27–30. Available online: http://scielo.isciii.es/scielo.php?script=sci_arttext&pid=S0212-16112021000500007&lng=es (accessed on 10 February 2025). [CrossRef]
- Zarate-Osuna, F.; Quesada-González, C.; Zapico, A.G.; González-Gross, M. Overweight Prevalence Changes Before and After COVID-19 in Spain: The PESCA Program Longitudinal Outcomes 2018–2021. Nutrients 2024, 16, 3993. [Google Scholar] [CrossRef]
- López Sobaler, A.M.; Ortega Anta, R.M.; Bermejo López, L.M.; Aparicio Vizuete, A. Estudio de Vigilancia del Crecimiento, Alimentación, Actividad Física, Desarrollo Infantil y Obesidad en España. 2019, Volume 5. Available online: https://www.aesan.gob.es/AECOSAN/docs/documentos/nutricion/observatorio/Informe_Aladino_2019.pdf (accessed on 14 September 2024).
- World Health Organization. WHO European Childhood Obesity Surveillance Initiative (COSI); World Health Organization: Copenhagen, Denmark, 2022. [Google Scholar]
- Medrano, M.; Cadenas-Sanchez, C.; Oses, M.; Arenaza, L.; Amasene, M.; Labayen, I. Changes in Lifestyle Behaviours during the COVID-19 Confinement in Spanish Children: A Longitudinal Analysis from the MUGI Project. Pediatr. Obes. 2021, 16, e12731. [Google Scholar] [CrossRef]
- Massy-Westropp, N.M.; Gill, T.K.; Taylor, A.W.; Bohannon, R.W.; Hill, C.L. Hand Grip Strength: Age and Gender Stratified Normative Data in a Population-Based Study. BMC Res. Notes 2011, 4, 127. [Google Scholar] [CrossRef]
- Hwang, I.C.; Ahn, H.Y.; Choi, S.J. Association between Handgrip Strength and Mental Health in Korean Adolescents. Fam. Pract. 2021, 38, 826–829. [Google Scholar] [CrossRef]
- Soysal, P.; Hurst, C.; Demurtas, J.; Firth, J.; Howden, R.; Yang, L.; Tully, M.A.; Koyanagi, A.; Ilie, P.C.; López-Sánchez, G.F.; et al. Handgrip Strength and Health Outcomes: Umbrella Review of Systematic Reviews with Meta-Analyses of Observational Studies. J. Sport Health Sci. 2021, 10, 290–295. [Google Scholar] [CrossRef]


Disclaimer/Publisher’s Note: The statements, opinions and data contained in all publications are solely those of the individual author(s) and contributor(s) and not of MDPI and/or the editor(s). MDPI and/or the editor(s) disclaim responsibility for any injury to people or property resulting from any ideas, methods, instructions or products referred to in the content. |
© 2025 by the authors. Licensee MDPI, Basel, Switzerland. This article is an open access article distributed under the terms and conditions of the Creative Commons Attribution (CC BY) license (https://creativecommons.org/licenses/by/4.0/).