Article

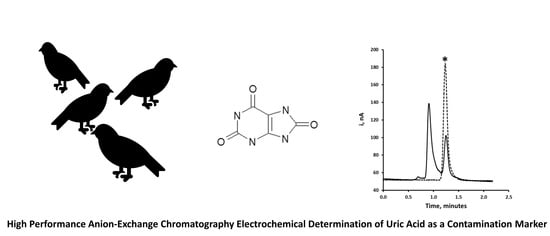
High-Performance Anion Exchange Chromatography Electrochemical Determination of Uric Acid as a Contamination Marker

by
Kevin C. Honeychurch
Centre for Research in Biosciences, School of Applied Sciences, University of the West of England, Frenchay Campus, Bristol BS16 1QY, UK
Submission received: 9 January 2025 / Revised: 20 March 2025 / Accepted: 26 March 2025 / Published: 1 April 2025

Abstract

:
This study presents the first instance of determining environmental uric acid in urban dust using high-performance anion exchange chromatography coupled with electrochemical detection. The optimum chromatographic conditions were identified as a 10 mm × 4.6 mm, 10 µm anion exchange column with a mobile phase of pH 8 50 mM phosphate buffer. Cyclic voltametric investigations over a pH range of 2 to 12 showed that uric acid gave a single diffusion-controlled peak. Hydrodynamic voltametric studies of uric acid using a mobile phase of 50 mM pH 8.0 phosphate buffer over the range 0.0 V to +1.4 V (vs. stainless steel) showed a similar single oxidation wave, which plateaued at potentials more positive than +0.7 V (vs. stainless steel). An applied potential of +0.90 V (vs. stainless steel) was chosen for further investigations, and a linear range of 0.10 to 100 mg/L was obtained, with a detection limit of 0.866 mg/L based on a signal-to-noise ratio of 3. Dust wipe samples were extracted in pH 8, 50 mM phosphate buffer with the aid of sonication. Recoveries of 99.6% (% CV = 4.52%) were achieved for the dust wipe fortified with 16.8 µg of uric acid. Nitrate, nitrite, chloride, acetate, and sulfate ions were found not to interfere. The dust wipe samples were found to have uric acid levels of between 32.6 µg/m2 and 3.98 mg/m2.

Graphical Abstract

1. Introduction

The determination of uric acid (7,9-dihydro-1H-purine-2,6,8(3H)-trione) (I) is crucial in various fields, including the diagnosis and monitoring of several medical conditions [1,2,3,4,5]. Environmentally, it has been used as a possible marker of water pollution [6,7,8] and food contamination [9,10,11]. Human waste [8,12], agricultural practices such as using fertilizers and animal manure, and the decomposition of organic matter can all increase uric acid levels in soil and water. Additionally, birds, reptiles, and some terrestrial arthropods excrete uric acid [13], with bird droppings being a notable source of environmental uric acid (I) [14].
Sci 07 00040 i001
Birds are uricotelic, meaning they excrete uric acid (i) as its anion, urate, or ammonium salt instead of urea as their main form of nitrogen waste [15]. Since urate is not very water soluble at physiological pH, it is excreted in a solid form, helping birds conserve water. Uric acid (I) can be found in high percentages in bird feces, and its presence on surfaces and materials can be used as a method of tracing possible fecal contamination [9,10,11]. The determination of the impact of bird feces on the environment is an important parameter. Birds can drastically transform environmental conditions where they establish colonies via the eutrophication of soil, sediment, and water [16]. Fecal contamination of buildings and architectural features such as statues can result in marked degradation [17]. Diseases such as salmonella [18], parrot fever (Psittacosis) [19], Cryptococci disease, and avian influenza can also originate from exposure to bird feces. These can also contain a range of yeasts and fungi pathogens such as Cryptococcus neoformans, Cryptococcus gattii, and Histoplasma sp., allergens [20], and viruses [21]. Exposure to these can occur via ingestion or inhalation once dried particles containing these pathogens become airborne [19,22]. Human infections with avian influenza A viruses are uncommon but have occurred sporadically in many countries. These infections usually happen after unprotected exposure to infected poultry or virus-contaminated environments [23]. Transmission to other species such as cattle is also a concern [24].
Recently, the application of nanotechnology for the modification of electrodes has been predominately reported. Bindu et al. [25] developed a sensor using cerium oxide nanoparticles and poly (Congo red) for the modification of a carbon paste electrode for the determination of uric acid in the presence of the antibiotic sulfadiazine. In another study [26], a nanocomposite electrode combining molybdenum disulfide and multiwalled carbon nanotubes was reported for the determination of uric acid in synthetic urine. The modified electrode was reported to significantly increase the anodic peak current recorded for uric acid. The electrochemical detection of uric acid and xanthine has been reported using a Co/UiO-66 modified glassy carbon electrode [27]. Using differential pulse voltammetry, it was possible to determine uric acid contents in human urine.
A number of optical-based sensors have also been recently reported for the determination of uric acid. A study published in 2024 [28] developed an optical sensor for uric acid detection using a citric acid functionalized copper-doped biochar nanozyme. This sensor was reported to exhibit high selectivity and sensitivity for uric acid in real sample solutions. An enzyme cascade nanozyme-based colorimetric sensor has recently been reported for the determination of uric acid [29] based on a Cr-doped VO2 nanobelt with peroxidase-like activity, coupled with uricase, to create a colorimetric sensor for the detection of uric acid. This method was reported to show high sensitivity and potential for clinical applications. Moriiwa et al. [30] developed a suspension-based assay for uric acid measurement using micro-sized particles immobilized with uricase and horseradish peroxidase. This method produced resorufin from Amplex red, enabling accurate uric acid detection.
Few reports have noted the potential for airborne uric acid contamination. These studies concluded that the presence of uric acid was due to direct contamination of samples by birds perching and excreting into sampling devices [31]. While urates themselves are not airborne, bird droppings can dry out and become dust, which can then be dispersed into the air. This can happen in environments with a high concentration of birds, such as aviaries or areas where birds roost in large numbers [22].
The determination of uric acid has been reported using methods such as chromatography [1,8,12,32,33,34,35], and more commonly, enzymatic based assays [36,37,38,39]. Studies have also explored the electrochemical behavior of uric acid using various working electrode materials [40,41,42,43]. Recently [12], it was demonstrated to be possible to determine the levels of uric acid in human saliva using reverse-phase liquid chromatography with electrochemical detection. This required an acidic mobile phase and the application of an ion-pairing agent, two parameters that can lead to problems in routine usage. In the present investigation, we have utilized a simple pH 8 aqueous mobile phase-based anion exchange chromatographic separation followed by electrochemical detection employing a glassy carbon electrode (GCE) for the determination of uric acid.
This study was divided into three parts. First, the high-performance anion exchange chromatographic (HPAEC) conditions necessary for separating uric acid were identified. Next, the electrochemical conditions were investigated and optimized using cyclic voltammetry and hydrodynamic voltammetry. Finally, the potential of using the optimized system to determine uric acid in dust wipe samples from an urban environment was explored. This report is believed to be the first application of chromatography with electrochemical detection in this field.

2. Materials and Methods

2.1. Chemicals and Reagents
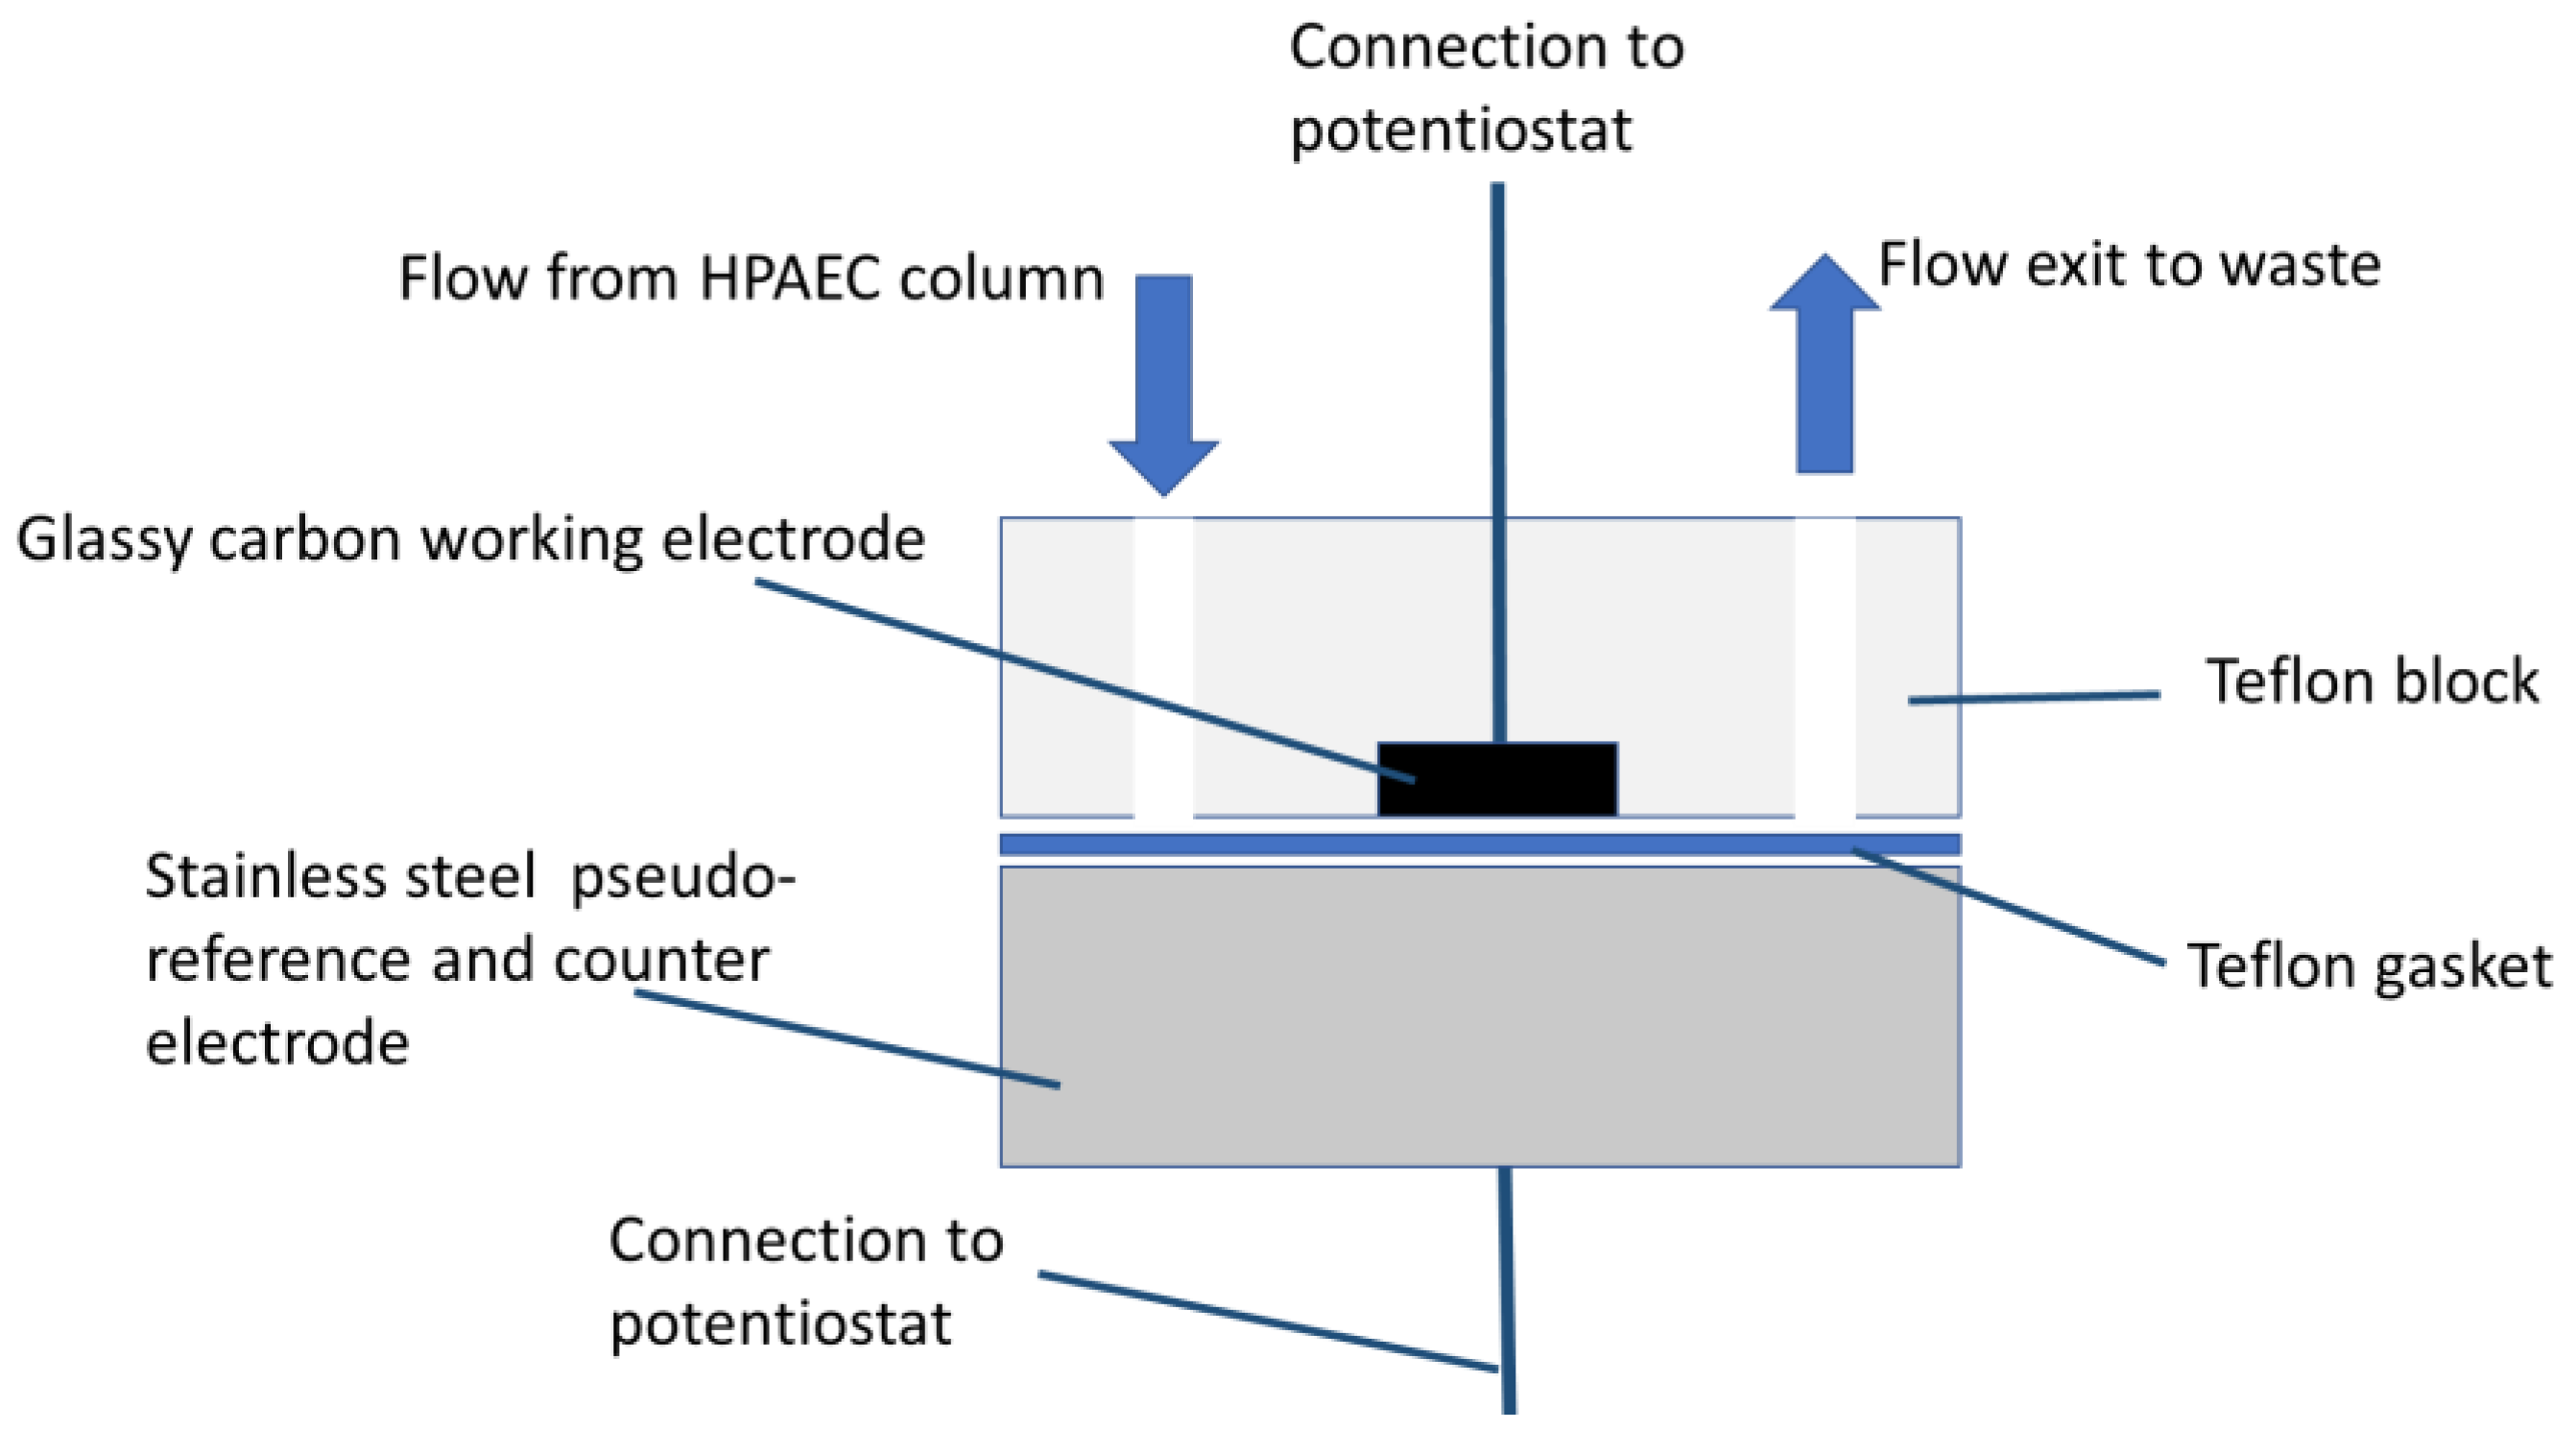
All standard reagents were purchased from Fisher Scientific and used as received. Deionized water was obtained from a Purite RO200-Stillplus HP System (Purite, Oxon, UK). Uric acid was sourced from Sigma Aldrich (Poole, Dorset, UK). Stock solutions were prepared by dissolving the required mass in 20 mM NaOH. Stock solutions of disodium, trisodium, sodium o-phosphate, and o-phosphoric acid were made at a concentration of 0.2 M by dissolving the appropriate mass in deionized water and then titrating to achieve the desired pH. Working standards for initial voltammetric studies were prepared by diluting the primary stock solution with phosphate buffer to achieve a final concentration of 0.1 M phosphate buffer. The mobile phase for HPAEC investigations was prepared by diluting a 0.2 M pH 8 phosphate buffer with deionized water. Standards for HPAEC analysis were made by diluting the primary stock solution in the mobile phase. Surface wipes were fabricated by cutting 10 cm2 squares from a roll of tissue (one ply, recycled, Jangro White Centre feed, Pattersons, Bristol, UK).

2.2. Apparatus

Cyclic voltammetry was conducted using an EmStat3 potentiostat (Ivium Technologies, Eindhoven, The Netherlands) connected to a computer with an electrochemical system software package, Ivium software Windows 10 version, for data acquisition and control. The voltammetric cell included a 3 mm diameter glassy carbon electrode (GCE), an Ag/AgCl reference electrode, and a carbon rod counter electrode. HPAEC studies were performed using either a system with an IsoChrom pump (Spectra Physics, Cheshire, UK) connected to a 7125-valve manual injector with a 10 µL sample loop (Rheodyne, Cotati, CA, USA) or an Agilent 1100 HPLC system connected to a 7125-valve manual injector with a 20 µL sample loop (Rheodyne, Cotati, CA, USA).

2.3. Cyclic Voltammetric Procedures

Cyclic voltammograms were initially recorded in 10 mL solutions of 0.1 M phosphate buffer as the supporting electrolyte and then in the same solution containing 1.0 mM of uric acid. Before use, the GCE was manually polished on a polishing mat with an aqueous slurry of 5 μm aluminum oxide. It was then rinsed with deionized water and dried with a tissue. The voltammetric conditions were as follows: initial and end potential of 0.0 V with a switching potential of +0.8 V. The effect of pH was investigated over the range pH 2 to pH 12. At each pH point, the effect of scan rate was studied over the range 10 to 200 mV/s.

2.4. High-Performance Anion Exchange Liquid Chromatography

Initial HPAEC studies were conducted at room temperature using both UV detection at 254 nm and subsequent amperometric detection at +0.90 V versus stainless steel (SS). In both methods, a mobile phase of 0.05 M pH 8.0 phosphate buffer was used at a flow rate of 1.0 mL/min with a 100 mm × 4.6 mm, 8 µm SAP strong anion exchange column (Polymer Laboratories, Shropshire, UK).

2.5. Electrochemical Detection

Figure 1 shows a cross-sectional view of the electrochemical amperometric thin-layer cell that was employed in this study. This was similar to that previously described for the liquid chromatographic electrochemical determination of nicotine [44]. The thin-layer cell was operated as a two-electrode system comprising of a 3 mm diameter glassy carbon working electrode encased in a Teflon block and a stainless steel (SS) block serving as both the pseudo-reference and counter electrode. These were separated by Teflon gaskets sourced from BAS, Congleton, Cheshire, UK, forming a channel allowing the effluent from the anion exchange column to flow through the cell and across the opposing surfaces of the glassy carbon working electrode and stainless-steel pseudo-reference/counter electrode. Initial studies employed an EG&G Princeton Applied Research (Princeton, NJ, USA) model 362 scanning potentiostat to control the potential at +0.90 V (vs. SS). Chromatograms were recorded using a Siemens Kompensograph X-T C1012 chart recorder. Further investigations utilized an Ivium CompactStat potentiostat (Ivium Technologies, The Netherlands) connected to a PC for instrument control and data acquisition. UV detection was performed at 254 nm using an Agilent 1100 HPLC system.

2.6. Hydrodynamic Voltammetry (HDV)

Hydrodynamic voltammetry (HDV) was conducted by introducing fixed volumes of 20 µL of a 1.70 mg/L standard uric acid solution and varying the applied potential between 0.0 V and +1.4 V (vs. SS) in 0.1 V steps. Each step was held long enough for the uric acid peak to elute, ca. 2 min. The hydrodynamic voltammogram was created by plotting the recorded peak current against the applied potential. The optimal potential was identified from the plateau of the hydrodynamic wave.

2.7. Dust Wipe Sampling and Extraction

Dust wipe samples were collected by wiping from the left upper corner of the sample area in an “S” shape, moving side-to-side while progressing downward. The exposed wipe was then folded in half, with the exposed sides facing each other, and another “S” shape was made in the opposite direction, wiping up and down instead of side-to-side. The folded wipe was placed in a glass vial, which also served as the extraction vessel, and sealed. A new pair of gloves was used for each sample. A procedural blank was obtained by taking a tissue onsite without sampling the surface. The sampled area was measured to allow for comparison of the concentration values (μg/m2) between different surfaces. The sealed sample vial was then returned to the laboratory and opened, and an 8 mL aliquot of 50 mM pH 8 phosphate buffer was then added. This was then resealed, and the sample on the dust wipe was extracted via sonication for 15 min at room temperature. A suitable aliquot of this was taken and investigated using HPAEC with amperometric detection and UV detection.

2.8. Investigation of Precision and Accuracy

Separate dust wipes (n = 5) were fortified with 16.8 µg of uric acid. These were then extracted using the method described in Section 2.6. The resulting solutions were then introduced to the HPAEC system, and the concentrations of uric acid were determined using the optimized conditions.

3. Results and Discussion

3.1. Cyclic Voltammetric Investigations of Uric Acid

The cyclic voltametric behavior of uric acid in 0.1 M phosphate buffer was investigated over the pH range 1.8 to pH 12.3. Figure 2 shows representative cyclic voltammograms for 1.0 mM uric acid obtained in 0.1 M pH 7.2 phosphate buffer. A single oxidation peak was recorded with a peak potential of +0.38 V (vs. Ag/AgCl). Previous studies have shown the electrochemical oxidation of uric acid to be complex and affected by pH and other conditions [45,46,47,48,49,50,51]. A number of publications [52,53,54] show the mechanism for the voltametric oxidation of uric acid (I) to be the 2e, 2H+ oxidation to an unstable anionic quinoid compound, giving the resonance species, IIa and IIb. However, this is a short-lived, unstable intermediate [45,47,48] that undergoes rapid conversion via the nucleophilic addition of water to give the imine-alcohol species, (III). The further addition of water results in the formation of 4,5-dihydroxyluric acid (IV). This undergoes decomposition [45,47,48] to give the non-electrochemical active compound allantoin (V) [45,47,48].
Sci 07 00040 i002
Consequently, in the potential range we studied, the cyclic voltammogram shows a single oxidation with no further peaks. As shown in Figure 2, the resulting peak current (ip) for this oxidation was found to give a linear relationship with the square root of the scan rate (v½), demonstrating a diffusion-controlled reaction [55,56] over the pH range of pH 1.8 to pH 12.3. Further examination of the oxidation peak potential (Ep) behavior with changing pH showed near-theoretical Nernstian behavior across the entire pH range investigated, with a slope of 60 mV/pH unit, indicative of an equal number of protons and electrons involved in the oxidation process. However, as shown in Figure 3, two notably different cyclic voltametric behaviors were recorded. At pH values below pH 8, the peak width at half height was found to reduce from ca. 200 mV to 100 mV.
The associated ip was found to give a maximum at pH values lower than pH 6, which resulted from the ionization of uric acid (pKa = 5.4 [57]). As the aim of this investigation was to develop an anion exchange chromatographic separation step for the quantification of uric acid, further investigations were undertaken at pH 8 to ensure that the urate anion was the predominating species and that the maximum electrochemical response was still obtained.

3.2. High-Performance Anion Exchange Liquid Chromatographic Separation of Uric Acid

Uric acid is reported to exhibit two pKa values of 5.4 and 10.3 [57]. Consequently, under biologically and generally environmentally compactable pH conditions, it is present as a singly charged urate ion. Consequently, it is believed that it should be possible to separate and quantify uric acid as its urate ion using high-performance anion exchange chromatography (HPAEC) using a mobile phase buffered at pH 8.0.

3.3. Hydrodynamic Voltammetry

Figure 4 illustrates the HDV obtained over the potential range of 0.0 to +1.4 V (vs. SS). Over the potential range of +0.2 V to +0.6 V (vs. SS), the peak current response for uric acid increased with increasing applied positive potential. Beyond this range, from +0.7 V to +1.4 V (vs. SS), the current response began to plateau and then remained constant. Therefore, subsequent HPAEC with amperometric detection was conducted using an applied potential of +0.90 V (vs. SS).

3.4. Calibration Curve, Limit of Detection, and Precision

A linear response over the uric acid concentration range of 0.1 mg/L to 100 mg/L (R2 = 0.999) was achieved. Using a signal-to-noise ratio of three, a limit of detection of 0.866 mg/L was calculated. Table 1 shows the relative analytical performance characteristics of the developed method. This compares well with those recently reported [58] for the hydrophilic interaction liquid chromatography (HILC)-based method reported for the determination of uric acid. The HILC approach was reported to require a much longer retention time of >15 minutes to overcome sample interferences. In the present report, this was easily overcome via the application of the more selective electrochemical detector. The present study’s limit of detection compares well with that of 5.0 μg/mL reported for the HILC approach using UV detection. The determination of uric acid using microemulsion electrokinetic chromatography [59] in human plasma and urine has also been reported. Following sample extraction and using salicylamide as an internal standard, a limit of detection of 0.50 μg/mL was reported. A number of different voltametric approaches for the determination of uric acid have been explored for the determination of uric acid [60]. The application of different cobalt-based aerogel modified electrodes has recently been investigated [61], gaining detection limits of up to 9.80 μg/mL, notably higher than that reported here. Previously, Ardakani et al. [62] developed a TiO2 nanoparticle-modified carbon paste electrode for the determination of uric acid using differential pulse voltammetry, reporting a limit of detection of 2.0 μg/mL, over twice that reported here. The application of a glassy carbon amino-functionalized reduced graphene oxide-modified electrode [63] was similarly shown to give a notably higher limit of detection of 28.1 μg/mL compared to the present study.
For a 3.36 mg/L uric acid standard (n = 7), a coefficient of variation of 1.48% was obtained. Dust wipes were spiked with 16.8 µg of uric acid (n = 5) and extracted using the described procedure. The mean recovery was 99.6%, with a coefficient of variation of 4.52% (n = 5).

3.5. Studies of Possible Interferences

Nitrite, nitrate, acetate, chloride, and sulphate were all examined as possible interferences. Only nitrite was found to give a chromatographic response. This was resolved from that of uric acid; hence, none of these anions interfered with the determination of uric acid.

4. Analytical Application

The glass windows of doors and windows from both indoor and outdoor environments were selected for investigation, ensuring that any obvious bird excrement was avoided. Figure 5 presents representative chromatograms for uric acid standards and extracted dust wipe samples, obtained through amperometric detection (Figure 5A) and UV detection at 254 nm (Figure 5B). For a 3.36 mg/L uric acid standard, a well-resolved peak for uric acid was observed at a retention time of 1.22 min using both UV and amperometric detection. No late eluting or coeluting peaks were detected amperometically. However, a negative absorbance peak was recorded via UV detection at between 1.4 and 1.6 min. No other peaks were detected in the procedural blanks using either UV or amperometric detection. The injection-to-injection time was only two minutes.
Using the optimized chromatographic method with amperometric detection (Figure 5A), a well-resolved peak corresponding to uric acid was detectable at 1.22 min. However, the same sample examined via UV detection showed the chromatographic peak for uric acid recorded as a shoulder on a much larger later eluting peak (Figure 5B), making quantification using UV very difficult. Similar behavior for anion exchange chromatographic separation of uric acid with UV detection has been previously reported [64]. Consequently, amperometric detection was used in further studies.
As shown in Table 2, it was possible to detect uric acid in the majority of the samples obtained from the outside of buildings. Birds represent the most probable source of possible uric acid in these samples. Uric acid may also result from decaying animal and vegetable matter, but again, this is not a realistic source in these cases.

5. Conclusions

A method using anion exchange chromatography and electrochemical detection has been reported for the determination of uric acid in environmental dust wipe samples. This was achieved using an anion exchange column with a pH 8, 50 mM phosphate buffer-based mobile phase. Amperometric detection at +0.90 V (vs. SS) was employed, and a peak free from interferences was obtained with a retention time of only 1.22 min. This approach was found to be superior to the application of UV detection, as co-eluting sample components make quantification difficult.
Future studies will focus on developing the method for the determination of uric acid associated with airborne particulates and surface contamination in the areas of food safety. This will include the use of chemically modified electrodes and surface modification of electrodes to enhance detection sensitivity and specificity. It could be envisaged that the antioxidant properties [65,66,67] of uric acid may stabilize other compounds present in the sample. This could result in changes in the nature of the settled dust and the particulate matter that it originates from. To our knowledge, this is a factor that has not to this point been investigated and would have possible ramifications on the behavior of pollutants and their interactions with particulate matter. Expanding this study to include various environmental matrices such as soil, water, and sediments to provide a more comprehensive understanding of the impact of uric acid on different ecosystems should be investigated.
Investigating the presence of uric acid in food production and storage environments could be another possible direction. This would aid in assessing the risk of contamination and developing strategies for its mitigation. The method developed in this study can be used for routine monitoring of uric acid levels in urban environments. This can help in identifying areas with high contamination levels and implementing appropriate measures to reduce exposure. By identifying and quantifying uric acid in dust samples, public health officials can assess the risk of exposure to pathogens associated with bird droppings. This information can be used to develop guidelines and policies to protect public health. This method can be applied to monitor and manage the impact of bird droppings on buildings and monuments. Regular monitoring can help in timely cleaning and maintenance to prevent structural damage and degradation. Understanding the levels of uric acid in agricultural settings can help in managing the use of fertilizers and animal manure. This can lead to better practices that minimize environmental contamination and improve soil health.

Author Contributions

Conceptualization, K.C.H.; methodology, K.C.H.; validation, K.C.H.; investigation, K.C.H.; writing—original draft preparation, K.C.H.; writing—review and editing, K.C.H.; visualization, K.C.H.; project administration, K.C.H.; funding acquisition, K.C.H. Author has read and agreed to the published version of the manuscript.

Funding

This research was funded by the University of the West of England, UK.

Institutional Review Board Statement

Not applicable.

Informed Consent Statement

Not applicable.

Data Availability Statement

The original contributions presented in this study are included in the article. Further inquiries can be directed to the corresponding author.

Acknowledgments

The author acknowledges the University of the West of England, Bristol, UK.

Conflicts of Interest

The author declares no conflicts of interest.

Abbreviations

The following abbreviations are used in this manuscript:
CV Cyclic voltammetry
GCEGlassy carbon electrode
HDVHydrodynamic voltammetry
HPAEC High-performance anion exchange chromatography
ip Peak current
SSStianless steel
vScan rate

References

  1. Zhao, F.Y.; Wang, Z.H.; Wang, H.; Zhao, R.; Ding, M.Y. Determination of uric acid in human urine by ion chromatography with conductivity detector. Chin. Chem. Lett. 2011, 22, 342–345. [Google Scholar]
  2. Kumar, A.N.; Aruna, P.; Naidu, J.N.; Kumar, R.; Srivastava, A.K. Review of concepts and controversies of uric acid as antioxidant and pro-oxidant—An uncertainty. Arch. Med. Rev. J. 2015, 24, 19–40. [Google Scholar]
  3. So, A.; Thorens, B. Uric acid transport and disease. J. Clin. Investig. 2010, 120, 1791–1799. [Google Scholar] [PubMed]
  4. Gérard, B.; Leask, M.; Merriman, T.R.; Bardin, T.; Oehler, E.; Lawrence, A.; Viali, S.; ‘Ofanoa, S.; Te Karu, L.; Stamp, L.K.; et al. Hyperuricaemia and gout in the Pacific. Nat. Rev. Rheumatol. 2025, 21, 197–210. [Google Scholar] [CrossRef]
  5. Du, L.; Zong, Y.; Li, H.; Wang, Q.; Xie, L.; Yang, B.; Pang, Y.; Zhang, C.; Zhong, Z.; Gao, J. Hyperuricemia and its related diseases: Mechanisms and advances in therapy. Sig. Transduct. Target Ther. 2024, 9, 212. [Google Scholar]
  6. Urzyk, M.; Pulina, M.; Ajewicz, M.; Zjawiony, I. Uric acid in the surface waters of Spitsbergen and its role in the dissolution processes which affect carbonate rocks. Pol. Polar Res. 2006, 27, 327–340. [Google Scholar]
  7. Lindeboom, H.J. The Nitrogen Pathway in a Penguin Rookery. Ecology 1984, 65, 269–277. [Google Scholar]
  8. Brown, L.; Braven, J.; Rhead, M.M.; Evens, R.; Butler, E.I. The use of uric acid as a method of tracing domestic sewage discharges in riverine, estuarine and coastal water environments. Water Res. 1982, 16, 1409–1411. [Google Scholar]
  9. Braverman, M.M.; Theophil, C.; Masciello, F.; Smith, C. The Contribution to Air Pollution by Pigeons. J. Air Pollut. Control Assoc. 1962, 12, 570–571. [Google Scholar]
  10. Carlson, M.; Thompson, R.D. Identification of Allantoin, Uric Acid, and Indoxyl Sulfate as Biochemical Indicators of Filth in Food Packaging by LC. J. AOAC Int. 2001, 84, 782–788. [Google Scholar]
  11. Ghaedian, A.R.; Wehling, R.L. Stability of Uric Acid Used as an Indicator of Insect Contamination During Extrusion of Wheat Flour. Cereal Chem. 1996, 73, 625–627. [Google Scholar]
  12. Honeychurch, K.C. The determination of uric acid in human saliva by liquid chromatography with electrochemical detection. J. Anal. Bioanal. Sep. Tech. 2017, 2, 1–5. [Google Scholar]
  13. Dantzler, W.H.; Braun, E.J. Comparative nephron function in reptiles, birds, and mammals. Am. J. Physiol. Regul. Integr. Comp. Physiol. 1980, 239, R197–R213. [Google Scholar]
  14. Mizutani, H.; Wada, E. High-performance liquid chromatographic determination of uric acid in soil. J. Chromatogr. A 1985, 331, 359–369. [Google Scholar]
  15. Crouch, N.M.A.; Lynch, V.M.; Clarke, J.A. A re-evaluation of the chemical composition of avian urinary excreta. J. Ornithol. 2020, 161, 17–24. [Google Scholar]
  16. Otero, X.L.; De La Peña-Lastra, S.; Pérez-Alberti, A.; Ferreira, T.O.; Huerta-Diaz, M.A. Seabird colonies as important global drivers in the nitrogen and phosphorus cycles. Nat. Commun. 2018, 9, 246. [Google Scholar] [PubMed]
  17. Vasiliu, A.; Buruiana, D. Are Birds a Menace to outdoor Monuments? Int. J. Conserv. Sci. 2010, 1, 83–92. [Google Scholar]
  18. Tizard, I. Salmonellosis in wild birds. Semin. Avian Exot. Pet Med. 2004, 13, 50–66. [Google Scholar]
  19. Hogerwerf, L.; Roof, I.; de Jong, M.J.; Dijkstra, F.; van Der Hoek, W. Animal sources for zoonotic transmission of psittacosis: A systematic review. BMC Infect. Dis. 2020, 20, 192. [Google Scholar]
  20. Tsutsui, T.; Miyazaki, Y.; Kuramochi, J.; Uchida, K.; Eishi, Y.; Inase, N. The Amount of Avian Antigen in Household Dust Predicts the Prognosis of Chronic Bird-related Hypersensitivity Pneumonitis. Ann. Am. Thorac. Soc. 2015, 12, 1013–1021. [Google Scholar]
  21. Sedlmaier, N.; Hoppenheidt, K.; Krist, H.; Lehmann, S.; Lang, H.; Büttner, M. Generation of avian influenza virus (AIV) contaminated fecal fine particulate matter (PM): Genome and infectivity detection and calculation of immission. Vet. Microbiol. 2009, 139, 156–164. [Google Scholar] [CrossRef] [PubMed]
  22. Feddes, J.J.R.; Cook, H.; Zuidhof, M.J. Characterization of airborne dust particles in turkey housing. Can. Agric. Eng. 1992, 34, 273–280. [Google Scholar]
  23. Centers for Disease Control and Prevention. Reported Human Infections with Avian Influenza A Viruses. Available online: https://www.cdc.gov/bird-flu/php/avian-flu-summary/reported-human-infections.html (accessed on 11 March 2025).
  24. Cohen, J. Worries about Bird Flu in US Cattle Intensify. Science 2024, 384, 12–13. [Google Scholar] [CrossRef] [PubMed]
  25. Bindu, P.V.; Manjappa, S.; Kumara Swamy, B.E.; Manjunatha, L.S. Electrochemical Sensing of Uric Acid at Cerium Oxide Poly (Congo Red) Modified Carbon Paste Electrode. Sens. Technol. 2024, 2, 2435833. [Google Scholar]
  26. Penagos-Llanos, J.; Segura, R.; de la Vega, A.P.; Pichun, B.; Liendo, F.; Riesco, F.; Nagles, E. Electrochemical Determination of Uric Acid Using a Nanocomposite Electrode with Molybdenum Disulfide/Multiwalled Carbon Nanotubes (MoS2@MWCNT). Nanomaterials 2024, 14, 958. [Google Scholar] [CrossRef]
  27. Nguyen, V.T.; Manh, T.D.; Man, N.Q.; Thoa, P.T.H.; Khieu, D.Q. Electrochemical Detection of Uric Acid and Xanthine in Human Urine Using the Co/UiO-66 Modified Glassy Carbon Electrode. J. Appl. Electrochem. 2024, 54, 2361–2376. [Google Scholar]
  28. Khan, N.; Ahmad, M.; Sun, W.; Shah, N.S.; Asad, M.; Shah, M.; Ullah, R.; Ibrahim, M.A.; Badshah, A.; Nishan, U. Optical Detection of Uric Acid Based on a Citric Acid Functionalized Copper-Doped Biochar Nanozyme. RSC Adv. 2024, 14, 33007–33018. [Google Scholar] [CrossRef]
  29. Ke, W.; Kuang, G.; Gu, C.; Wang, J.; Jiang, X.; Zhu, R.; Wang, H.; Zhang, Z. Enzyme cascade nanozyme based colorimetric sensor for detection of uric acid as a biomarker of hyperuricemia. Microchim. Acta 2025, 192, 85. [Google Scholar]
  30. Moriiwa, Y.; Hatakeyama, K.; Morioka, K.; Inoue, Y.; Murakami, H.; Teshima, N.; Yanagida, A.; Shoji, A. Colorimetric and fluorometric determination of uric acid by a suspension-based assay using enzyme-immobilized micro-sized particles. Anal. Sci. 2024, 40, 951–958. [Google Scholar] [CrossRef]
  31. Drees, L.R.; Manu, A. Bird urate contamination of atmospheric dust traps. Catena 1996, 27, 287–294. [Google Scholar] [CrossRef]
  32. Yang, Y.D. Simultaneous determination of creatine, uric acid, creatinine and hippuric acid in urine by high performance liquid chromatography. Biomed. Chrom. 1998, 12, 47–49. [Google Scholar]
  33. Luo, X.; Cai, N.; Cheng, Z. Determination of uric acid in plasma by LC-MS/MS and its application to an efficacy evaluation of recombinant urate oxidase. Anal. Sci. 2013, 29, 709–713. [Google Scholar] [PubMed]
  34. Kim, K.M.; Henderson, G.N.; Ouyang, X.; Frye, R.F.; Sautin, Y.Y.; Feig, D.I.; Johnson, R.J. A Sensitive and Specific Liquid Chromatography-Tandem Mass Spectrometry Method for the Determination of Intracellular and Extracellular Uric Acid. J. Chromatogr. B 2009, 877, 2032–2038. [Google Scholar]
  35. Aoki, T.; Yoshiura, M.; Iwamoto, T.; Iriyama, K. Postmortem changes of uric acid in various rat tissues: Determination of uric acid by reversed-phase high-performance liquid chromatography with electrochemical detection. Anal. Biochem. 1984, 143, 113–118. [Google Scholar]
  36. Howorth, P.J.N.; Zilva, J.F. Determination of uric acid levels in uraemia by enzymatic and colorimetric techniques. J. Clin. Path. 1968, 21, 192–195. [Google Scholar]
  37. Barham, D.; Trinder, P. Enzymatic determination of Uric acid. Analyst 1972, 97, 142–145. [Google Scholar] [PubMed]
  38. Cunningham, S.K.; Keaveny, T.V. A two-stage enzymatic method for determination of uric acid and hypoxanthine/xanthine. Clin. Chim. Acta 1978, 86, 217–221. [Google Scholar]
  39. Galbán, J.; Andreu, Y.; Almenara, M.J.; de Marcos, S.; Castillo, J.R. Direct determination of uric acid in serum by a fluorometric-enzymatic method based on uricase. Talanta 2001, 54, 847–854. [Google Scholar]
  40. Taei, M.; Jamshidi, M. Highly selective determination of ascorbic acid, epinephrine, and uric acid by differential pulse voltammetry using poly(Adizol Black B)-modified glassy carbon electrode. J. Solid State Electrochem. 2014, 18, 673–683. [Google Scholar]
  41. Bravo, R.; Brajter-Toth, A. A highly active carbon microdisk electrode surface for the determination of uric acid in physiological buffers. Chem. Anal. 1999, 44, 423–436. [Google Scholar]
  42. Zhang, Y.; Lei, W.; Xu, Y.; Xia, X.; Hao, Q. Simultaneous Detection of Dopamine and Uric Acid Using a Poly(l-lysine)/Graphene Oxide Modified Electrode. Nanomaterials 2016, 6, 178. [Google Scholar] [CrossRef]
  43. Gilmartin, M.A.T.; Hart, J.P.; Birch, B. Voltammetric and amperometric behaviour of uric acid at bare and surface-modified screen-printed electrodes: Studies towards a disposable uric acid sensor. Analyst 1992, 117, 1299–1303. [Google Scholar]
  44. Peng, X.; Giltrow, D.; Bowdler, P.; Honeychurch, K.C. Liquid chromatography electrochemical determination of nicotine in third-hand smoke. Electroanalysis 2017, 29, 374–379. [Google Scholar]
  45. Struck, W.A.; Elving, P.J. Electrolytic Oxidation of Uric Acid: Products and Mechanism. Biochemistry 1965, 4, 1343–1353. [Google Scholar]
  46. Wang, Y. The electrochemistry of uric acid at a gold electrode modified with L-cysteine, and its application to sensing uric urine. Microchim. Acta 2011, 172, 419–424. [Google Scholar]
  47. Goyal, R.N.; Mittal, A.; Agarwal, D. Electrochemical Oxidation and Kinetics of the Decay of UV-Absorbing Intermediate of Uric-Acid Oxidation at Pyrolytic-Graphite Electrodes. Can. J. Chem. 1994, 72, 1668–1674. [Google Scholar]
  48. Dryhurst, G.; Nguyen, N.T.; Wrona, M.Z.; Goyal, R.N.; Brajter-Toth, A.; Owens, J.L.; Marsh, H.A. Elucidation of the Biological Redox Chemistry of Purines Using Electrochemical Techniques. J. Chem. Ed. 1983, 60, 315–319. [Google Scholar]
  49. Mautjana, N.A.; Estes, J.; Eyler, J.R.; Brajter-Toth, A. One-Electron Oxidation and Sensitivity of Uric Acid in On-Line Electrochemistry and in Electrospray Ionization Mass Spectrometry. Electroanalysis 2008, 20, 2501–2508. [Google Scholar]
  50. Lakshmi, D.; Whitcombe, M.J.; Davis, F.; Sharma, P.S.; Prasad, B.B. Electrochemical Detection of Uric Acid in Mixed and Clinical Samples: A Review. Electroanalysis 2011, 23, 305–320. [Google Scholar]
  51. Goyal, R.N.; Brajter-Toth, A.; Dryhurst, G. Further Insights into the Electrochemical Oxidation of Uric Acid. J. Electroanal. Chem. Interfacial Electrochem. 1982, 131, 181–202. [Google Scholar]
  52. Van der Horst, C.; de Souza Gil, E.; Somerset, V. Electrochemical Sensing of Uric Acid Using Bismuth-Silver Bimetallic Nanoparticles Modified Sensor. Eclét. Quím. 2024, 49, e-1497. [Google Scholar] [CrossRef]
  53. Li, Y.; Zhai, X.; Liu, X.; Ji, X.; Wang, L. Voltammetric determination of uric acid in the presence of ascorbic acid and dopamine using chitosan/ionic liquid composite electrode. Ionics 2014, 20, 1247–1254. [Google Scholar]
  54. Rastogi, P.K.; Gupta, R.; Prakash, S.; Ganesan, V. Non-enzymatic Determination of Uric Acid by Ion Exchange Voltammetry at a Permselective Electrochemical Sensing Platform. Anal. Chem. Lett. 2015, 5, 127–134. [Google Scholar]
  55. Wopschall, R.H.; Sharin, I. Adsorption characteristics of the methylene blue system using stationary electrode polarography. Anal. Chem. 1967, 39, 1527–1534. [Google Scholar]
  56. Nicholson, R.S.; Shain, I. Theory of Stationary Electrode Polarography. Single Scan and Cyclic Methods Applied to Reversible, Irreversible, and Kinetic Systems. Anal. Chem. 1964, 36, 706–723. [Google Scholar]
  57. McCrudden, F.H. Uric Acid: The Chemistry, Physiology and Pathology of Uric Acid and the Physiologically Important Purin Bodies, with a Discussion of the Metabolism in Gout; BiblioBazaar: Charleston, SC, USA, 2008; ISBN 978-0-554-61991-0. [Google Scholar]
  58. Buckberry, J.; Telford, R.; Castells Navarro, L.; Snaith, J.; Swinson, D.; Healey, A.; Brickley, M.B. High-performance liquid chromatography (HPLC) as a means of assessing the presence of uric acid in archeological human remains: Challenges and future directions. Am. J. Biol. Anthropol. 2024, 184, e24938. [Google Scholar]
  59. Lin, X.; Wang, Y.; Sun, J.; Xiao, D.; Luo, W.; Li, H. Determination of uric acid in human plasma and urine by microemulsion electrokinetic chromatography. Anal. Methods 2013, 5, 5201–5207. [Google Scholar]
  60. Aafria, S.; Kumari, P.; Sharma, S.; Yadav, S.; Batra, B.; Rana, J.S.; Sharma, M. Electrochemical biosensing of uric acid: A review. Microchem. J. 2022, 182, 107945. [Google Scholar]
  61. Ruiz-Guerrero, C.D.; Estrada-Osorio, D.V.; Gutiérrez, A.; Espinosa-Lagunes, F.I.; Escalona-Villalpando, R.A.; Luna-Bárcenas, G.; Molina, A.; Arenillas, A.; Arriaga, L.G.; Ledesma-García, J. Novel Cobalt-Based Aerogels for Uric Acid Detection in Fluids at Physiological pH. Biosens. Bioelectron. 2025, 267, 116850. [Google Scholar]
  62. Ardakani, M.M.; Sheikhmohseni, M.A.; Beitollahi, H.; Benvidi, A.; Naeimi, H. Simultaneous determination of dopamine, uric acid, and folic acid by a modified TiO2 nanoparticles carbon paste electrode. Turk. J. Chem. 2011, 35, 6. [Google Scholar]
  63. Tawade, A.K.; Kamble, B.B.; Sharma, K.K.K.; Tayade, S.N. Simultaneous electrochemical investigations of dopamine and uric acid by in situ amino functionalized reduced graphene oxide. SN Appl. Sci. 2020, 2, 1082. [Google Scholar] [CrossRef]
  64. Hsu, D.-S.; Chen, S.S. Determination of uric acid by an anion-exchange column chromatography. Anal. Biochem. 1987, 163, 238–241. [Google Scholar] [CrossRef] [PubMed]
  65. Young, I.S.; Woodside, J.V. Antioxidants in health and disease. J. Clin. Pathol. 2001, 54, 176–186. [Google Scholar] [CrossRef]
  66. Ford, E.; Hughes, M.N.; Wardman, P. Kinetics of the Reactions of Nitrogen Dioxide with Glutathione, Cysteine, and Uric Acid at Physiological pH. Free Radic. Biol. Med. 2002, 32, 1314–1323. [Google Scholar] [CrossRef] [PubMed]
  67. Simic, M.G.; Jovanovic, S.V. Antioxidation Mechanisms of Uric Acid. J. Am. Chem. Soc. 1989, 111, 5778–5782. [Google Scholar] [CrossRef]
Figure 1. Thin-layer cell amperometric electrochemical detector cell.
Sci 07 00040 g001
Figure 2. Cyclic voltammograms recorded for 1.0 mM urate at GCE at scan rates of (i) 10 mV/s; (ii) 20 mV/s; (iii) 50 mV/s; (iv) 100 mV/s; (v) 200 mV/s. Supporting electrolyte: pH 7.2, 0.1 M phosphate buffer. Insert plot of resulting peak current (ip) vs. square root of scan rate (v½).
Sci 07 00040 g002
Figure 3. Effects of pH on the cyclic voltametric response of 1.0 mM uric acid in 0.1 M phosphate buffer: pH 12.34 (i); pH 10.13 (ii); pH 7.96 (iii); pH 6.37 (iv); pH 4.18 (v); pH 1.84 (vi).
Sci 07 00040 g003
Figure 4. Hydrodynamic voltammogram for 1.68 µg/mL uric acid in 50 mM pH 8.0 phosphate buffer at a flow rate of 1.0 mL/min.
Sci 07 00040 g004
Figure 5. Chromatograms of uric acid in dust wipe samples. Dashed line: 3.36 mg/L uric acid standard; solid line: uric acid dust wipe sample. (A) Amperometric detection at +0.90 V (vs. SS); (B) UV detection at 254 nm. Solid line: dust wipe sample, dashed line: 3.36 mg/L uric acid standard. Uric acid peak = *.
Sci 07 00040 g005
Table 1. Relative analytical performance characteristics of the developed method.
TechniqueLinear Range, μg/mLLimit of Detection, μg/mLSelectivityRef.
HPAEC0.1–100 0.866Nitrite, nitrate, acetate, chloride, and sulphate were found not to interfere Present study
HILC with UV and MS detection0.0011–21 5.0 (UV detection) and 0.05 (MS)Longer retention time (>15 min) needed for uric acid response to be free from interference from sample components. [58]
Microemulsion electrokinetic chromatography5–2000.5Requires sample extraction.[59]
Cobalt-based aerogel modified electrodesUp to 42.09.8Glucose, urea, lactic acid, and ascorbic acid cause changes in amperometric signal.[61]
TiO2 nanoparticle-modified carbon paste electrode2.0–151 2Able to determine uric acid, dopamine, and folic acid simultaneously.[62]
Glassy carbon amino functionalized reduced graphene oxide-modified electrode34.3–34228.1Notably higher detection limit.[63]
MS, mass spectrometry; UV, ultraviolet.
Table 2. Concentrations of uric acid from dust wipe samples investigated. nd = not detected, below limit of detection.
SampleCommentsµg/m2
1Inside of window of officend
2Inside of window of door to gardennd
3Outside of door windowpanend
4Outside of window of entrance security lodge to carpark42.8
5Metro Bus touchscreen (outside sample)nd
6Outside door windowpane87.8
7Outside windowpane (opposite feral pigeon roost)3980
8Outside door windowpane32.6
Disclaimer/Publisher’s Note: The statements, opinions and data contained in all publications are solely those of the individual author(s) and contributor(s) and not of MDPI and/or the editor(s). MDPI and/or the editor(s) disclaim responsibility for any injury to people or property resulting from any ideas, methods, instructions or products referred to in the content.

