Abstract
In this article, we compare a Google Tango tablet with the Microsoft HoloLens smartglasses in the context of the visualisation and interaction with Building Information Modeling data. A user test was conducted where 16 participants solved four tasks, two for each device, in small teams of two. Two aspects are analysed in the user test: the visualisation of interior designs and the visualisation of Building Information Modeling data. The results show that the Tango tablet is surprisingly preferred by most users when it comes to collaboration and discussion in our scenario. While the HoloLens offers hands-free operation and a stable tracking, users mentioned that the interaction with the Tango tablet felt more natural. In addition, users reported that it was easier to get an overall impression with the Tango tablet rather than with the HoloLens smartglasses.
1. Introduction
In recent years, architects and planners in the building sector have started using digital tools more and more, so that today it is possible to plan and build with the help of software tools. In this context, the Building Information Modelling (BIM) method aims to describe and support this development by defining rules to follow when planning digitally. With the usage of one central digital model during the entire lifecycle of a building, new possibilities come up with regard to the visualisation of plans in the spectrum from rendering videos to Augmented Reality (AR) or Virtual Reality (VR) visualisations.
In this article, AR visualisations of BIM data as well as interior design will be compared on different devices, namely the Google Tango development kit tablet and the Microsoft HoloLens developer version. We focus on the collaboration between users, which is why the user study which will be presented in this article was conducted in teams of two participants. The goal of our study is to investigate differences in the use and adoption of different device type in a collaborative setting.
The Google Tango [1] development kit tablet differs from other Android tablets available for consumers, as it offers additional sensors on the back, a more precise wide angle camera and an infrared emitter as well as a infrared camera, in order to visually detect changes in its own pose and orientation and to get information on the depth of the environment. Together with the data originating from other sensors, like, e.g., the accelerometer or the gyroscope, the tablet can perform a sensor fusion to calculate its pose and orientation respective to its environment. The Microsoft HoloLens [2] smartglasses offer similar sensing opportunities as the Tango tablet while being a different device type and running on Windows OS. It can be worn hands-free with the help of an adjustable headband and operated by gestures or speech commands.
The article is organised as follows: first, previous research on the comparison of different device classes are analysed as well as literature on the BIM topic. In the user test section, the setup, tasks and evaluation method are described. Then, the main results are presented and discussed. After the conclusions, an outlook on future work is given.
2. Related Work
Ever smaller devices with integrated positioning technology prepared the ground for mobile mixed reality computing, first outdoors using GPS, and now indoors. Novel use-cases in this domain were often pioneered by pervasive and augmented reality guides and games over the last two decades. They showed how links between digital data and real-world could be made and put to effective use. Seminal examples from research include the Cyberguide [3] which provided a mobile, Personal Digital Assistant (PDA)-based indoor information system at a university open day, Touring Machine [4] which provided an early, sophisticated (and bulky) outdoor augmented reality system for a university campus tour, and ARQuake, which provided a campus-version with bespoke mobile gear of the popular open-sourced 3D first-person-shooter Quake [5]. Using virtual and augmented reality technologies for architectural and civil engineering applications has been repeatedly proposed and studied over the past thirty years—basically since the first wave of VR appeared in the mid 1980s to early 1990s. Seminal work in this field was reported by the Walkthrough project [6], which provided a digital visualisation of a specified location in a virtual building at a frame-rate of one frame every 3–5 s. With faster computers came graphics at interactive frame-rates and subsequently the immersive Cave Automatic Virtual Envirionments (CAVEs), where several users could share a virtual view of complex data [7]. Other augmented reality projects brought similar visualisations to a round table to facilitate cooperative discussions with stake holders [8], or to the outside to present past or future buildings on site [9,10,11].
The idea of comparing several device types like Head mounted displays (HMD) with tablets, projectors or other visualisations is not new. There are several papers that compare those options with regard to assembling tasks [12,13,14,15,16]. While [12] does not use AR, but only two-dimensional instructions that were displayed on either an HMD or a tablet, showing that there is no big difference between the two device types, Ref. [14] recommends using a projector to support assembling tasks, even though the paper-based instruction performed fastest in their setup. Ref. [15] shows the impact of AR solutions in such settings, indicating that, with AR, less errors in the assembling task were made. While Ref. [16] supports the hypothesis, the AR with in situ instructions on a HoloLens leads to fewer errors, they show that the cognitive load of paper instructions is perceived lower. In the context of cognitive load, Ref. [13] observed that it is almost equal on paper and on a tablet, while being higher on a HMD with 2D instructions, but lower in an in situ AR scenario.
The recent advent of mobile 6 degrees of freedom indoor positioning technologies such as those found in the Microsoft HoloLens or the Google Tango moved mobile mixed reality to the inside of buildings. The device categories for such solutions are mainly head-mounted displays and tablets and smart phones, which allow for hands-free and hand-held operation when engaging with the visual overlays, respectively [17]. It has been generally studied how virtual objects can provide spatial cues in collaborative settings and influence the use of deistic gestures in discussions [18,19]. Related studies also found that one does not need to focus on visual realism in the rendering quality to provide meaningful interactions with the virtual content; comic-like stylistic abstraction can actually amplify the effect of the visualisation, and physical movement within the content is important [20].
Prior work in the scenario of interior design and virtual furniture placement [21,22,23,24] made use of various devices, but often used smartphones, tablets and marker-based tracking (the most prominent example here probably being the 2014 IKEA catalogue app allowing for placing virtual furniture in an AR view at home [25]. Similarly, the use of AR for architectural visualizations and on construction site-use has been studied on many occasions, e.g., for model visualization in combination with traditional methods like styrofoam [26], to show mistakes directly on site [27], or to supply additional information on smartphones and tablets to support learners in situ [28]. Tahar Messadi et al. discuss the role of an immersive HoloLens application for design and construction [29]. Another project showing the placement of virtual furniture in both AR—on a Tango tablet—and VR—on an HTC Vive—is the work presented by [30].
The data required to build such interactive experiences can nowadays be obtained as a side-effect from Building Information Modelling (BIM) workflows. An early mention of the term dates back to 1992 [31] and the concept has been spread further by a whitepaper from the leading 3D software company Autodesk in 2002 [32]. Technically spoken, the term proposes using synchronized databases to feed the many different views on the data required throughout the whole process of building planning, construction, maintenance, and teardown, i.e., having a central digital model at hands, which includes geometry data. The BIM method has been picked up by a number of governments around the world as the mandatory modus operandi for public building tenders and can be found, for example, in the respective UK [33] and German [34] construction strategies.
For building maintenance, it has been studied how to aid the process with the use of VR [35], by integrating sensors [36], or by facilitating the workflows for managing unforeseen events with collaborative software and AR views [37,38]. Using commercial game-engines and tools to support such mixed reality views is a relatively recent trend that is increasingly adopted due to their ubiquitous availability [39,40,41]. Game-engines offer an abstracted access to the mobile Graphics Processing Units (GPUs) on a variety of different devices and required little modifications to the code and data in order to address those different devices—leaving polygon reduction as one of the final challenges to deal with the arising device diversity [42,43], apart from overall interaction design and scenario finding. Examples of visualisations of BIM data are e.g., [44,45,46].
It has been previously suggested to apply mixed and augmented reality visualisations to the BIM process for information sharing and communication support in a ubiquitous manner [47], but the domain is still relatively uncharted as the processes are in the midst of being implemented. Nevertheless, it is important to already study now which device type is most suitable for a BIM scenario in a particular use case. This article aims to fill this research gap.
3. User Study
The user study’s goal is to compare a hand-held tablet and a hands-free smartglasses with regard to a realistic collaboration and discussion scenario. We want to investigate whether one device is preferred by the participants and whether they considered our software prototype to be suitable on both devices. In this context, we have been presented with a unique opportunity to study the use of hand-held and hands-free augmented reality views with BIM data for supporting co-located collaboration in a real world setting. As our institute has been active in the field of human–computer interaction and computer supported collaborative work for over three decades, the buildings that were once inhabited in second use naturally started to show wear and tear. To prepare for the long-awaited renovation, the real estate office applied BIM workflows. Old blueprints were digitised or redrawn in 3D with engineering precision using Autodesk Revit software, keeping variations of different life-cycle milestones, such as initial status, current use, and future plans. Thus, every building on our campus was now available in digital format, including their hidden pipes and wiring. In addition, our interior designers also used BIM workflows to redesign three central rooms (open space social and meeting area, student labs) and we could incorporate their data and design into our study.
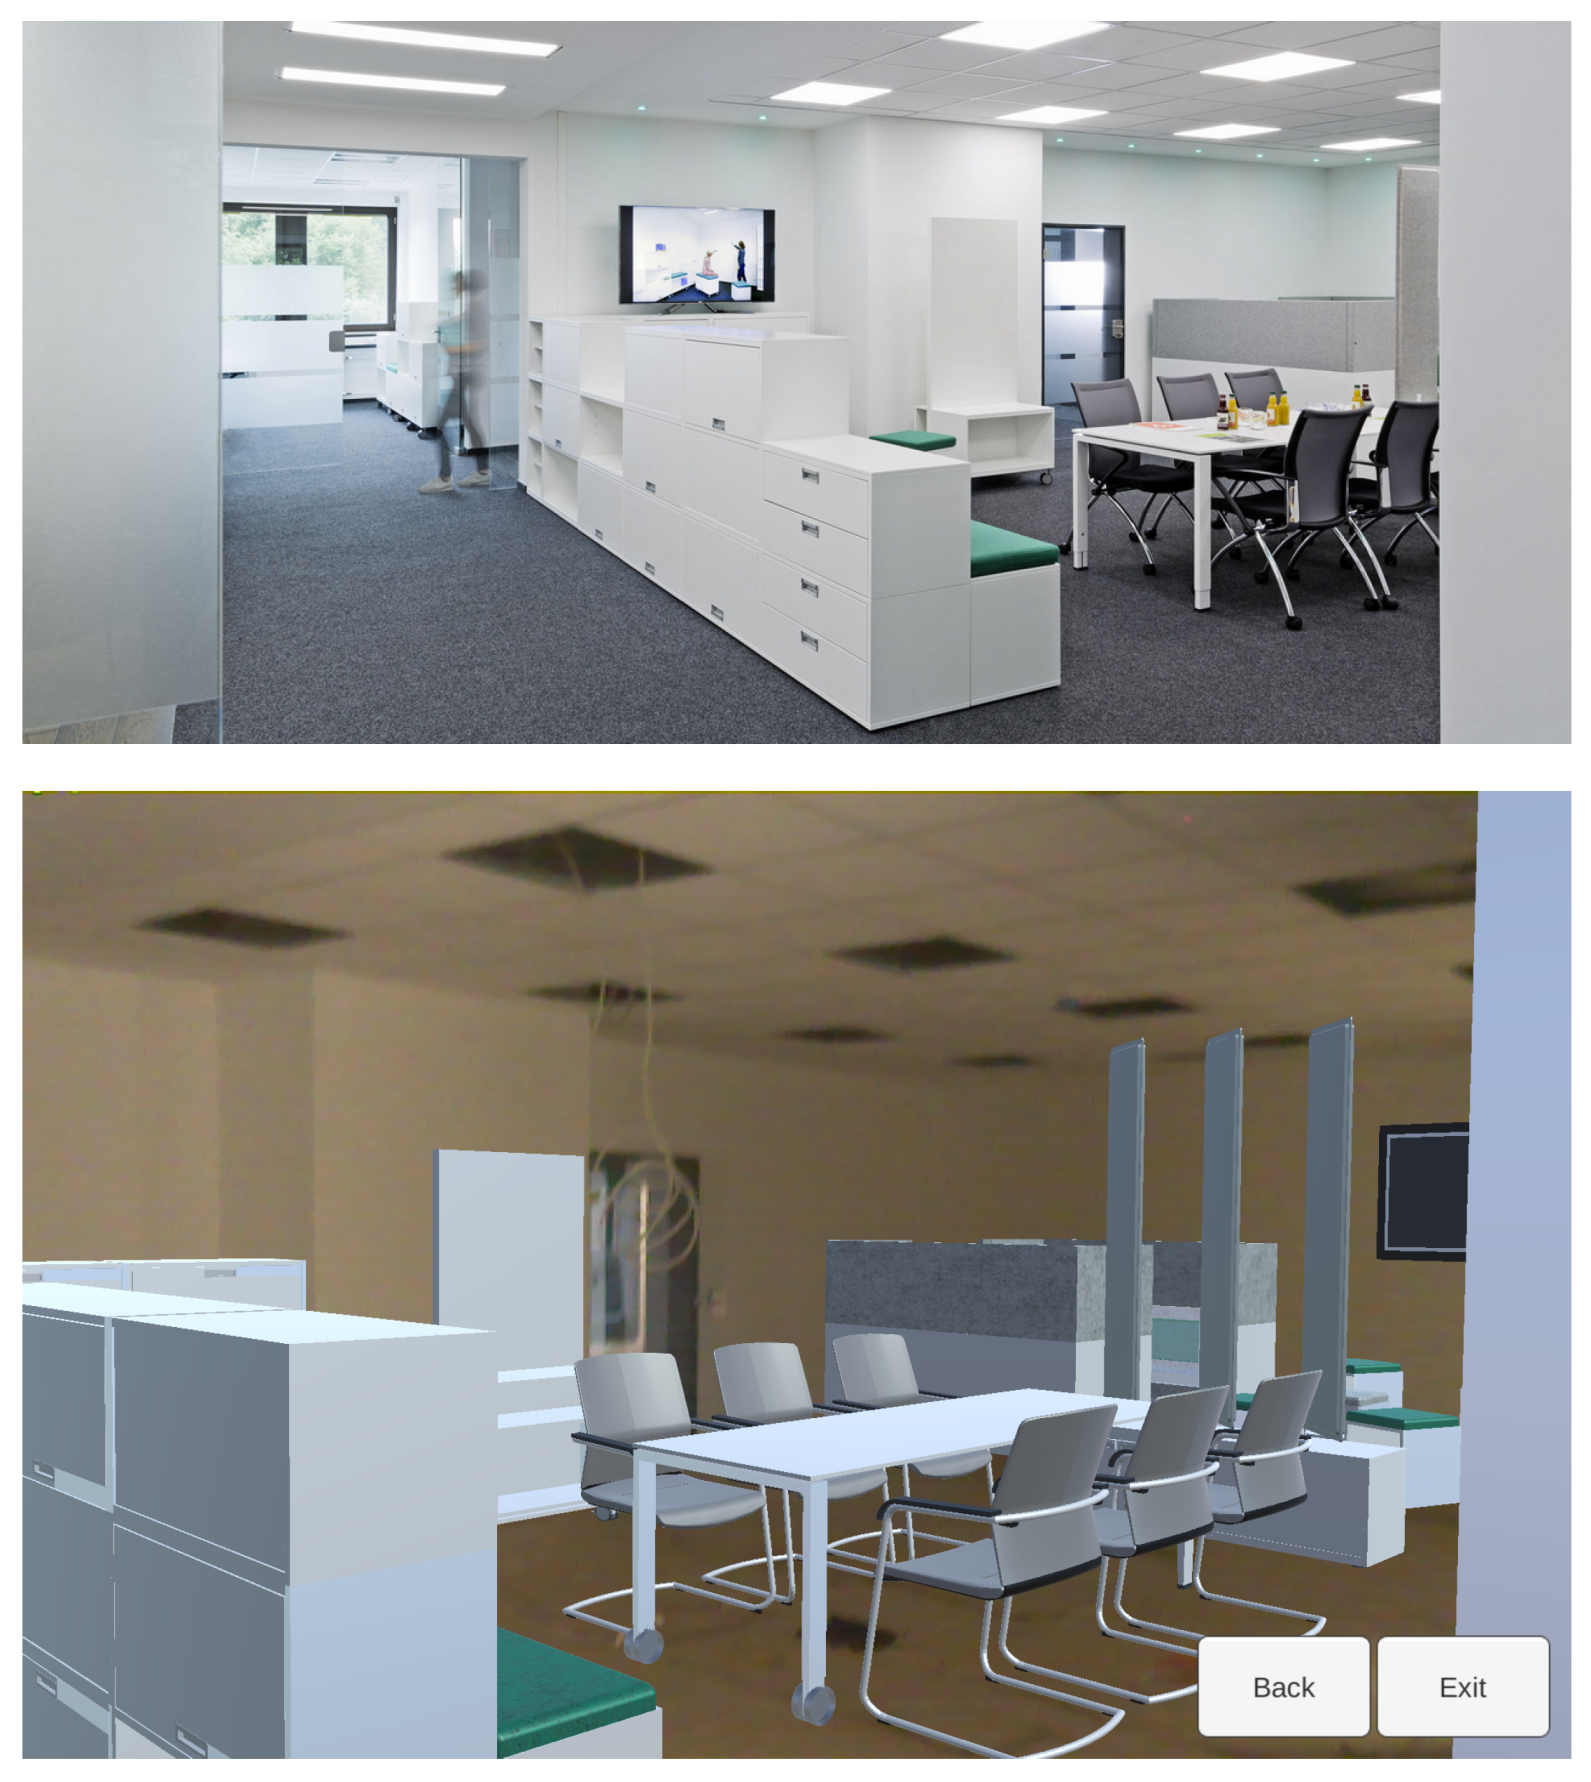
We devised two set of tasks, one for building maintenance and one for interior design. Figure 1 shows the main location of the study, a social meeting space. The pictures show the final space after construction finished and an AR view captured from a tablet during construction. The study itself was conducted in between those shots: when the carpets, walls, and ceilings were done and the building was deemed safe again, but, before the bulk of the furniture moved in—thus during a relatively small time-window.
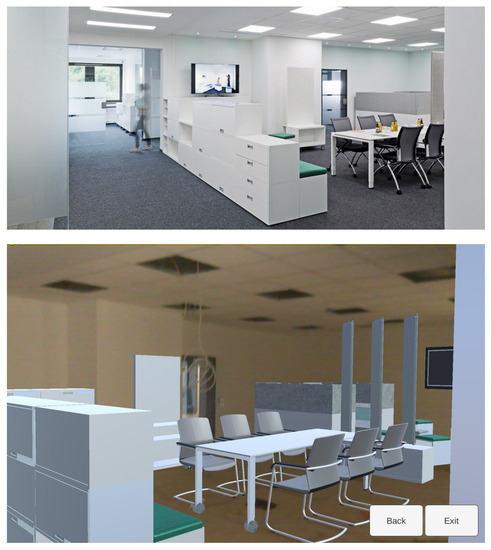
Figure 1.
The location for our user study: a renovated office area with Building Information Modeling data available for the building itself, as well as the furniture. top: real furniture after the renovation, bottom: Augmented Reality visualization during construction.
3.1. Setup
The user study was developed in the context of a 3D visualisation of BIM data with the help of Augmented Reality. Therefore, a precise and markerless indoor Augmented Reality experience with off-the shelf technology was implemented on a Google Tango tablet and Microsoft HoloLens smartglasses.
To compare both devices, a user study with 16 participants was conducted. Fourteen participants were from an academic environment (student, research assistant, professor), and two were architects. With 14 male and two female participants, the distribution of sexes is not balanced. While 10 participants were not familiar with the tested devices, six were. The participants had to perform four tasks in groups of two. Two tasks had to be performed with the Google Tango tablet, two with the Microsoft HoloLens smartglasses. Between the two tasks, a part of the questionnaires containing questions on the first device had to be answered by each participant. As the focus of the developed application was the visualisation of interior design and BIM data, the tasks were situated in that context. The overall time for one test run was 30 to 45 min. Each test run was documented with a video camera to analyse and recap the user behaviour afterwards.
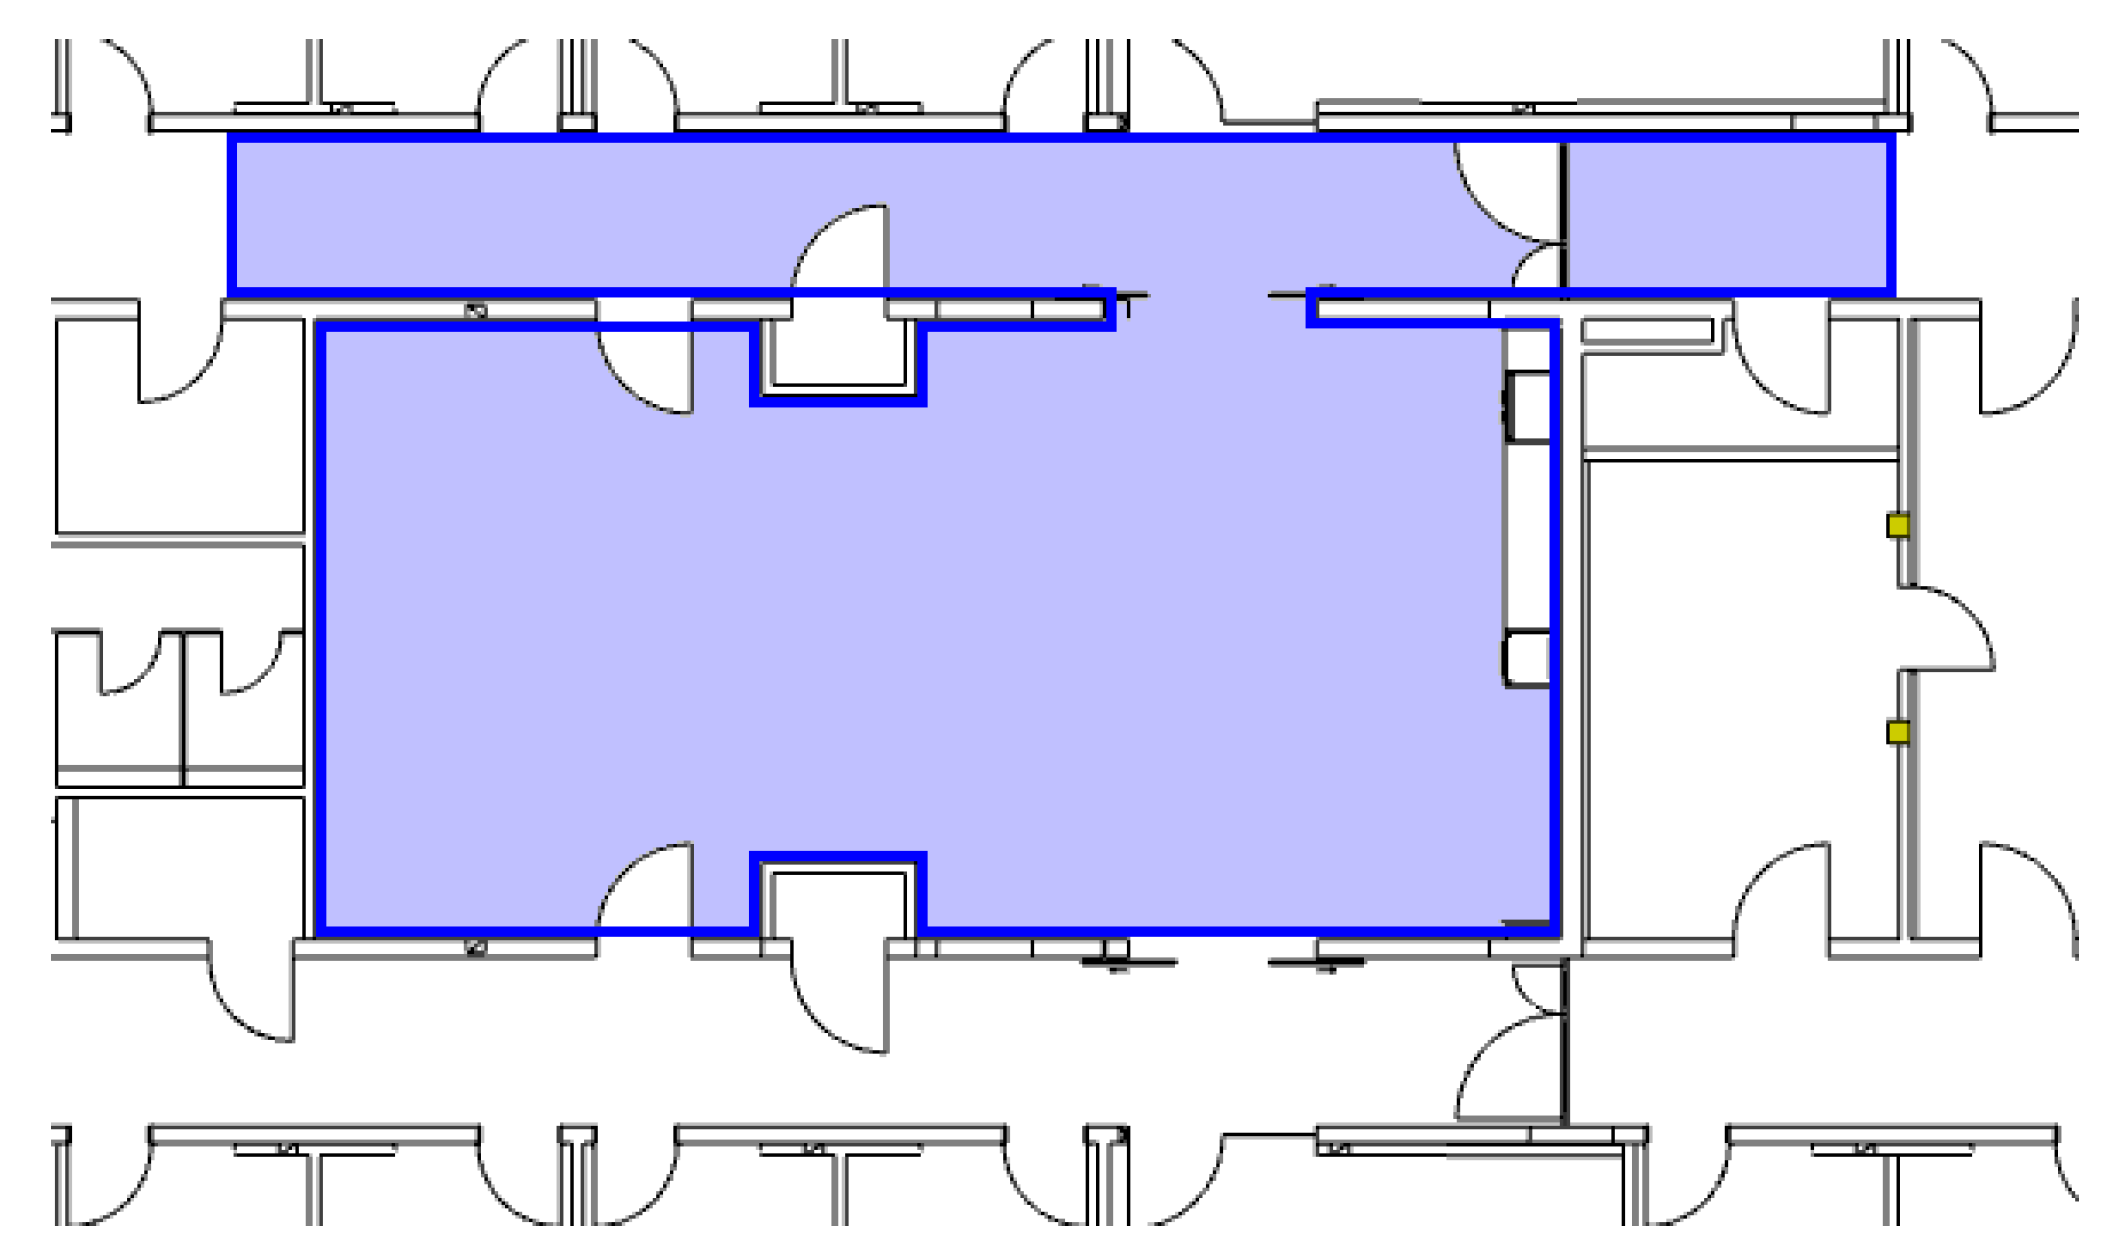
The test took place on the real construction site in a big central room and a neighbouring corridor, as one may see on the blueprint in Figure 2. To avoid any accident and any distraction, the floor of the room and the corridor was kept almost empty, so that the test users were able to focus on the devices and the 3D visualisation and did not have not to deal with any obstacles in their way.
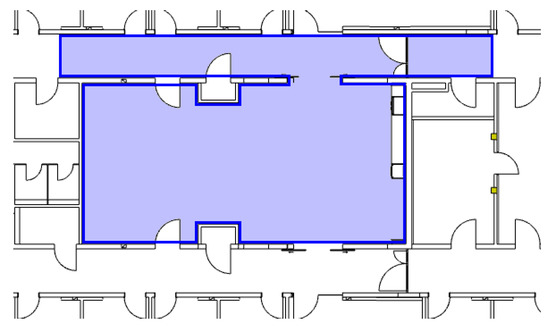
Figure 2.
Blueprint of the room and the neighbouring corridor—marked in blue in the picture—in which the user test took place. The surface of the room is approximately 85 m.
3.2. Tasks
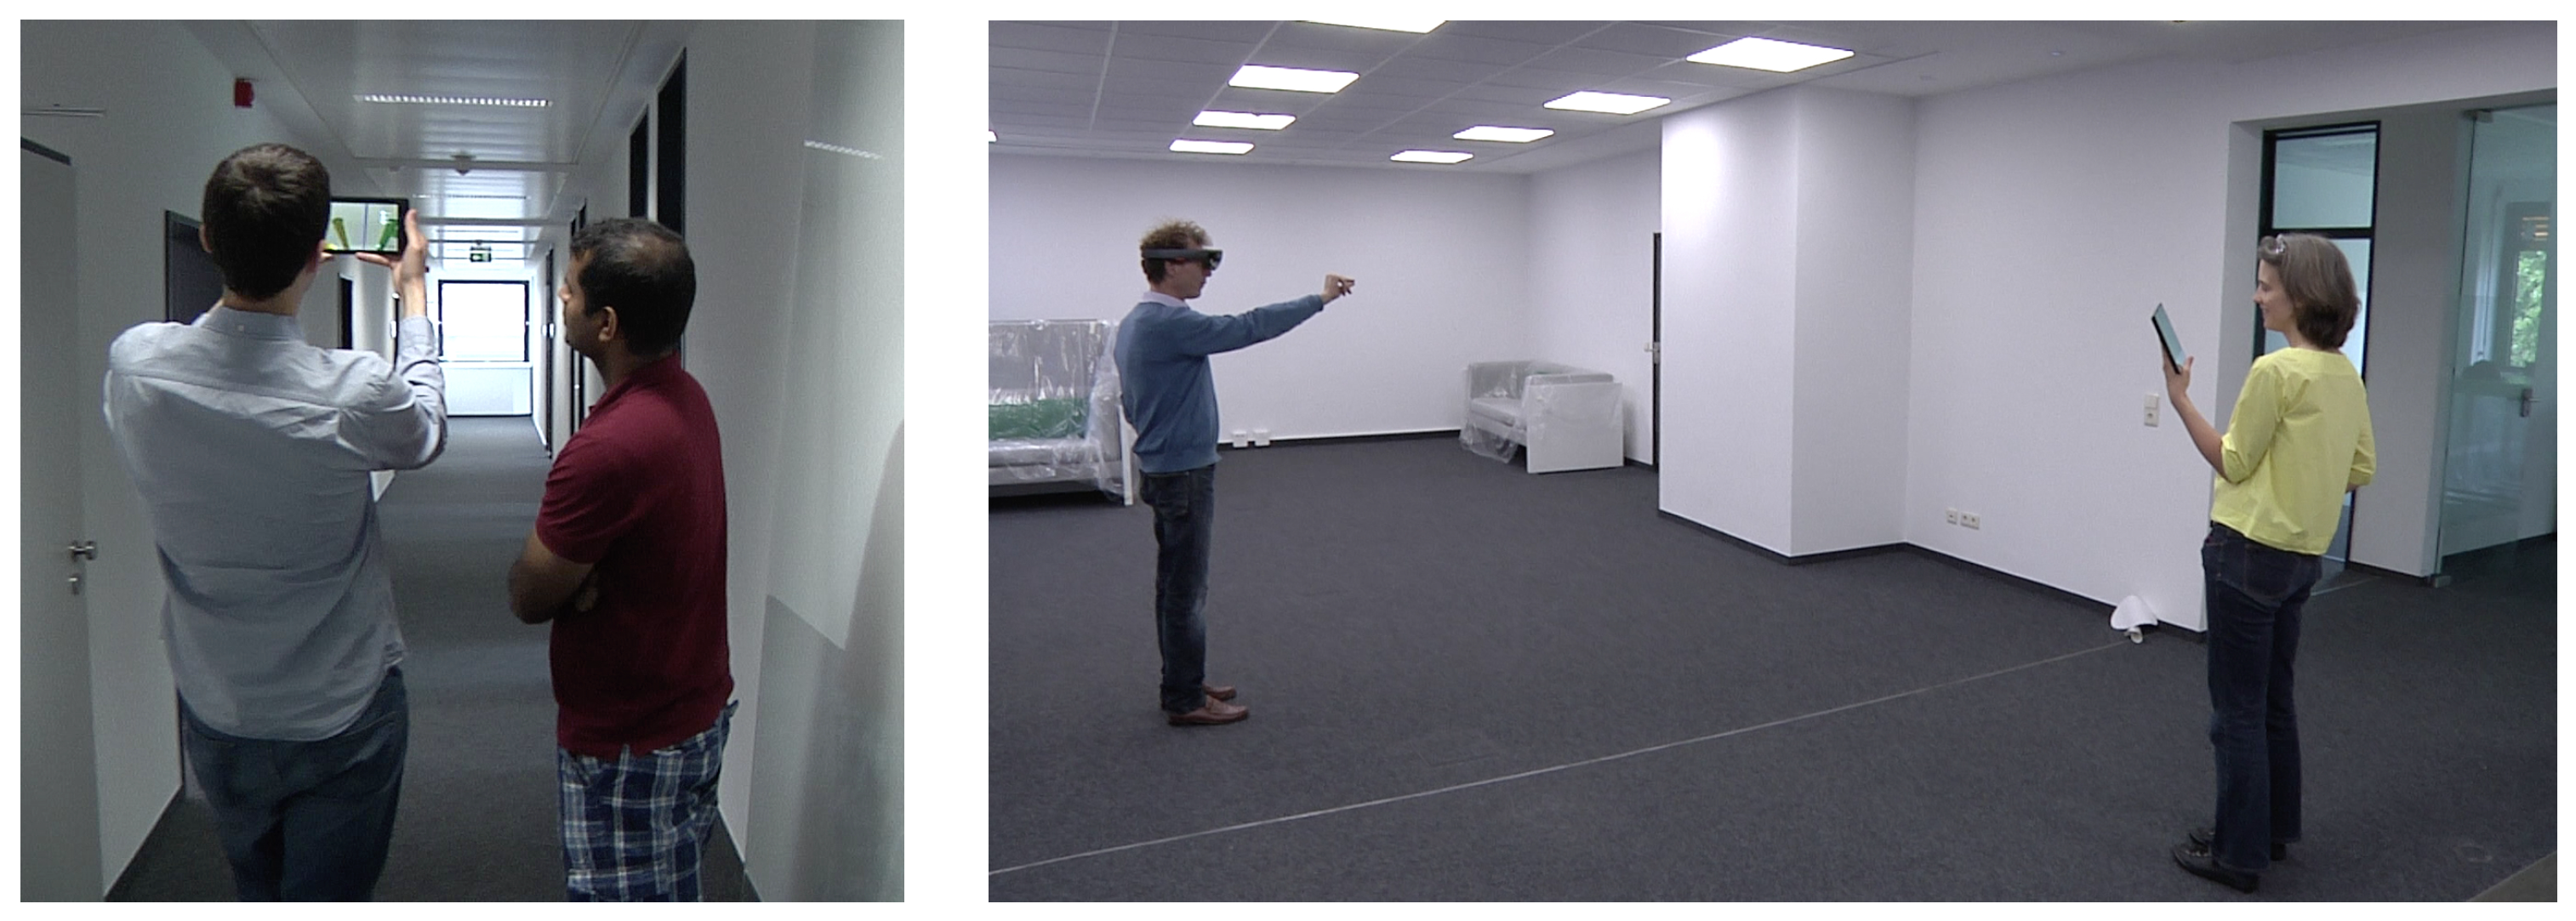
Each group of two participants had to perform four tasks. Two had to be done with one Google Tango tablet (see Figure 3 left), two with one Microsoft HoloLens smartglasses and a Surface tablet (see Figure 3 right). Each user should be carrying the tablet for one Tango task and wear the HoloLens for one HoloLens task. The picture of the HoloLens is streamed over WiFi to a Surface tablet, which can be observed by the second participant to discuss with the participant wearing the smartglasses. Each task was estimated to take approximately 5 min to be accomplished.
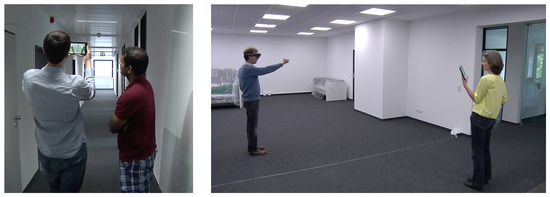
Figure 3.
Two teams discussing with the help of a Tango tablet (left) and with the help of a HoloLens and a Surface tablet (right).
After the reception of each team of two participants and a brief introduction, the first task had to be accomplished: in a sort of a pitch, participant A had to present two different versions of the interior design to participant B. After a short discussion together, A had to sell one version to B. When this task is done, the participants switch and A chooses one place in the ceiling where s/he wants to mount something. B looks through the tablet and gives feedback whether this place is feasible or not. After a short discussion, this task is done and both participants evaluate individually the Tango tasks by answering the first page of the questionnaire.
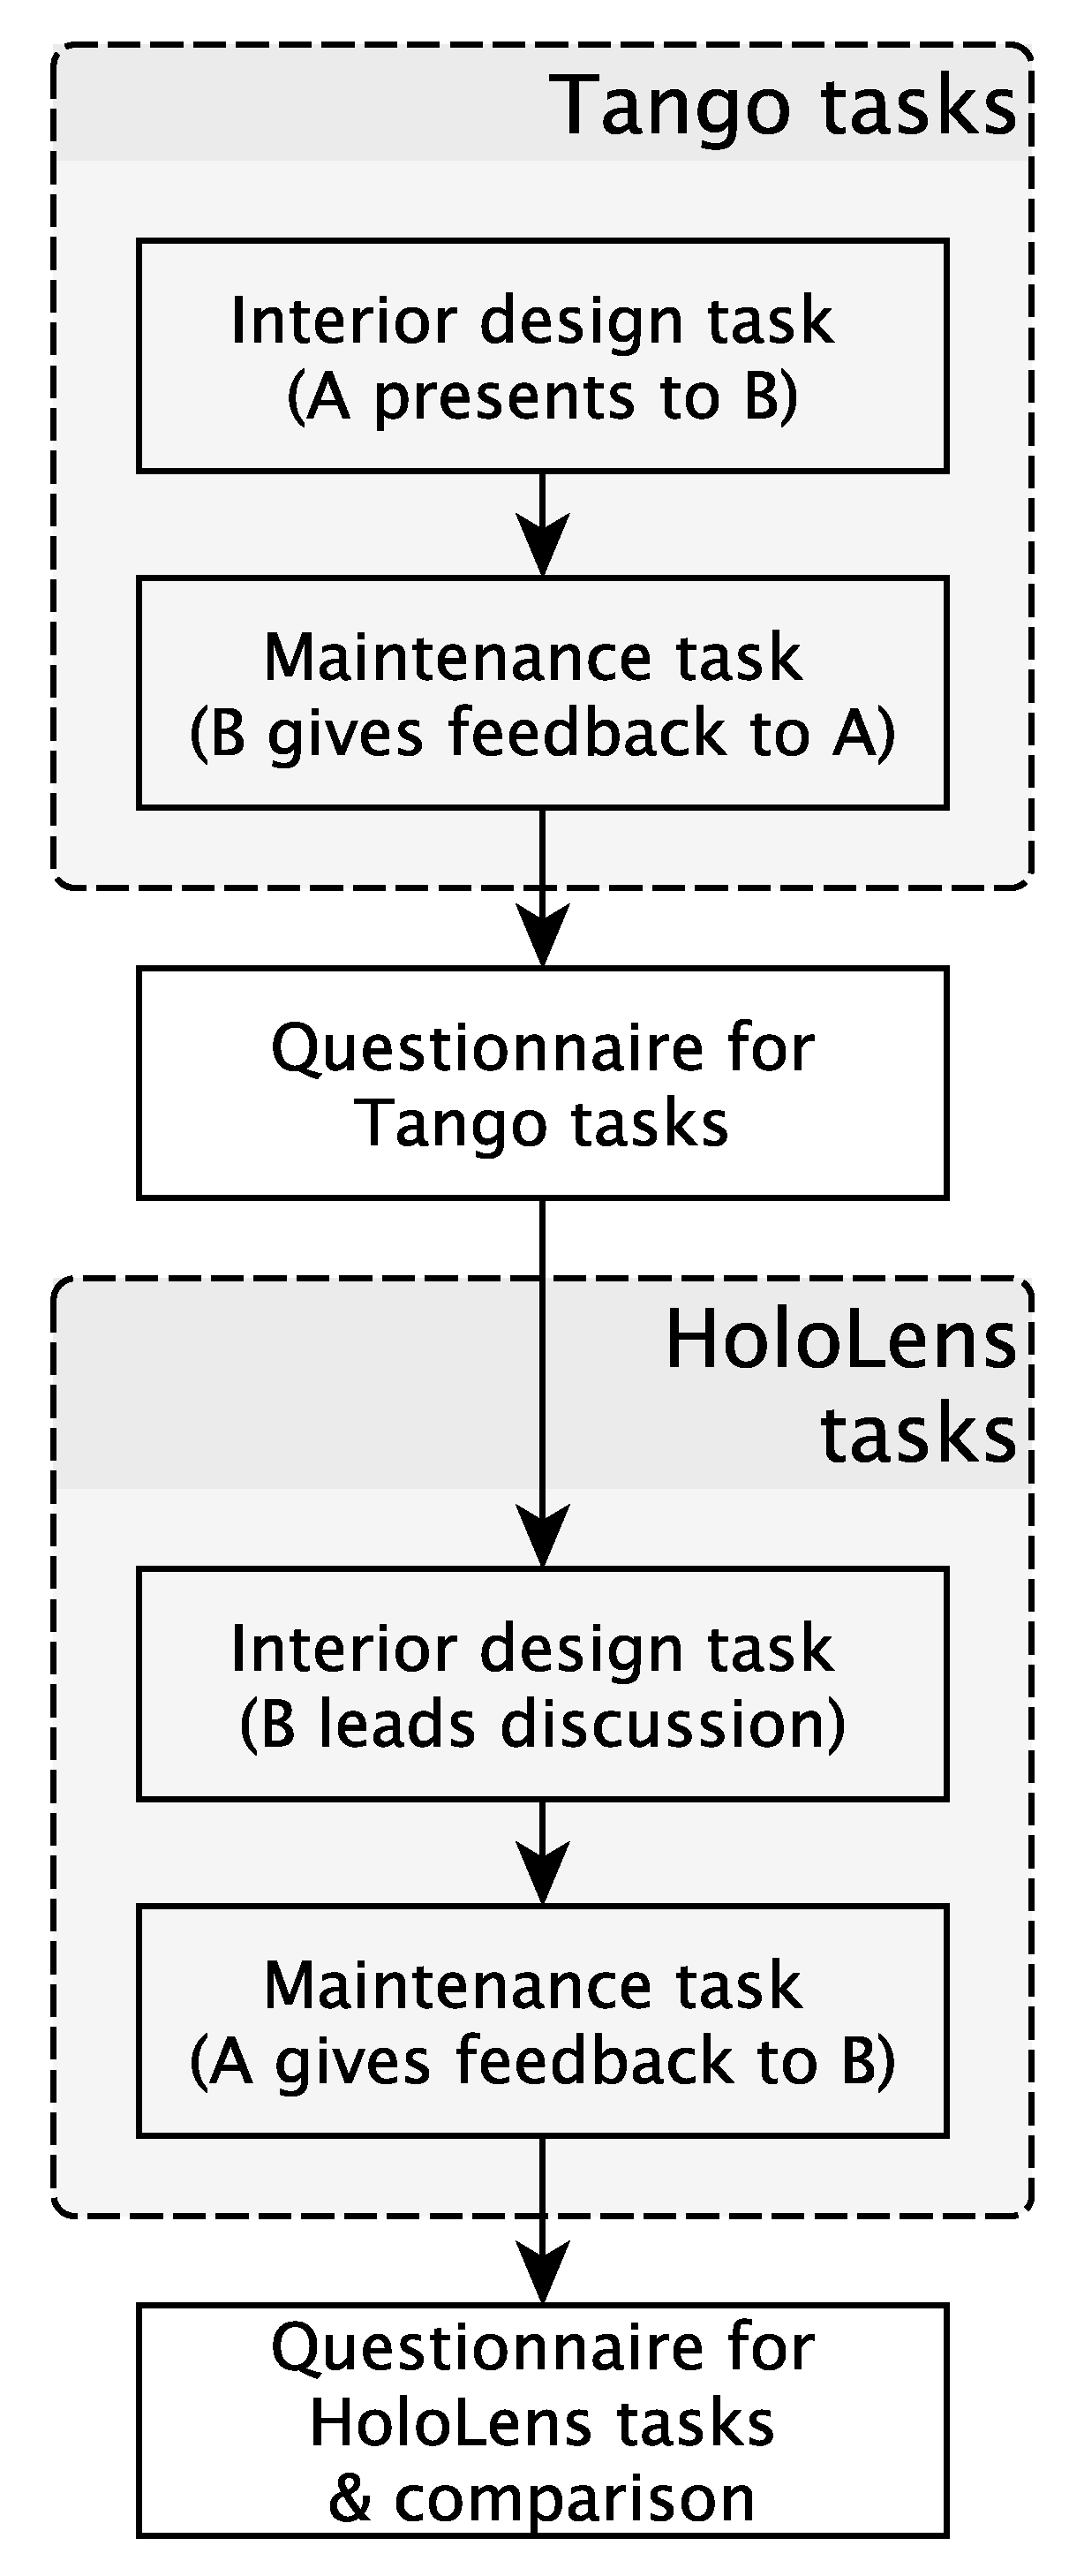
In the second part, participant B starts by wearing the HoloLens and does a sort of an interior design planning check: s/he moves through the room while checking if all sockets are reachable and if the furniture fits the room. Participant A looks at the Surface tablet and discusses with B. The second task is about the maintenance of the building: B wants to mount something big on a wall and asks A (who is wearing the HoloLens), if it is possible with regard to the heat and ventilation pipes behind the wall. Both discuss shortly together to find a solution. Then, they evaluate the HoloLens part and give feedback on the comparison of both devices. At the end, the participants are debriefed shortly. Figure 4 is visualising the main tasks in a flowchart.
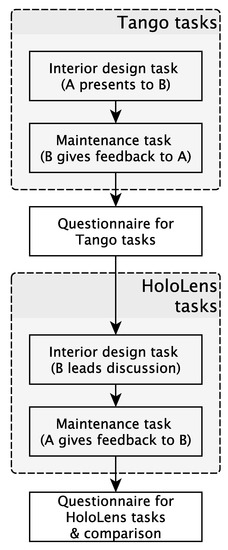
Figure 4.
Flowchart visualising the main tasks of the user study. A and B are the participants.
3.3. Method
The questionnaire was developed with the plan of the evaluation in mind. It was divided into three parts: an evaluation of the Tango application, questions on the HoloLens tasks and a comparison between them. According to the plan, the Tango application was evaluated after the first part of each test run, the HoloLens tasks and the comparison was filled in after the second part. Besides that, notes were taken during the evaluation to collect verbal feedback of the participants.
Both parts of the evaluation contain the same questions, except for one question: in the HoloLens evaluation, the participants were asked to rate the field of view of the smartglasses. Both parts were kept as far as possible identical to have the possibility to compare them. All questions in the Tango and the HoloLens part can be answered on a Likert scale and, at the end of each section, participants were able to note additional feedback. In the comparison section, the participants had to answer some questions on which device they would prefer and why. Therefore, they made a choice and got some space to give reasons for their decision. Then, they were asked to note three words that describe their experience with the devices and to write down what they liked and disliked most at each device. At the end, each participant was asked to state its occupation and to self-assess its technical knowledge, spatial reasoning as well as its experience with AR. As one may see in Table 1, the results of the self-assessment are mixed for the spatial reasoning and for the experience with AR; only with regard to the overall technical knowledge, most participants answered that their knowledge is very good (9) or good (5).

Table 1.
Self-assessment of the participants as captured in the questionnaire. The participants had the possibility to answer from very good (1) to very poor (5).
4. Results
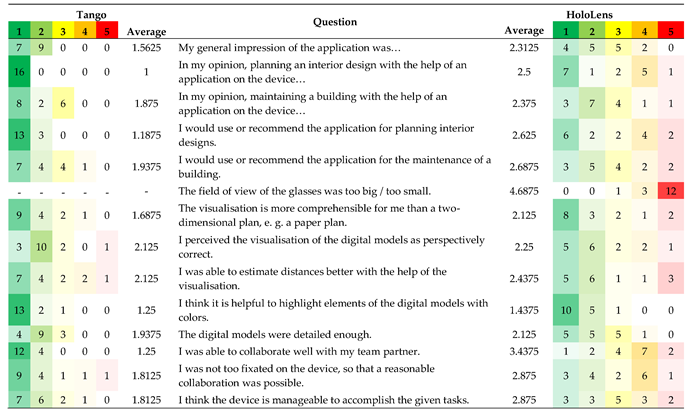
Table 2 presents device and application specific results from the questionnaires. In general, the presented applications (interior planning and maintenance) and their device-suitability were rated as high to very high for the Tango, and above average for the HoloLens (see first row).

Table 2.
Results of the user test (n = 16)—device specific ratings for Tango and HoloLens. Likert scale ranging from 1 (high) to 5 (low).
4.1. Interior Planning
The interior planning task seems to have been especially convincing on the Tango, where it received the highest possible rating (1.0). The same task on the HoloLens received slightly positive results, but six users were not convinced of it, and two were neutral (average 2.5). One participant gave detailed appraisals of the tasks using the HoloLens. He stated that the discussion about the furniture and the overlay of the power outlets were spot-on, much more so than the mounting/maintenance tasks.
Participants stated that the interior design application might not be useful for the entire design process but that especially the Tango was a useful device to see the given options and make decisions. For larger groups, the number of people being able to gather around a tablet would naturally be limited, but this was not stated as a problem.
With regards to the HoloLens, the participants felt that it was limiting in this cooperative use-case since only the wearer could fully enjoy the augmented view. This was for two reasons:
- The usefulness of the wirelessly connected Surface tablet was hampered by the inherent transmission lag between the HoloLens and the Surface, which was about 4 s (for encoding, transmission, decoding, display).This severely hindered collaboration in this co-located setting and was mentioned by several participants.
- The Surface user had no control about his view-point and angle, as it was a mere mirroring of the HoloLens view. It was mentioned that “it would be great if the person with the tablet were not constrained to see what the glasses are pointing at”.
4.2. Maintenance
The maintenance task was also rated rather positive, but a lot lower compared to the previous task at 1.875 on the Tango, whereas it was rated slightly higher at 2.375 (compared to 2.5 previously) on the HoloLens, but still lower than on the Tango in either case. Limiting reasons for both devices given in the open answers included:
- coarser positioning precision (or higher requirements?) in this task
- handicapped depth perception (on Tango) and 3D-effect at the ceiling, therefore it was hard to estimate distances, sizes, and depth ordering
- offsets of the 3D models of about 30 cm are irritating, e.g., virtual shelves that appear to be placed in the wall
- overarm work is considered to be less comfortable, especially when pointing at the ceiling with a tablet device
- the Field of view (FOV) of the HoloLens is much too small/to a lesser extent also the display of the Tango tablet was estimated to be too small
- measurements should rather be made in a 2D plan
- missing caption or further textual information on the 3D models
General reflections and suggestions included:
- laser-pointer (a.k.a. ray-casting) would be handy for working with pipes/hard to reach objects;
- making correspondences between objects, virtual switches (and the missing caption) clearer through consistent use of colours;
- providing more detailed information on demand, e.g., for wiring and ceiling material.
One architect participant mentioned that this kind of application could be very useful for surveying and inventory taking, maybe even more so than for maintenance. For this to work well, the correct positioning and ordering of the virtual wires and pipes need to be clearly visible. The other architect added that BIM-data inherently provides many different levels of detail. For maintenance applications like this, it would therefore be paramount to establish a clear reference between the augmented view and the building technology present in the data.
4.3. Comparing the Devices on Task Level
Table 3 presents inter-device rating results from the questionnaires. In general, the devices and applications were seen as a good fit, given that no participants answered “none of them” in any of the questions.

Table 3.
Comparison between Tango and HoloLens.
It can be said that the Tango tablet is preferred by most of the users in the tested scenarios (12 out of 16, see Table 3). There are multiple reasons given by the participants of the user test why they prefer one device over the other. Some point out that both devices have their own advantages and that they would prefer making their choice depending on the particular situation, e.g., HoloLens was seen as more useful for an individual session and the Tango tablet for co-located screen sharing and presentation.
When it comes to the aspect of collaboration and discussion, the Tango tablet is favoured by 15 out of 16 participants. Face-to-face discussions with a counterpart would preferably be conducted with the Tango (13 Tango:0 HoloLens), with three participants stating a draw between the devices. From the free text answers, the ability to collaborate is rated higher with the Tango tablet than with the HoloLens as well.
The situation is similar for presentation settings, e.g., with customers, where Tango is preferred over HoloLens (14:1:1). (In the following, we use the notation “(<Tango>:<HoloLens>:<both same>)”). That this is not due to the visualisation quality can be seen from the next row, which gives a more evenly distributed results (8:6:2), confirming that the visual quality was liked on the HoloLens. Even though the digital models had to be reduced for the HoloLens glasses due to hardware limitations, they were still rated as detailed enough.
When asking the participants to select their favourite devices for the given tasks, they answered as follows:
- (a)
- Interior planning tasks were favoured on the Tango tablet (10 participants), with five participants preferring HoloLens glasses, and one stating that they were both equally well suited.
- (b)
- Building maintenance tasks were also favoured on the Tango tablet (nine participants), with five participants preferring HoloLens, and three stating that they were both equally well suited.
4.4. Judging the Devices
Based on their experience from using the Tango tablet and HoloLens glass devices with our collaborative use-cases, we asked the participants for their perceived pros and cons for each device.
Particularly convincing qualities of the Tango were stated as: (1) easier to use due to existing tablet know how; (2) more comfortable; (3) less distracting; (4) better field of view; (5) better overview of the room (e.g., just look up); (6) easier to share the view with others (would require at least two devices with HoloLens); (7) easier to coordinate with your partner what you are looking at; (8) shared level of control; (9) being able to point at the screen; (10) easier to interact with the Graphical User Interface (GUI); (11) easier to hand over to a partner.
Negative aspects of the Tango tablet were stated as: (1) display size; (2) fixation on the tablet; (3) tracking stability; (4) less immersive.
Likewise, convincing qualities of the HoloLens that were stated by the participants were: (1) comfortable fit; (2) joy of use; (3) combined real and virtual view, i.e., Augmented Reality; (4) more natural HMD ego-perspective; (5) natural view-point selection; (6) safer physical movement in the room without the need to look up; (7) feeling special and chosen (mostly due to marketing, price, look).
Negative aspects of the HoloLens were stated as: (1) narrow FOV; (2) difficult GUI interaction with gestures and clicking; (3) hard to look up briefly in the room; (4) cannot sense the depth; (5) needs to have more distance from the objects to see them as a whole; (6) heavy; (7) odd colours and flickering; (8) “Cyborg feel”.
Finally, in order to check whether our quantitative results are significant, we conducted a Wilcoxon test [48]. Therefore, the average values of the 13 questions that were equal on Tango and HoloLens (without the question on the field of view of the glasses, c.f. Table 2) were analysed. We get a W-value of 0, a mean difference of −0.84, a Z-value of −3.1798, a mean (W) of 45.5 and a standard deviation (W) of 14.31. With regard to the Z-value, the p-value is 0.00074. When taking the W-value into account, which is preferred for our sample size, the critical value of W for n = 13 at p = 0.01 is 12. Both result-values (for Z and W) show that our results are significant at p = 0.01, i.e., statistically, the Tango fared significantly better than the HoloLens in our study. To increase the significance of these results, one may consider changing the order of the user test, as we always started with the Tango device in the first part of the user study, and then tested the HoloLens in the second part. However, the potential bias induced by this order would have only benefitted the HoloLens. Moreover, the evaluation of both devices took place directly after the corresponding part.
4.5. Wearing Smartglasses with Spectacles
When it comes to smart glasses, one may say that wearers of regular glasses (spectacles) may have more difficulties with them because either they cannot wear their spectacles under the smart glasses, or the smart glasses do not fit that well. In our user study, we were not able to observe such effects. On the other hand, one may also argue that spectacle wearers are more familiar with the handling of glasses, but that can also not be supported by our evaluation (no problems: nine normal vision and six spectacle-wearers; problems: one spectacle-wearer).
5. Discussion
The results show that, for our collaborative tasks in interior planning and building maintenance, the participants clearly favoured the Tango tablet in comparison to the HoloLens smart glasses because of the higher level of collaboration. This is because of the fact that, with the tablet, multiple users may share one screen and discuss together, while the HoloLens was realised as being too isolating, even when linked to a second device (the Surface tablet).
The fact that the stream of the HoloLens was transmitted only with a lag of multiple seconds complicated the communication between both participants. One other disadvantage was the lack of interactivity on the Surface tablet, where participants demanded for more control over the view. This is in-line with previous findings. For example, in the mobile two-player AR-game Time Warp [20], one user had an AR view and the other an overview on a tablet-like Ultra Mobile Personal Computer (UMPC). The interfaces complemented each other and both users’ interactions were required to advance the interaction. On a general level, this kind of system control is a well-known requirement for interaction with virtual and augmented worlds.
To tackle this major disadvantages in the HoloLens perception, one may think of a different scenario, where both users wear a HoloLens each and share a synchronised virtual environment. One may argue that the presented study setup is unfair regarding to the HoloLens in this point; on the other hand, there are not always two devices available in practice. In that case, it would also be possible to share a synchronised virtual environment across different device types or platforms. This is a limitation of our study and would need improvement. However, it also shows a limitation in the current handling of such situations with the solution proposed by Microsoft.
Perceived advantages of the HoloLens were the stability of the tracking and the fact that it is hands free (due to its form factor as a HMD). Nevertheless, many participants pointed out that the interaction with the tablet felt more natural, probably because the handling was described as simpler and easier to understand.
The disadvantage most users pointed out with regard to the HoloLens is the small field of view (10 out of 16).
The fact that the second participant was able to see the video stream of the current HoloLens view did not lead to more communication. The participants criticised the lag between the HoloLens and the tablet as well as the fact that the stream was not interactive, meaning that the second participant had no possibility to look around himself or control anything. One user mentioned that the collaboration might be increased by having a HoloLens for each participant (which might currently be quite costly); two others reflected that having no control on the Surface tablet showing the mirrored screen in our use-case might have been the more limiting factor for collaboration.
Some HoloLens users reported confusion when their collaboration partner walked into their augmented field of view to gain eye contact, which at the same time hampered the AR view of the HoloLens user (basically an occlusion problem). This is by design of such glasses and conflicts with not being able to switch between AR view and eye-level contact at ease. In the terminology of the spatial model [49], the user wants to focus on another user and have the virtual environment out of focus for a while. Head-Mounted Displays do not support this quasi mode-change well, while it is naturally supported by tablets.
With the Tango tablet (like presumably any tablet), it was reportedly easier to gain an overall impression of the augmented room. We suspect that this is mostly due to the wider FOV and the more familiar interaction. Regarding depth perception, some people preferred the HoloLens for its spatial representation in stereo vision, some the (mono) Tango, but we could not notice any notable difference.
On a technical note, our observations showed that both devices, the Google Tango tablet and the Microsoft HoloLens, had difficulties when it comes to the positioning of objects in similar surroundings or surroundings with very similar features.
6. Conclusions and Future Work
In our user study, we compared a Google Tango tablet and Microsoft HoloLens smartglasses. While most users surprisingly preferred the tablet in general, some feedback also stated advantages of the hands-free smartglasses solution. One key advantage of the tablet solution is the fact that both users can share one screen when discussing face to face. In the HoloLens scenario, one user is always isolated (“in his own world”) and especially the lag between HoloLens and Surface tablet was confusing for the participants. Another point is that the tablet seemed to be more intuitional to most participants than the smartglasses, although most of them did not have any problems with regard to wearing smartglasses.
One question that arose from the given tasks is the liability question. Who is responsible if someone decides—based on the visualisation on a tablet or on the smartglasses—to mount a device at a certain position and a pipe or the building takes damage? Is it the planner, the user, the software developer or the manufacturer of the hardware? In general, the liability question can be seen as problematic for every BIM approach. Especially for the given tasks in our user study it would be problematic as the participants had to take decisions based on ventilation pipes, but, e.g., the electrical system was not visualised. We were not discussing it further, as it would go beyond the scope of this article. However, it is important to keep that aspect in mind for further developments.
For the future, it may be interesting to know whether other devices or other device combinations lead to different results. In addition, a comparison to a paper-based solution could be interesting. It may be also interesting to compare different locations and setups. With regard to the HoloLens solution, it will be interesting to know whether two pairs of smartglasses have another impact than our solution with smartglasses and a Surface tablet. In particular, the lag between smartglasses and tablet needs to be tackled in order to enhance the collaboration as well as the communication between the team partners.
Google Tango was deprecated beginning from 1 March 2018, and ARCore superseded it. The main difference between them—the lack of depth camera support—needs to be taken into account for future developments as well as the on the fly positioning of the virtual models. However, many concepts were transferred, so that it should be possible to adopt and enhance the implemented solution and support even more devices on the market. Therefore, we believe that our research contributed to a better understanding of using the AR tablet and glasses based devices for the support of cooperative planning use cases.
Author Contributions
Conceptualization, L.O., W.P. and U.R.; software, U.R.; formal analysis, L.O. and U.R.; investigation, U.R.; writing—original draft preparation, U.R. and L.O.; writing—review and editing, L.O., U.R. and W.P.; visualization, U.R.; supervision, L.O. and W.P.
Funding
This research received no external funding.
Acknowledgments
We would like to thank our colleagues of the Fraunhofer IZB.LD department for providing us with the BIM model of our building, as well as VARIO for providing us with the BIM model of the interior design. Furthermore, we would like to thank Deniz Bicer for her support in the realization of the user study.
Conflicts of Interest
The authors declare no conflict of interest.
Abbreviations
The following abbreviations are used in this manuscript:
| AR | Augmented Reality |
| BIM | Building Information Modeling |
| CAVE | Cave Automatic Virtual Environment |
| FOV | Field of View |
| GPS | Global Positioning System |
| GPU | Graphics Processing Unit |
| GUI | Graphical User Interface |
| HMD | Head Mounted Display |
| PDA | Personal Digital Assistant |
| UMPC | Ultra Mobile Personal Computer |
| VR | Virtual Reality |
References
- Google. Google Tango —Developer Overview. 2017. Available online: https://web.archive.org/web/20170210154646/developers.google.com/tango/developer-overview (accessed on 22 March 2019).
- Microsoft. Microsoft HoloLens | Mixed Reality Technology for Business. 2019. Available online: https://www.microsoft.com/en-us/hololens (accessed on 22 March 2019).
- Long, S.; Aust, D.; Abowd, G.; Atkeson, C. Cyberguide: Prototyping Context-aware Mobile Applications. In Proceedings of the Conference Companion on Human Factors in Computing Systems (CHI ’96), Vancouver, BC, Canada, 13–18 April 1996; ACM: New York, NY, USA, 1996; pp. 293–294. [Google Scholar] [CrossRef]
- Feiner, S.; MacIntyre, B.; Hollerer, T.; Webster, A. A touring machine: Prototyping 3D mobile augmented reality systems for exploring the urban environment. In Proceedings of the Digest of Papers: First International Symposium on Wearable Computers, Cambridge, MA, USA, 13–14 October 1997; pp. 74–81. [Google Scholar] [CrossRef]
- Thomas, B.; Close, B.; Donoghue, J.; Squires, J.; Bondi, P.D.; Piekarski, W. First Person Indoor/Outdoor Augmented Reality Application: ARQuake. Pers. Ubiquitous Comput. 2002, 6, 75–86. [Google Scholar] [CrossRef]
- Brooks, F.P., Jr. Walkthrough—A Dynamic Graphics System for Simulating Virtual Buildings. In Proceedings of the 1986 Workshop on Interactive 3D Graphics (I3D ’86), Chapel Hill, NC, USA, 22–24 October 1986; ACM: New York, NY, USA, 1987; pp. 9–21. [Google Scholar] [CrossRef]
- Frost, P.; Warren, P. Virtual reality used in a collaborative architectural design process. In Proceedings of the 2000 IEEE International Conference on Information Visualization, London, UK, 19–21 July 2000; pp. 568–573. [Google Scholar] [CrossRef]
- Broll, W.; Lindt, I.; Ohlenburg, J.; Wittkämper, M.; Yuan, C.; Novotny, T.; Mottram, C.; Strothmann, A. ARTHUR: A Collaborative Augmented Environment for Architectural Design and Urban Planning. JVRB J. Virtual Real. Broadcast. 2004, 1. [Google Scholar] [CrossRef]
- Lee, G.A.; Dünser, A.; Kim, S.; Billinghurst, M. CityViewAR: A mobile outdoor AR application for city visualization. In Proceedings of the 2012 IEEE International Symposium on Mixed and Augmented Reality—Arts, Media, and Humanities (ISMAR-AMH), Altanta, GA, USA, 5–8 November 2012; pp. 57–64. [Google Scholar] [CrossRef]
- Thomas, B.; Piekarski, W.; Gunther, B. Using Augmented Reality to Visualise Architecture Designs in an Outdoor Environment. In Proceedings of the (DCNet’99) Design Computing on the Net, Sydney, Australia, 30 November–3 December 1999. [Google Scholar]
- Vlahakis, V.; Karigiannis, J.; Tsotros, M.; Gounaris, M.; Almeida, L.; Stricker, D.; Gleue, T.; Christou, I.T.; Carlucci, R.; Ioannidis, N. Archeoguide: First Results of an Augmented Reality, Mobile Computing System in Cultural Heritage Sites. In Proceedings of the 2001 Conference on Virtual Reality, Archeology, and Cultural Heritage (VAST’01), Glyfada, Greece, 28–30 November 2001; ACM: New York, NY, USA; pp. 131–140. [Google Scholar] [CrossRef]
- Wille, M.; Scholl, P.M.; Wischniewski, S.; Laerhoven, K.V. Comparing Google Glass with Tablet-PC as Guidance System for Assembling Tasks. In Proceedings of the 2014 11th International Conference on Wearable and Implantable Body Sensor Networks Workshops, Zurich, Switzerland, 16–19 June 2014; pp. 38–41. [Google Scholar] [CrossRef]
- Funk, M.; Kosch, T.; Schmidt, A. Interactive Worker Assistance: Comparing the Effects of In-situ Projection, Head-mounted Displays, Tablet, and Paper Instructions. In Proceedings of the 2016 ACM International Joint Conference on Pervasive and Ubiquitous Computing (UbiComp’16), Heidelberg, Germany, 12–16 September 2016; ACM: New York, NY, USA, 2016; pp. 934–939. [Google Scholar] [CrossRef]
- Büttner, S.; Funk, M.; Sand, O.; Röcker, C. Using Head-Mounted Displays and In-Situ Projection for Assistive Systems: A Comparison. In Proceedings of the 9th ACM International Conference on PErvasive Technologies Related to Assistive Environments (PETRA’16), Corfu, Island, Greece, 29 June–1 July 2016; ACM: New York, NY, USA, 2016; pp. 44:1–44:8. [Google Scholar] [CrossRef]
- Tang, A.; Owen, C.; Biocca, F.; Mou, W. Comparative Effectiveness of Augmented Reality in Object Assembly. In Proceedings of the SIGCHI Conference on Human Factors in Computing Systems (CHI’03), Ft. Lauderdale, FL, USA, 5–10 April 2003; ACM: New York, NY, USA, 2003; pp. 73–80. [Google Scholar] [CrossRef]
- Blattgerste, J.; Strenge, B.; Renner, P.; Pfeiffer, T.; Essig, K. Comparing Conventional and Augmented Reality Instructions for Manual Assembly Tasks. In Proceedings of the 10th International Conference on PErvasive Technologies Related to Assistive Environments (PETRA’17), Island of Rhodes, Greece, 21–23 June 2017; ACM: New York, NY, USA, 2017; pp. 75–82. [Google Scholar] [CrossRef]
- Johnson, S.; Gibson, M.; Mutlu, B. Handheld or Handsfree?: Remote Collaboration via Lightweight Head-Mounted Displays and Handheld Devices. In Proceedings of the 18th ACM Conference on Computer Supported Cooperative Work & Social Computing (CSCW’15), Vancouver, BC, Canada, 14–18 March 2015; ACM: New York, NY, USA, 2015; pp. 1825–1836. [Google Scholar] [CrossRef]
- Müller, J.; Rädle, R.; Reiterer, H. Virtual Objects As Spatial Cues in Collaborative Mixed Reality Environments: How They Shape Communication Behavior and User Task Load. In Proceedings of the 2016 CHI Conference on Human Factors in Computing Systems (CHI’16), San Jose, CA, USA, 7–12 May 2016; ACM: New York, NY, USA, 2016; pp. 1245–1249. [Google Scholar] [CrossRef]
- von der Pütten, A.M.; Klatt, J.; Ten Broeke, S.; McCall, R.; Krämer, N.C.; Wetzel, R.; Blum, L.; Oppermann, L.; Klatt, J. Subjective and behavioral presence measurement and interactivity in the collaborative augmented reality game TimeWarp. Interact. Comput. 2012, 24, 317–325. [Google Scholar] [CrossRef]
- Blum, L.; Wetzel, R.; McCall, R.; Oppermann, L.; Broll, W. The Final TimeWarp: Using Form and Content to Support Player Experience and Presence when Designing Location-aware Mobile Augmented Reality Games. In Proceedings of the Designing Interactive Systems Conference (DIS’12), Newcastle Upon Tyne, UK, 11–15 June 2012; ACM: New York, NY, USA, 2012; pp. 711–720. [Google Scholar] [CrossRef]
- Chen, L.; Peng, X.; Yao, J.; Qiguan, H.; Chen, C.; Ma, Y. Research on the augmented reality system without identification markers for home exhibition. In Proceedings of the 2016 11th International Conference on Computer Science Education (ICCSE), Nagoya, Japan, 23–25 August 2016; pp. 524–528. [Google Scholar] [CrossRef]
- Hui, J. Approach to the Interior Design Using Augmented Reality Technology. In Proceedings of the 2015 Sixth International Conference on Intelligent Systems Design and Engineering Applications (ISDEA), Guiyang, China, 18–19 August 2015; pp. 163–166. [Google Scholar] [CrossRef]
- Mori, M.; Orlosky, J.; Kiyokawa, K.; Takemura, H. A Transitional AR Furniture Arrangement System with Automatic View Recommendation. In Proceedings of the 2016 IEEE International Symposium on Mixed and Augmented Reality (ISMAR-Adjunct), Merida, Mexico, 19–23 September 2016; pp. 158–159. [Google Scholar] [CrossRef]
- Phan, V.T.; Choo, S.Y. Interior Design in Augmented Reality Environment. Int. J. Comput. Appl. 2010, 5, 16–21. [Google Scholar] [CrossRef]
- IKEA. Place IKEA Furniture in Your Home with Augmented Reality. 26 July 2013. Available online: https://www.youtube.com/watch?v=vDNzTasuYEw (accessed on 22 March 2019).
- Schattel, D.; Tönnis, M.; Klinker, G.; Schubert, G.; Petzold, F. [Demo] On-site augmented collaborative architecture visualization. In Proceedings of the 2014 IEEE International Symposium on Mixed and Augmented Reality (ISMAR), Munich, Germany, 10–12 September 2014; pp. 369–370. [Google Scholar] [CrossRef]
- Lee, J.Y.; Kwon, O.S.; Choi, J.S.; Park, C.S. A Study on Construction Defect Management Using Augmented Reality Technology. In Proceedings of the 2012 International Conference on Information Science and Applications, Suwon, Korea, 23–25 May 2012; pp. 1–6. [Google Scholar] [CrossRef]
- Vassigh, S.; Elias, A.; Ortega, F.R.; Davis, D.; Gallardo, G.; Alhaffar, H.; Borges, L.; Bernal, J.; Rishe, N.D. Integrating Building Information Modeling with Augmented Reality for Interdisciplinary Learning. In Proceedings of the 2016 IEEE International Symposium on Mixed and Augmented Reality (ISMAR-Adjunct), Merida, Mexico, 19–23 September 2016; pp. 260–261. [Google Scholar] [CrossRef]
- Messadi, T.; Newman, W.E.; Braham, A.; Nutter, D. Immersive Learning for Sustainable Building Design and Construction Practices. J. Civ. Eng. Archit. 2017, 11. [Google Scholar] [CrossRef]
- Janusz, J. Toward The New Mixed Reality Environment for Interior Design. IOP Conf. Ser. Mater. Sci. Eng. 2019, 471, 102065. [Google Scholar] [CrossRef]
- van Nederveen, G.A.; Tolman, F.P. Modelling multiple views on buildings. Autom. Constr. 1992, 1, 215–224. [Google Scholar] [CrossRef]
- Autodesk. Autodesk White Paper—Building Information Modeling. 2002. Available online: http://www.laiserin.com/features/bim/autodesk_bim.pdf (accessed on 6 February 2017).
- HM Government. Building Information Modelling. 2012. Available online: https://www.gov.uk/government/uploads/system/uploads/attachment_data/file/34710/12-1327-building-information-modelling.pdf (accessed on 6 February 2017).
- Federal Ministry of Transport and Digital Infrastructure. Road Map for Digital Design and Construction. 2015. Available online: http://www.bmvi.de/SharedDocs/DE/Publikationen/DG/roadmap-stufenplan-in-engl-digitales-bauen.pdf?_blob=publicationFile (accessed on 6 February 2017).
- Sampaio, A.Z. Maintenance Activity of Buildings Supported on VR Technology. In Proceedings of the 2015 Virtual Reality International Conference (VRIC’15), Laval, France, 8–10 April 2015; ACM: New York, NY, USA, 2015; p. 13. [Google Scholar] [CrossRef]
- Ploennigs, J.; Clement, J.; Pietropaoli, B. Demo Abstract: The Immersive Reality of Building Data. In Proceedings of the 2nd ACM International Conference on Embedded Systems for Energy-Efficient Built Environments (BuildSys’15), Seoul, Korea, 4–5 November 2015; ACM: New York, NY, USA, 2015; pp. 99–100. [Google Scholar] [CrossRef]
- Graf, H.; Soubra, S.; Picinbono, G.; Keough, I.; Tessier, A.; Khan, A. Lifecycle Building Card: Toward Paperless and Visual Lifecycle Management Tools. In Proceedings of the 2011 Symposium on Simulation for Architecture and Urban Design (SimAUD’11), Boston, MA, USA, 3–7 April 2011; Society for Computer Simulation International: San Diego, CA, USA, 2011; pp. 5–12. [Google Scholar]
- Hinrichs, E.; Bassanino, M.; Piddington, C.; Gautier, G.; Khosrowshahi, F.; Fernando, T.; Skjaerbaek, J. Mobile maintenance workspaces: Solving unforeseen events on construction sites more efficiently. In Proceedings of the 7th European Conference on Product and Process Modelling (ECPPM’08), Nice, France, 10–12 September 2008; pp. 625–636. [Google Scholar]
- Behmel, A.; Höhl, W.; Kienzl, T. [DEMO] MRI design review system: A mixed reality interactive design review system for architecture, serious games and engineering using game engines, standard software, a tablet computer and natural interfaces. In Proceedings of the 2014 IEEE International Symposium on Mixed and Augmented Reality (ISMAR), Munich, Germany, 10–12 September 2014; pp. 327–328. [Google Scholar] [CrossRef]
- Bille, R.; Smith, S.P.; Maund, K.; Brewer, G. Extending Building Information Models into Game Engines. In Proceedings of the 2014 Conference on Interactive Entertainment (IE2014), Newcastle, NSW, Australia, 2–3 December 2014; ACM: New York, NY, USA, 2014; pp. 22:1–22:8. [Google Scholar] [CrossRef]
- Hilfert, T.; König, M. Low-cost virtual reality environment for engineering and construction. Vis. Eng. 2016, 4, 2. [Google Scholar] [CrossRef]
- Melax, S. A simple, fast, and effective polygon reduction algorithm. Game Dev. 1998, 11, 44–49. [Google Scholar]
- Oppermann, L.; Shekow, M.; Bicer, D. Mobile Cross-media Visualisations Made from Building Information Modelling Data. In Proceedings of the 18th International Conference on Human-Computer Interaction with Mobile Devices and Services Adjunct (MobileHCI ’16), Florence, Italy, 6–9 September 2016; ACM: New York, NY, USA, 2016; pp. 823–830. [Google Scholar] [CrossRef]
- Xu, Y.; Fan, Z.; Hong, G.; Mao, C. Utilising AR HoloLens to Enhance User Experience in House Selling: An Experiment Study. In Proceedings of the 17th International Conference on Computing in Civil and Building Engineering (ICCCBE 2018), Tampere, Finland, 5–7 June 2018. [Google Scholar]
- Chalhoub, J.; Ayer, S.K. Using Mixed Reality for electrical construction design communication. Autom. Constr. 2018, 86, 1–10. [Google Scholar] [CrossRef]
- Pour Rahimian, F.; Chavdarova, V.; Oliver, S.; Chamo, F. OpenBIM-Tango integrated virtual showroom for offsite manufactured production of self-build housing. Autom. Constr. 2019, 102, 1–16. [Google Scholar] [CrossRef]
- Wang, X.; Love, P.E.D.; Kim, M.J.; Park, C.S.; Sing, C.P.; Hou, L. A conceptual framework for integrating building information modeling with augmented reality. Autom. Constr. 2013, 34, 37–44. [Google Scholar] [CrossRef]
- Stangroom, J. Wilcoxon Signed-Rank Test Calculator. 2018. Available online: https://www.socscistatistics.com/tests/signedranks/default2.aspx (accessed on 13 May 2018).
- Benford, S.; Fahlén, L. A Spatial Model of Interaction in Large Virtual Environments. In Proceedings of the Third European Conference on Computer-Supported Cooperative Work (ECSCW ’93), Milan, Italy, 13–17 September 1993; de Michelis, G., Simone, C., Schmidt, K., Eds.; Springer: Dordrecht, The Netherlands, 1993; pp. 109–124. [Google Scholar] [CrossRef]
© 2019 by the authors. Licensee MDPI, Basel, Switzerland. This article is an open access article distributed under the terms and conditions of the Creative Commons Attribution (CC BY) license (http://creativecommons.org/licenses/by/4.0/).

