Abstract
Enabling the effective representation of an object’s position and depth in augmented reality (AR) is crucial not just for realism, but also to enable augmented reality’s wider utilization in real world applications. Domains such as architecture and building design cannot leverage AR’s advantages without the effective representation of position. Prior work has examined how the human visual system perceives and interprets such cues in AR. However, it has focused on application systems that only use a single AR modality, i.e., head-mounted display, tablet/handheld, or projection. However, given the respective limitations of each modality regarding shared experience, stereo display, field of view, etc., prior work has ignored the possible benefits of utilizing multiple AR modalities together. By using multiple AR systems together, we can attempt to address the deficiencies of one modality by leveraging the features of other modalities. This work examines methods for representing position in a multi-modal AR system consisting of a stereo head-mounted display and a ceiling mounted projection system. Given that the AR content is now rendered across two separate AR realities, how does the user know which projected object matches the object shown in their head-mounted display? We explore representations to correlate and fuse objects across modalities. In this paper, we review previous work on position and depth in AR, before then describing multiple representations for head-mounted and projector-based AR that can be paired together across modalities. To the authors’ knowledge, this work represents the first step towards utilizing multiple AR modalities in which the AR content is designed directly to compliment deficiencies in the other modality.
1. Introduction
As augmented reality (AR) becomes more available to end users and industry, the limitations and restrictions of the technology permeate from research questions into real world problems that impact end users. Whilst the mainstream focus has recently has been on handheld AR, and more recently head-mounted-display (HMD) AR, spatial augmented reality (SAR) [1] presents unique attributes compared to the HMDs and handheld AR (e.g., large, shared field-of-view).
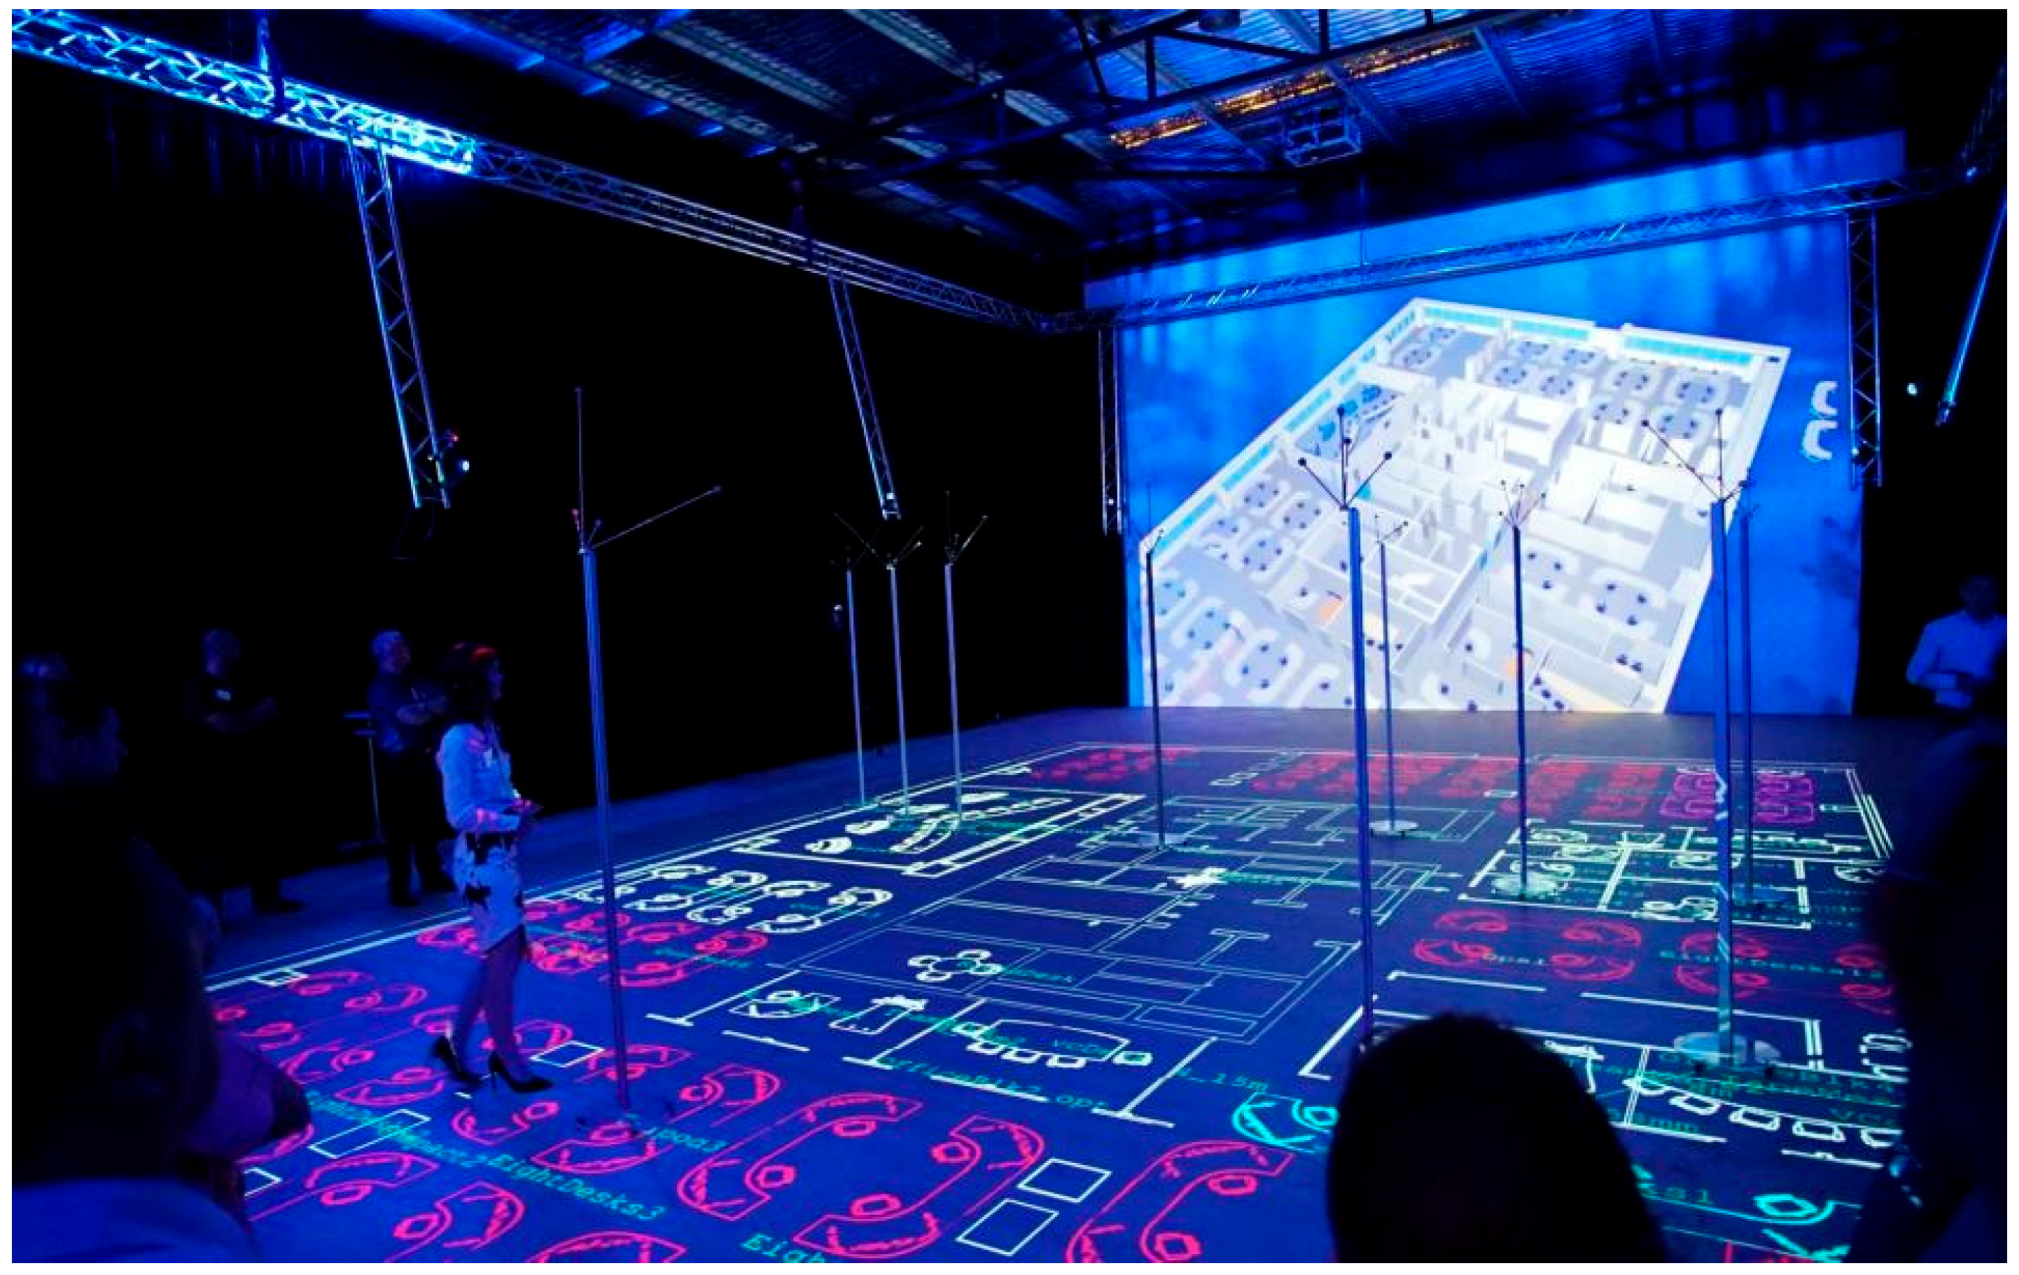
In exploring the applications of modern AR, building, CAD, and engineering projects become ever more complex from an interplay of not just physical materials, but also the incorporation of more services (air conditioning, data cabling, etc.). To assist with this, the industry is now leveraging AR to address these issues [2]. CADwalk [3] is a commercial software platform that utilizes SAR to provide a physically immersive room for viewing and editing life-size building blueprints (Figure 1). Using multiple downward facing, ceiling mounted projectors, life-size blueprints can be visualized and edited on the floor, allowing users to physically walk around a 1:1 scale representation of the building. CADwalk installations have been up to 20 × 30 m in size, with larger installations possible given more projectors and a larger room. However, the increasing size of these SAR environments introduces unique problems in how people interact with the floor-based projections and interpret the plans. Traditional 2D building design only goes so far in addressing the complex 3D issues associated with CAD modelling. Complimenting the projector-based view on the floor, users can wear an HMD to view the CAD design and content, seeing the fully rendered 3D CAD model as it exists “on top of” the ground-projected plane. This means that a desk’s projected outline on the floor becomes a life size desk on top of the floor’s outline when viewed through the HMD. Whilst the floor projections are visible to everyone in the space, and are visible across the entire CADwalk area, the HMD content is only available to those wearing an HMD, and only visible within the field-of-view (FOV) of that device. Given the size and complexities of the building plans, what is shown to the end user in the HMD is a virtual sea of AR content across the space. The limitations of HMDs in terms of FOV and depth/position cues mean that correlating the SAR-outlines on the floor to the HMD rendered content is difficult. The user must now fuse content across three realities: head-worn, projected, and the real world. In addition, interacting with non-HMD wearing users who can only see the projected content creates difficulties when non-HMD users’ gesture towards projected content that is obscured by AR content in the HMD user’s view. This problem of visual clutter, position and depth cues, and fundamentally the correlation and subsequent fusion of content across modalities is unique given the multiple modalities of augmented reality being used.

Figure 1.
CADwalk installation showing projected building blueprints and rendered view on rear wall (head-mounted-display (HMD) view not shown).
Human vision utilizes multiple different cues when determining the position, depth, size, and the occlusion of objects [4]. These cues having been explored extensively in previous work [5,6,7,8]. However, such work has focused primarily on how they work for singular AR modalities (primarily HMDs). Whilst this problem was raised earlier in this section in the context of a product that assists with building and CAD design, from a more fundamental perspective, what happens when we have two different AR modalities working in concert? Can the deficiencies of one modality be ameliorated using cues from the other modality? Whilst previous work exists regarding spatial cues for both HMDs and SAR in isolation, how can complimentary visual indicators be developed and used that incorporate the best aspects of both systems? We refer to visual indicators as the rendering techniques used in AR. This is different to the position and depth cues that refer to the features used by the human vision system to identify position and depth.
Inspired by CADwalk’s problem of fusing content that exists in different AR modalities, this work seeks to answer the question of what visual indicators could be used in HMD and SAR to assist users in correlating that content across these two AR modalities. In addition, we seek to not just address the problems with correlation, but also to examine how the strengths of one AR modality can address the deficiencies of another, creating complimentary AR systems. Furthermore, we seek to generate interest and discussion around the use and development of multi-modal AR platforms as a way to address the technology-based limitations of AR. The contributions of this work are as follows:
- The exploration of a complimentary set of SAR and HMD visual indicators to enhance the correlation and fusion of content across the two AR modalities, serving as an initial step and exemplar for exploring multi-modality AR.
- The identification of pairs of associated AR content filters for HMDs designed to enable interaction with SAR.
- A set of exemplar demonstrations and discussion of the combined described techniques and filters.
The remainder of this work examines prior research relating to AR cues and human perception, before then describing a number of techniques individually. We then discuss example pairings of these, along with how additional depth and position indicators can be combined with the complimentary ones identified. We then discuss future work and final thoughts.
2. Background
Whilst recent software and hardware advances have reduced the barrier for producing engaging AR content, it still primarily misses the mark when ensuring that content is realistic. This is not just from the perspective of surface appearance, but in shadows and masking from real world objects. As a result, AR systems need to ensure all cues interpreted by the human eye are faithfully recreated, especially where used to identify position. These can be broken down into close personal space and further distances, each using spatial cues differently [5]. Whilst polygon and shader effects are continually increasing in quality, it is the subtle visual indicators (those not consciously noticed by users but utilized by the human visual system) that impact the effectiveness of the AR content. When making decisions based on such content, as in the building industry, this is especially important when decisions regarding item locations and collisions are made. Given AR presents significant advantages for the industry [9], these problems must be first addressed. Furthermore, due to the importance of these indicators to user perception, redundant indicators should be used to guard against the failure of an individual indicator, and correct overall understanding and judgement [4].
2.1. General Positioning, Depth and Sizing Cues
Fundamentally the problem examined in this work relates to position and occlusion cues in AR and sharing those cues across projected and HMD-based modalities. Whilst the novelty of this work is the mix of AR modalities, extensive work exists in both how the human visual system interprets various cues, and accordingly what cues can be effective in AR. An in-depth review of X-ray and associated depth and position cues was performed by Livingston et al. [8], examining not just how the human perceptive system interprets visual cues, but also what visual indicators could be used to leverage those systems.
Other works have specifically explored positioning content using X-ray techniques where the AR content is obscured, either by digital or real-world objects [10]. In this case, it is important that information is extracted for occlusion management from camera images. Zollmann et al. [11] grouped pixels into regions, adjusting display parameters for each region when showing X-ray visualizations that leverage the existing environment’s structures, or generate artificial ones. Fumanski et al. [7] also examined X-ray techniques, suggesting a number of experimental questions examining the cognitive component of X-ray visualization. They also presented general guidelines for developing these kinds of systems, and presented the results of a user study demonstrating that without the incorporation of occlusion and motion indicators presented together, users perceive the inserted augmentations to be in front of the real-world objects, regardless of the augmentation’s actual position.
Acknowledging that most prior work is focused on positioning opaque objects rather than semi-transparent ones, Marreiro and Smedb [12] examined the positioning of a semi-transparent object within a larger semi-transparent object when using a stereo display, for example, showing the location of a tumor within a semi-transparent 3D model of the patient’s brain. Given the virtual content is not shown relative to any real-world object, the only cues and indicators available are those created by the application. Even showing an object at 50% transparency is difficult when that object is located within another semi-transparent object. The authors examined multiple different blending techniques to assist with depth perception. Even for opaque objects, relative size perception can be an issue. Thomas [13] explored the size perception of objects relative to other objects of a different color, and identified the thresholds associated with users detecting differences in size between objects.
Although seeming to be unrelated, previous work in AR label placement has required examining correlations in AR (between object and label) in addition to clutter management, a common problem in using AR for building design. Azuma and Furmanski [14] presented one of the first AR label placement studies comparing different algorithms. They found that users were able to read labels fastest for algorithms that focused on preventing overlap, the key attribute for response time. Peterson et al. [15] looked at label segregation in stereo vision at far distances (100–120 m) using an optical see-through display. They presented a method for segregation that reduces the cost imposed by traditional label placement methods. Subsequent work by Peterson et al. [16] compared movement of labels in the 2D view plane with that in stereoscopic depth positioning. Findings showed that whilst spatial placement of labels affected legibility, the improved spatial correlation compensated for this, showing the impact of spatial cues on overall understanding. More recently, in examining the use of labels in the user’s periphery, Kruijff et al. [17] found limited FOV of the label display severely limits search performance. This can be addressed by appropriate label rendering methods, however, rendering must still take place within the limited FOV of the display. As such, the complimentary affordances of SAR become apparent given the wider FOV of projection, as we explore in this work.
2.2. Non-Planar Cues
Because cues must also support off-surface positioning, it is important to remember that the positioning of AR content is not limited to the Cartesian plane, which was the focus of the above work (label position aside). Examining remote collaboration, Adcock et al. [18] examined view-dependent rendering techniques for showing surface cut-outs and arrows to assist with vertical positioning. These were then combined with artificial shadows that utilize the user’s position. The use of shadows and shading models was also examined more recently by Ping et al. [19].
Uratani et al. [6] examined depth visualization techniques for virtual annotations, addressing the ambiguity created when viewing digital content. They introduce a number of different solutions, including depth cues for monocular displays, given that previous monocular cues (such as transparency) cannot fully leverage the visual disparity present with stereovision. When examining positional and depth indicators, it is important to remember that hardware limitations can limit the options available, with stereo versus monocular displays being an example of this. Whilst HMDs allow for stereo vision, the technology used for HMDs has a further impact on the visual indicators and how they can be implemented. Hill et al. examined head-tracked motion parallax in video-see-through displays [20]. Similarly, the binocular disparity of the user wearing the HMD may impact their perception of the cues. This was identified by Pucihar et al., who performed a study comparing a mobile-phone based magic lens versus a transparent glass replica, showing that the binocular disparity can significantly impact user’s depth perception [21], thus affecting the user’s ability to position AR content in the real world. Video-see-through displays isolate the user from all physical real-world cues that see-though displays allow (such as natural motion parallax), meaning for video-see-through devices, the user exists purely within a virtual world that simulates reality, including all cues.
2.3. Projection
Whilst the majority of previous work has focused on HMDs and traditional displays, it is not limited to this. Projection-based AR, i.e., SAR, has been shown to increase performance [22] whilst reducing cognitive load [23] for certain tasks when compared to traditional displays, or other restricted FOV displays. However, when looking at projected indicators using SAR, different limitations are introduced compared to HMDs: we can now no longer utilize indicators that are not shown on a physical surface, as we cannot project in mid-air. Additionally, SAR is a collaborative medium, meaning, generally, that what is projected to one user is visible to others.
As highlighted previously, one of the traditional limitations of SAR is the monoscopic nature of most projectors. Whilst stereo projectors exist, they limit the shared experience offered by SAR. However, whilst primarily static and rendered from the perspective of the projector, view-dependent rendering of SAR is possible, including for different users [18,24,25,26]. Kulik et al. [25] presented a projector-based system including up to six unique stereo views (twelve unique, perspective-correct images) viewed through shutter glasses. Such view-dependent rendering can be modified with additional realism using ray tracing [27] to ensure realistic rendering of digital objects and indicators. However, if shutter glasses are used, this can potentially impact on the use of other cues, such as subliminal cueing [28] that uses single frame(s) to “plant” an alternative image not consciously registered by the user, but capable of influencing their future actions; for example, hinting which area of a console the user will need to interact with next. Similarly, in examining the cue problem in SAR, Broecker et al. [29] looked at assisting depth indicators using ray tracing to more faithfully create the visual projections. More recently, position indicators for remote collaboration between virtual reality and SAR were explored [30], identifying a number of effective visual indicators for hinting at the position of non-physically present collaborators, in addition to examining cues for shared interaction space [26].
Whilst the cues and visual indicators identified in prior work represent significant steps towards addressing the position ambiguity created in AR, there remains opportunity for exploring how these cues and visualizations work across different modalities, and how they can support deficiencies in other modalities. This work seeks to address this gap, exploring how HMD- and SAR-based indicators can work in unison to assist the user in fusing augmented content across the real, head-worn, and projected realities.
3. Correlation Indicators
Whilst previous work in the field has examined both depth and position cues in head-worn displays, and to an extent with SAR, there has not been any work examining a hybrid system utilizing indicators from both modalities. This is surprising, given the complimentary nature of these modalities. To design effective visual indicators across both HMDs and SAR, we must identify the interplay between them, and how we can leverage the unique advantages of each, shown in Table 1.

Table 1.
Pros and cons of HMDs versus spatial augmented reality (SAR).
In addition to these characteristics, any HMD content is viewed “on top of” the SAR content, presenting a limitation if we want/need to show SAR content in front of the HMD’s rendering. For the purposes of the above table and our work, we focus on see-through HMDs to enable all real-world cues to be visible to the user, rather than video-see-through HMDs.
One of the primary issues with the HMD AR content within our context/domain of building design is the sheer volume of AR content. Whilst we can show the full 3D rendered view of the blueprint (Figure 2), it obscures the user’s view of any non-AR content in the HMD’s FOV (i.e., the SAR floor projections). When exploring the HMD content, it becomes harder to discern what models in the HMD align with the projected outlines on the floor. As such, we must identify how can we support the user in correlating content across the two AR modalities: which projected outline matches to which 3D rendered object? This is compounded as HMD rendered objects will obscure other rendered objects.
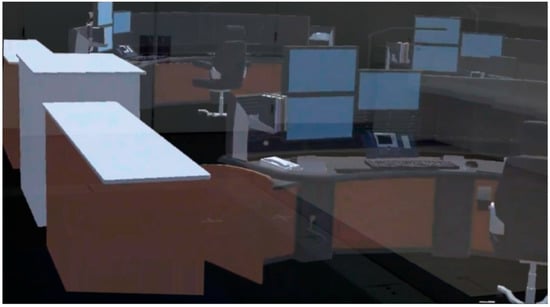
Figure 2.
Three desks and three furniture cabinets shown in AR on a Microsoft Hololens 1. Even a small number of objects in the HMD field-of-view (FOV) quickly obfuscates the real world, even when the room behind is empty.
The remainder of this section describes a number of different visual indicators for both SAR and HMD. These were developed in C# using Unity 2019.2, with a Microsoft Hololens 1 for the HMD and an NEC NP5101 for the projector.
3.1. Design Space
In selecting visual indicators for each modality, we can look at each indicator/rendering technique in terms of two key attributes:
- Space: Whether the visual indicator is local to the object or extends globally into the scene. Until such time as we have HMDs with a natural FOV, we need to utilize the global rendering space offered by SAR. This can of course be paired with the limited FOV of the HMD for the details, such as showing the real-world geometry of the object and localized annotations.
- Rendering: Whether the visual technique uses line-based rendering or solid geometry (opaque or transparent). Each of the two AR modalities should use a different rendering, allowing a line-based HMD cue to reveal the solid geometry projected in the scene, or a solid geometry in the HMD but a simplified projection behind the HMD for simplicity.
A third attribute could potentially be listed as animation. Whilst this work does utilize a single animated cue, we focused primarily on static indicators to support their use in multi-use, dynamic environments. Future work may seek to explore animated indicators in more detail.
We previously highlighted that visual indicators in SAR allow others in the scene to also utilize those representations. Whilst HMD content is only visible for the wearer, SAR content is visible to all users in same space, meaning any visual indicators should be friendly for multiple users. For example, view-dependent rendering of content that is warped and unusable for other users in the scene is not multi-user friendly. Visual indicators for SAR should be shared-space friendly where at all possible. Whilst they will undoubtedly serve greater purpose for the individual they are rendered for, they should still be usable by others, e.g., for indicating which objects the HMD user is currently focusing on.
3.2. SAR Indicators
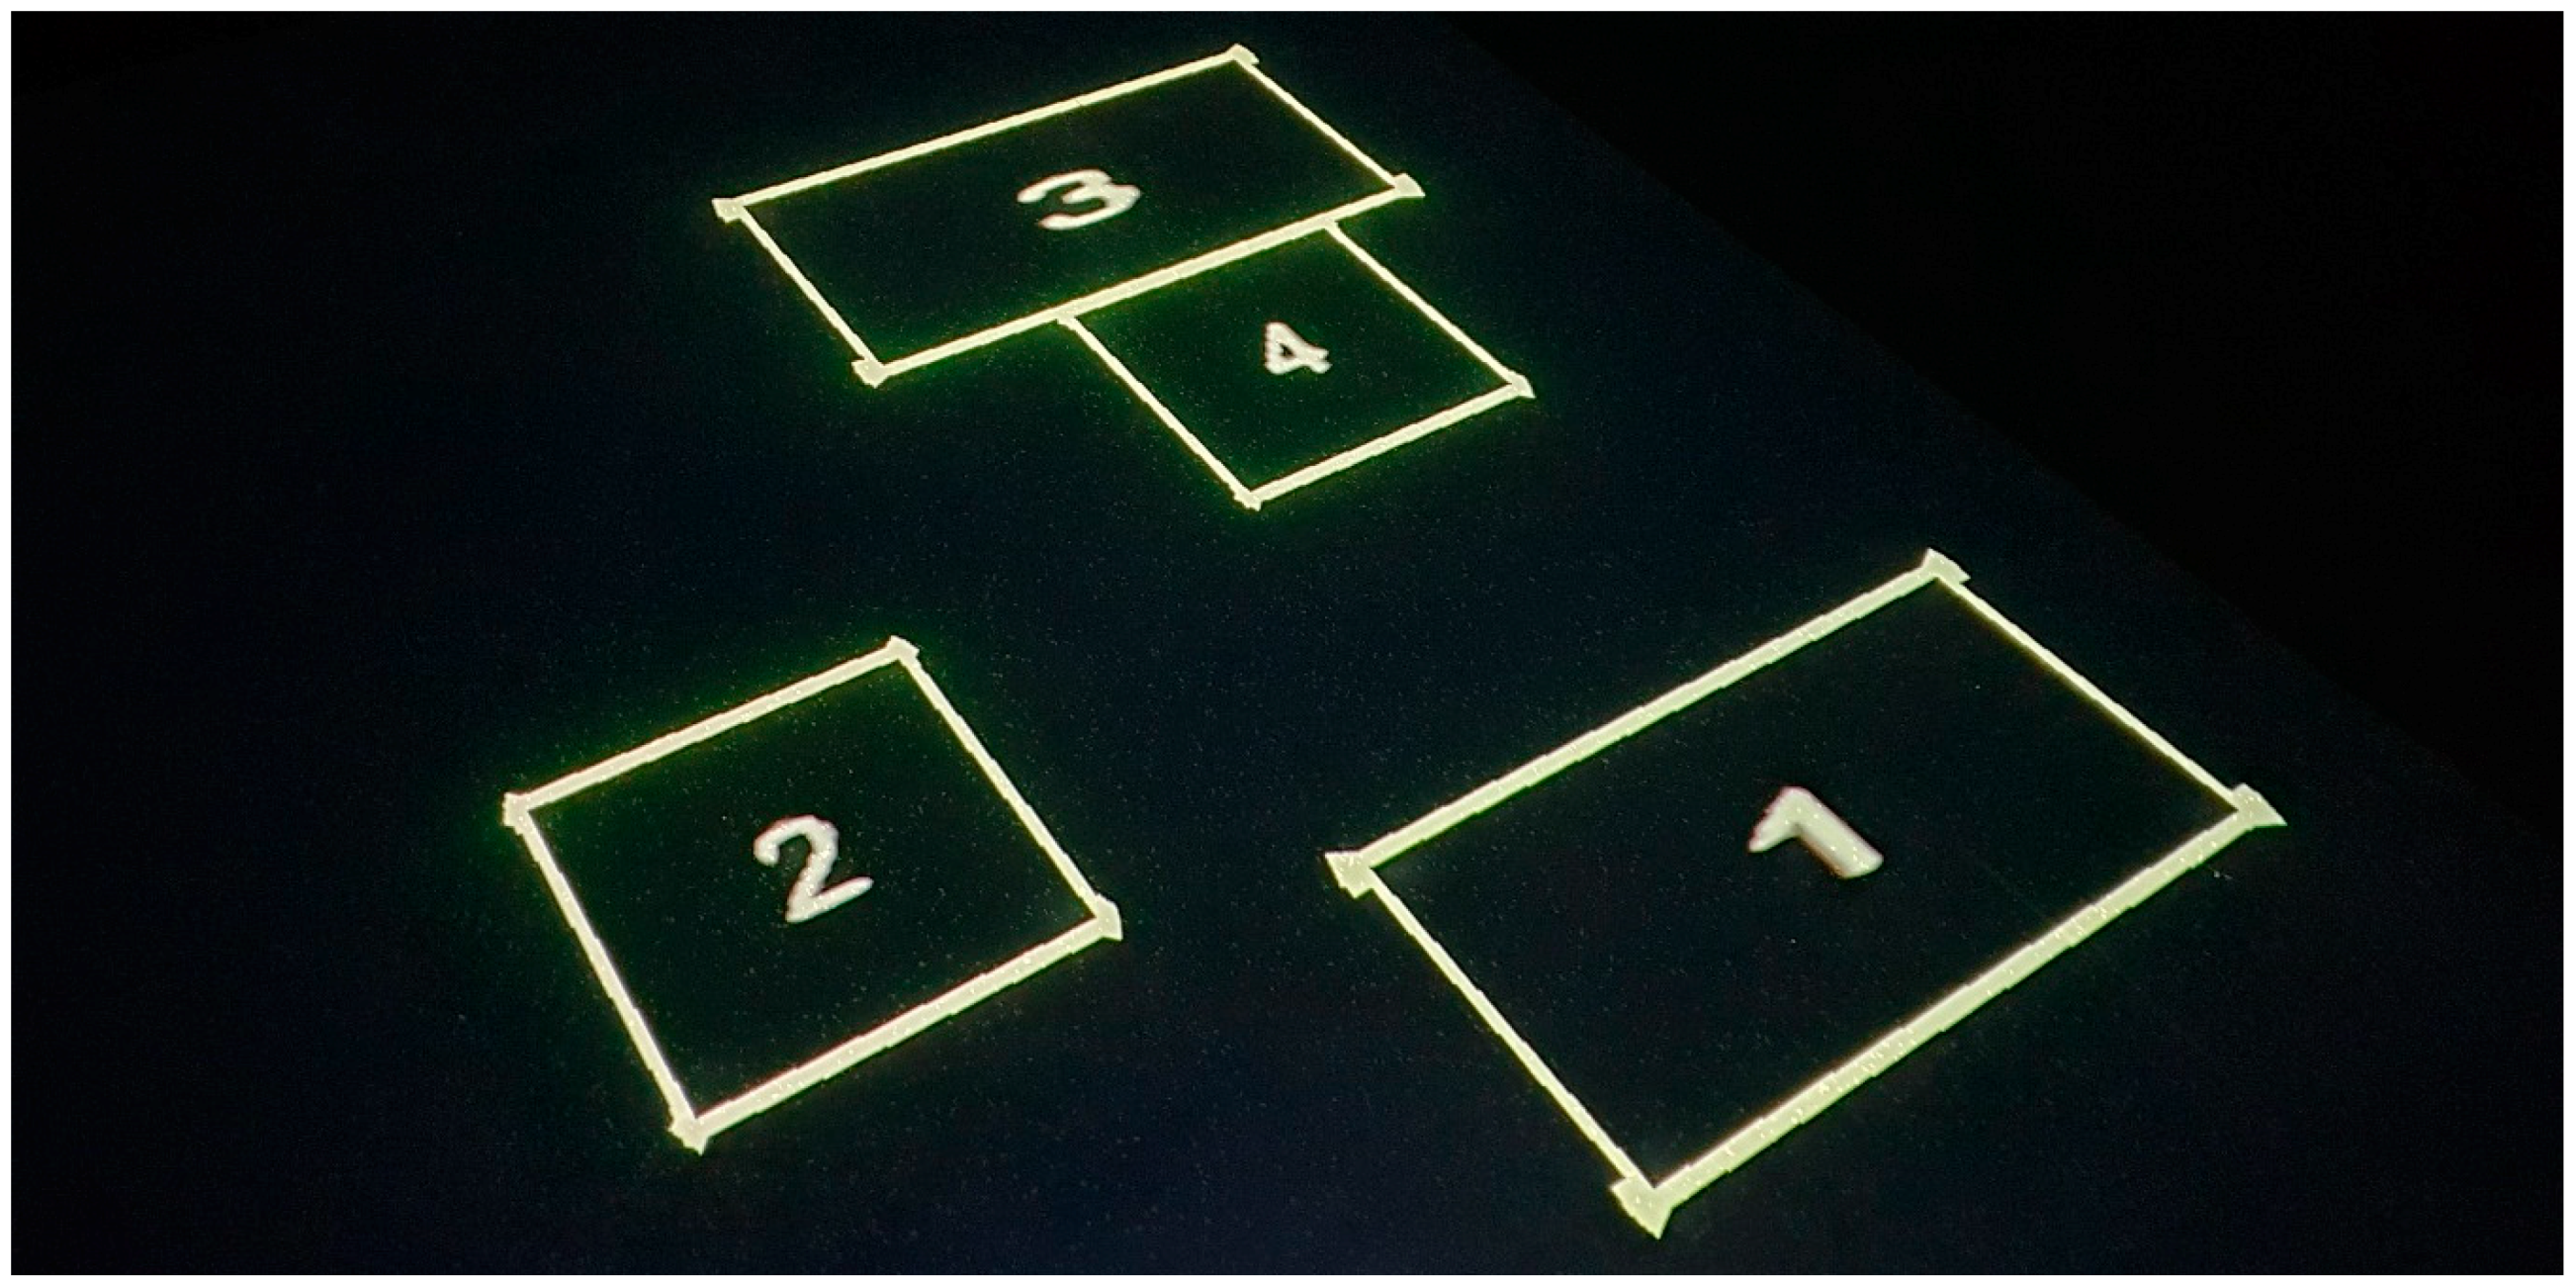
When exploring position indicators for SAR, we focused on indicators usable in a shared environment using a standard monoscopic projector. Whilst this limited the application of certain indicators that utilize stereo vision, we focused on the primitive base case for SAR, rather than looking at more advanced installations. This means that the identified indicators can scale to as larger space as needed using multiple projectors, whilst ensuring the space remains visually accessible for other users in the space (e.g., no requirement for shutter glasses to utilize SAR). Four different SAR indicators were identified and developed for use. These indicators were selected to ensure the indicator leveraged the best attributes of SAR, given the characteristics identified in Table 1. The default projected view of the digital content consists of just outlines, as shown in Figure 3, showing a top-down view of four rectangular prisms, which could represent tables, or other furniture (for example). For the purposes of the figures in this work, we show the objects as numbered and utilize simple rectangular prisms as placeholders for real world content and models, and use the same simple prism-based scene for all techniques demonstrated.
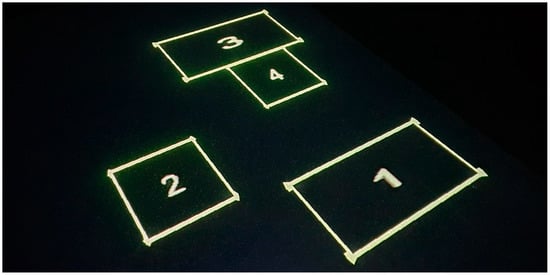
Figure 3.
The outlines of four rectangular prisms, as shown top-down from the projector. This layout/scene is used for subsequent figures.
3.2.1. Grid
Following Livingston et al. [8], grid lines were developed to focus on any object in the scene. Four Cartesian-grid aligned lines appear, encasing the object from the front, back, left, and right sides. When the user looks at an object in the HMD, the grid lines appear immediately around that object (Figure 4). Lines are only visible for one object at a time. The choice of using four lines, one for each side, rather than just two (one for each axis) to indicate the center of the object was done to communicate both the size and position of the object in the scene.
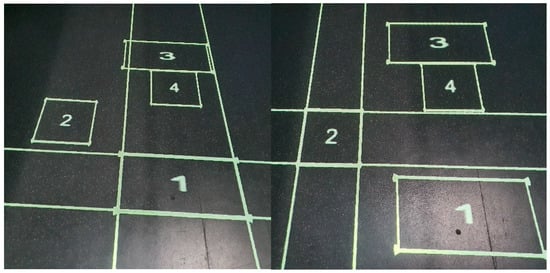
Figure 4.
Selected objects using the grid indicator, object 1 (left) and then object 2 (right). The reflection is from a skylight and is not part of the indicator.
The key advantage of the grid lines is they extend to the edges of the projection area, spanning the full width of the projected display. This means that wherever the user is located, the lines extend beyond the limited FOV of the user’s HMD, allowing the user to view the projected lines at all times. In matching the grid indicator against the two attributes of the design space identified earlier in this section, the grid indicator is global in physical space, and line-rendered in appearance.
3.2.2. Tram Lines
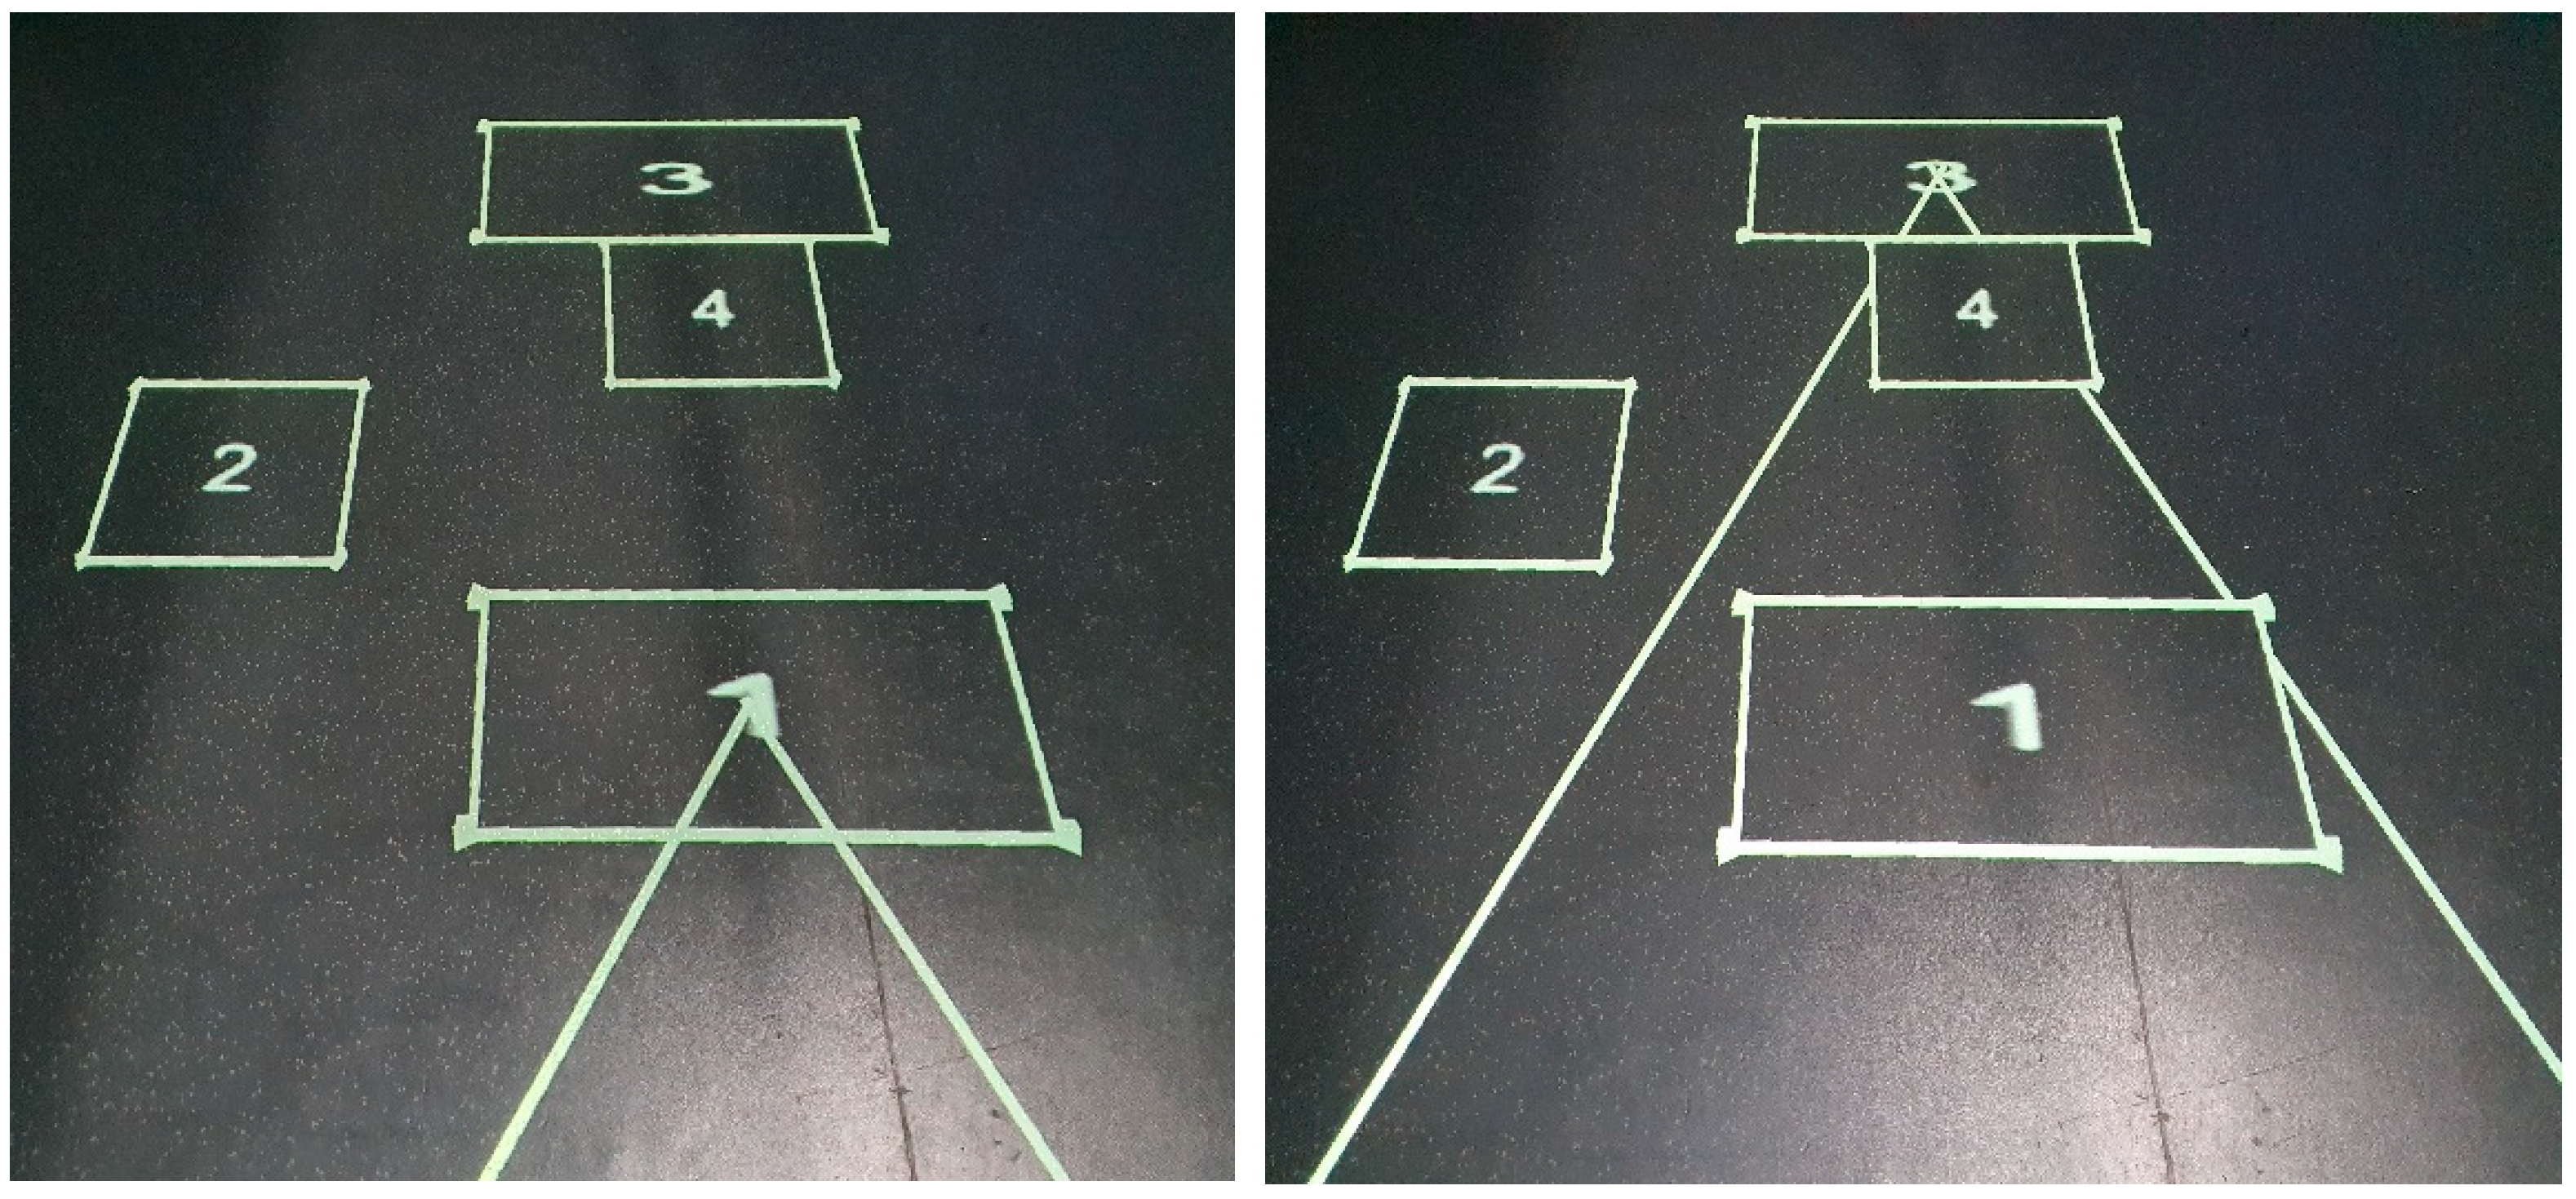
Tram lines [8], were added as two lines, 1 m apart, appearing either side of the user in the scene, with the lines angled towards the geometric center of the object of focus in the HMD. The result is two lines, converging on the object’s location in the scene (Figure 5). Objects further away result in tram lines whose lines are angled further into the distance. The question arose regarding whether the tram lines should stop at the edge of the outline, or penetrate and converge on the geometric center. Given the size of some of the objects shown on the floor, the decision was made to ensure the tramlines fully converged in the middle of the object, rather than stopping at the edge. This was done to ensure the user would be able fully utilize the indicator, rather than the indicator stopping potentially meters from the geometric center for large objects.
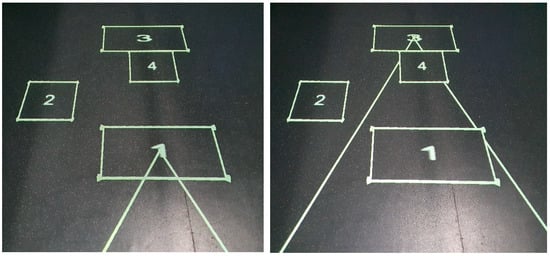
Figure 5.
Two tramlines converging on the middle of an outline on which the user is focused in the HMD. Showing object 1 selected (left) and then object 2 selected (right). Lines begin either side of the current user. The reflection is from a skylight and is not part of the indicator.
Whilst only indicating position (and not size as in the case of the grid lines), the tram lines ensure persistent visibility to the user given their placement at the user’s feet, rather than being aligned to the Cartesian axes of the projected area as in the case of the grid lines. In matching the tram lines against the two attributes of the design space identified earlier in this section, the technique is global in physical space, and line-rendered in appearance.
3.2.3. Filled Outline
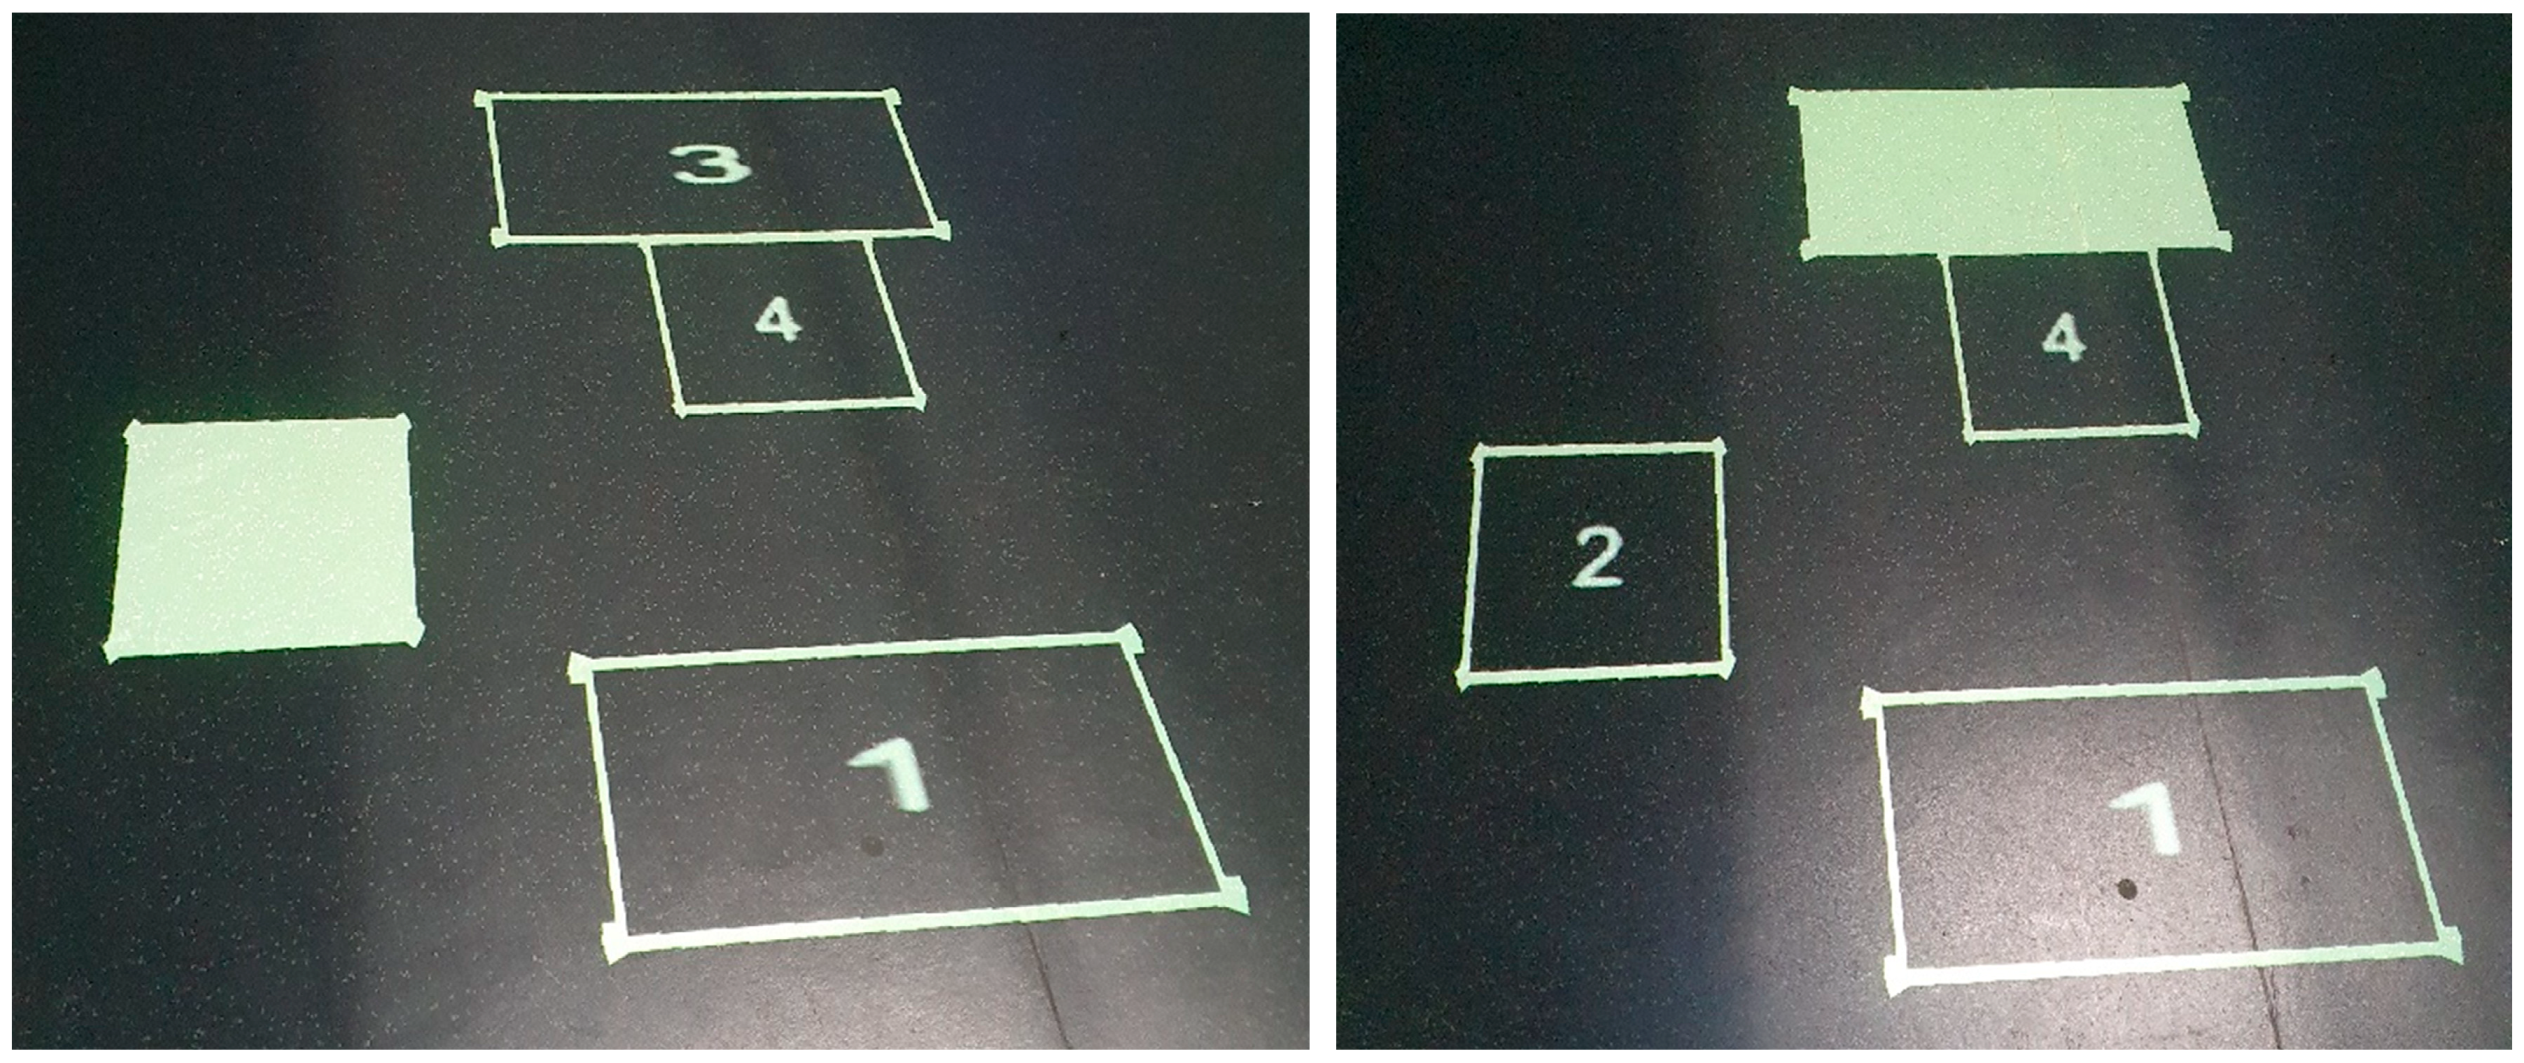
Rather than presenting indicators utilizing the full display area of SAR, the filled outline offers a simplistic approach to just highlight the object of interest by “filling in” the object’s projected outline as a solid color (Figure 6). Whilst this may initially sound counter-intuitive given the visual noise in the HMD view, the limited FOV of the HMD means the user is often able to view the filled outlines below the bottom edge of the HMD’s rendered FOV. This allow us to leverage SAR without rendering outside the object’s existing outline and introducing additional rendered content. In addition, other HMD techniques, as discussed in the next section, can assist with reducing visual clutter, allowing the user to focus on the filled outline. Filling the outline, rather than simply changing the color of the outline, was chosen after trialing both approaches. Identifying the color change could often be missed as it appeared to be too subtle, especially in more well-lit environments and given the general noise from the HMD’s rendering. In matching the visual indicator against the two attributes of the design space identified earlier in this section, it is local in physical space, and rendered using the object’s geometry.
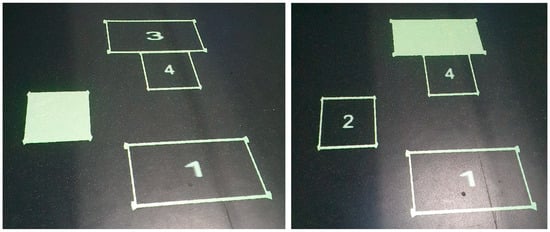
Figure 6.
Filled outlines of the objects showing they’re selection by the user in an HMD, selecting object 2 (left) and then object 3 (right). Highlighted reflection is from skylight.
3.2.4. Radial Outline
Irlitti et al. [30] examined SAR-based position indicators for collaborative environments. Whilst the work was designed to communicate the location of remote collaborators, fundamentally, the indicators presented in the work relate to position, without the need for collaborative users. We implemented a radial outline (Figure 7) similar to the technique presented by Irlitti et al. This indicator had a second outline beginning at two times the object’s scale and centered around the original outline. The outer outline would then reduce in scale to “shrink” down to the size of the original outline over the timespan of one second. This animation draws the user’s focus towards the object, both in the concentric position, but also the animation. In matching the indicator against the two attributes of the design space identified earlier in this section, the technique is local in physical space, and rendered using the object’s geometry.
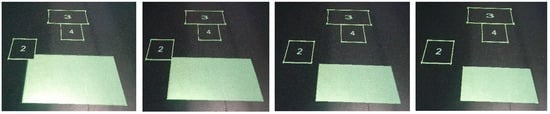
Figure 7.
Four frames from the radial animation showing a solid outline shrinking down around an object selected by the user. The reflection is from a skylight and is not part of the indicator.
3.3. HMD Techniques
Whilst the prior indicators represent different ways to communicate a location of interest in the projected scene, they were limited to floor-based projections, given SAR’s inability to render above the ground plane. When exploring complimentary HMD indicators, we can utilize all three dimensions, in addition to utilizing the 3D model of the object, rather than just its outline. Five different HMD methods were identified for use with the SAR indicators previously described. These are described below, with three relating to how we present the display a selected object in the HMD view, and two examining ways to filter the HMD view to assist with decluttering.
One indicator that is not explicitly presented below relates to the use of color to highlight the objects in the scene. The use of color can be an effective means of drawing attention; however, its use must also take into account the scene within which it exists in terms of noise and coloring. As such, the additional use of color can be applied to the techniques below if the implementation allows.
As discussed in Section 2, extensive prior work has been done examining positional and depth cues in HMDs. This section does not seek to replace the recommendations from that prior work. Instead, this section seeks to identify general approaches for highlighting a “selected” object in the HMD that could be used to assist the user in correlating an outline on the floor, to the same object in the HMD. As such, this section focuses on indicators enabling the correlation of content across modalities, rather than explicit depth/position indicators for the HMD, and seeks to remove additional rendering from the HMD to reduce the saturation of AR content shown in the HMD FOV.
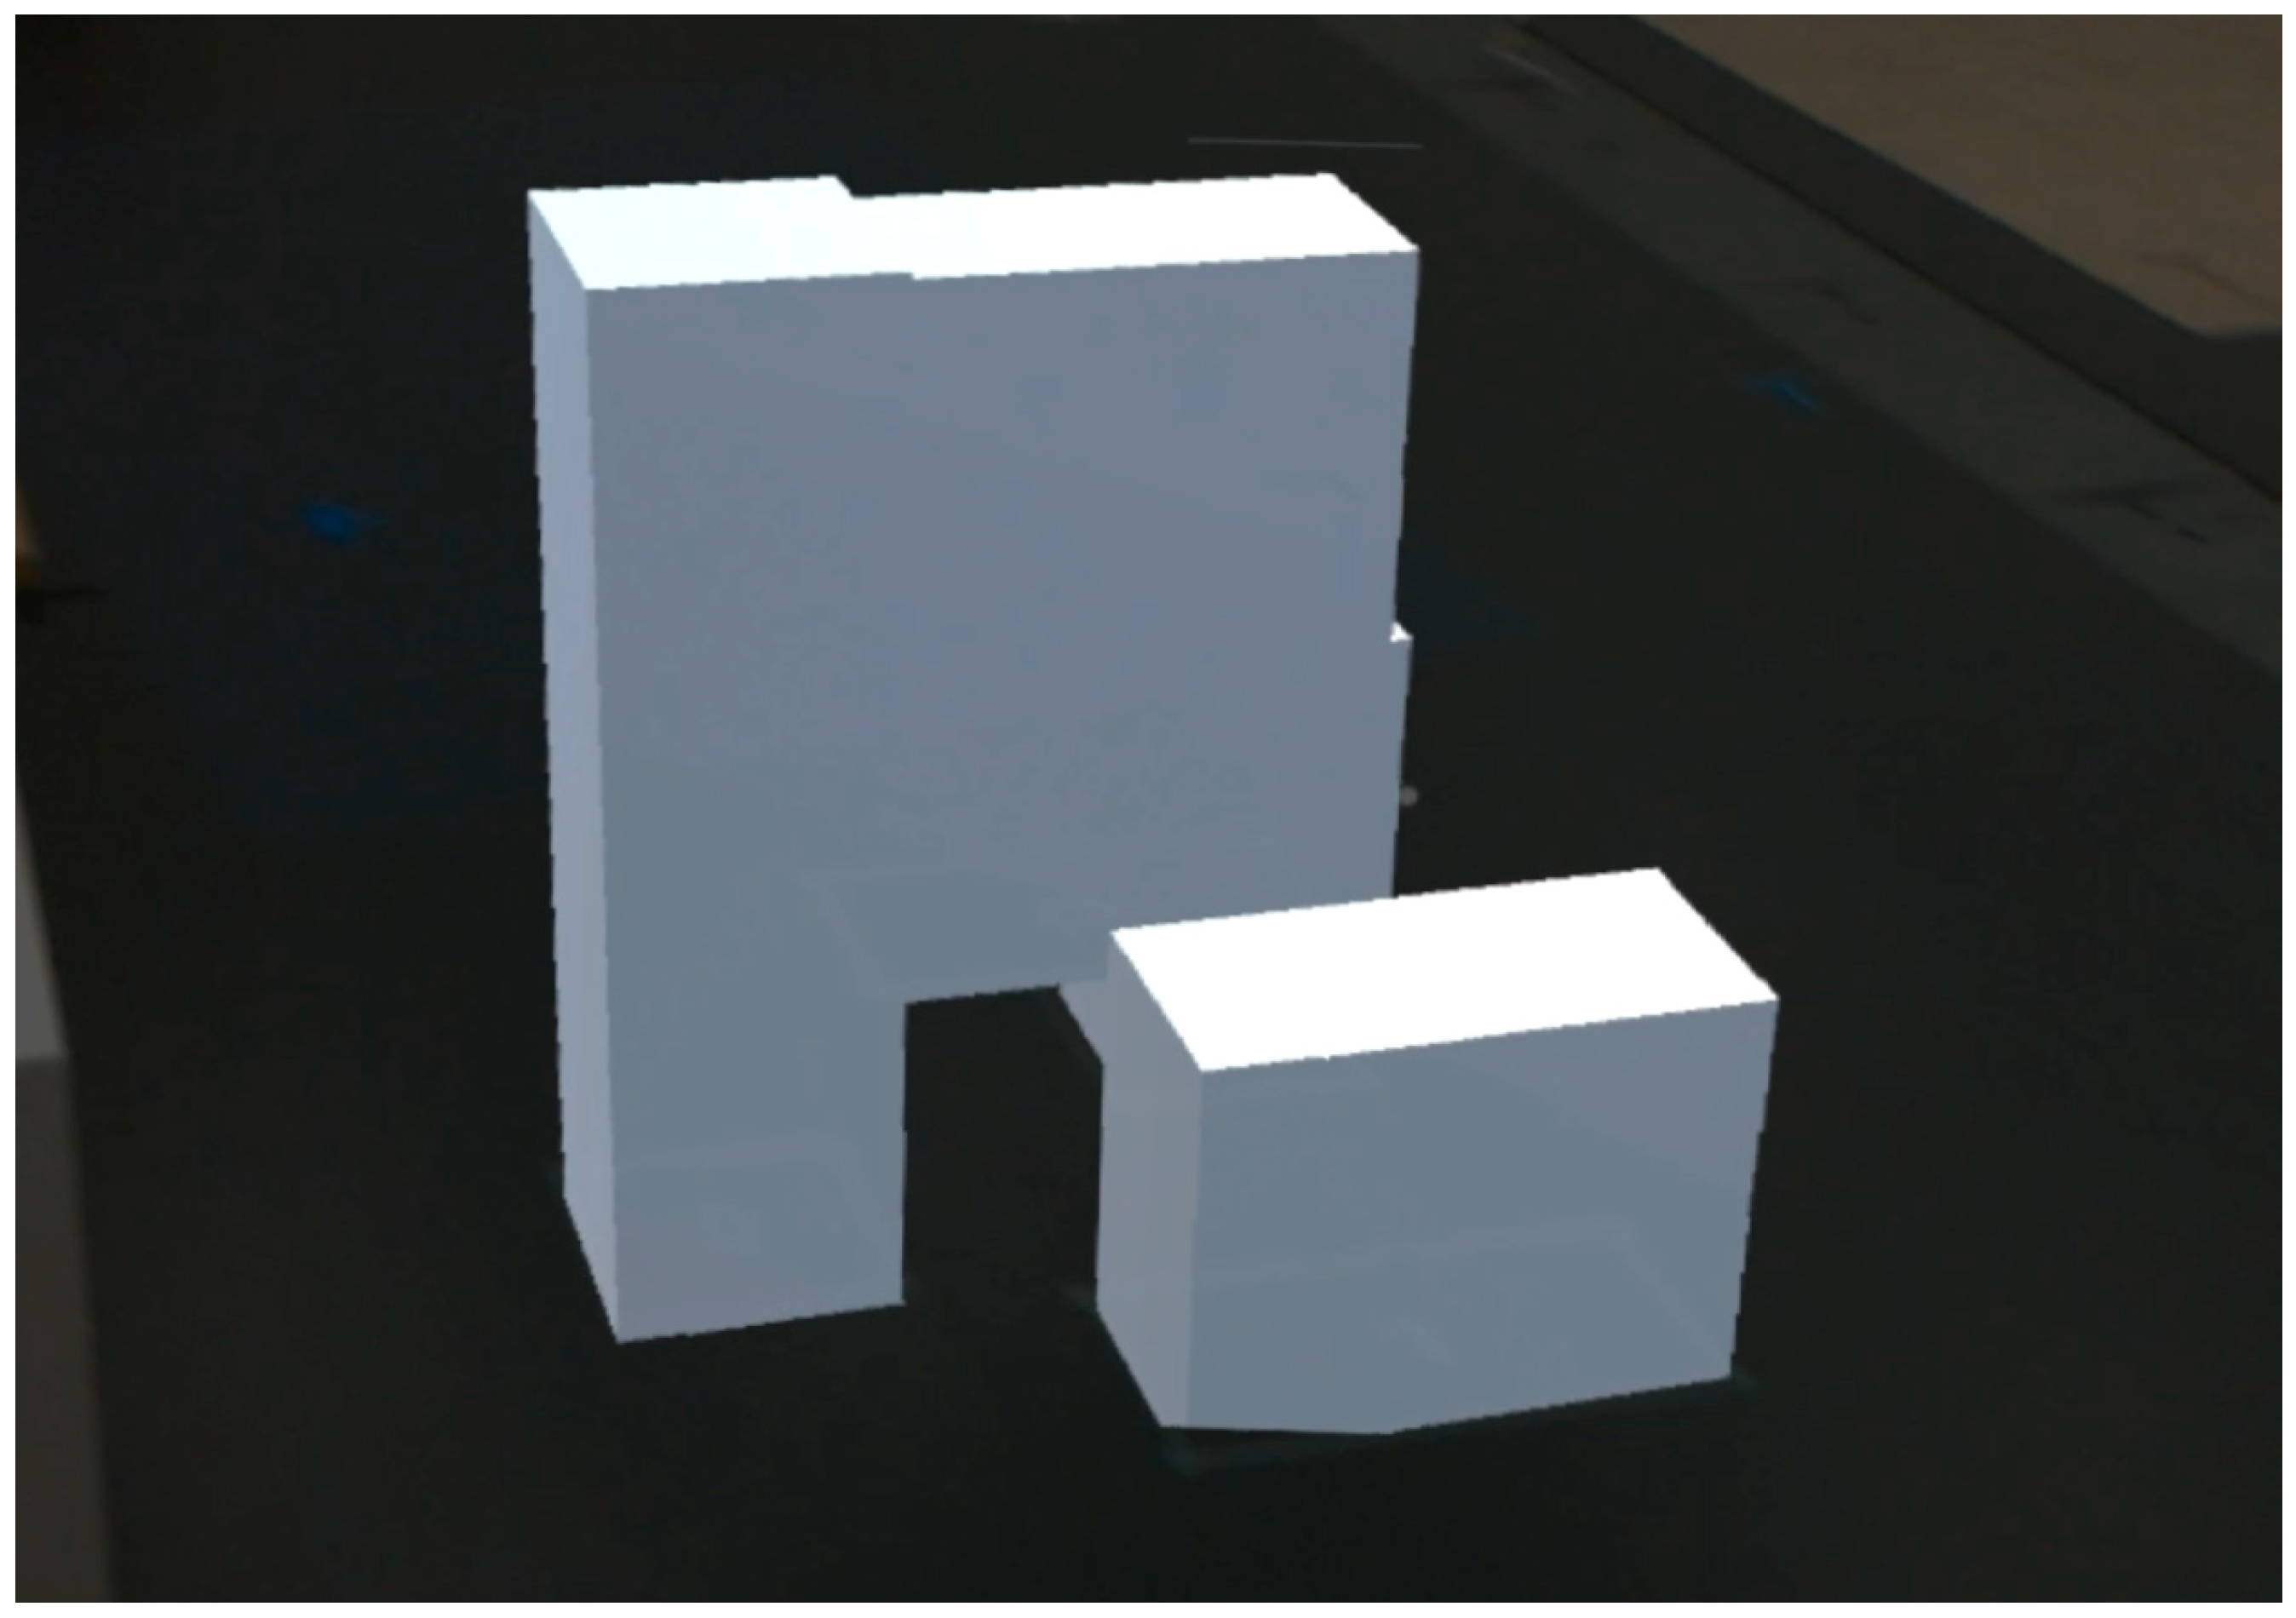
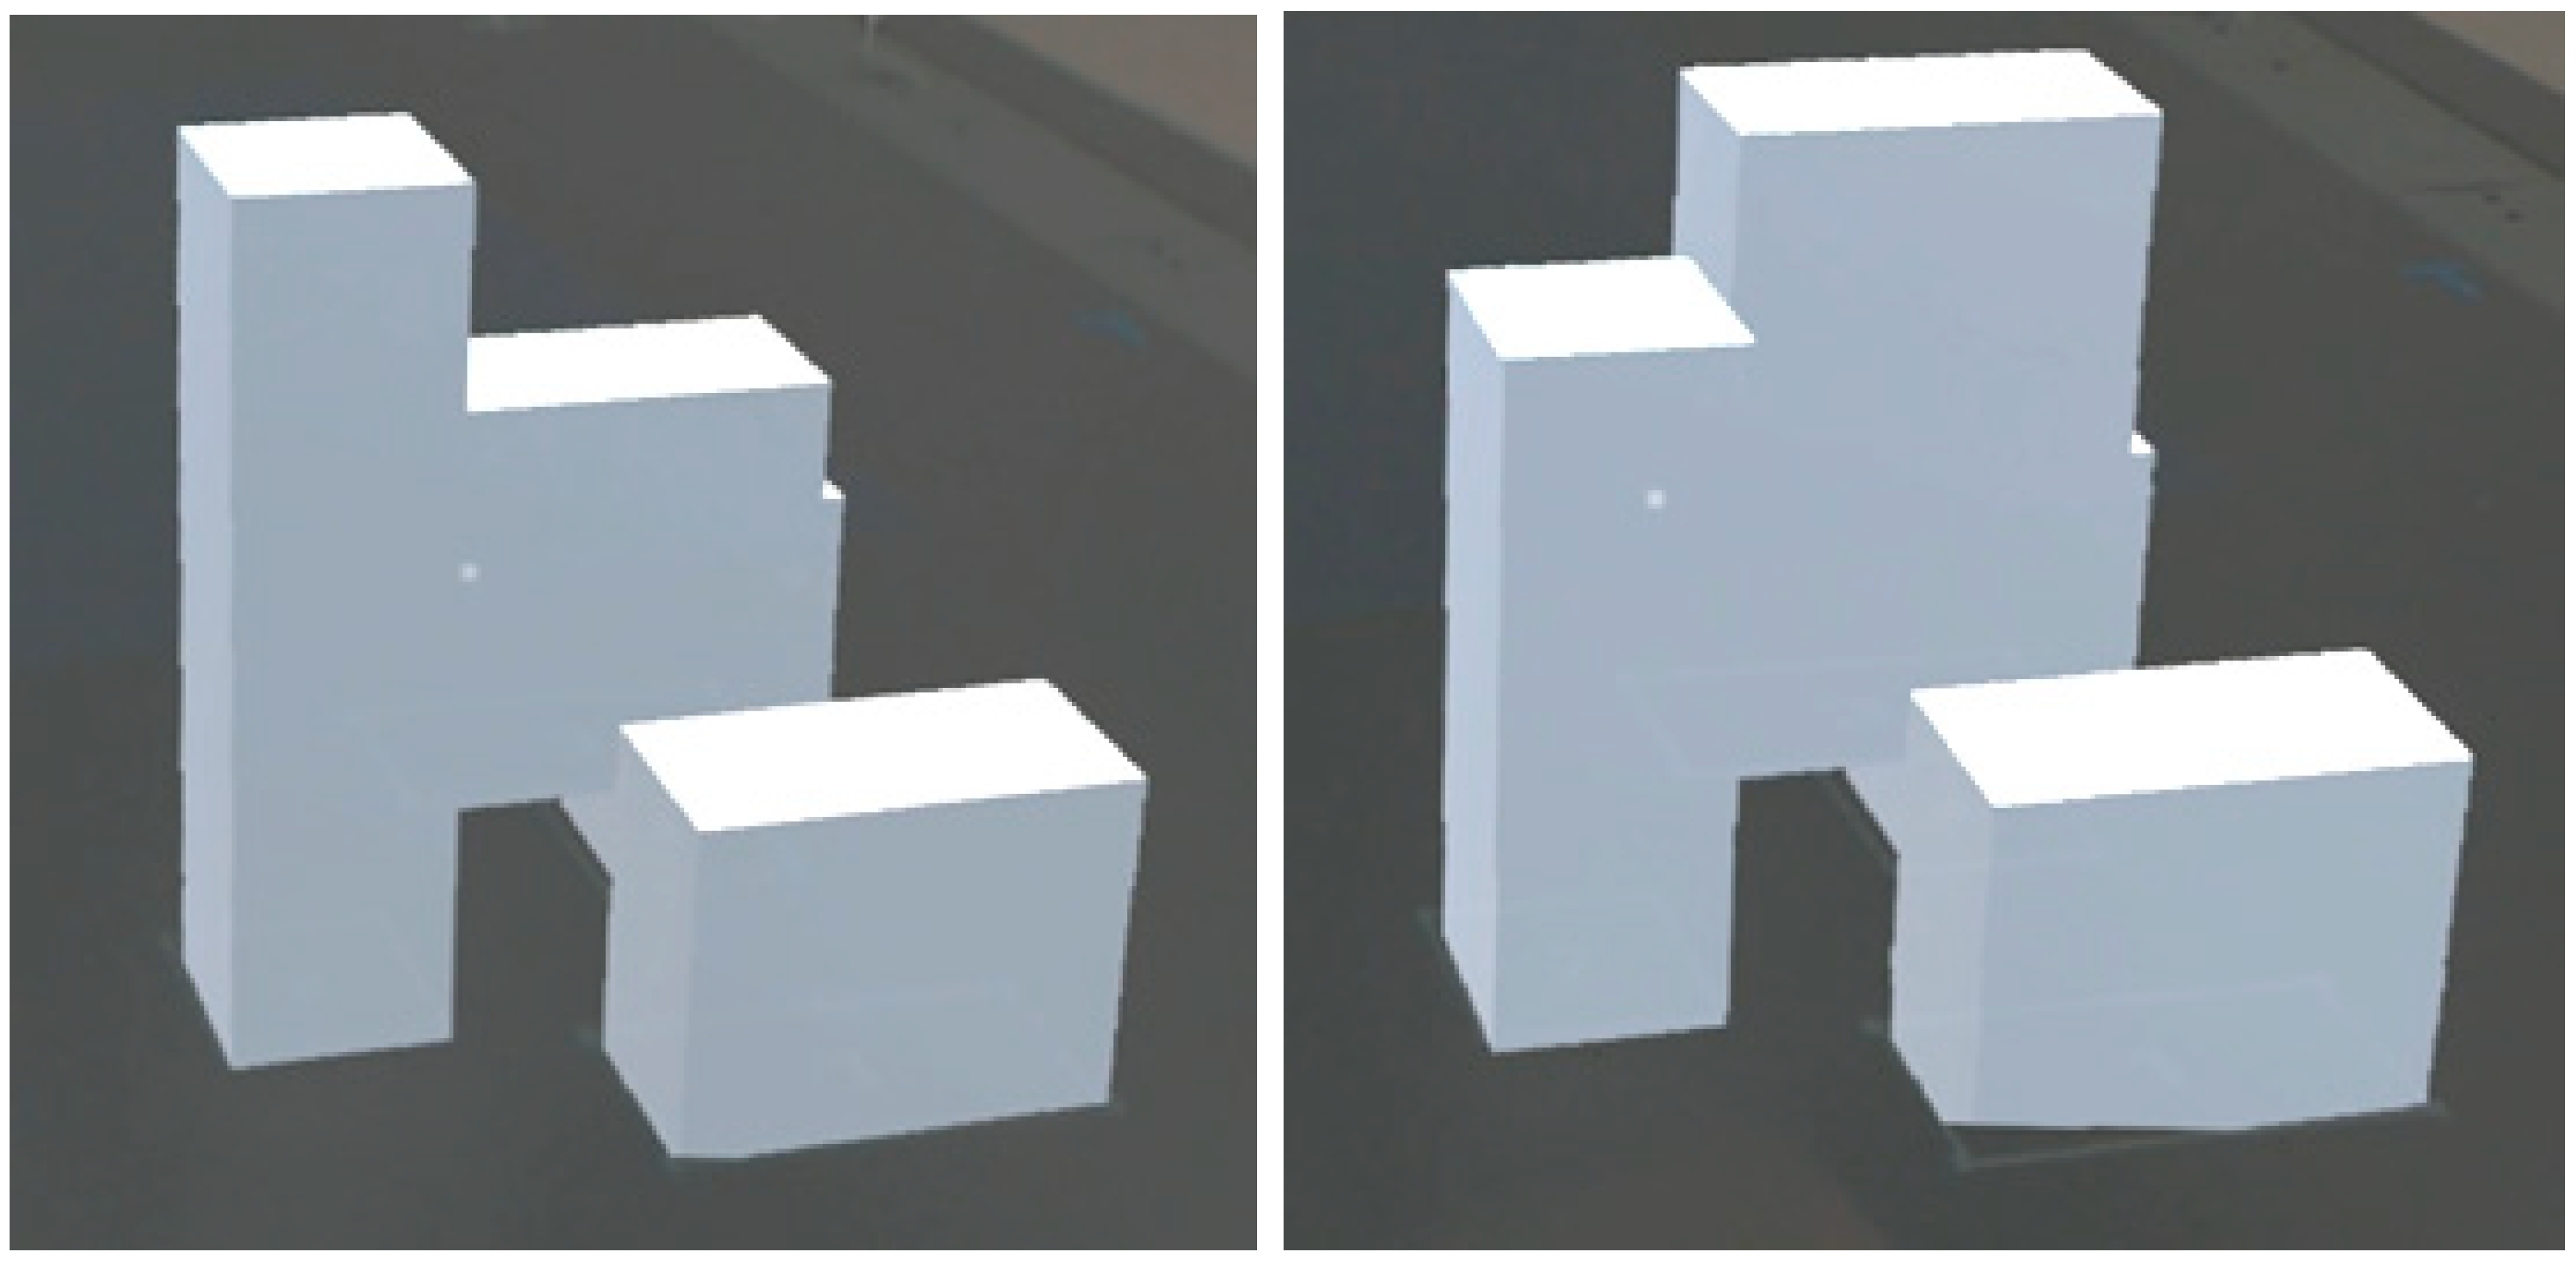
3.3.1. Completely Opaque
Objects appear as full 3D models in the scene, “floating” above the ground plane and completely opaque to objects behind them (subject to any transparency introduced from optical-see through HMDs). This represents the base-case of how AR content is normally presented, in full color, and full detail (Figure 8). The complexity of the models could vary depending on the scene, from simple geometric shapes to complex meshes. Where possible, the simplest representations of objects should be used as to allow the focus to be on the indicators, rather than the scene. However, this may not always be possible for applications requiring both persistent high-quality rendering, as well as the positional cues. This view represents the “normal” view. In matching the indicator against the two attributes of the design space identified earlier in this section, it is local in physical space, and rendered using the object’s solid geometry.
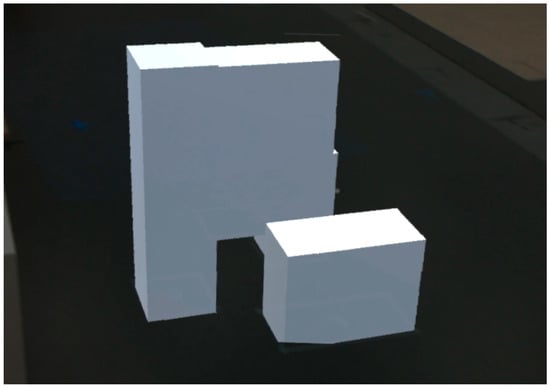
Figure 8.
A simple scene of opaque rectangular prisms as viewed from the HMD, showing the “standard” rendering used in HMDs. HMD FOV clipping is visible on the bottom of the front prism.
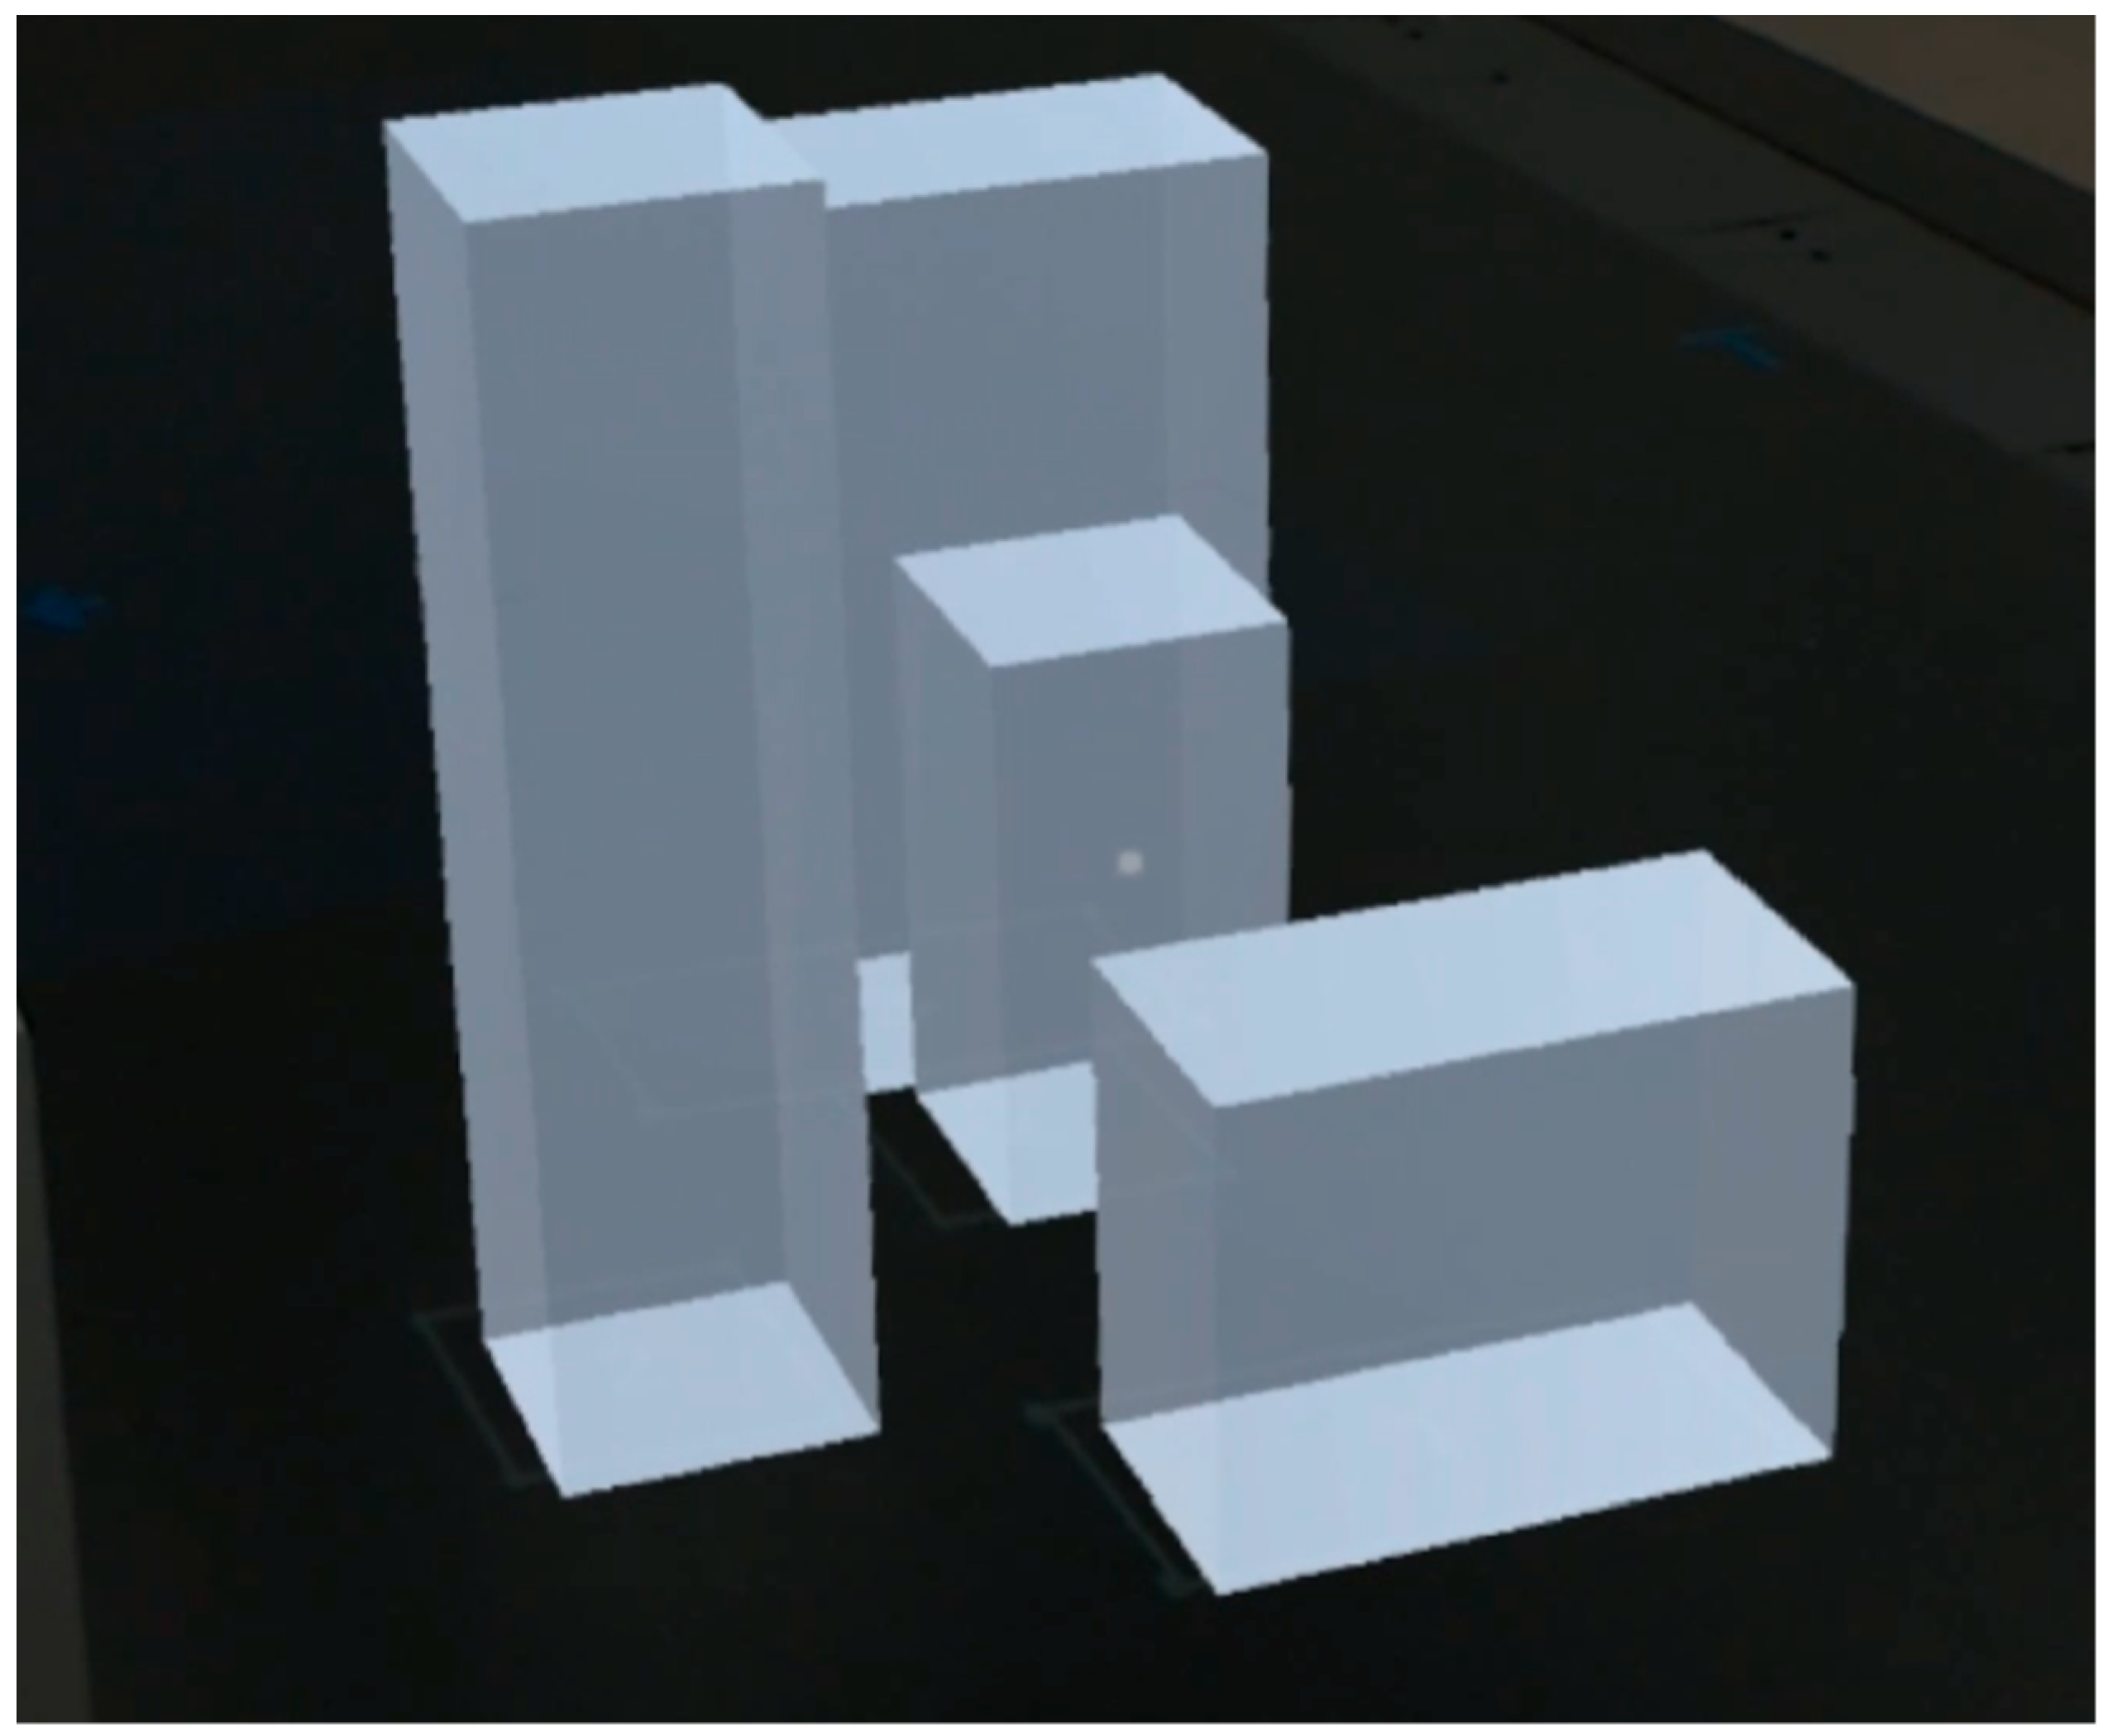
3.3.2. Partially Self-transparent
Objects appear fully rendered, however, surfaces are partially transparent to other surfaces from the same object, i.e., self-transparent (Figure 9). Objects in front of other objects mask them completely, as in the real world. This indicator was selected to ensure users could still view the HMD AR content unobstructed, whilst ensuring that the projected content that existed “behind” the HMD content was always visible given the partial transparency. With a small number of objects, global transparency for their surfaces quickly accumulates, as even at 25% opacity, four overlapping surfaces from different surfaces create a fully opaque surface (painter’s algorithm). As such, by using self-transparent objects, we can utilize additional cues from the object’s own geometry to assist with size estimates by using the internal geometry of the shape as hints for size. In matching the technique against the two attributes of the design space identified earlier in this section, it is local in physical space, and rendered using the object’s solid geometry.

Figure 9.
A simple scene of self-transparent rectangular prisms with 50% opacity, as viewed from the HMD.
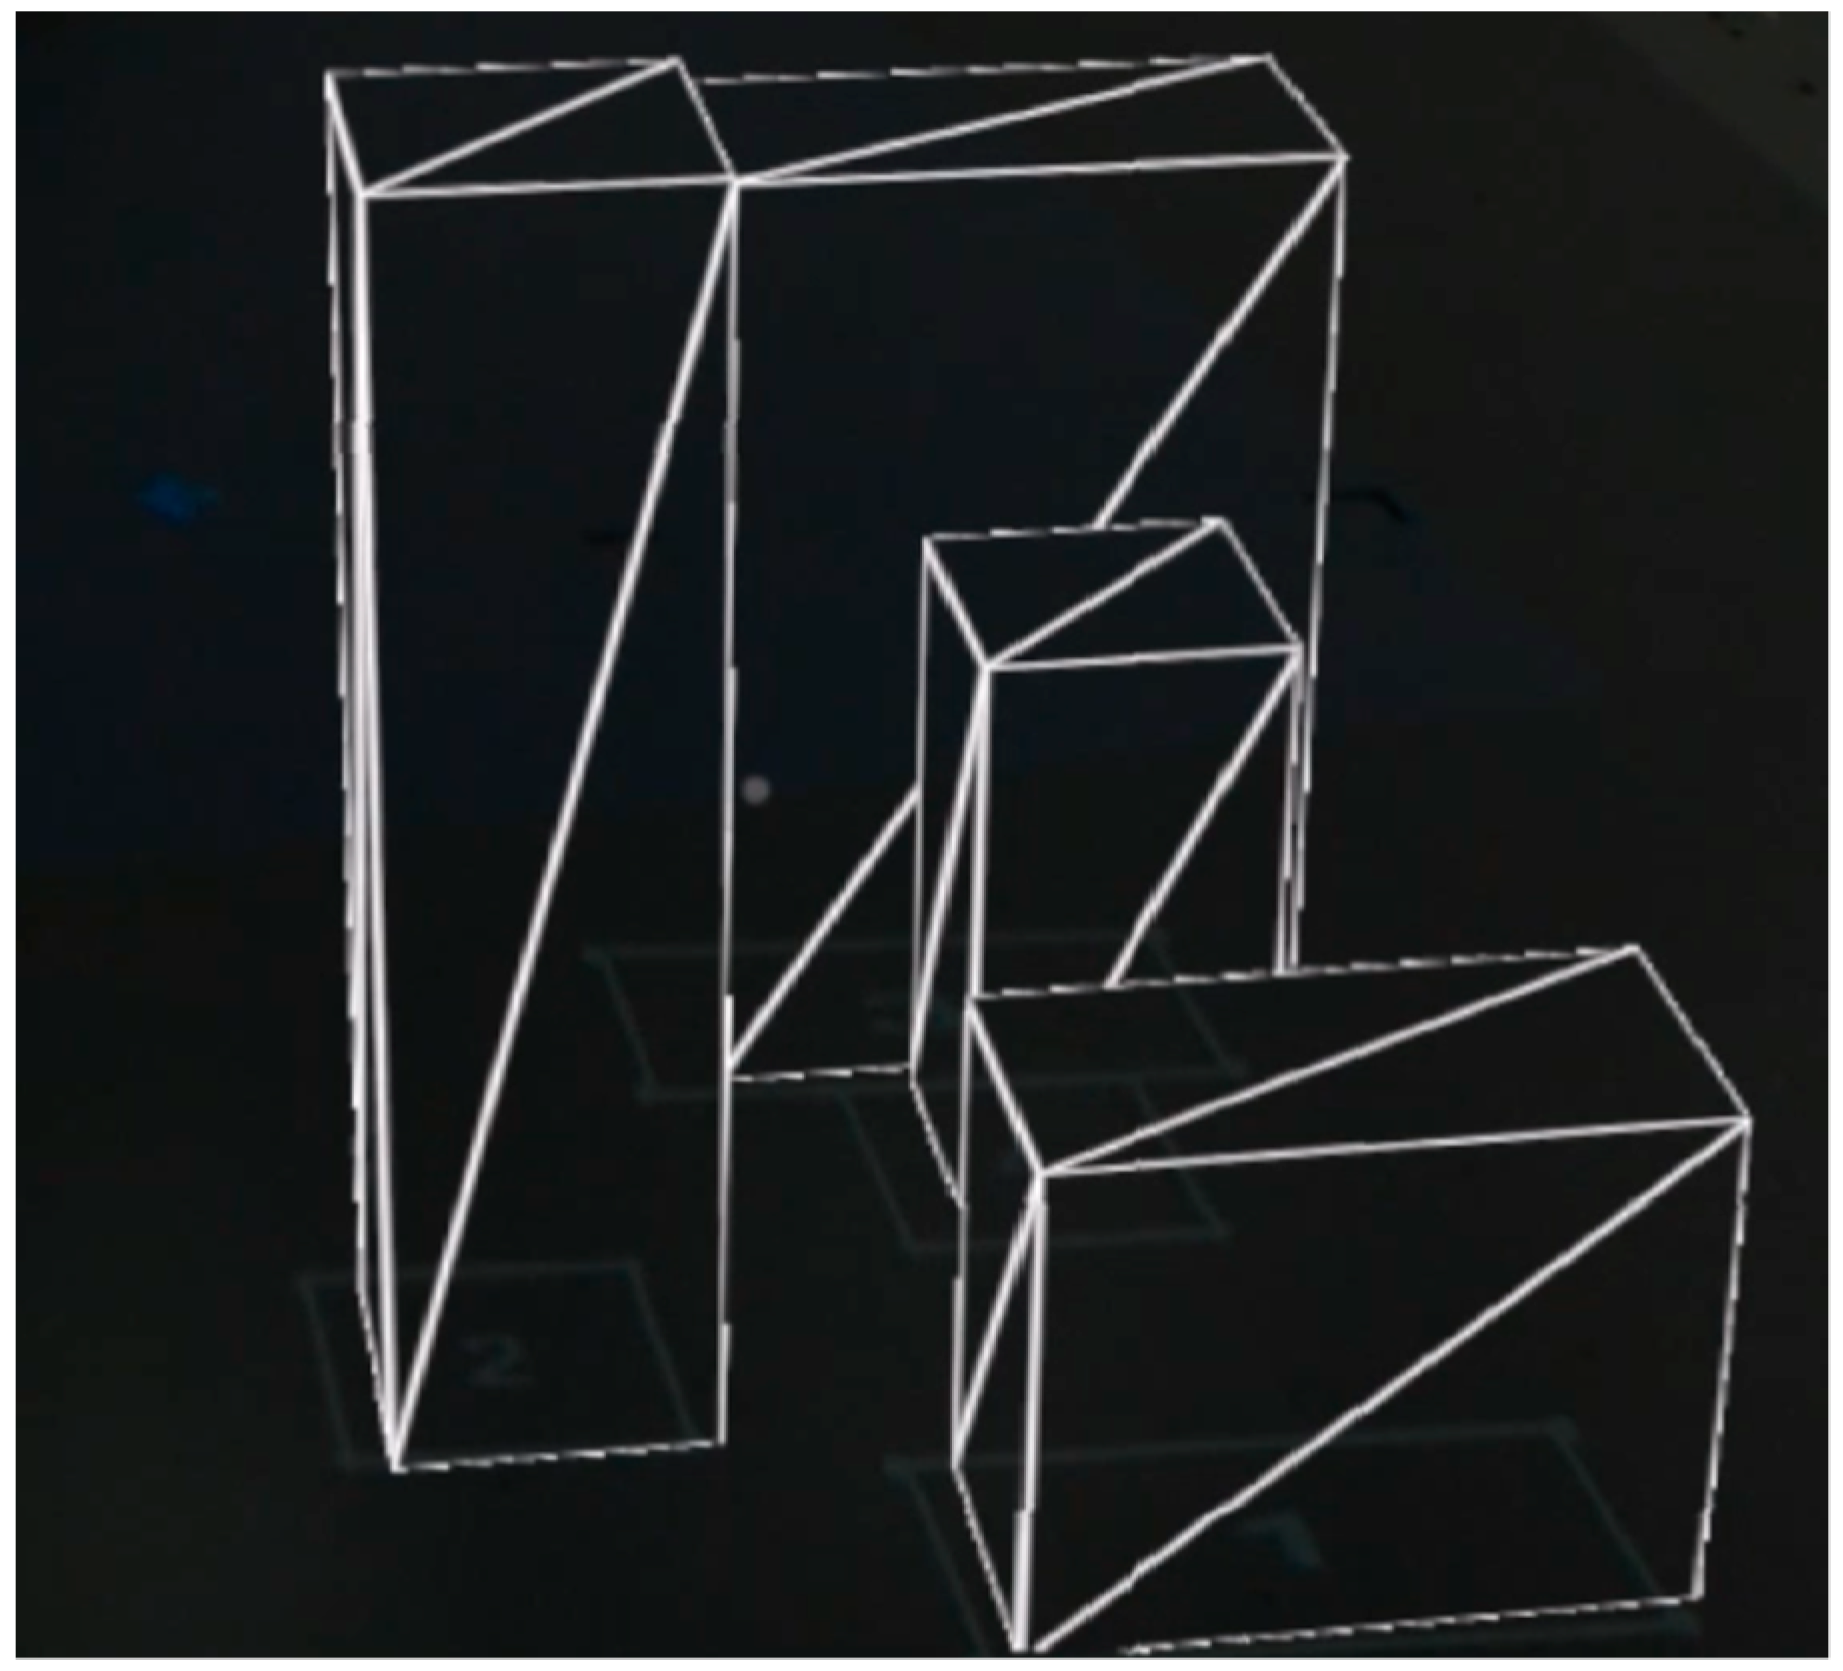
3.3.3. Wireframe
For the wireframe indicator, objects are rendered in wireframe, opaque to themselves and other objects behind them. The wireframe was trialed as both world-transparent (seeing all wireframe edges) and self-transparent (see only wireframe edges for that object, but opaque to other objects behind it). Both transparent alternatives created scenes of high visual noise, even when the scene contained only a few simple geometric shapes. As a result, we used an opaque wireframe with back-face culling enabled (Figure 10).
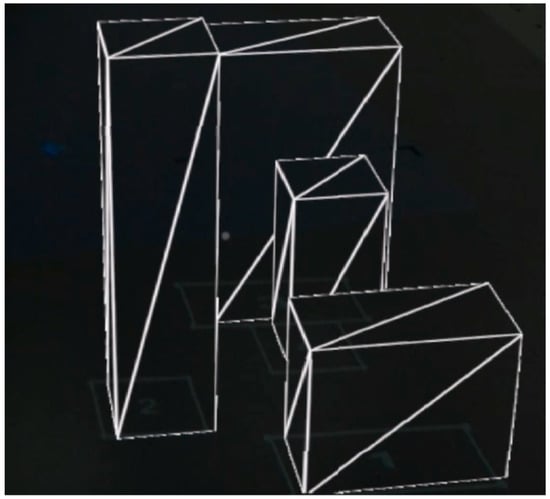
Figure 10.
Four wireframe prisms as viewed from the HMD.
One of the additional benefits available from simplified wireframes, versus more complex wireframes and more complex renderings, is that the lower polygon count allows for the user to view any two lines on either side of a mesh’s triangle to estimate the height/size of that triangle. This is especially important for triangles on the sides of objects, serving as a hint for the height. In matching the indicator against the two attributes of the design space identified earlier in this section, it is local in physical space, and rendered using the object’s geometry, but in a reduced poly, line-based form. Whilst real world meshes will be more complex than the figure above, the meshes could be reduced or substituted with other, more basic geometries (boxes, cylinders, etc.). For our domain of building design and construction, the individual object mesh itself is of less interest than knowing that something is there, enabling the use of reduced polygon meshes without any downside for the user.
3.4. HMD Filtering
Given HMD content will always be rendered in front of SAR content, the HMD must have some filtering technique to allow the user to focus on the real and SAR worlds when required. Assuming pixel-perfect tracking, the HMD could simply mask areas on the HMD to reveal individual pixels projected by SAR, however, this is not feasible with current tracking accuracy. As a result, we can filter the HMD FOV by masking elements/areas or using transparency, however, the nature of this must take into account the content. For busy scenes, transparency may not assist given the amount of visual noise in the scene, make masking more suitable in this scenario.
Given the significant amount of AR content that may be present within the user’s HMD FOV, this may impact their ability to view projected indicators except where they extend beyond the edges of the HMD FOV. Two filtering techniques are presented, AR Cutout and Squashed View, allowing the user to view the real world “through” the HMD augmentations.
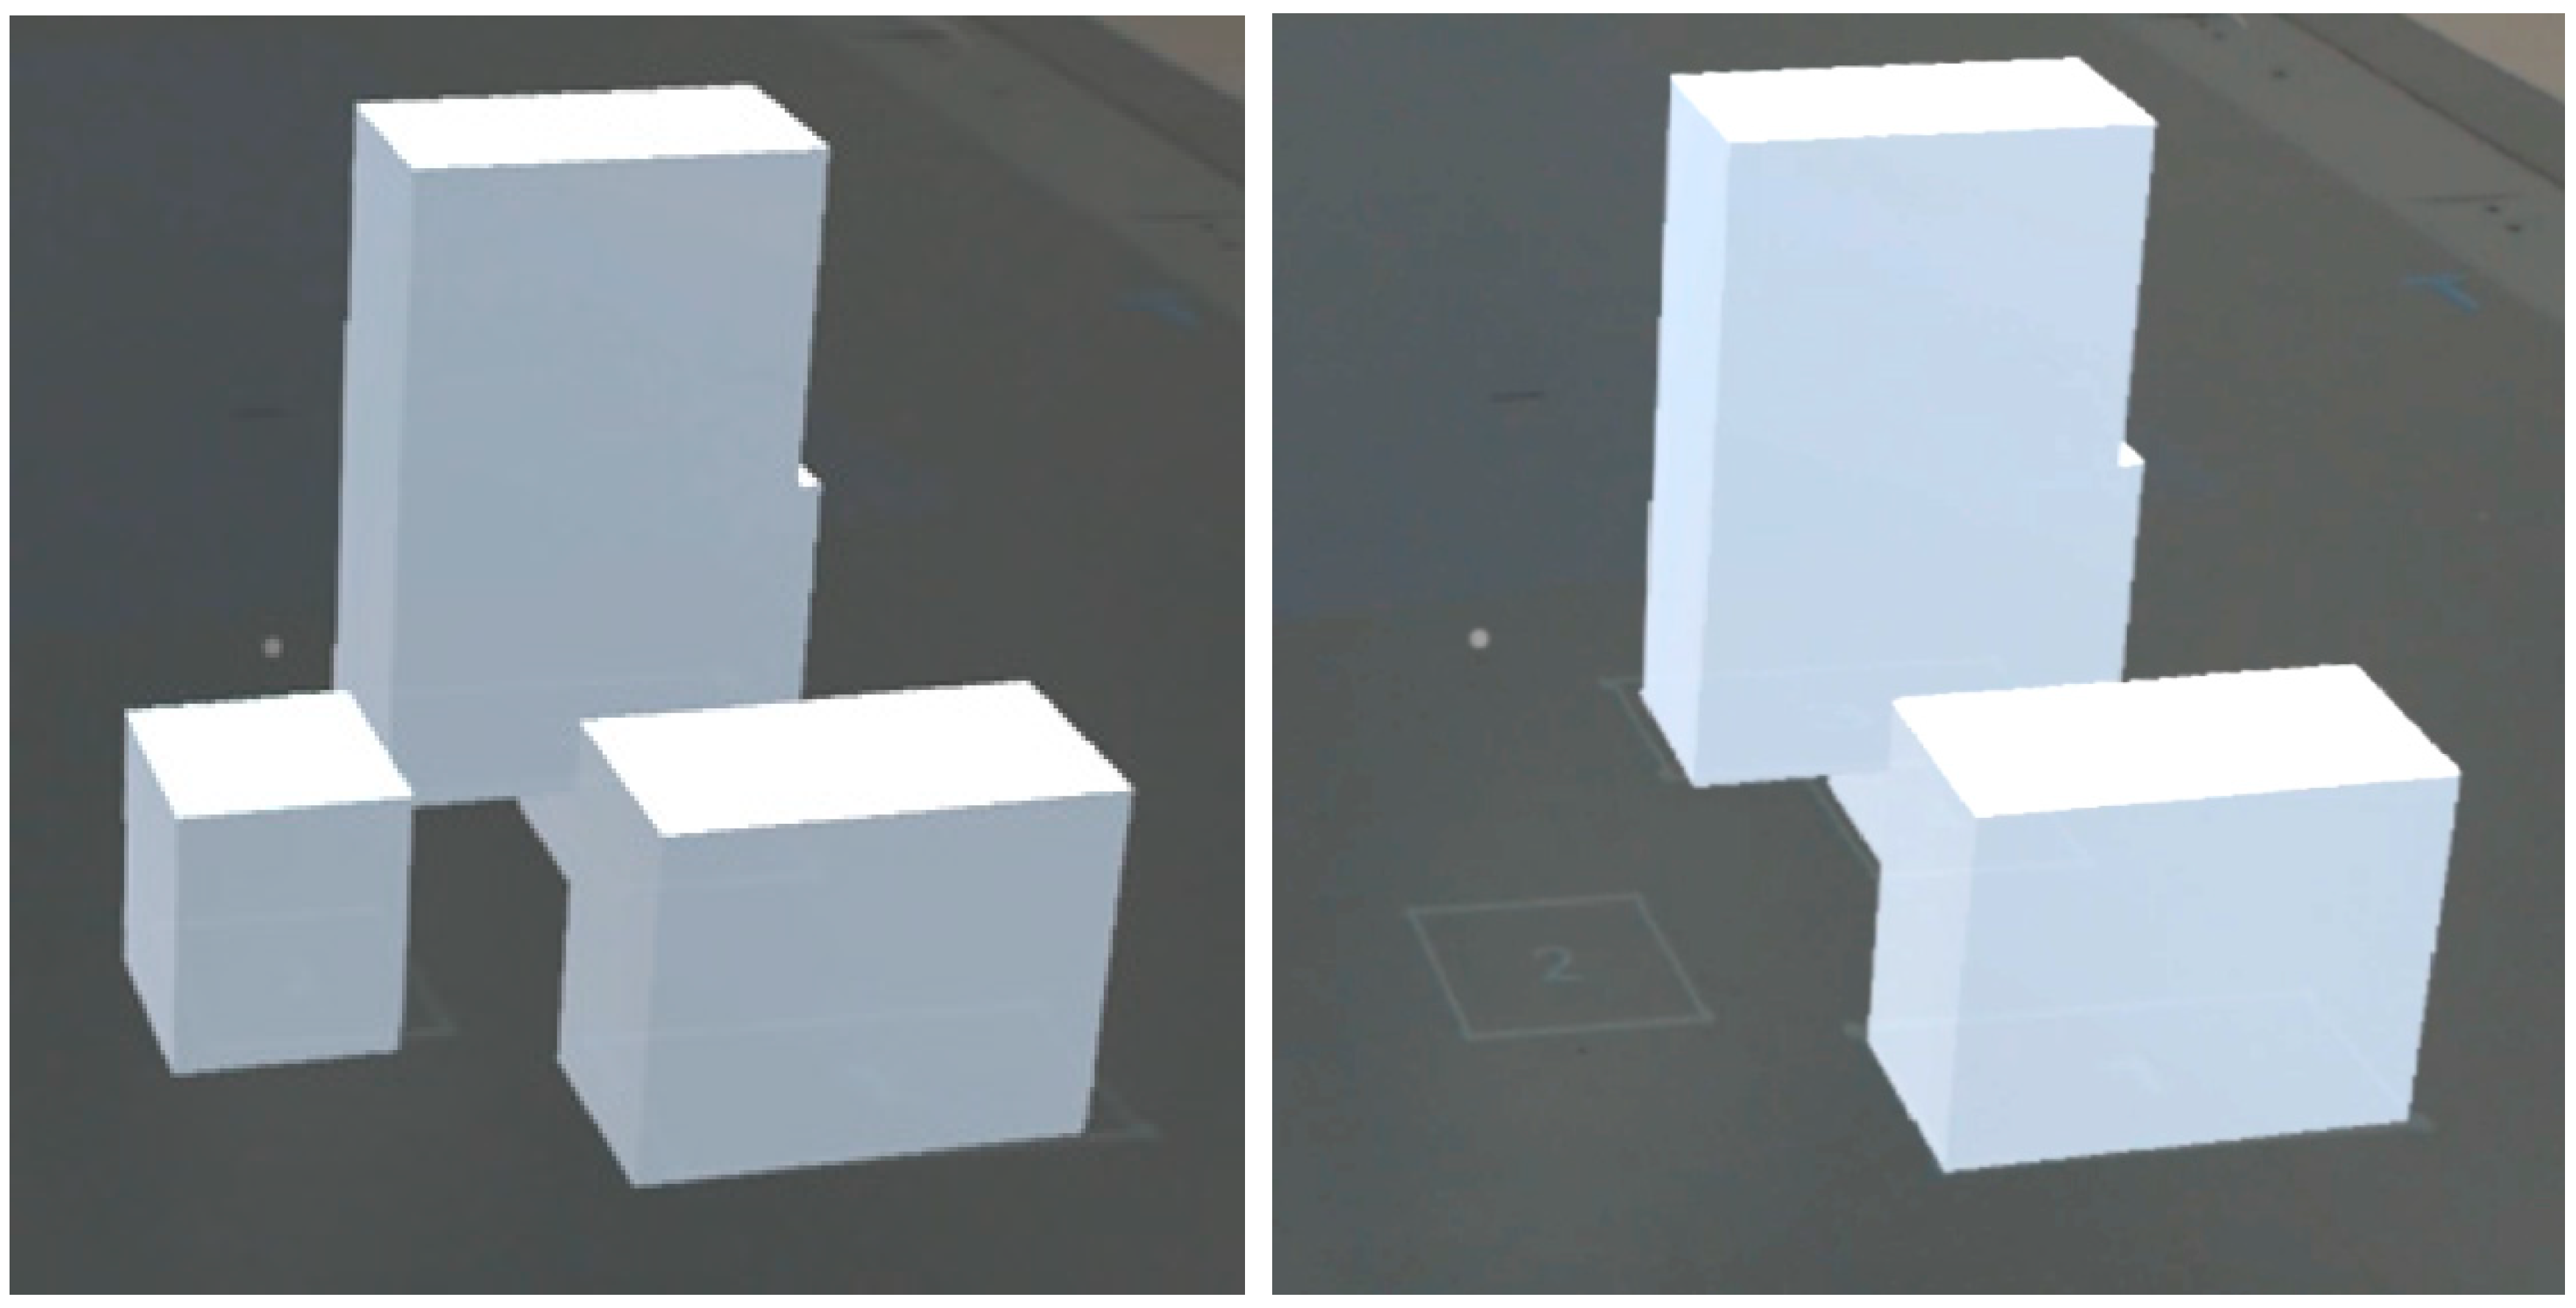
3.5. HMD AR Cutout
The cutout effect masks all HMD AR content in the user’s HMD using a vertical rectangle. This allows a central “strip” within the user’s FOV to not show any HMD content at all, with the central strip only showing the real world (given the use of an optical-see-through HMD). This ensures the user’s ability to view the real world and any of the SAR content unobstructed. Thus, any HMD content is only visible on the periphery of the user’s FOV, with the central focus being the same real-world view that a non-HMD user would see (Figure 11). This masked strip could potentially be toggled by the user.

Figure 11.
Four opaque cubes (left), shown with a vertical AR mask in the middle of the FOV (right) showing the real world (all black is transparent on the HMD). SAR projections are visible on the ground in the middle of the right image. Image levels have been adjusted to enhance contrast.
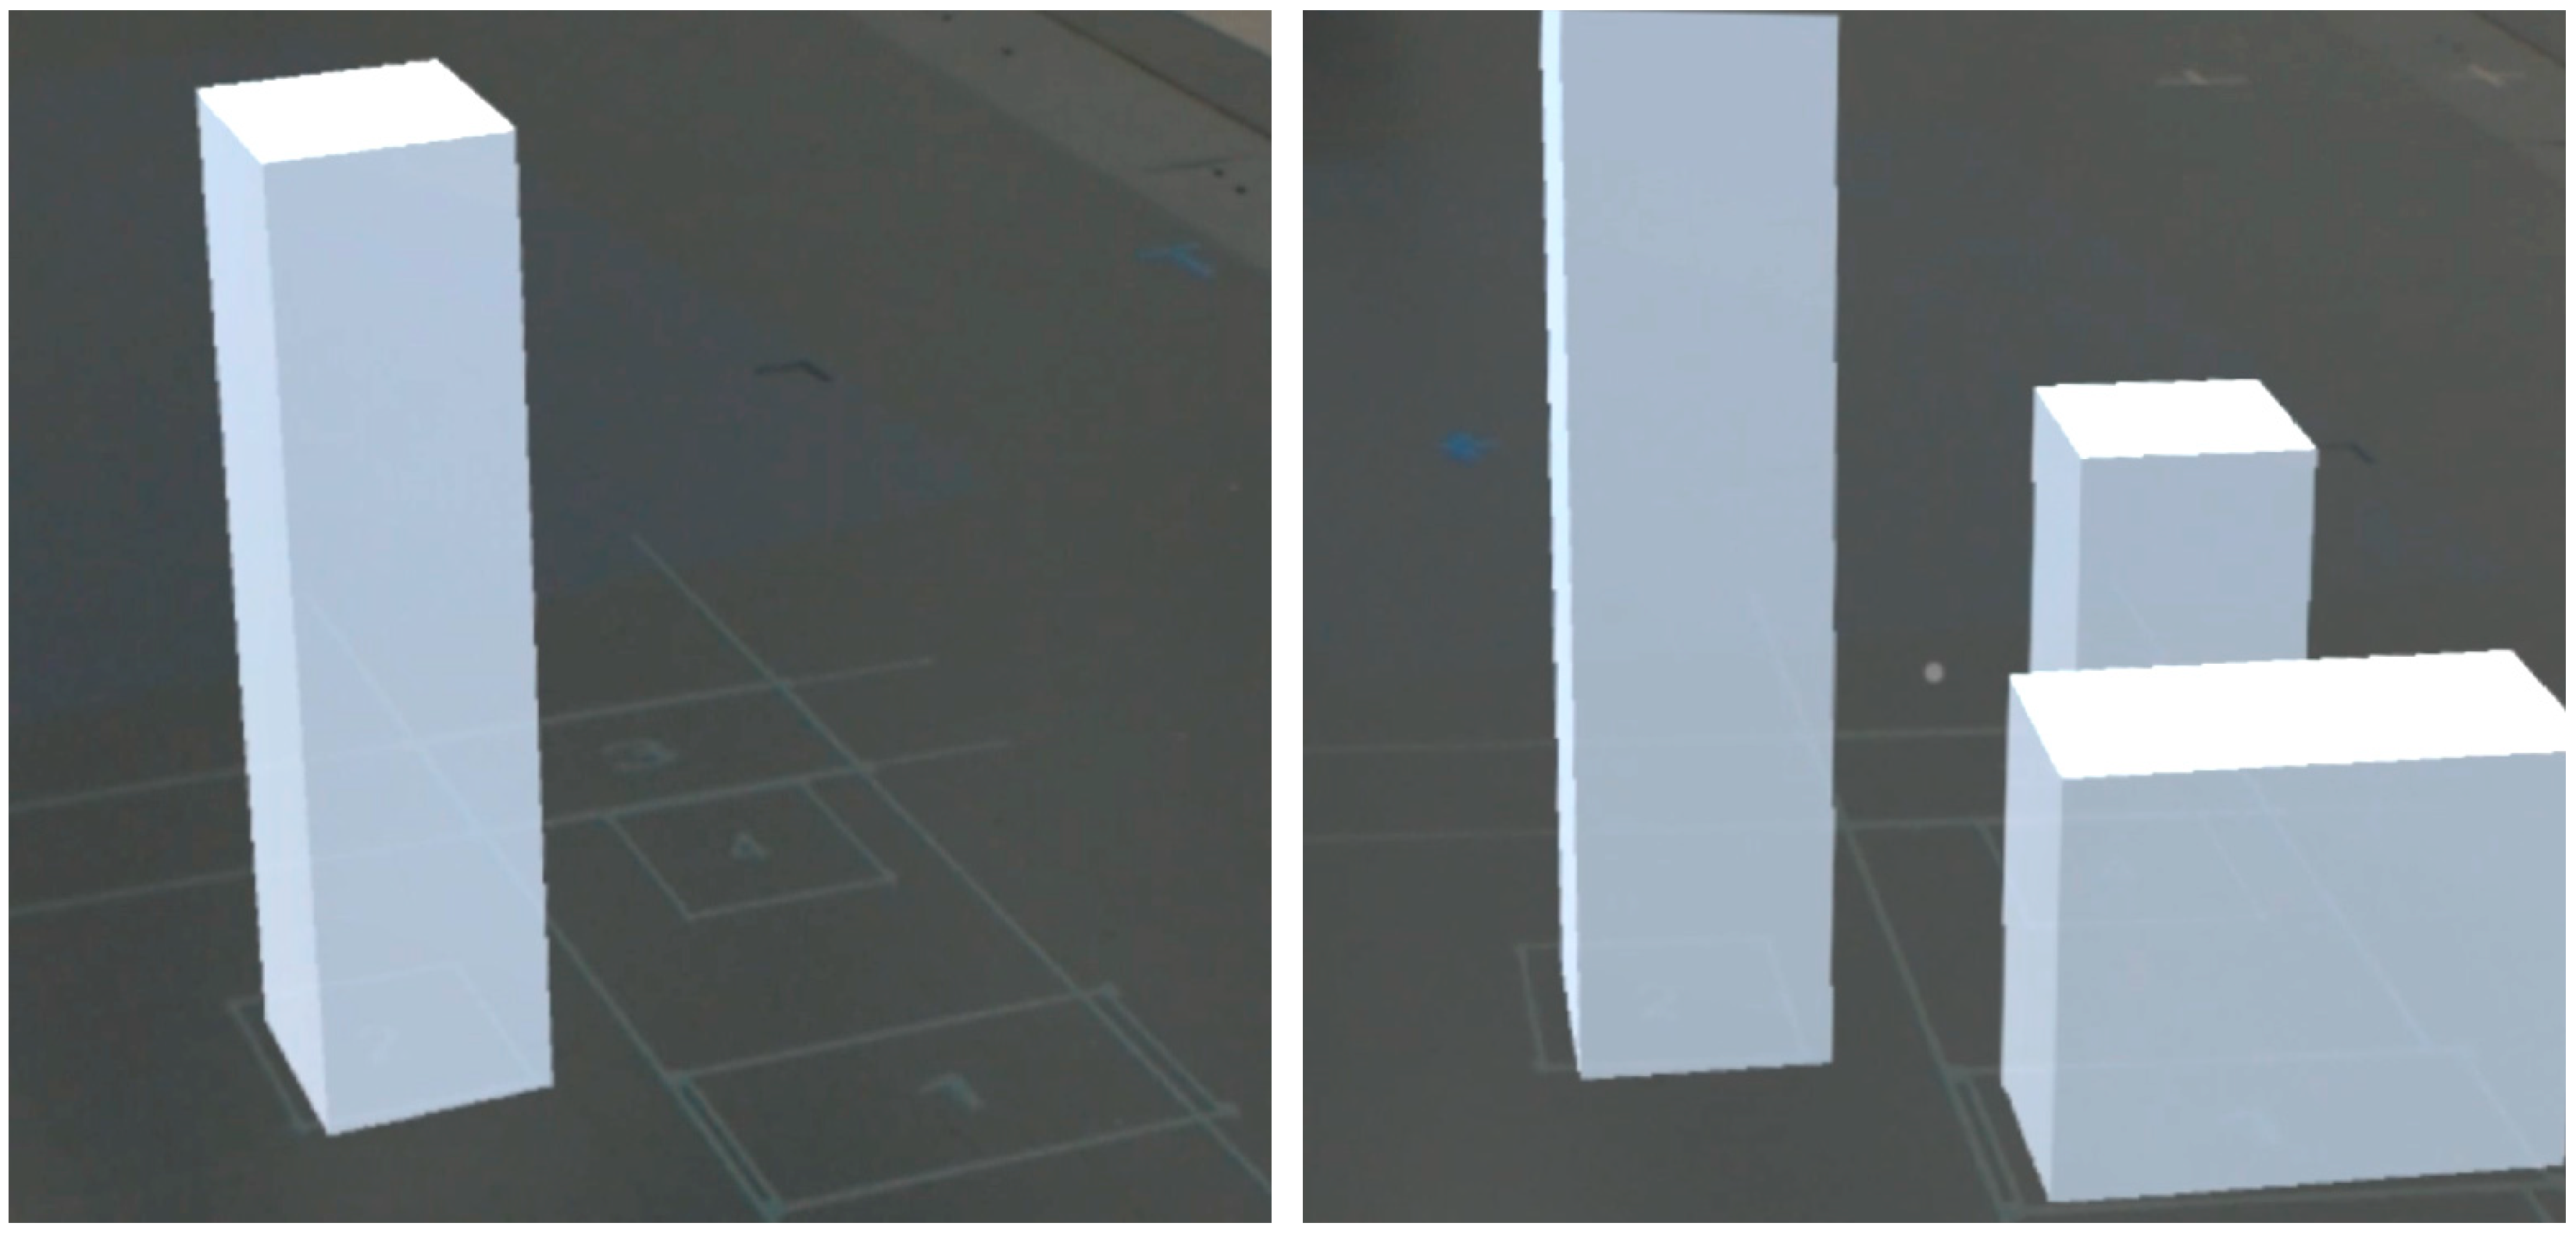
3.6. Squashed View
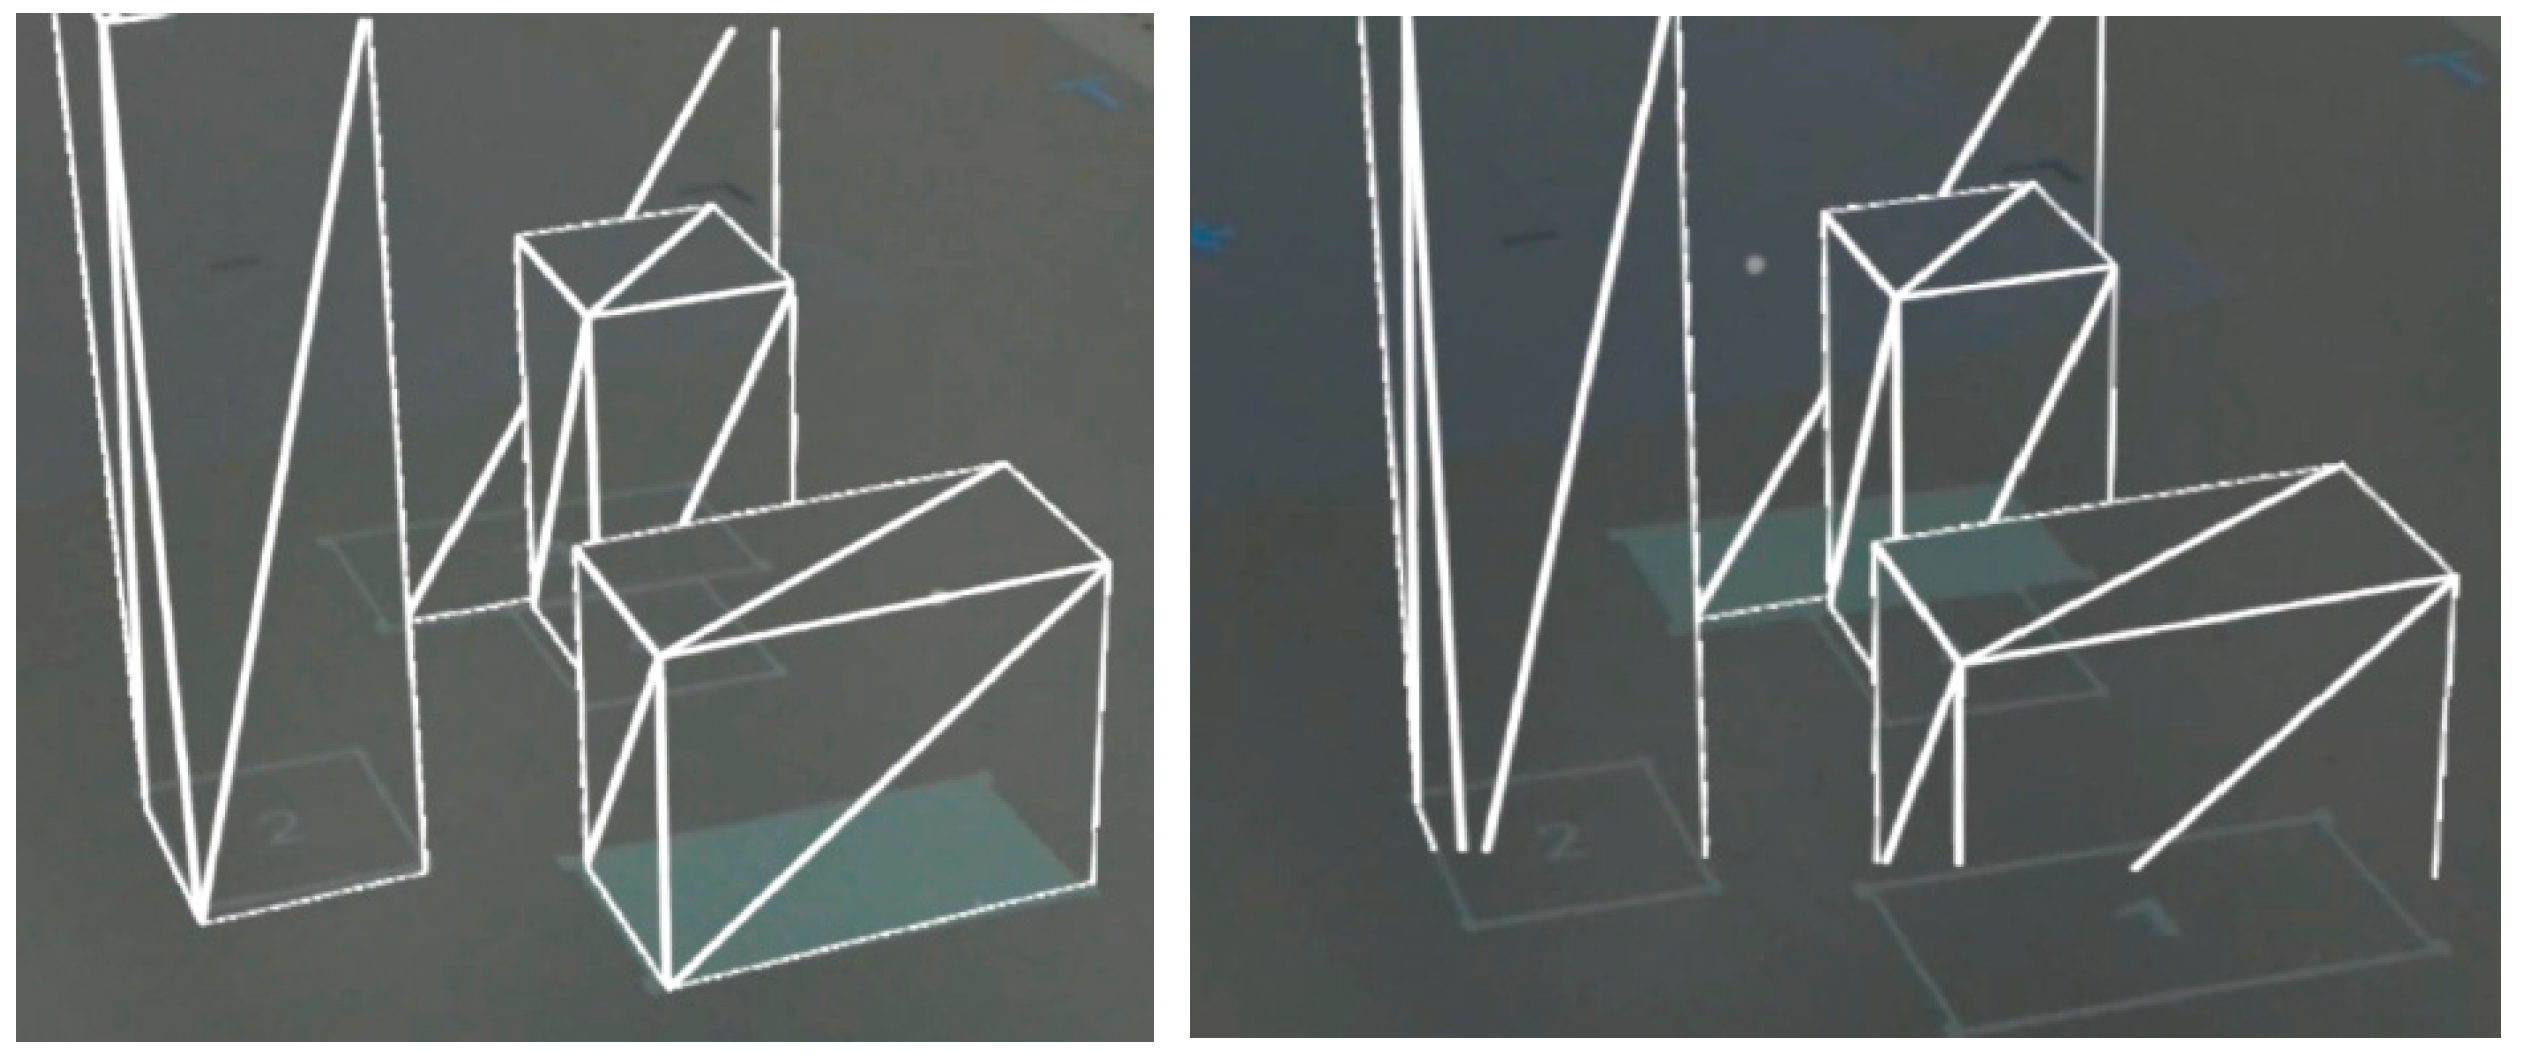
The squashed view filter seeks to quickly remove HMD AR content obscuring the user’s view of the real world and any projected SAR content in it. When users look in a given direction, a ray is cast from the center of their FOV. Any objects in the HMD scene that the ray intersects with are “squashed” downwards (reducing their Y-scale to zero over the span of one second), until the object disappears from the HMD view (Figure 12). When user’s focus changes and the objects are no longer “in focus” (i.e., are not hit by the ray casting), the animation is reversed so that the object appears at the original Y-scale. By collapsing the objects in focus, we can ensure the real-world and thus projected indicators are visible where the user is looking. Squashing objects does not need to be a persistent behavior, and could be toggled on/off by the user as required, similar to the masked cutout filter. The functionality could also be inverted, so only content that is hit by the ray is shown, and everything outside hidden.
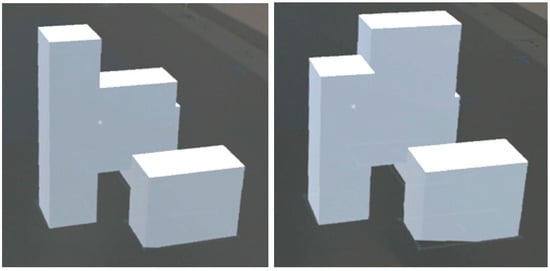
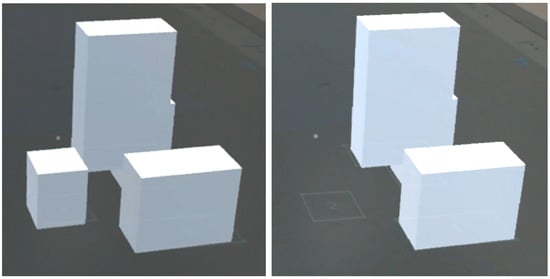
Figure 12.
Filtering prism 2 using the collapse technique over four frames of the (left-to-right), showing the prism shrinking to reveal the SAR outline faintly visible on the left side of the bottom-right image. Image levels have been adjusted to enhance contrast.
4. Exploring Combinations
By identifying a number of different projected and HMD-base techniques, the representations can be combined to enable better exploration of the environment by the user. The SAR techniques presented are, for the most part, extrinsic to the user’s object of focus (e.g., tram lines), extending outward from the object’s outline. Whilst these could be rendered in the HMD, anything rendered in the HMD is subject to the technical limitations of the HMD, including:
- FOV limitations: SAR’s greater FOV means we can show renderings across the whole space, even in the user’s periphery, versus the HMD’s limited FOV. Whilst we can introduce techniques to indicate where a user should be looking in the HMD (e.g., an arrow pointing left), this introduces additional visual clutter, whereas our aim is to reduce HMD clutter.
- Natural cues: Any “natural cues” (e.g., obstruction by other objects) need to be manually recreated in-engine, rather than occurring naturally from the projected images in the scene.
- Tracking issues: Given the HMD must align its content with the real world, and in this case not just the real world, but also the projected world, any content in the HMD will be subject to tracking error. The nature of this error (amount, accumulation, etc.) will vary depending on the headset and environment (e.g., lack of visual features for optical HMD tracking).
As a result, by utilizing SAR for the external visual indicators, we can leverage some of the characteristics of SAR that directly address the above limitations of HMDs, regardless of the actual indicator used in SAR. Conversely, two of the core limitations of SAR, monoscopic projection and not being able to render content mid-air, can be addressed using an HMD. Virtual models in the scene can thus be shown mid-air, using additional stereo and associated cues.
However, the core issue then becomes the correlation and alignment of the two realities such that when viewing an object, its position can be visually connected across modalities. As such, this is the focus of HMD techniques (fusion/”grounding” to the SAR representation), as whilst the SAR indicators can assist with position hinting given the greater field of view of the projector, we must associate that outline with the model shown in the HMD. In this section, we identify the benefits offered by various combinations of indicators in assisting the other AR modality.
4.1. Example: SAR: Grid, HMD: Opaque, Filter: Squashed
Given the completely opaque HMD rendering means we cannot see anything where there is an object shown in the HMD, using a SAR indicator that extends beyond the edge of HMD FOV means we are still able to communicate the position and size of the object. The user can see both the rendered 3D model in the HMD and the SAR position hint (Figure 13). Using the squashed filter, the user can collapse the HMD content in the area of focus, allowing them to not just see the SAR guidelines on the periphery, but also in the middle of their focus when required. These pairings mix line-based (SAR) and geometry-based (HMD) renderings, whilst also utilizing the global space in SAR. The opaque HMD rendering allows fully detailed content to be shown in the HMD view unencumbered, however, filtered as required to reveal the real and projected worlds. This would be ideal for high fidelity projects where viewing high-quality 3D models in the HMD is required.

Figure 13.
Grid cue highlighting object three whilst squashing all obscuring objects (left), and focusing solely on object three, meaning objects one and four remain visible (right). Depending on the user’s viewport, different objects will be “squashed” in line with the user’s view. Images have had contrast altered to enhance the visibility of the SAR projections for publication.
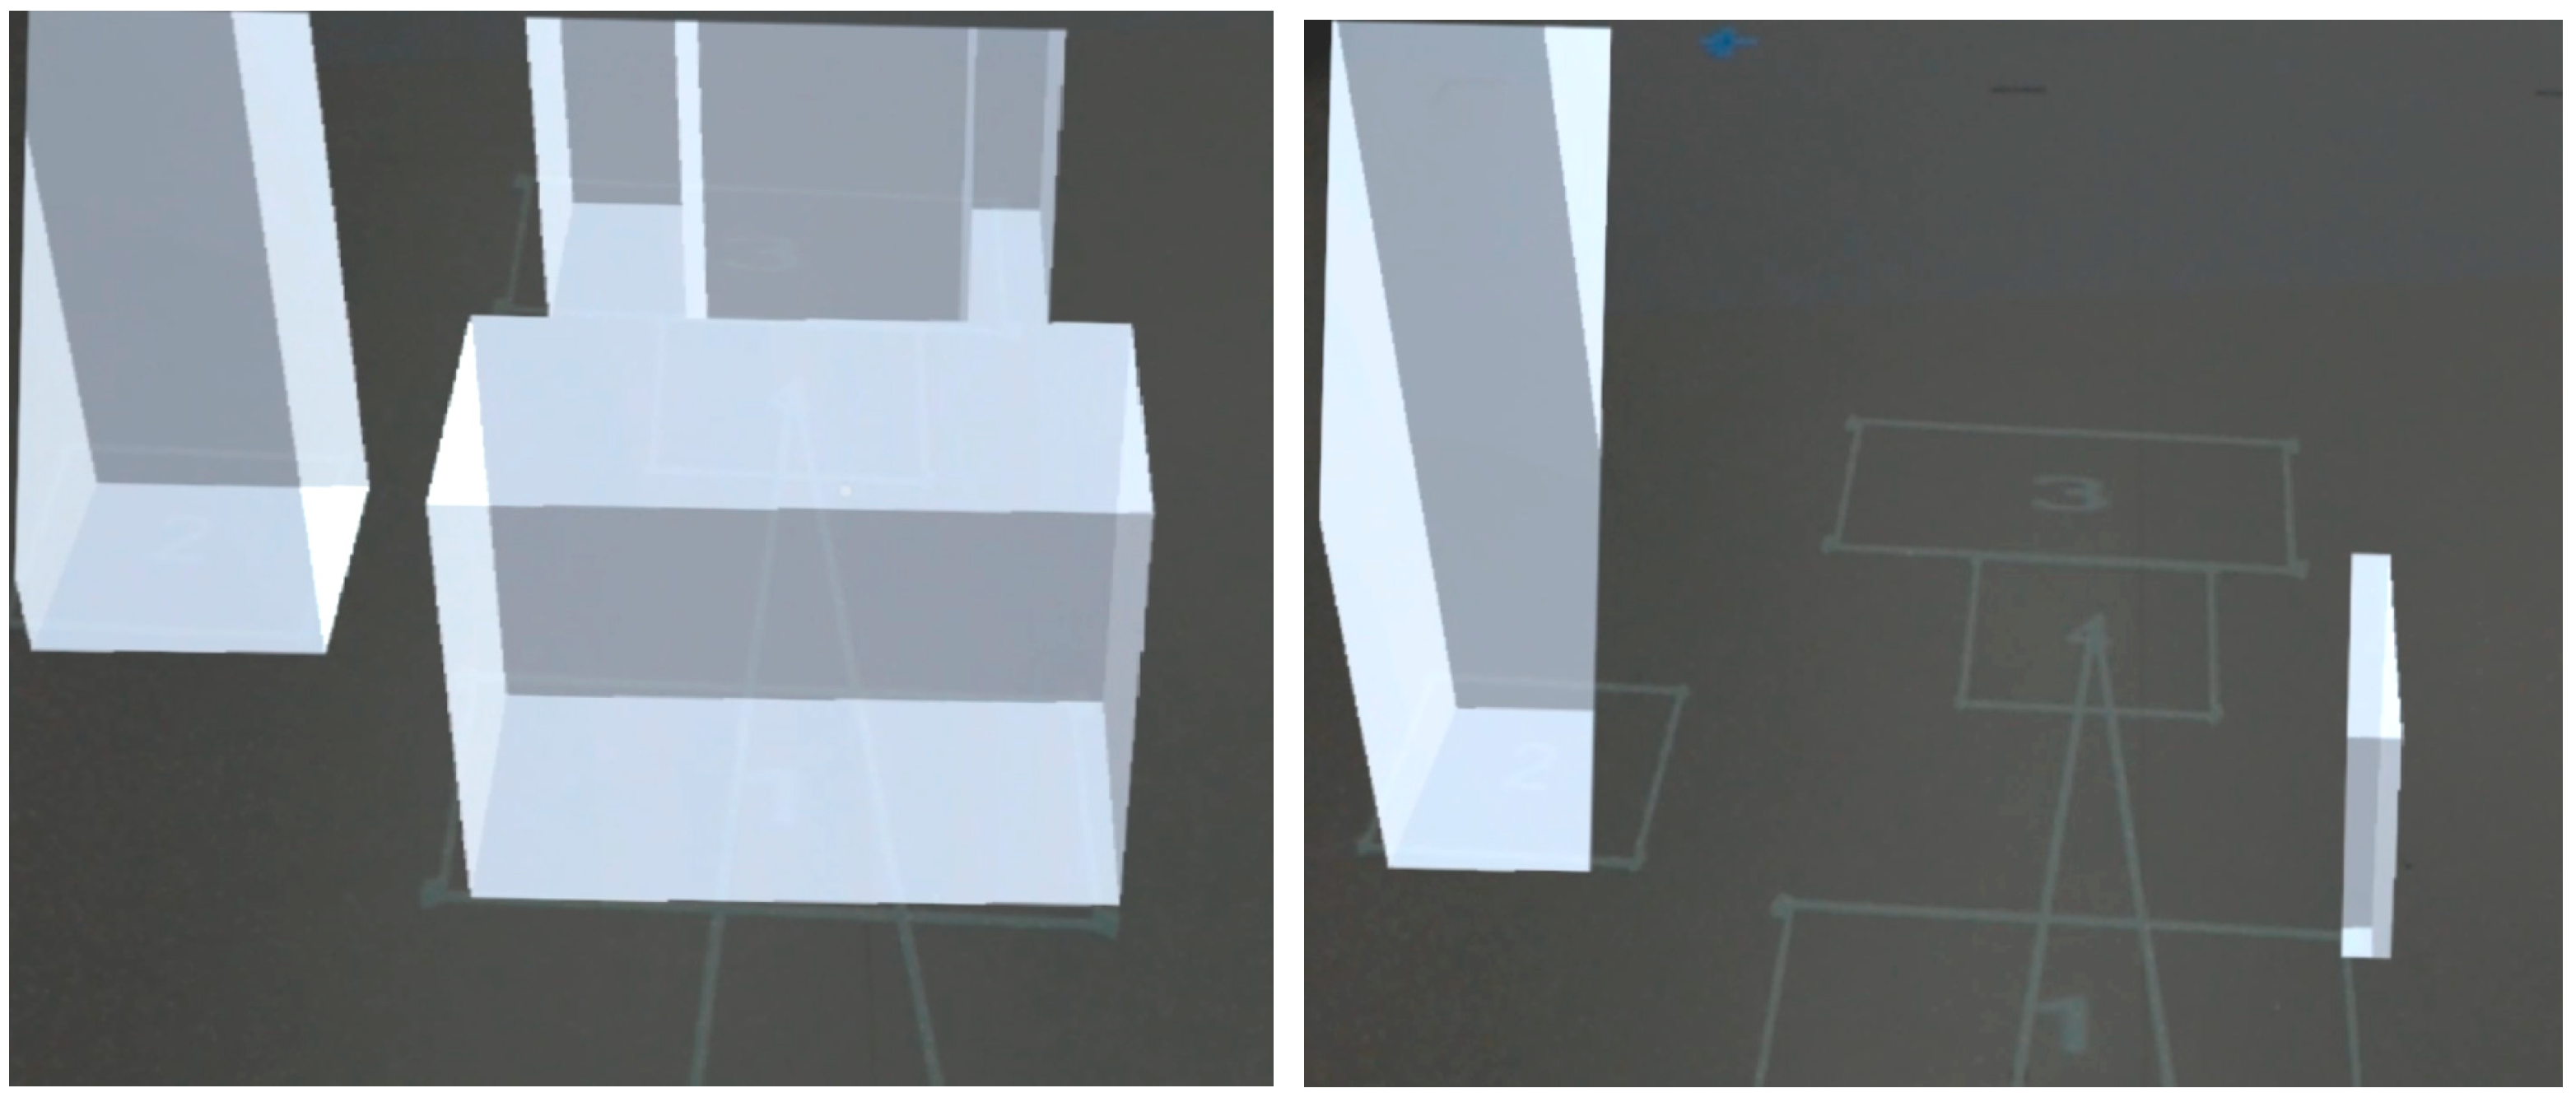
4.2. Example: SAR: Tram Lines, HMD: Partially Self-transparent, Filter: Cutout
The tram lines present a guide from the user’s location to the object of focus in the HMD, with the lines converging at that location. The lines are visible from under the bottom of the HMD’s FOV, given they are rendered from the user’s feet (regardless of their location in the scene). The use of a partially self-transparent HMD rendering allows the lines to potentially be visible under the semi-opaque 3D renderings, however when used with the cutout filter that hides all rendering in the middle of the user’s HMD, the cutout mask’s width is slightly larger than the spacing of the tram lines either side of the user (Figure 14). This means that when user is looking forward to the focal point of the tram lines, the lines are completely visible, unimpeded by HMD content, from the user’s feet all the way to the location of interest. As per the previous example, we can leverage the pairing of a geometric rendering of the object in the HMD with a line-based rendering in SAR.
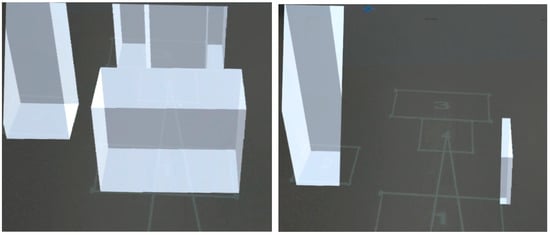
Figure 14.
Tramlines converging on the middle of object four which the user is focused on in the HMD, showing unfiltered (left) and filtered (right) views using the cutout technique to mask augmentations in the vertical region in the middle of the user’s FOV.
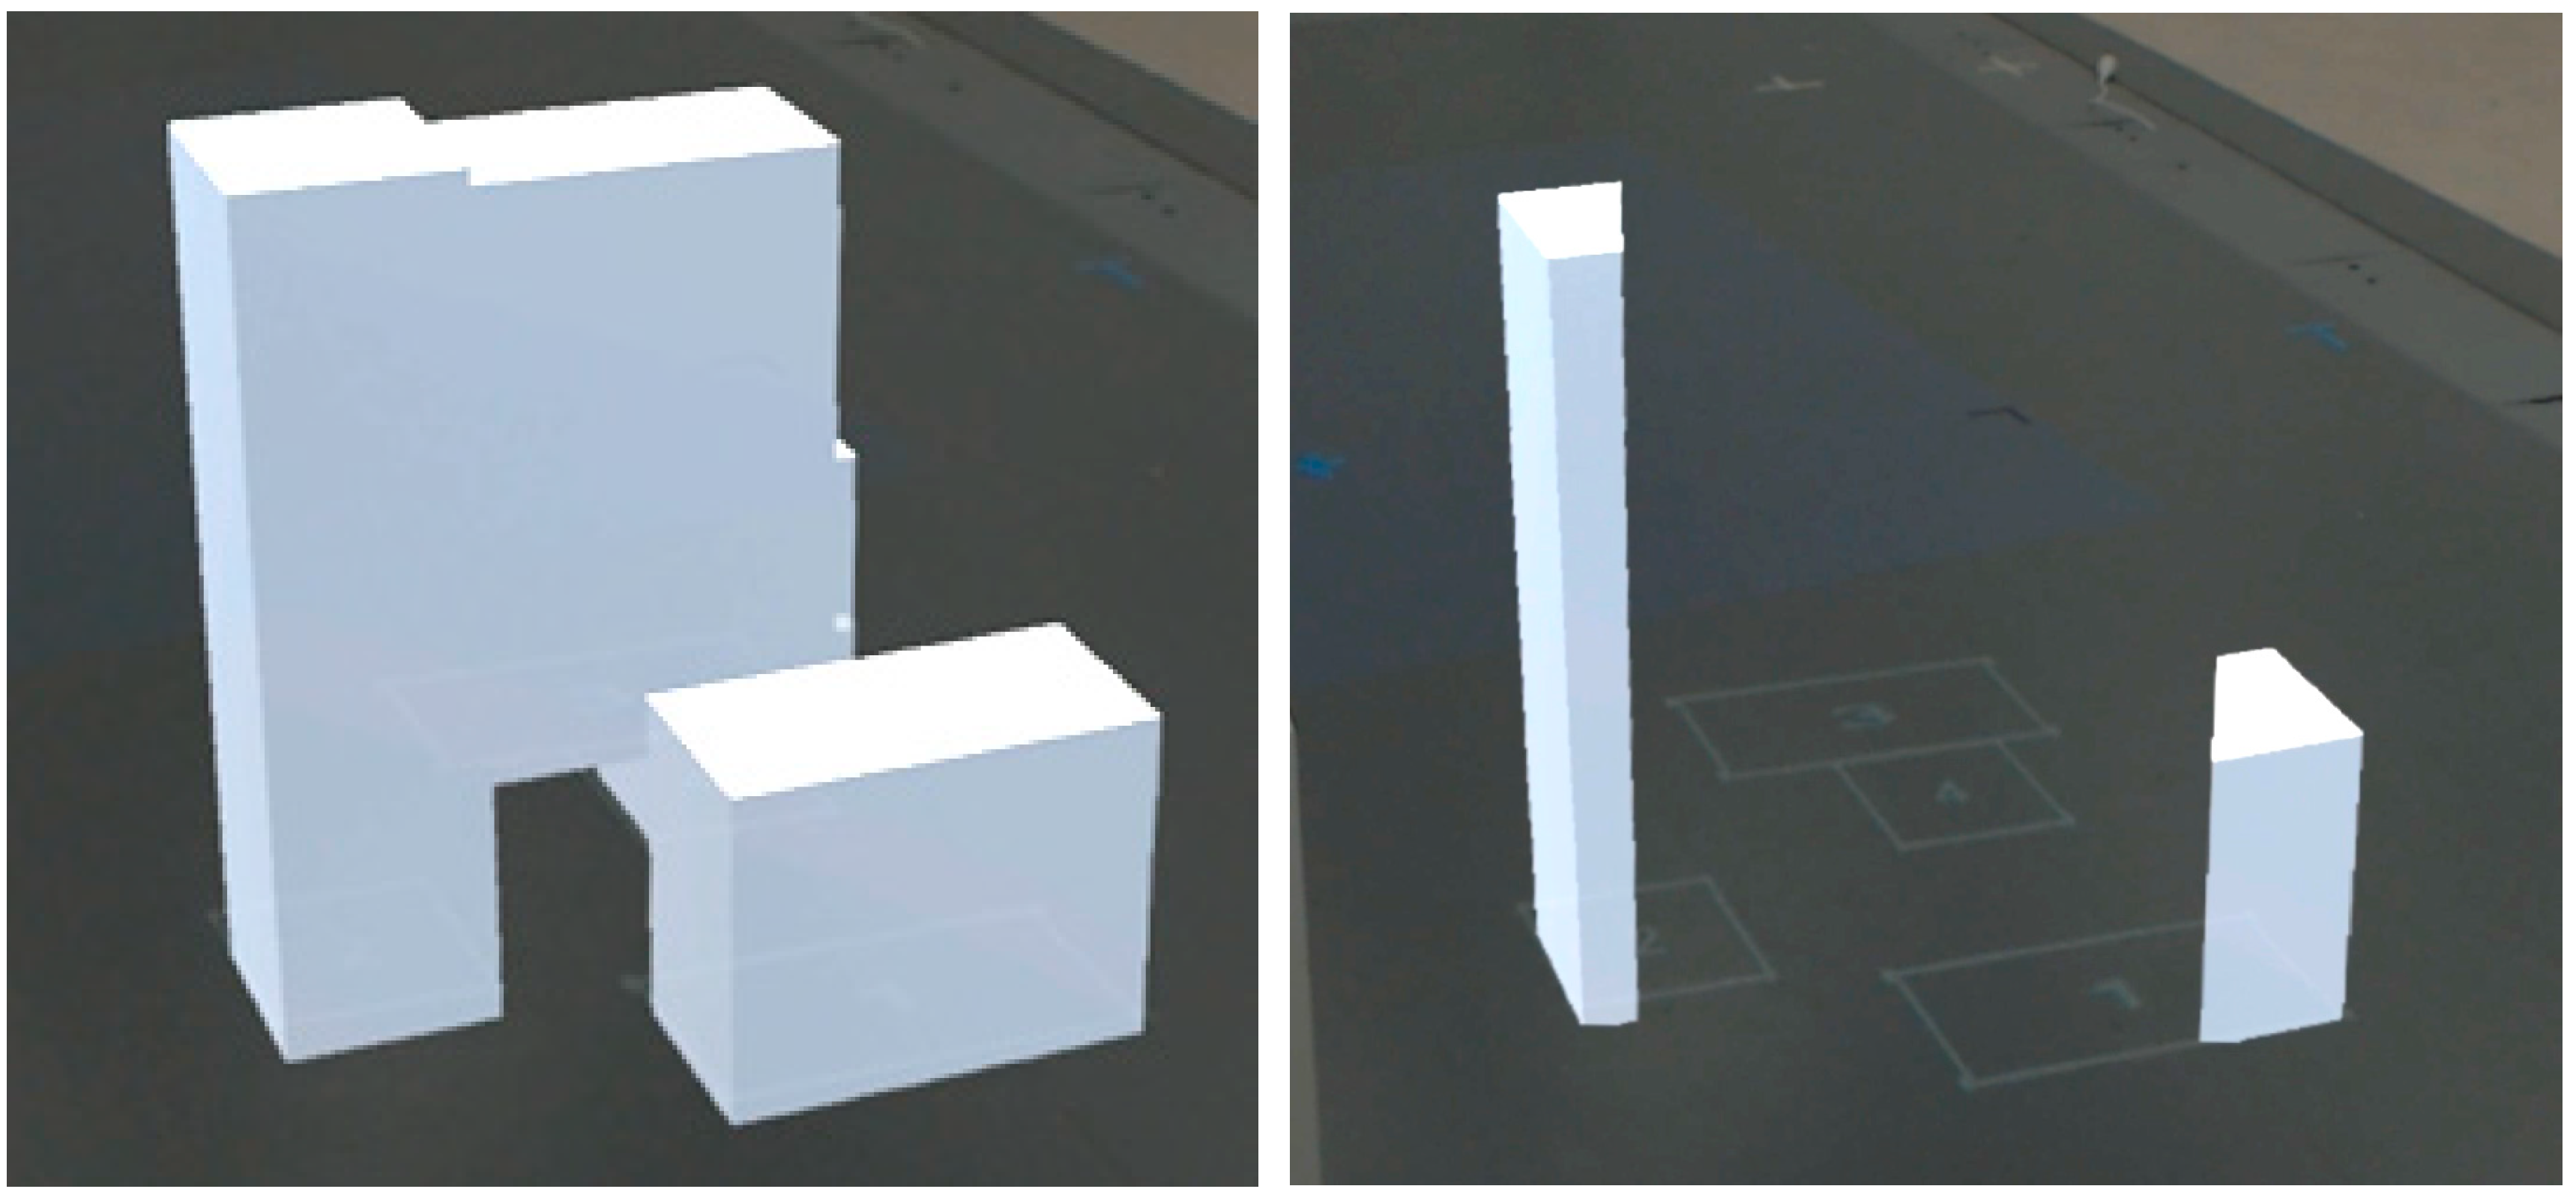
4.3. Example: SAR: Filled, HMD: Wireframe, Filter: Cutout
Using the wireframe HMD rendering with either simplistic models or placeholder geometry (e.g., rectangular prisms), the user can see a simplistic rendering of the scene, without obscuring the real world at all (Figure 15). Whilst the wireframe is transparent to the real world, it is opaque to other wireframes in the scene. For the cases of simple geometry, the opposing sides of vertical triangles can be used as a hint for the height of the object, as the closer to the parallel lines, the taller the object. Given the increased number of line renderings in the HMD, we can utilize a localized position technique in SAR. This could either use a filled outline or radial outline that will be visible through the wireframe rendering (given the use of a solid color rather than projected lines that are cluttered by the HMD wireframes). The projected SAR indicators are thus visible through the rendering. This is more useful for problem spaces where the 3D models are not required to have high fidelity. In contrast, we focus on issues with location, relative placement, and collisions between objects in the scene, such as in the architecture and construction domains.
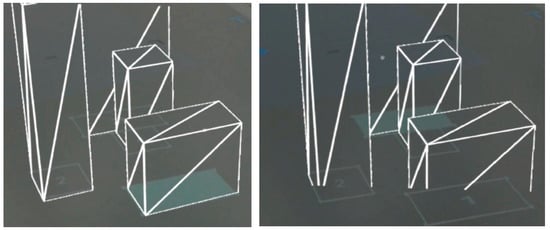
Figure 15.
Selecting the front object one (left) and object four at rear (right). Cropping of the HMD FOV is visible given the clipping of the bottom of the boxes on the right image.
4.4. Comparing and Discussing These Three Combinations
The above examples represent different combinations of the techniques, addressing different potential needs of the end user’s application domain; for example, are high-fidelity 3D models required in the HMD as part of the task, or is the user more interested in the layout, rather than the content? By mixing the use of line and geometry rendering, in addition to local and global techniques, we identify pairings of techniques. Whilst the above individual techniques and the identified pairings are by no means exhaustive, they serve to inspire discussion around the different ways we can leverage benefits across modalities, given their clear complimentary aspects.
5. Conclusions and Future Work
Whilst previous work has extensively examined how position and depth cues and indicators can be used in HMD-based AR, they have failed to examine how to leverage multiple different AR modalities working together. By combining an HMD and projector, each modality can help counter the other’s weaknesses, enabling a larger FOV, whilst displaying content mid-air. For applications, such as CADwalk, that render a large amount of digital content to the user, it is important that this content, presented in both modalities, can be correlated/fused by the user across the three realms (real world, SAR, HMD). The user must be able to know where HMD content is in the projected realm, and vice versa. These visual indicators can either be local or global in space, and utilize either line- or polygon-based rendering, with the potential for animation. Where possible, visual indicators should seek to minimize the addition of content into the scene.
Following previous work, four SAR visual indicators were identified—grid, tram lines, filled outline, and radial outline—existing across local and global space, and line and polygon rendering. These indicators utilize basic projection (no stereovision). Complimenting the SAR techniques, three HMD techniques were presented: opaque, self-transparent, and wireframe. Whilst all local in space, these used a mix of high-poly and low-poly models, and a mix of polygon rendering and line rendering. This mix allows the user to either focus on high fidelity 3D HMD models if required, or focus on the abstract relationship between objects within the scene (e.g., for identifying collisions). These indicators can then be paired together across the design space, so a polygon-based technique can be mixed with a line-rendering technique. Using these pairings, we can leverage the complimentary features of each modality. Two filtering techniques were also identified, allowing the user to filter HMD content to focus on the real and projected worlds. Whilst the techniques identified are not exhaustive, they represent the first step in complimentary, cross-modality AR. Whilst the techniques presented in this work are not novel themselves (rather the combination is novel), future work will seek to evaluate them. Evaluation could include evaluating pairings of the indicators, with users asked to identify numbered objects that exist in both AR modalities, and testing the user’s ability to fuse AR content together by evaluating correct responses, response time, and head movement.
The HMD techniques described focused on how to identify a selected object of interest in the HMD, rather than explicit HMD depth cues. As discussed in the background section, significant prior work has examined a variety of depth cues for HMDs across both video-see-through and optical-see-though displays. The majority of these additional techniques remain valid in this context and can be used in addition to the indicators described previously in this section, e.g., the impact of motion parallax or use of different shading models. As such, future work can examine how the identified indicators, with others, can be used with the “traditional” depth and position cues, across both stereo and mono displays, further enriching the fusion across the projected, head-worn, and real-world realms. Given the complimentary nature of projection and HMD modalities, future work can also seek to explore how these modalities can work together as a single AR system, for example, how the filters can be toggled and how the user can switch between indicators. In addition, future work can seek to incorporate handheld devices as a third modality, exploring the different attributes across the modalities.
Future work in this area is crucial as individual AR modalities inevitably have specific deficiencies. However, when applied to industry, these deficiencies are multiplied in severity. Whilst the long-term solutions to these deficiencies lay in addressing the fundamental problems with the display technologies themselves, multi-modality AR provides fertile ground from which solutions can be developed today through complimentary AR modalities. As such, one of the keys for industry’s widespread adoption of AR may be the utilization of multi-modal AR, rather than waiting for perfect display AR hardware. Whilst not exhaustive, this work represents the first step towards effective cross-modal AR design.
Author Contributions
Conceptualization, J.W. and B.H.T.; software, J.W.; writing—original draft preparation, J.W.; writing—review and editing, B.H.T.; All authors have read and agreed to the published version of the manuscript.
Funding
This work was funded by the Innovative Manufacturing CRC.
Acknowledgments
The authors would like to thank JumboVision International for their input.
Conflicts of Interest
The authors declare no conflict of interest.
References
- Raskar, R.; Welch, G.; Fuchs, H. Spatially augmented reality. In Proceedings of the International Workshop on Augmented Reality: Placing Artificial Objects in Real Scenes: Placing Artificial Objects in Real Scenes, San Francisco, CA, USA, 1 November 1999; pp. 63–72. [Google Scholar]
- Ong, S.K.; Yuan, M.L.; Nee, A.Y.C. Augmented reality applications in manufacturing: A survey. Int. J. Prod. Res. 2008, 46, 2707–2742. [Google Scholar] [CrossRef]
- CADwalk: Walk Through Design Plans in Full Scale. 2020. Available online: http://www.cadwalk.global (accessed on 16 September 2020).
- Cutting, J.E.; Vishton, P.M. Perceiving Layout and Knowing Distances: The Integration, Relative Potency, and Contextual Use of Different Information About Depth. In Perception of Space and Motion; Elsevier: Amsterdam, The Netherlands, 1995; pp. 69–117. [Google Scholar]
- Cutting, J.E. Reconceiving Perceptual Space. In Looking into Pictures: An Interdisciplinary Approach to Pictorial Space; MIT Press: Cambridge, MA, USA, 2003; pp. 215–238. [Google Scholar]
- Uratani, K.; Machida, T.; Kiyokawa, K.; Takemura, H. A study of depth visualization techniques for virtual annotations in augmented reality. In Proceedings of the IEEE Proceedings, Virtual Reality, 2005, Bonn, Germany, 12–16 March 2005; pp. 295–296. [Google Scholar]
- Furmanski, C.; Azuma, R.; Daily, M. Augmented-reality visualizations guided by cognition: perceptual heuristics for combining visible and obscured information. In Proceedings of the Proceedings. International Symposium on Mixed and Augmented Reality, Darmstadt, Germany, 1 October 2002; pp. 215–320. [Google Scholar]
- Livingston, M.A.; Dey, A.; Sandor, C.; Thomas, B.H. Pursuit of “X-Ray Vision” for Augmented Reality. In Human Factors in Augmented Reality Environments; Huang, W., Alem, L., Livingston, M.A., Eds.; Springer: New York, NY, USA, 2013; pp. 67–107. [Google Scholar]
- Schoenfelder, R.; Schmalstieg, D. Augmented Reality for Industrial Building Acceptance. In Proceedings of the 2008 IEEE Virtual Reality Conference, Reno, NE, USA, 8–12 March 2008; pp. 83–90. [Google Scholar]
- Avery, B.; Sandor, C.; Thomas, B.H. Improving Spatial Perception for Augmented Reality X-Ray Vision. In Proceedings of the 2009 IEEE Virtual Reality Conference, Lafayette, LA, USA, 14–18 March 2009; pp. 79–82. [Google Scholar]
- Zollmann, S.; Kalkofen, D.; Mendez, E.; Reitmayr, G. Image-based ghostings for single layer occlusions in augmented reality. In Proceedings of the 2010 IEEE International Symposium on Mixed and Augmented Reality, Seoul, Korea, 13–16 October 2010; pp. 19–26. [Google Scholar]
- Marreiros, F.M.M.; Smedby, Ö. Stereoscopic static depth perception of enclosed 3D objects. In Proceedings of the ACM Symposium on Applied Perception, Dublin, Ireland, 22–23 August 2013. [Google Scholar]
- Thomas, B.H. Examining User Perception of the Size of Multiple Objects in Virtual Reality. Appl. Sci. 2020, 10, 4049. [Google Scholar] [CrossRef]
- Azuma, R.; Furmanski, C. Evaluating label placement for augmented reality view management. In Proceedings of the Second IEEE and ACM International Symposium on Mixed and Augmented Reality, 2003. Proceedings., Tokyo, Japan, 10 October 2003; pp. 66–75. [Google Scholar]
- Peterson, S.D.; Axholt, M.; Ellis, S.R. Label segregation by remapping stereoscopic depth in far-field augmented reality. In Proceedings of the 2008 7th IEEE/ACM International Symposium on Mixed and Augmented Reality, Cambridge, UK, 15–18 September 2008; pp. 143–152. [Google Scholar]
- Peterson, S.D.; Axholt, M.; Cooper, M.; Ellis, S.R. Visual clutter management in augmented reality: Effects of three label separation methods on spatial judgments. In Proceedings of the 2009 IEEE Symposium on 3D User Interfaces, Lafayette, LA, USA, 14–15 March 2009; pp. 111–118. [Google Scholar]
- Kruijff, E.; Orlosky, J.; Kishishita, N.; Trepkowski, C.; Kiyokawa, K. The Influence of Label Design on Search Performance and Noticeability in Wide Field of View Augmented Reality Displays. IEEE Trans. Vis. Comput. Graph. 2019, 25, 2821–2837. [Google Scholar] [CrossRef] [PubMed]
- Adcock, M.; Feng, D.; Thomas, B.H. Visualization of off-surface 3D viewpoint locations in spatial augmented reality. In Proceedings of the 1st symposium on Spatial User Interaction, Los Angeles, CA, USA, 20–21 July 2013. [Google Scholar]
- Ping, J.; Thomas, B.H.; Baumeister, J.; Guo, J.; Weng, D.; Liu, Y. Effects of Shading Model and Opacity on Depth Perception in Optical See-Through Augmented Reality. J. Soc. Inf. Disp. 2020. [CrossRef]
- Hill, A.; Schiefer, J.; Wilson, J.; Davidson, B.; Gandy, M.; MacIntyre, B. Virtual transparency: Introducing parallax view into video see-through AR. In Proceedings of the 2011 10th IEEE International Symposium on Mixed and Augmented Reality, Basel, Switzerland, 26–29 October 2011; pp. 239–240. [Google Scholar]
- Pucihar, K.Č.; Coulton, P.; Alexander, J. Creating a stereoscopic magic-lens to improve depth perception in handheld augmented reality. In Proceedings of the 15th international conference on Human-computer interaction with mobile devices and services, Munich, Germany, 27–30 August 2013. [Google Scholar]
- Marner, M.R.; Irlitti, A.; Thomas, B.H. Improving procedural task performance with Augmented Reality annotations. In Proceedings of the 2013 IEEE International Symposium on Mixed and Augmented Reality (ISMAR), Adelaide, SA, Australia, 1–4 October 2013; pp. 39–48. [Google Scholar]
- Baumeister, J.; Ssin, S.Y.; Elsayed, N.A.M.; Dorrian, J.; Webb, D.P.; Walsh, J.A.; Simon, T.M.; Irlitti, A.; Smith, R.T.; Kohler, M.; et al. Cognitive Cost of Using Augmented Reality Displays. IEEE Trans. Vis. Comput. Graph. 2017, 23, 2378–2388. [Google Scholar] [CrossRef] [PubMed]
- Benko, H.; Wilson, A.D.; Zannier, F. Dyadic projected spatial augmented reality. In Proceedings of the 27th annual ACM symposium on User interface software and technology, Honolulu, HI, USA, 20–23 October 2014. [Google Scholar]
- Kulik, A.; Kunert, A.; Beck, S.; Reichel, R.; Blach, R.; Zink, A.; Froehlich, B. C1x6: A stereoscopic six-user display for co-located collaboration in shared virtual environments. ACM Trans. Graph. 2011, 30, 1–12. [Google Scholar] [CrossRef]
- Schmidt, S.; Steinicke, F.; Irlitti, A.; Thomas, B.H. Floor-Projected Guidance Cues for Collaborative Exploration of Spatial Augmented Reality Setups. In Proceedings of the 2018 ACM International Conference on Interactive Surfaces and Spaces, Tokyo, Japan, 25–28 November 2018. [Google Scholar]
- Broecker, M.; Thomas, B.H.; Smith, R.T. Adapting ray tracing to Spatial Augmented Reality. In Proceedings of the 2013 IEEE International Symposium on Mixed and Augmented Reality (ISMAR), Adelaide, Australia, 1–4 October 2013; pp. 1–6. [Google Scholar]
- Baumeister, J.; Marner, M.R.; Smith, R.T.; Kohler, M.; Thomas, B.H. Visual Subliminal Cues for Spatial Augmented Reality. In Proceedings of the 2015 IEEE International Symposium on Mixed and Augmented Reality Workshops, Fukuoka, Japan, 29 September–3 October 2015; pp. 4–11. [Google Scholar]
- Broecker, M.; Smith, R.T.; Thomas, B.H. Depth perception in view-dependent near-field spatial AR. In Proceedings of the Fifteenth Australasian User Interface Conference-Volume 150, Auckland, New Zealand, 20–23 January 2014; Volume 150, pp. 87–88. [Google Scholar]
- Irlitti, A.; Piumsomboon, T.; Jackson, D.; Thomas, B.H. Conveying spatial awareness cues in xR collaborations. IEEE Trans. Vis. Comput. Graph. 2019, 25, 3178–3189. [Google Scholar] [CrossRef] [PubMed]


© 2020 by the authors. Licensee MDPI, Basel, Switzerland. This article is an open access article distributed under the terms and conditions of the Creative Commons Attribution (CC BY) license (http://creativecommons.org/licenses/by/4.0/).