Abstract
The ability of a robot to detect and join groups of people is of increasing importance in social contexts, and for the collaboration between teams of humans and robots. In this paper, we propose a framework, autonomous group interactions for robots (AGIR), that endows a robot with the ability to detect such groups while following the principles of F-formations. Using on-board sensors, this method accounts for a wide spectrum of different robot systems, ranging from autonomous service robots to telepresence robots. The presented framework detects individuals, estimates their position and orientation, detects groups, determines their F-formations, and is able to suggest a position for the robot to enter the social group. For evaluation, two simulation scenes were developed based on the standard real-world datasets. The 1st scene is built with 20 virtual agents (VAs) interacting in 7 different groups of varying sizes and 3 different formations. The 2nd scene is built with 36 VAs, positioned in 13 different groups of varying sizes and 6 different formations. A model of a Pepper robot is used in both simulated scenes in randomly generated different positions. The ability for the robot to estimate orientation, detect groups, and estimate F-formations at various locations is used to determine the validation of the approaches. The obtained results show a high accuracy within each of the simulated scenarios and demonstrates that the framework is able to work from an egocentric view with a robot in real time.
1. Introduction
Group interactions are common and occur naturally in human interactions. A mobile robot with social interaction capabilities must be able to engage in dyadic interactions (a robot and a human) or group interactions (a robot and multiple humans). To promote a conducive interaction, robots should adhere to the norms and behaviours in group interactions. To this end, mobile robots need to develop methods to follow socially appropriate behaviour, such as joining the group interaction in a manner that is acceptable to humans.
In the literature, a lot of focus has been dedicated to dyadic interaction [1] and less so on group interaction per se [2]. For example, there are works which aim to design models for robots to appropriately approach a human to initiate a conversation [3,4] and to maintain appropriate distance with a human during interaction [5]. With a recent shift of focus towards group interaction, however, new application areas have emerged, such as surveillance [6,7,8], playing games with groups of people [9,10], studying human behaviour in a group interaction [2,11], and tracking groups [12,13,14,15]; while relevant for understanding group dynamics, there still remains a gap in the research on how to ensure that robots are able to join an ongoing group interaction. Most of the works mentioned here do not use a robot in their experiments and some works which do use a robot consider the robot to be a part of the group.
For a robot to join an ongoing group interaction, both group detection and group pattern identification are important aspects to be considered. Two theories dominate in the literature, namely proxemics and F-formations. Proxemics was proposed by Hall and considers the interpersonal distances between people in a face-to-face interaction [16]. Kendon proposed the theory of F-formations [17,18], which are said to arise "... whenever two or more people sustain a spatial and orientational relationship in which the space between them is one to which they have equal, direct and exclusive access." (p. 209, [17]). These are spatial (group) patterns in which people configure themselves during social interactions. These theories are discussed in-detail in Section 2.1.
In this context, most of the functional models which consider group detection rely on cameras placed externally in the scene, that makes these systems impractical or unfeasible to implement on a mobile robot [1].
Additionally, other methods rely on learning algorithms, which requires training models on large datasets of diverse group interactions [13,14,15,19]. The number of people in the groups and the number of groups in the scene are not constant and vary accordingly, i.e., people could leave/join a group or a group could leave/join the scene. The exocentric approaches also raise significant privacy concerns [20,21,22,23,24,25].
Regarding group patterns estimation, not many functional models are proposed. Some of our works [26,27] are proposed to estimate F-formations, but study small groups sizes, i.e., two or three people per group. Recently, few works are proposed in regards to mobile robot using on-board sensors to interact with group. However, the number of groups in the scene is limited, i.e., one group [28] and two groups [29] with only two or three people per group, and limited patterns, i.e., four patterns, were studied. These research gaps suggest a need for robot-centric approaches, which detect groups and estimate F-formations to join the ongoing social group interactions in the scene.
To address these gaps, we propose a new framework called autonomous group interactions for robots (AGIR), for a robot to join ongoing social group interactions from an egocentric perspective. The framework comprises four main steps—processing egocentric data, detecting groups, estimating F-formations, and estimating optimal position for the robot in the group to join the interactions. While processing egocentric data, the robot perceives the scene using on-board sensors and extracts hand-engineered features. These features are used to detect groups in the scene in the second step. In the third step, the robot recognizes the patterns of the groups by estimating F-formations. Finally, in the fourth step, the robot finds the optimal spot and joins the ongoing social group interactions, as shown in Figure 1. The steps in the red rectangle in the figure are addressed in this paper.
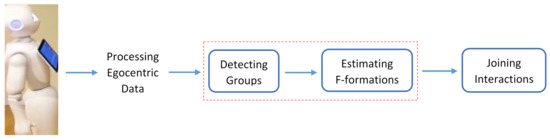
Figure 1.
In our framework, the robot joining an ongoing social group interaction involves four steps. First, robot perceives the scene using on-board sensors and extracts hand-engineered features. Second, the features are used to detect groups in the scene. Furthermore, the robot recognizes the patterns of groups by estimating the F-formations, and, finally, the robot finds the optimal spot and joins the ongoing social group interactions. The steps in the red rectangle—detecting groups and estimating F-formations—are addressed in this paper.
In this paper, we propose approaches to estimate the orientational information of people, detect groups, and estimate F-formations from an egocentric view in regard to mobile robots. The spatial and orientational information of people are estimated by processing the egocentric data, which are used to detect the groups in the scene and estimate the F-formations. Usually, robots use sensors such as lasers, depth cameras, sonar, and more to extract the spatial information of people in a scene. However, the orientational information is difficult to process as people are far away from the robot, in different poses, and at times not facing the camera. An approach which deals with these from an egocentric view is proposed. These features are used to develop an approach to detect groups and the responses are used to develop approaches to estimate the F-formations in the scene. These said approaches are integrated in the AGIR framework for the robot to join the ongoing social group interactions in the scene.
The major contributions of our work in this paper are: (a) a novel approach for human orientation estimation based on the visibility of facial keypoints; (b) a new approach to detect and identify interaction groups using the concept of O-spaces from F-formation and transactional segments; (c) a new approach for estimating F-formations using a polynomial Ssupport vector machine (SVM) classifier; (d) a novel algorithm for estimating F-formations by analysing the patterns of group interactions; (e) an AGIR framework to allow the theoretical approach to be incorporated into mobile robots with egocentric camera placement; (f) evaluation of the approaches from an egocentric view, using two simulation scenes, one based on the real-world dataset and second based on our previous work which consists of multiple groups (13) positioned in different (6) formations.
The paper is organized as follows: Section 2 presents information on F-formations theory and an overview of previous works. Section 3 presents our approaches in detail, with individual components involved in every approach. Section 4 presents details of the coffee dataset, and the simulation scenes built to evaluate our approaches. Section 5 describes about the evaluation process, ground truth annotation process, and the metrics used to evaluate our approaches. The evaluation of our approaches and the concerned results are presented in Section 6. Section 7 presents the limitations of our framework and future research directions while addressing them. Finally, we conclude the paper in Section 8.
2. Background and Related Works
In this section, proxemics and F-formations theories are detailed, along with related works in the context of our work.
2.1. Background
In interactions, people tend to position themselves based on different factors, such as culture, gender, status, age, familiarity, relationship, pose, etc., see [30]. Proxemics addresses the interpersonal distances between people as shown in Table 1. Many works [31,32,33] have used proxemics and performed experiments. Their investigations suggest that human and robot interaction occurs in personal and social spaces. Particularly, social spaces are used for social interactions, and also substantially reflect and influence the social relationships of people to each other [34,35].

Table 1.
Interpersonal distances of people.
These works discuss the spaces between people mostly in dyadic interactions, where people in group interactions tend to possess spatial and orientational relationship with each other. The group members configure themselves into different patterns, regarding which, four standard F-formations, independent of the physical constraints [17,18], were proposed. They are: vis-a-vis, side-by-side, L-shape, and circular formations. The vis-a-vis formation is when two people are facing each other while interacting. The side-by-side formation is when two people stand close to each other and face in the same direction while conversing. The L-shape formation is when two people face each other perpendicularly and where it appears as if they are standing on the two edges of the letter “L”. The circular formation is when three or more people are conversing in a circle. F-formations define three spaces. O-space is the empty space between people involved in the interaction. P-space is the narrow strip on which people stand while conversing. R-space is the space beyond the P-space, as seen in Figure 2e. The standard F-formations are shown in Figure 2.
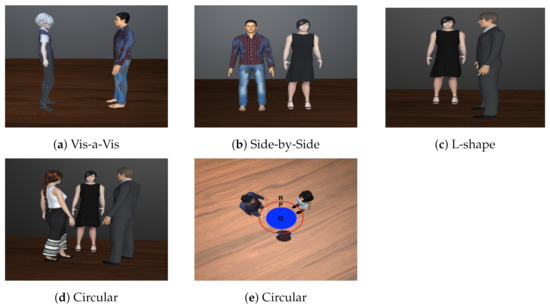
Figure 2.
(a–d) present the four F-formations. (d,e) represent the same circular formation, (d) presents the ego-centric view, and (e) presents the top view. F-formations define three spaces. O-space is the empty space between people involved in the interaction. P-space is the narrow strip on which people stand while conversing. R-space is the space beyond the P-space, as seen in (e).
In addition, the authors from [36,37] proposed three formations that are formed in a spatially constrained environment. The triangular formation occurs when two people standing close to each other are facing one person standing at a farther distance from them. The rectangular formation is formed in board meeting rooms or at dinner tables. The semi-circular formation occurs when three or more people are focusing on the same task while interacting, such as in an art gallery in front of an art piece, shown in Figure 3.
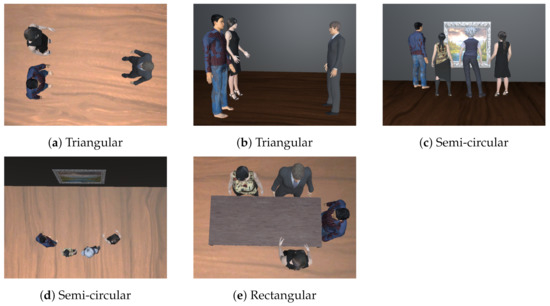
Figure 3.
(a,c,e) present the constraint-based formations. (a,b) represent the triangular formation. (a) presents the top view whereas (b) presents the ego-centric view. (c,d) present the semi-circular formation, (c) the ego-centric view, and (d) the top view.
Most of the works consider only the four standard F-formations, whereas in our case we consider six formations, which are: vis-a-vis, L-shape, side-by-side, circular, triangular, and semi-circular formations. The rectangular formation is a peculiar design and mostly found in a meeting room or around the dinner table, and we could not come up with an approach for this formation because of its peculiar design.
2.2. Related Works
Related works associated with the main contributions of this paper are presented sequentially in the order of the stages in the framework, i.e., head orientation, group detection, and estimating F-formations, as presented in Figure 1.
2.2.1. Head Orientation
Developing methods to automatically detect groups from an egocentric view requires addressing sub-challenge—head pose detection, face orientation, or body orientation detection. There are many approaches for estimating head pose [38]. These approaches are used in different applications or scenarios, based on whether the approaches can be roughly categorized into two classes: interaction-based methods [39,40,41,42] and non-interaction-based methods [43,44,45]. In interaction-based methods, head orientation is primarily used to determine head pose, in particular, yaw with intervals. For example, the head orientation of a person from left to right is divided into −90, −45, 0, 45, 90. In non-interaction-based methods, the approaches deal with head pose (yaw, roll, and pitch) of people from close range, i.e., the exact degrees of orientation. For example, 35 yaw, 45 roll, 20 pitch. When it comes to the detection of head pose in group interactions, in [39], it is argued that many social interactions do not necessarily require a finer subdivision of the orientations. Instead, few yaw angles or facing directions would suffice in the context of detecting social interactions in groups. In this regard, in [40], orientation of head was estimated based on the skin detection and discretized into eight different orientations. A weight image is computed for five consecutive frames, but this work is in videos. A novel descriptor was presented and named as a weighted array of covariances considering a multiclass classification scenario using the head and body orientation [41]. Another method [39] estimates head pose from an egocentric view in social interactions. The method uses a Hough-based tracker [46] to track the non-rigid target and, finally, the target is segmented using the GrabCut algorithm [47]. The work is in egocentric videos and the target image is initialized when its frontal face is observed, which indicates the method would have trouble when the person is not facing the camera. Head poses were used to detect groups through a supervised clustering approach [48].
In sum, detecting groups from an egocentric view in regard to a mobile robot also requires estimating the head/face pose and/or body orientation with little computation cost, in real time, at times from farther distances (4–5 m). In addition, it is necessary to simultaneously detect poses for multiple people and—most importantly—estimate the 360 orientation, i.e., in all the directions, even when the person is not facing the camera.
2.2.2. Detecting Groups
In the literature, group detection was accomplished through different processes, such as body-worn sensors [49,50], audio-based frameworks [51], clustering approaches [48,52], deep learning [53], and more.
Our focus in regards to group detection is on robots joining a group interaction. Regarding this, much of the previous works related to social positioning of robots in groups use the sociology theory of F-formation, which discusses the social positioning of people in groups. This theory models groups in the scene, based on sustained spatial and orientational relationship among group members, which resulted in a good amount of studies. Cristani et al. [6] proposed a Hough voting strategy, used to locate the O-space, which in return provides the groups of conversing people. The O-space is an empty space between a group of people involved in an interaction. Hung et al. [54] built a graph model in which nodes represent the people and edges the pair-wise relation between people, using which, an affinity is built to find the dominant set. Setti, in their work surrounding group detection, proposed two different approaches. Another Hough voting strategy approach was developed for detecting groups, which employs the weighted Boltzmann entropy for scoring group hypothesis [55]. A new approach was developed to detect groups in still images, presented based on a graph-cuts framework for clustering individuals. They are able to systemise the F-formation theory through only the position and orientation of people, and named the approach graph-cuts for F-formation (GCFF) [7]. Vascon et al. [8] developed a game theoretic framework, embedding the socio-psychological concept of F-formations and the biological constraints of social attention to detect groups by generating a frustum of people to compute their affinity. Ricci et al. [56] proposes a joint learning framework for the individuals’ heads, body orientations, and F-formations in videos. Zhang et al. [57] proposed extracting features from individuals and classifying them as associates, singletons, and members of F-formations using the frustum of attention of individuals in the scene. A given person’s lower body is used for detecting the F-formations, which are obtained by tracking the position and orientation of people in a scene [58]. Recently, deep learning algorithms have also been proposed to detect groups. Long short-term memory, an artificial recurrent neural network (RNN), is proposed and trained with the distance between the camera and the person [59]. The person’s head orientation is used as an input feature to detect the social interactions. Vazquez et al. [60] proposed deep affinity network for clustering conversational interactants (DANTE), a novel deep affinity network to predict the likelihood that two individuals in a scene belong to the same group, considering their social context. A graph clustering framework is used with the predicted pair-wise affinities to identify groups.
The presented works using the F-formation theory are designed for surveillance applications and work with exocentric vision [6,7,8,54,55]. Most of these approaches assume prior data, such as the spatial and orientational information of people in the scene. These methods are unfeasible and could not be easily deployed on a physical mobile robot because robots use on-board sensors and an egocentric camera view to perceive the scene [20].
2.2.3. Estimating F-Formations
In the literature, many works have studied F-formation patterns either to investigate the different F-formation arrangements that emerged during an interaction between a robot and human [61,62,63] or to investigate the quality of interaction between the robot and humans [64,65,66]. However, only a handful of works have proposed approaches to recognise the spatial patterns [28,29], which are further used to interact with groups of people.
Tseng et al. [29] proposed a complete system to interact with groups of people. This system estimates F-formation patterns using the relative angle of group members for groups of two and three people. The presented work performs better under two groups in the scene and only four patterns are studied. Recently, one more work has emerged, [28], there a machine-learning-based method is proposed to interact with the group of people. The approach considers poses of people in the group and uses the SVM classifier for predicting the F-formation. The presented work performs only for a single group in the scene and only four patterns are studied.
While these works have proposed approaches to estimate F-formations, they have two limitations. The approaches study limited patterns and limited groups, i.e., four patterns [28,29] and one group [28] or two groups [29] in the scene.
Recently, there are some deep learning based methods to join the ongoing social group interactions [67,68]. These studies investigate how robots can learn to join the groups in simulation and mainly deal with only one group in the scene. A wide variety of social interaction datasets are required for deep learning approaches to be proposed.
3. Methodology
The proposed framework, AGIR, employs a human detection approach to process egocentric RGB data captured by an on-board camera of the robot. The response from the detection algorithm are the 2D poses of people in the scene, which imply the number of people in the scene. These 2D poses encode the anatomical keypoints of humans. Using these 2D poses, the orientation of people is calculated based on the visibility of 6 facial keypoints. The spatial information of people is calculated using the on-board laser sensor. The spatial and orientational information of people is used to localize people in the scene. For this, dimensions of the scene are used, where image width represents the width of the scene and laser is used for the depth of the scene.
After localizing people in the scene, the O-spaces are distributed equally in the scene. With an assumption that each group has at least two members, the number of people in the scene enumerates the maximum number of groups possible in the scene. This also defines the number of O-spaces possible, which are then initialized (distributed) equally in the scene. People are assigned to their nearest O-space based on the distance factor. Then transactional segments are modelled for every individual in the scene and mapped onto the concerned O-spaces within the groups. If the overlap region is above the threshold, members are considered to belong to the same group. Otherwise, they are considered as singletons and a new O-space is created for each of them. The O-spaces are updated with new group members and mapped with the segments until unaltered groups are obtained. This iterative process results in the number of O-spaces and the people assigned to them, i.e., the number of groups and their members. Further proceeded with estimating F-formations, a classification approach—a polynomial SVM classifier is trained for smaller groups. For larger groups, the variance of the group, i.e., the variance of spatial and orientational information of group members are used to estimate the F-formations. The presented overview of our approach is shown in Figure 4.

Figure 4.
Overview of our framework. The robot uses on-board sensors to process the scene and extract the number of people, and the spatial and orientational information of people. These hand-engineered features are used to detect the groups—using the O-spaces and the transactional segments of people. Then, the patterns of the groups are recognized by estimating the F-formations using a classifier and the variance of group members.
3.1. Processing the Scene
The robot captures the scene from a built-in RGB camera and the image is processed through a human detection algorithm [69]. The algorithm extracts the 2D poses of people in the image and the poses encode the 18 anatomical keypoints of the humans, which represent the skeleton structure of the humans. The number of poses imply the number of people in the scene; furthermore, these poses are used to estimate the orientation of the people in the scene. The spatial information of people is acquired through an on-board laser sensor of the robot.
3.2. Estimating Orientation of the Individuals
Head pose is an important cue in understanding social interactions. At the same time, estimating head pose is a complex task with multiple people in the scene, with few people standing far away from the robot and not everyone is facing the robot. For these reasons, social interaction analysis does not require a high accuracy of the orientations [48], but rather uses facing directions, which is sufficient in the context of detecting social group interactions.
In our framework, head orientation is modelled into four distinct classes, representing the four facing directions, which are left, right, straight, and backward.
To estimate head pose, our approach considers visibility of six facial keypoints: torso, nose, two ears, and two eyes. Our approach is named visibility of 6 facial keypoints (V6KP). Based on the keypoint visibility in the source image, the head pose is classified into four classes—i.e., facing centre, facing right, facing left, and facing about—as shown in Figure 5. When a person is facing away from the camera, only the torso and ears keypoints are visible in the image. That means the person is facing about, which is considered as 0 . Then, proceeding in a clockwise direction, when the person is facing right, the person’s right ear and eye, nose, and torso points are visible in the image, and the orientation is . Approximately all six facial keypoints are visible in the image when the person is facing centre, which is considered as . Finally, when the person is facing left, the person’s left ear and eye, nose, and torso points are visible in the image, and the orientation is 3, as shown in Figure 5.
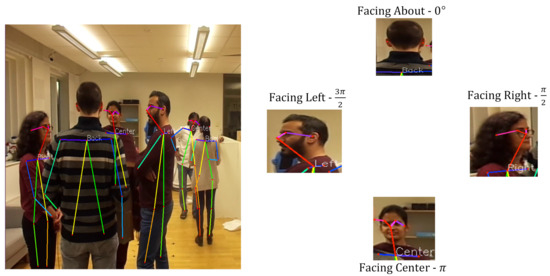
Figure 5.
V6KP estimates the head orientation of people in the scene. The left part presents one image of two groups interacting in the scene. One group comprises four members and the second group comprises two members. The right part presents four images of the individual people being detected and their head orientation is calculated for the first group. The cropped images of their head and their facing direction along with orientation are presented in the right part.
This form of estimation is very useful when the facial keypoints are translucent, lacking clear visibility due to body occlusions, and the distance between people and camera is larger. In practice, we found that this approximation is simpler and also produces good results, which can be seen in Figure 5.
The dimensions of the scene—the width and depth of the scene—are acquired through image and laser. The number of people in the scene, and the spatial and orientational information of people are used to localize people in the scene. The next task for the robot would be to detect groups in the scene.
3.3. Detecting Groups
3.3.1. Initializing O-Spaces
Social interaction occurs when two or more people form a group. The number of people, n, in the scene is acquired through the human detection algorithm [69], and the maximum number of groups, , possible in the scene are equal to the number of people by 2 (i.e., ). Each group has an O-space which indicates the number of groups is equal to the number of O-spaces in the scene. Then , which are then equally positioned (initialized) () in the scene, as given in Equation (1).
where d and w are depth and width of the scene, is the position of O-spaces, and m is the number of O-spaces in the scene.
The O-space is the empty space surrounded by the people involved in the social group interaction [6]. We refer to an O-space in Kendon’s definition, e.g., as the space between a group of people. This space could be represented as a circle [45], which is considered in our case. The idea behind our approach is to assume the O-space as a circle with radius, r, and initialize these spaces in the scene and optimize (rearrange) them in different steps, while modelling the transactional segments and map them onto the spaces, which would finally result in matching our initialized O-spaces to the original O-spaces of the groups in the scene. This way, we control our initialized O-spaces and know the exact whereabouts of our O-spaces and people assigned to them. Finally, we acquire the groups and their members in the scene.
3.3.2. Optimizing O-Spaces
Once the O-spaces are initialized, we calculate the Euclidean distances between the O-spaces and the people, as follows:
where is the distance of ith O-space to the jth person, is centre of the ith O-space, and is the spatial location of the jth person.
Based on the distance (), people are assigned to their nearest O-space. People assigned to an O-space are considered as a group. Then, using group member’s spatial locations, we calculate the mean of that particular group , as follows:
where n represents the number of people in the group and are the spatial locations of group members.
The O-spaces are then updated to the centre of the group using Equation (3). That is, the O-spaces are moved in such a way that the centre of the O-space and the mean of the group are equal. This positions the O-space in between the group members.
3.3.3. Modelling Transactional Segment
Kendon [17,18] describes an individual having a space in front of them, which is directly accessible, as a transactional segment. Transactional segments denote the space used to direct attention and carry out activities, such as watching television and manipulating objects [18,36]. The size of this space varies based on the activity. During face-to-face conversation, this is a hypothetical circular sector (CS), extending outwards from the midriff of a person’s body, covering to the left and right [17,18,36,70]—mainly in the direction of their head pose, as shown in Figure 6a. The transactional segment of each person is described by a quintuple ()—the person’s pose (), the field of view (), with the radius (), and the opening angle ().

Figure 6.
(a) The person and their transactional segment. (b) The circle is the O-space and the black shaded region indicates the overlap (mapping) of person’s transactional segment with the O-space.
3.3.4. Modelling Groups
Once the O-spaces are updated, the transactional segments of people in the scene are projected onto the O-spaces, (as seen in Figure 6b), which results in an overlapping of transactional segments with the O-spaces. In our scenario, a person belongs to the group if their overlapping area, i.e., their transactional segment overlapping with the concerned O-space, is greater than the given threshold. If the overlapping area of a person is less than the threshold, then that person is treated as a singleton and provided with an individual O-space with a centre, as given in Equation (4).
where is the radius of a person, are co-ordinates of person, and is the orientation of the person.
Once all the persons in the scene belong to at least one O-space. The Euclidean distance between the O-spaces are calculated to merge the intersecting ones, i.e., if two O-spaces intersect, then they are merged into one O-space to form one group. This optimization (iteration) process continues until the groups are stable (unaltered). This process results in the detection of groups (O-spaces) and their members. We name our approach detect groups using O-space (DGO), which is presented in Algorithm 1.
| Algorithm 1: Detecting Groups |
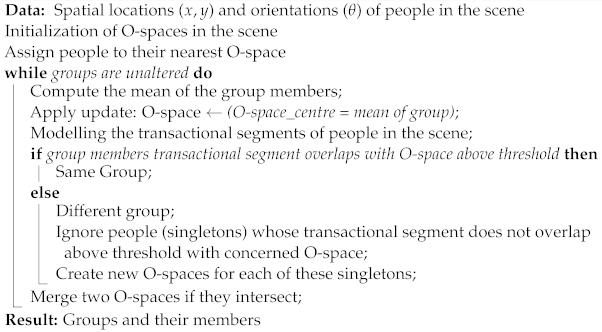 |
If the algorithm does not converge and cannot provide unaltered groups twice consecutively, then the current image frame is dropped and the process interrupts until the next frame is captured.
3.4. Estimating F-Formations
Estimating F-formations is an important step for a robot to become part of an ongoing social group interaction. F-formations denote different patterns in which people stand in group conversations. Based on the pattern, the robot could analyse the empty spots in the group and join the social group interaction, as presented in [27]; while F-formations denote typical patterns, the exact formation can deviate from the pattern significantly, thus causing uncertainty. To deal with uncertainties, we need one of the most robust prediction model based on statistical learning that analyses the data and then classifies the groups into different F-formations. The corresponding approach is denoted as estimating F-formation classifier for the robot (EFCR). In this aspect, a classification approach that is suitable with a relatively small amount of training data, which deals with multiple classes, works efficiently with categorical input variables, and performs faster, i.e., in real time, is of interest. An SVM classifier fulfils the requirements, which is considered as a classification approach. The core idea of SVM is to find a maximum marginal hyperplane (MMH) that best divides the dataset into classes. In case of linear data, SVM generates hyperplanes which segregates the classes in the best possible way. In cases of non-linear data, SVM uses a technique called the kernel trick to transform the low-dimensional input space into a high-dimensional space. Then, it segregates the data easily using linear separation. This technique helps in building a more accurate classifier in non-linear separation problem. Kernel has various types of functions, one of them is polynomial, which is useful for a non-linear hyperplane [71,72,73].
A polynomial kernel is defined as the product between two vectors of features, and the sum of the multiplication of each pair of input values with a degree.
where x and are vectors of features in the input space, d is the degree of the polynomial, and c is a free parameter trading off the influence of higher-order versus lower-order terms in the polynomial. The degree needs to be specified manually in the learning algorithm.
An SVM classifier is a statistical model, which learns the function f, when provided with input feature vector X, and maps to the output label , i.e., f: X→ y. This learnt function, f, is used with the test data (new input), X, to predict the result, y.
In our scenario, the input feature vector X = , the spatial information (), and orientational information () of people in the group. A unique label is assigned to different formations, which are considered as output, y. These input feature vectors are mapped to output labels, which are used to learn a function in the training phase. Then, in the testing phase, the new input feature vector is given to the learnt function, which results in the estimation (prediction) of the F-formation of the group.
EFCR is proposed to train with the group datasets, but most of the existing group datasets include only the standard F-formations and do not include the constrained formations. In this aspect, for constrained and larger groups, another novel approach is proposed in Algorithm 2 for estimating F-formations for larger groups (EFLG).
The approach is based on the notion that variance of group could be used to estimate F-formations for larger groups, i.e., for groups more than three persons. In the semi-circular formation, group members are facing the same direction and the variance of angle of the group would be zero. Triangular and circular formations are in close relation in appearance. In the triangular formation, one person is standing far from others and group members are standing at opposite ends. In the circular formation, group members would be standing approximately at equal distance from each other, the variance of spatial location could be used as presented in Algorithm 2.
| Algorithm 2: Estimating F-formations |
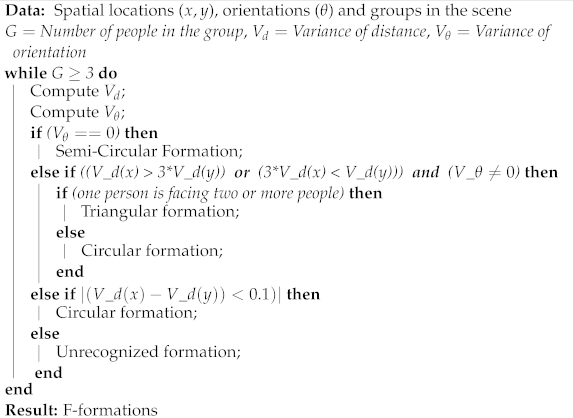 |
Studying these patterns further and finding an optimal empty spot in the group, as in work [27], would result in the robot joining the ongoing social interactions.
4. Experimental Setup
For the evaluation process, an experimental paradigm was developed in order to create a coffee break scenario, where people in the scene would be interacting in multiple group formations with varying sizes, and the robot would be integrated with our framework to evaluate the presented approaches. However, due to the COVID-19 pandemic, we could not conduct such an experiment and had to perform the experiment in a simulation environment instead of a real-world human environment. In terms of datasets, there are few existing group detection datasets, but these atr from an exocentric view, with either one large group of single formation [55,74] or multiple groups of different formations [6,75]. The coffee break dataset [6] has a similar plot to our idea of experiment, but from an exocentric view. So, to access this scene from an egocentric view, we replicated the dataset in the simulation.
4.1. Coffee Break Dataset
The coffee break dataset provides a social scenario of coffee break. This was captured in a summer school program during coffee breaks. The dataset consists of two sequences, Sequence 1 (S1), with 13 people interacting, and Sequence 2 (S2), with 20 people interacting in the scene. This dataset provides a scenario of social interaction among people outdoors during a coffee break [6].
In our work, we chose S2 and replicated S2 scene in the simulation, as this scene (S2) consists of more people and groups compared with S1. The S2 scene contains 20 people interacting in 7 different groups in 3 different formations. Among the 7 groups, 2 groups are interacting in vis-a-vis formations, 1 group in L-shape formation, and 4 groups are interacting in circular formations. This scene consists of a smaller number of groups and also does not cover the wide variety of formations mentioned by Kendon and Marshall. To cover this wide variety of formations, we developed one more scene similar to the experiment scene of our previous work [76]. This environment represents a conference lobby scenario where multiple (13) groups of virtual agents (VAs) with varying group sizes (2–5 VAs per group) are placed in different (6) spatial formations.
4.2. Simulation Environment
In the simulation environment, we created two scenes. The first scene is the replica of an actual human coffee break dataset [6], which is hereafter referred to as Scene 1. The second scene is a similar scene from our previous work [76], which consists of multiple formations with varying group sizes placed in different spatial formations, which is hereafter referred to as Scene 2.
Regarding Scene 1, an actual human coffee break dataset is replicated to make the simulation scene as equivalent to the real-world human environment as possible. The scene is created in 3D using the Unity game engine [77].
While creating the scene, to replicate S2, we used similar colours and patterns, such as for the floor, the walls, the doors, the windows, and the side lamps. A side landscape is also placed with shrubs, plants, and flowers. A table is placed with drinks, snacks, water bottles, glasses, tea, and a coffee machine. A flyer and two chairs are placed on the side of the wall. All these assets (materials) are available in the Unity asset store. The scene is populated with VAs, made using the make human software [78]. The VAs are made with similar features to the people in S2, such as hair, facial features, skin colour, ethnicity, height, size, clothes, and footwear (seen in Figure 7).
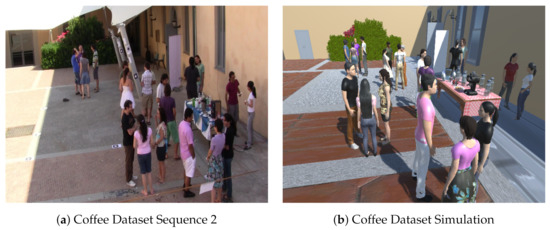
Figure 7.
Image (b) is the virtual scene of image (a), which is an original image from the coffee dataset. The similarities in image (b), with respect to image (a), could be seen as the floor, plants, walls with windows, doors, lamps, same amount of VAs as people, and their appearance. The table with machines for coffee and tea, glasses, snacks, and water bottles could also be seen image (b). The VAs in the simulation scene are created in such a way that their appearance resembles—i.e., make them appear as close as possible to—the people in the scene.
To make the scene more equivalent to the human environment, the VAs in the scene are integrated with some inbuilt human behaviours similar to the people in S2, such as head nodding, body movements, gestures, and more, using Mixamo software [79]. Similar to S2, the scene contains 20 VAs interacting in 7 different groups in 3 different formations: 2 groups in vis-a-vis formations, 1 group in L-shape formation and 4 groups in circular formations. The VAs are placed in a similar position as people in S2. The people in S2 did not have much movement in the human environment, and are standing in the same position and group throughout the dataset. The people only had a few head or body movements, which were also simulated for the VAs in the scene.
Regarding Scene 2, a simulated environment with a number of groups with various formations is created similar to the experimental scene in our previous work [76] (seen in Figure 8). The scene is created in a similar fashion to Scene 1, i.e., using the same software. Scene 2 consists of 36 VAs positioned in 13 different groups in 6 different formations: 2 groups in vis-a-vis formations, 2 groups in side-by-side formations, 3 groups in L-shape formations, 1 group in triangular formation, 1 group in semi-circular formation, and 4 groups in circular formations as shown in Figure 8. This scene is built to capture the diverse formations mentioned by Kendon and Marshall.

Figure 8.
The global view of the virtual Scene 2, which resembles a conference break social interaction scenario similar to the experiment scene of our previous work [76]. The scene consists a large hall with a red carpet, walls, paintings on the wall, round pub-style tables, and the VAs positioned in a number of groups with varying sizes in different formations.
A virtual Pepper robot endowed with our framework is deployed in both the scenes. The robot is using a built-in RGB camera, present on its forehead for RGB data, and a laser is placed in the left eye of the robot for the depth information. The robot present in Scene 1 and the egocentric view of Scene 1 from the robot’s head camera could be seen in Figure 9.
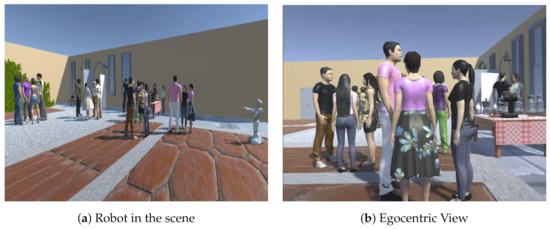
Figure 9.
Images from Scene 1, (a) virtual Pepper robot is facing the scene where VAs are interacting with each other. (b) The egocentric view of the scene from the robot’s camera.
5. Evaluation Process
To evaluate our approaches in both the scenes using the robot, we randomly generated positions for the robot throughout the scenes (1st and 2nd). From these positions, the robot could perceive the VAs and groups from different points of view. These different positions result in variation of the position and orientation of VAs in the scene. For example, one virtual agent (VA) could be facing centre from one position of the robot, but the same VA could be facing a different direction, i.e., facing left, facing right, or facing about, from another position of the robot. These positions further result in F-formation variations, i.e., a circular formation could be perceived as a L-shape or vis-a-vis formation when one of the group member is not seen by the robot. These variations, along with an egocentric view, present a challenge with which to evaluate our approaches.
The random positions generated for the robot to evaluate our approaches in the both the scenes is presented in Table 2.
Table 2.
Random positions for the robot in both the scenes.
For Scene 1, we generated 100 random positions (see Figure 10 and Table 2) which covered the scene. Within these 100 positions, the positions from where the robot could not see the VAs are removed and the remaining positions are retained. In this fashion, we ended with 31 positions which could be seen in Figure 11. From these 31 positions, only one VA could be seen in 3 positions, which are removed, as it takes at least 2 people for an interaction to be called a group interaction. Finally, we are left with 28 positions (view from two such positions are seen in Figure 12), which are used to evaluate our approaches, i.e., V6KP, DGO, and EFCR, using the robot.

Figure 10.
The global view of Scene 1 along with 100 randomly generated positions for the robot, which are represented by purple-coloured cylindrical spaces. The arrows represent the facing direction of the robot for respective position (best viewed in colour).

Figure 11.
The global view of Scene 1, along with 31 positions for the robot and the robot could be seen in one of the purple cylindrical spaces (best viewed in colour).
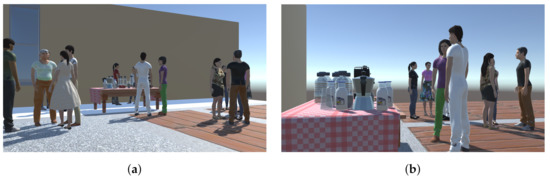
Figure 12.
Images (a) and (b) are sample images of Scene 1 through robot’s camera from two positions (best viewed in colour).
In Scene 2, we generated 500 random positions (seen in Figure 13 and Table 2) to cover the whole scene. More positions are generated as the area of this scene is bigger than Scene 1. Similar to the process in Scene 1, the positions from where the robot could not see the VAs (224) and the positions from where only 1 VA could be seen (29), are removed. Finally, we are left with 247 positions (seen in Figure 14) to evaluate our approaches using the robot.
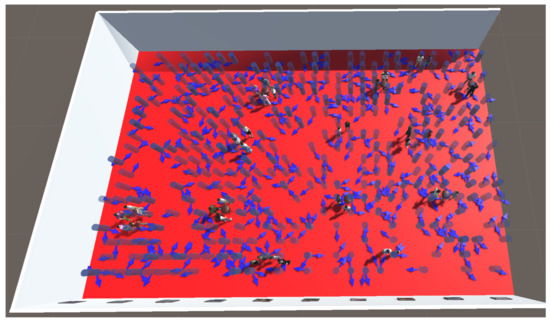
Figure 13.
The global view of Scene 2, along with 500 randomly generated positions for the robot, which are represented by purple-coloured cylindrical spaces. The arrows represent the facing direction of the robot for respective position (best viewed in colour).

Figure 14.
The global view of Scene 1, along with 247 positions for the robot (best viewed in colour).
5.1. Ground Truth Annotation
For the ground truth, the robot is placed in all the robot positions for both the scenes, i.e., 28 positions in Scene 1 and 247 positions in Scene 2. Then, we hand annotated the scene, as perceived using the robot’s camera, for the ground truth data of the head orientations of VAs, groups interacting, and their F-formations. This process was achieved for each position of the robot for both the scenes.
In Scene 1, VAs were placed with similar poses (body orientation) and positions (same groups) as the people in the coffee dataset. The same was carried out for Scene 2, with respect to [76].
For head orientation, the VAs who were detected using [69], or whose face could be seen and not occluded by other VAs, were considered. Based on their facing direction, the VAs were classified into 4 classes: facing about, facing right, facing centre, and facing left, as presented in Table 3. For group detection, the coffee dataset provides the ground truth for the groups in the scene which was considered for Scene 1 and [76] provides ground truth, which was considered for Scene 2. The ground truth of the coffee dataset was taken into account during the hand-annotation process for Scene 1, i.e., two VAs perceived from an egocentric view, said to be in a group if the respective people in the coffee dataset, were in the same group. A similar process was applied for Scene 2 with respect to [76]. For F-formations, the groups perceived using the robot’s camera were classified into one of the 7 F-formations presented in Section 2.1, for all the robot positions for both the scenes, as presented in Table 4.
Table 3.
Head orientation: ground truth information for both the scenes.
Table 4.
F-formations: ground truth information for both the scenes.
5.2. Metrics
Different metrics were used to evaluate the different approaches. For head orientation and F-formations, the confusion matrix and accuracy were calculated. For group detection, the measure of accuracy from [6,7,8] was used. A group was correctly detected if at least of their members were found by the approach, where is the cardinality of group G and T ∈ [0,1] is an arbitrary threshold, called the tolerance threshold. We focused on values T: 2/3 and 1 similar to [7]. Using these metrics, precision, recall, and F-measure were calculated for the group detection process.
6. Results
In this section, we evaluate our approaches and present the results sequentially in the order of the head orientation, group detection, and estimating F-formations. An overview of the process involved in the evaluation of our approaches is presented (as seen in Figure 15) as follows: a simulated robot was endowed with our approaches and placed in all the robot positions in both the scenes to estimate the head orientation, detect the groups, and estimate the F-formations. The estimated orientations were compared against the ground truth of head orientation, which presents the head orientation results in both the scenes. Next, the resulting orientation along with the spatial information was used to detect groups using our DGO. These detected groups were compared against the ground truth of groups, which presents the group detection results in both the scenes. Finally, the information of VAs along with the ground truth of groups and ground truth of F-formations were used to train the classifier with 80% of the data of Scene 2. Then, the trained model was tested with 20% of the data of Scene 2 and the outcome was compared against the ground truth of the F-formation, which presents the F-formation results for Scene 2. Then, for robust evaluation, the trained model was tested with the 100% data of Scene 1 and the outcome was compared against the ground truth of F-formation, which presents the F-formation results for Scene 1.

Figure 15.
We organise the presentation of the results according to three main headings: head orientation, group detection, and estimating F-formation. In head orientation and group detection, we present the results first from Scene 1 and then from Scene 2. In estimating F-formation, however, we first present the results from Scene 2, as the classifier was trained on Scene 2. For robust evaluation, the trained classifier was then used on Scene 1 data. A summary that illustrates the presentation of the experimental results is shown.
6.1. Estimating Head Orientation
For Scene 1, VAs are placed with similar body orientation as people in the coffee dataset. The robot is endowed with our V6KP and placed in the robot positions to estimate the head orientation of VAs in the scene, similar to Figure 16, which is an egocentric view of the scene from the robot. The skeleton structure in the figure is acquired from [69], and V6KP is built on this to estimate the head orientation, i.e., facing the direction of VAs, which is shown in the figure.
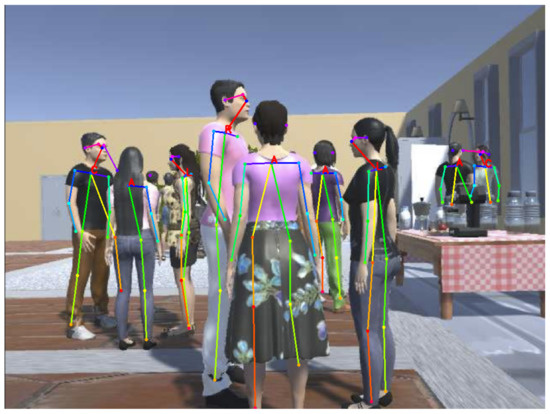
Figure 16.
Our approach—V6KP, estimating head orientation of people in Scene 1 from an egocentric view. The letter A stands for facing about, R stands for facing right, C stands for facing centre, and L stands for facing left.
The robot starts estimating the head orientation of the VAs in the scene for each position and compares against the concerned ground truth. This process was carried out for all the 28 positions of the robot. The results are detailed in Table 5, which presents the confusion matrix and accuracy for head orientation of VAs for all the 28 positions. In the table, total represents the number of occurrences of the facing direction in all the positions combined, unrecognized represents the VAs in the scene being detected using [69], but their orientation was not estimated by our approach; the accuracy is the number of correct detections by total occurrences.
Table 5.
Scene 1 estimating the head orientation: confusion matrix and accuracy.
From Table 5, the first row represents the facing about direction. In total, of 49 occurrences of facing about, our V6KP was able to correctly detect 25 occurrences as facing about, and wrongly detected as other facing directions in 15 occurrences. In 9 instances, VAs could not be categorized into one of the facing direction, which is represented as unrecognized. Similar to facing about, facing right, facing centre, and facing left are also presented. The facing about direction has low accuracy, with approximately 51%, and the facing left direction has high accuracy, with approximately 85%. The average accuracy of the approach is 71%. The reasons for low accuracy are unclear. It could be occlusion of VAs with each other, the long distance between the robot and the VAs, or insufficient contrast between the VAs attire or skin colour and the background texture.
The confusion matrix presents the true positives, true negatives, false positives and false negatives information. In here, the correctly detected occurrences are true positives, and diagonally the other correctly detected occurrences are true negatives. The row presents the false negatives, and the column presents the false positives for the selected predicted class. For example, in Table 5, if we consider the facing right, the correctly detected 31 occurrences are the true positives. The other correctly detected occurrences, i.e., 25 facing about, 24 facing center and 28 facing left are true negatives. The row presents the false negatives, i.e., 4 occurrences of facing about, 4 occurrences of facing centre, 0 occurrences of facing left, and 5 occurrences of unrecognised are false negatives. The column presents the false positives, i.e., 5 occurrences of facing about, 2 occurrences of facing centre, and 0 occurrences of facing left are false positives.
To analyse the runtime performance of V6KP, the average time taken for the robot to compute the head orientation of VAs in the scene for 28 positions was computed, which was 2.9762 s. In this, the time taken to compute the 2D pose of VAs was 2.9722 s and to estimate orientation was 0.0037 s. The approach was run on a laptop with an NVIDIA GeForceGTX-1080 GPU. The 2D pose algorithm was a part of Openpose and achieved the speed of 8.8 fps for a video with 19 people in the original implementation [69] which is in C++ language. We are using an implementation of pose algorithm [69] with chainer [80], which is a framework for neural networks written purely in python language using python libraries. This is the main reason for greater time consumption. However, with recent development in deep learning, many approaches are presented to detect people in the scene in real time. These could be used with our V6KP to increase the frame rate per second with the robot. In total, the approach results in good overall accuracy and also demonstrates efficiently our head orientation (V6KP) approach with a mobile robot using a built-in RGB camera from an egocentric view.
For the 2nd simulation scene, VAs were placed with a similar body orientation, as the VAs in [76]. Similar to Scene 1, the robot was endowed with V6KP and the estimating process was performed for all the 247 positions of the robot—the results are detailed in Table 6.
Table 6.
Scene 2 estimating the head orientation: confusion matrix and accuracy.
Similar to Scene 1, here too, the confusion matrix presented the true positives, true negatives, false positives, and false negatives information for Scene 2 in Table 6. From Table 6, VAs were facing about in 542 instances, in which 319 were recognized correctly by our algorithm. This had low accuracy, similar to Scene 1. The average accuracy of the approach was 74%, while comparing the individual accuracies and average accuracy of Scene 1 to Scene 2. All the individual percentages and the average accuracy increased, except facing left in Scene 2. In this scene, the VAs were detected by [69], but in a few instances, the VAs could not be categorized into one of the four facing directions. Of the total 1369 instances, in 75 instances, VAs’ facing directions could not be categorized into one of the four facing directions, which is 5% of the total instances. The unrecognized instances and percentage are negligible when the total instances are taken into account. The average runtime performance of V6KP was similar to Scene 1.
To summarize, the average accuracy of the approach was around 70%. Except for facing about, the other three facing directions performed better with an average accuracy of around 80%. With an average accuracy of 54%, facing about performed the worst. In total, the approach results in good overall accuracy and also efficiently demonstrates our head orientation (V6KP) approach, with a mobile robot using a built-in RGB camera from an egocentric view.
6.2. Detecting Groups
In Scene 1, VAs were placed in the same groups as the people in the coffee dataset (as seen in Figure 17a). The robot was endowed with our DGO and placed in the robot positions to detect groups in the scene. The robot started detecting the groups in the scene for each position and compared them against the concerned ground truth. This process was performed for all the 28 positions of the robot. DGO detects the groups and their members in the scene, as shown in Figure 17.

Figure 17.
Image (a) presents the output image from the robot. The numbers on the VAs in the image represent their tracking ID. Image (b) presents the terminal with results, which present the different groups’ information, i.e., the number of groups, the VAs in the group, their spatial and orientational information, and their tracking ID.
In the detection process, DGO considers some parameters: the radius of a person, the radius of the O-space, and the threshold for the overlapping region (Figure 6). Here, the radius of the O-space and the person were considered to be 0.6 m. The reason being, according to Hall [16] and the information provided in Table 1, the interpersonal distance in social interaction is from 1.2 to 3.7 m; if 1.2 m is taken into consideration, then each person is standing at 0.6 m from the centre of the O-space. Using this analysis, the radius of a person is fixed and the same goes for O-space; however, while experimenting, the person’s radius and O-space radius were slightly varied to observe how this affects the results. The threshold for the overlapping region varied from 0 to 100% of a given transactional segment of a VA to observe the affect on the results. The detected groups were evaluated using the annotated ground truth information gained through perceiving the scene from an egocentric view using the robot’s camera for all the 28 positions of the robot.
The results, i.e., precision, recall, and F-measure per position, were calculated and averaged for all the positions, whose results are presented in Table 7.
Table 7.
Scene 1: precision, recall, and F-measure values for groups detected by robot.
The radii of the O-space and person were varied, i.e., increased (>0.6 m) and decreased (<0.6 m), to observe the fluctuations of the scores, and we found better precision and recall values with 0.7 m radius in both the scenes; while detecting the groups, the unrecognized VAs from V6KP were considered. These VAs, when forming groups with other VAs, were not detected by DGO, which affected the results. The precision decreased by approximately 2–3%, and the recall and F-measure decreased by approximately 5–10%. These affected results are presented in Table 7.
From Table 7, the performance of DGO was better, with overlapping region percentage in between 10 and 20% for both the tolerance thresholds, i.e., T = 2/3 and 1. As the overlapping region increased from 10% to 100%, the precision, recall, and F-measure values decreased. Here, the precision reflects the ability of DGO to identify only the relevant groups; between 10 and 20%, DGO is correct 94% of the time. Precision decreasing from 30% means that our model was returning false positives incrementally. Here, the recall reflects the ability of DGO to find all the relevant groups within Scene 1. The recall is also high between 10 and 20%—DGO is correct 85% of the time. The decreasing recall means that our model was returning false negatives incrementally. Here, the F-measure provides DGO’s accuracy in Scene 1, which was 89% between 10 and 20%. The presented values for tolerance threshold were T = 2/3 (presented in Section 5.2). For T = 1, the precision was 72%, recall was 64%, and F-measure was 68% between 10 and 20%. The groups formed with 0% overlapping region represent the VAs clustered into groups based on spatial information. After the O-spaces were initialized in the scene, VAs were assigned to their nearest O-space, resulting in groups. These groups were formed without considering the transactional segment of VAs. The groups which formed with 100% overlapping region represent the exact matching of our initialized O-spaces with the original O-spaces of the groups. The latter percentage was higher than the prior one.
Regarding the runtime performance of DGO, the average time taken for the robot to detect groups in the scene for 28 positions was 3.25 s. The time taken to compute the 2D pose was 2.97 s, removing this would result in 0.28 s—the time taken by DGO from extraction of the features to the detection of groups in the scene.
In Scene 2, VAs were positioned in same groups as the VAs in [76]. The robot was placed in the scene for each position and compared the detected groups against the concerned ground truth. This process was performed for all the 247 positions of the robot. The results, i.e., precision, recall, and F-measure per position, were calculated and averaged for all the positions, whose results are presented in Table 8. Similar to Scene 1, the unrecognized VAs were considered in this scene too, and the results—i.e., the precision decreased by approximately 1–2%, and recall and F-measure decreased by approximately 5%—are presented in Table 8.
Table 8.
Scene 2: Precision, recall, and F-measure values for groups detected by robot.
From Table 8, the performance of DGO was better with overlapping region percentage between 10 and 20% for both T = 2/3 and 1. As the overlapping region increased from 10% to 100%, the precision, recall, and F-measure values decreased. Similar to Scene 1, the precision, recall, and F-measure reflect the ability of the DGO, and the values were higher between 10 and 20% for Scene 2. The precision was 80%, the recall was 69%, and the F-measure accuracy in Scene 2 was 75% for the tolerance threshold T = 2/3 (presented in Section 5.2). For T = 1, the precision was 66%, the recall was 57%, and the F-measure was 61% for 10% overlapping region.Similar to Scene 1, the groups formed with a 100% overlapping region had a higher percentage than the groups formed with a 0% overlapping region. The average runtime performance of DGO was similar to Scene 1.
To summarize, the precision, recall, and F-measure values were higher for our DGO between 10 and 20% for both the tolerance threshold values of T = 1 and 2/3. With precision around 90%, recall around 80%, and F-measure around 80 for T = 2/3 and for T = 1, these values decreased around 20%, respectively. Our approach also works efficiently in real time, with a mobile robot using a built-in RGB camera from an egocentric view.
These detected groups are further used in our framework to recognise the patterns of the groups by estimating F-formations.
6.3. Estimating F-Formations
Regarding estimating F-formations, firstly, Scene 1 does not contain a high enough number of groups or variety of F-formations. For this reason, Scene 2 was built with a number and variety of formations for the evaluation process. Secondly, while using a classifier in a dataset of 100%, 80% data is used for training and the remaining 20% of data is used for testing. In this aspect, from Scene 1, if the 28 positions (which consists of 48 groups) are considered as a dataset, then the 80% data accounts for 22 positions (39 groups) for training and 6 positions (9 groups) for testing, which are very short training and testing data. For both reasons, we skipped training and testing of the classifier, using Scene 1.
Next, Scene 2 consists of a good number of groups and variety of F-formations (seen in Figure 18). From Scene 2, the 247 robot positions resulted in a number of groups and a variety of formations, i.e., 56 vis-a-vis, 87 side-by-side, 136 L-shape, 63 circular, 28 semi-circular, and 20 triangular formations, which were used with the classifier. While training the classifier; instead of 80% of the number of positions, we considered 80% of each formation and combined them to train a classifier. For example, out of 56 vis-a-vis formations, 80% data, which is 44 formations, were used for training and 20% data, which is 12 formations, were used for testing. In this way, the training data of the first four formations (vis-a-vis, side-by-side, L-shape, and circular) were used to train the classifier and were tested on the remaining data of these formations. As the last two formations, i.e., semi-circular and triangular formations, were very short data. For this reason, both these formations were not included in the training or the testing part. These formations are very rarely observed in group interactions, which is the reason an algorithm 2 is presented to estimate these formations.
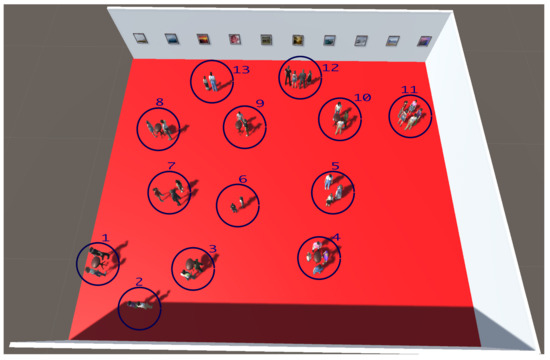
Figure 18.
Scene 2 consists of a number and variety of F-formations. The 13 formations are numbered and listed as follows: 1 and 8 are vis-a-vis formations; 2 and 13 are side-by-side formations; 3, 6, and 9 are L-shape formations; 4, 5, 10, and 11 are circular formations; 12 is semi-circular formation; 7 is triangular formation.
To evaluate our EFCR approach, 80% of data was used to train and 20% was used to test. The choice of training and testing data is very important in obtaining better performance. Due to this, we did not want to choose the data or put our choice as an option to avoid the risk of overfitting. So, we decided to use 0–80% of data as 80% training and 80–100% of data as 20% testing data. The unrecognized VAs had incomplete data and are negligible (i.e., 5%), which is the reason that we excluded this data while training and testing the classifier. For training the classifier, the spatial information () of the VAs, along with the ground truth information of head orientation, the groups, and the F-formations, was used for training—i.e., if two VAs were in the same group in the ground truth information of groups, then their information () was used as an input feature vector, X, and their F-formation was used as output label, y..
Regarding the classifier, the selected training data was then subjected to a polynomial SVM classifier with a degree of 2 and then evaluated using test data. This provided very good results, which are presented as confusion matrix in Table 9.
Table 9.
Estimating F-formations in Scene 2: confusion matrix and accuracy.
From Table 9, the overall accuracy of the approach was 97%, which shows that our approach worked very well and resulted in high accuracy. The vis-a-vis and circular formations had very high accuracy, i.e., 100%. The other formations also performed very well. The time taken to estimate the F-formations for the test data was 0.02 s, which suggests that our approach works in real time.
For robust evaluation, the trained classifier was tested with Scene 1 for all the 28 robot positions. The results are detailed as a confusion matrix in Table 10.
Table 10.
Estimating F-formations in Scene 1: confusion matrix and accuracy.
From Table 10, the results are very encouraging. The vis-a-vis formation performed well with 81% accuracy. There were no side-by-side formations in Scene 1. The L-shape had moderate accuracy for reasons which are currently unclear. The circular formation performed exceptionally well, with 100% accuracy. The overall accuracy of the approach was 83%, which shows that our approach worked with high accuracy in a simulation scene that was a replica of an actual human social scenario of a coffee break from an egocentric view.
To this end, the robot predicts the F-formations, which could be used with [27] to find the optimal empty spot in the group to join the ongoing social interactions.
For evaluating our EFLG approach, the semi-circular and triangular formations from Scene 2 were considered. These formations were fed to EFLG, which produced the results that are presented as a confusion matrix and accuracy in Table 11.
Table 11.
Estimating constrained F-formations: confusion matrix and accuracy.
From Table 11, the semi-circular formations were correctly estimated with 100% accuracy, but the triangular formations did not perform well. The triangular formations were wrongly estimated as circular formations. One reason for this is that, when observed from different perspectives, these formations appear as if the three VAs are standing in circular formations due to the formations appearance being closely related. The overall accuracy of the approach was 72%, which shows that our approach worked well with the said formations overall. Still, for more robust approaches and evaluation processes, there is a need for a real-time human scenario dataset from an egocentric view using a robot.
To summarize, EFCR worked efficiently, with an average overall accuracy of 90%. The individual formations accuracies were also very good; EFCR was tested with Scene 1 for all the robot positions, which resulted in an overall accuracy of around 80%, with a good individual formations accuracies. At the same time, EFLG also worked well, with an overall accuracy of around 70%, and the individual formations accuracies are encouraging.
7. Limitations and Future Works
There are some technical limitations in our framework, which are presented in this section along with the future research directions.
First, our framework works with single images from the robot and does not track persons and their movements. This would result in wrong prediction during movement. For example, when two persons are interacting in an L-shape formation, and one person is frequently turning their body towards the other person, this would result in a wrong prediction as a vis-a-vis formation. So, future research could be directed towards solving this issue by adding short temporal duration, which could keep track of persons in the group or scene. Second, the methods in our framework use hand-engineered features, but there is a preference for data-driven approaches. Third, our framework constitutes a pipeline of approaches for different tasks. This means a failure or malfunction in one of the approaches leads to a failure or malfunction in the complete framework. To address the second and third limitations, future research could be directed towards training deep learning approaches, which would result in an end-to-end framework and could improve accuracy. This process may also lead to new features to detect groups and estimate F-formations in social interactions. Regarding the experimental scenes, using a simulation scene could have impacted the results obtained in this paper. If the experiments were conducted in a real human environment, a change might be noticed in our framework’s performance, which is indeed worth investigating in future studies. For this, future research could be directed towards building large coffee break datasets from an egocentric view, with a number of persons interacting in multiple groups of varying group sizes, in all the different F-formations. Such datasets could also be useful in evaluating frameworks such as ours, in training deep learning approaches, and in studying socially acceptable behaviour, path, and placement for the robot to join the ongoing social group interactions. Finally, this paper presents seven different formations, and proposes approaches for six different formations, except the rectangle formation, because this formation occurs around a table, i.e., a dinner table or in conference room.
8. Conclusions
In this paper, we proposed a framework, AGIR, which incorporates different approaches: computing head orientation of people in the scene, detecting groups, and estimating F-formations. For head orientation, V6KP considers the visibility of six key points and models into four distinct classes, i.e., facing directions. For detecting groups, we proposed DGO, which initializes O-spaces, models transactional segments for people, and then optimizes the O-spaces, which results in estimating groups and their members. For estimating F-formations, we proposed two approaches—EFCR and EFLG. In EFCR, we used a polynomial SVM classifier, and in EFLG, we proposed an algorithm for larger groups. For evaluation purposes, two simulation scenes were built, one based on a replica of the so-called coffee dataset and the second from our previous work. Scene 1 was built with 20 VAs, interacting in 7 different groups of varying sizes and 3 different formations. Scene 2 was built with 36 VAs positioned in 13 different groups of varying sizes and 6 different formations. A virtual Pepper robot was endowed with agir and placed in both the scenes in randomly generated positions to evaluate the presented approaches. The obtained results for our different approaches present significant performance with high accuracies, and also demonstrate that AGIR works well when using a robot from an egocentric view in a real-time simulation.
Author Contributions
Conceptualization, S.K.P.; data curation, S.K.P.; formal analysis, S.K.P.; investigation, S.K.P.; methodology, S.K.P.; resources, S.K.P.; software, S.K.P.; supervision, A.K. and A.L.; validation, S.K.P.; visualization, S.K.P.; writing—original draft preparation, S.K.P.; writing—review and editing, A.K. and A.L. All authors have read and agreed to the published version of the manuscript.
Funding
Örebro University is funding this research through a strategic initiative of Successful Ageing Programme. The statements made herein are solely the responsibility of the authors.
Institutional Review Board Statement
Not applicable.
Informed Consent Statement
Informed consent was obtained from all subjects involved in this study.
Data Availability Statement
The data generated during and/or analyzed during the current study are not publicly available due to its large size and we could not commit to public repository. However, the data may be made available from the corresponding author upon reasonable request.
Conflicts of Interest
The authors declare no conflict of interest.
References
- Taylor, A.; Chan, D.M.; Riek, L.D.R. Robot-Centric Perception of Human Groups. ACM Trans. Hum.-Robot. Interact. 2020, 9, 1–21. [Google Scholar] [CrossRef]
- Vázquez, M. Reasoning about Spatial Patterns of Human Behavior during Group Conversations with Robots. Ph.D. Thesis, Carnegie Mellon University, Pittsburgh, PA, USA, 2017. [Google Scholar]
- Satake, S.; Kanda, T.; Glas, D.F.; Imai, M.; Ishiguro, H.; Hagita, N. How to approach humans? Strategies for social robots to initiate interaction. In Proceedings of the 4th ACM/IEEE International Conference on Human Robot Interaction, San Diego, CA, USA, 11–13 March 2009; pp. 109–116. [Google Scholar]
- Satake, S.; Kanda, T.; Glas, D.F.; Imai, M.; Ishiguro, H.; Hagita, N. A robot that approaches pedestrians. IEEE Trans. Robot. 2012, 29, 508–524. [Google Scholar] [CrossRef]
- Walters, M.L.; Dautenhahn, K.; TeBoekhorst, R.; Koay, K.L.; Syrdal, D.S.; Nehaniv, C.L. An empirical framework for human–robot proxemics. In Proceedings of the Symposium on New Frontiers in Human-Robot Interaction, AISB2009, Edinburgh, Scotland, 8–9 April 2009; pp. 144–149. [Google Scholar]
- Cristani, M.; Bazzani, L.; Paggetti, G.; Fossati, A.; Tosato, D.; Del Bue, A.; Menegaz, G.; Murino, V. Social interaction discovery by statistical analysis of F-formations. In Proceedings of the BMVC 2011—Proceedings of the British Machine Vision Conference 2011, Dundee, UK, 29 August–2 September 2011. [Google Scholar]
- Setti, F.; Russell, C.; Bassetti, C.; Cristani, M. F-formation detection: Individuating free-standing conversational groups in images. PLoS ONE 2015, 10, e0123783. [Google Scholar] [CrossRef] [Green Version]
- Vascon, S.; Mequanint, E.Z.; Cristani, M.; Hung, H.; Pelillo, M.; Murino, V. A Game-Theoretic Probabilistic Approach for Detecting Conversational Groups. In Asian Conference on Computer Vision; Springer: Singapore, 2014. [Google Scholar]
- Correia, F.; Alves-Oliveira, P.; Maia, N.; Ribeiro, T.; Petisca, S.; Melo, F.S.; Paiva, A. Just follow the suit! trust in human–robot interactions during card game playing. In Proceedings of the 2016 25th IEEE International Symposium on Robot and Human Interactive Communication (RO–MAN), New York, NY, USA, 26–31 August 2016; pp. 507–512. [Google Scholar]
- Oliveira, R.; Arriaga, P.; Correia, F.; Paiva, A. The stereotype content model applied to human–robot interactions in groups. In Proceedings of the 2019 14th ACM/IEEE International Conference on Human-Robot Interaction (HRI), Daegu, Korea, 11–14 March 2019; pp. 123–132. [Google Scholar]
- Leite, I.; Martinho, C.; Paiva, A. Social robots for long-term interaction: A survey. Int. J. Soc. Robot. 2013, 5, 291–308. [Google Scholar] [CrossRef]
- Flickner, M.D.; Haritaoglu, R.I. Method of Detecting and Tracking Groups of People. U.S. Patent No. 7,688,349, 30 March 2010. [Google Scholar]
- Lau, B.; Arras, K.O.; Burgard, W. Tracking groups of people with a multi-model hypothesis tracker. In Proceedings of the 2009 IEEE International Conference on Robotics and Automation, Kobe, Japan, 12–17 May 2009; pp. 3180–3185. [Google Scholar]
- Linder, T.; Arras, K.O. Multi-model hypothesis tracking of groups of people in RGB-D data. In Proceedings of the 17th International Conference on Information Fusion (FUSION), Salamanca, Spain, 7–10 July 2014; pp. 1–7. [Google Scholar]
- Luber, M.; Arras, K.O. Multi-hypothesis social grouping and tracking for mobile robots. In Robotics: Science and Systems; Springer: Berlin, Germany, 2013. [Google Scholar]
- Hall, E.T. The Hidden Dimension; Doubleday: Garden City, NY, USA, 1966; Volume 609. [Google Scholar]
- Kendon, A. Conducting Interaction: Patterns of Behavior in Focused Encounters; CUP Archive: Cambridge, UK, 1990. [Google Scholar]
- Kendon, A. Spacing and Orientation in Co-Present Interaction; Springer: Berlin/Heidelberg, Germany, 2010. [Google Scholar]
- Swofford, M.; Peruzzi, J.; Vázquez, M. Conversational group detection with deep convolutional networks. arXiv 2018, arXiv:181004039. [Google Scholar]
- Taylor, A.; Riek, L.D. Robot Perception of Human Groups in the Real World: State of the Art. In AAAI Fall Symposia Series; AAAI: Arlington, VA, USA, 2016. [Google Scholar]
- Brščić, D.; Zanlungo, F.; Kanda, T. Modelling of pedestrian groups and application to group recognition. In Proceedings of the 2017 40th International Convention on Information and Communication Technology, Electronics and Microelectronics (MIPRO), Opatija, Croatia, 22–26 May 2017; pp. 564–569. [Google Scholar]
- Caine, K.; Šabanovic, S.; Carter, M. The effect of monitoring by cameras and robots on the privacy enhancing behaviors of older adults. In Proceedings of the Seventh Annual ACM/IEEE International Conference on Human-Robot Interaction, New York, NY, USA, 5 March 2012; pp. 343–350. [Google Scholar]
- Kaminski, M.E.; Rueben, M.; Smart, W.D.; Grimm, C.M. Averting robot eyes. Md. L. Rev. 2016, 76, 983. [Google Scholar]
- Mazzon, R.; Poiesi, F.; Cavallaro, A. Detection and tracking of groups in crowd. In Proceedings of the 2013 10th IEEE International Conference on Advanced Video and Signal Based Surveillance, Krakow, Poland, 27–30 August 2013; pp. 202–207. [Google Scholar]
- Ramírez, O.A.I.; Varni, G.; Andries, M.; Chetouani, M.; Chatila, R. Modeling the dynamics of individual behaviors for group detection in crowds using low-level features. In Proceedings of the 2016 25th IEEE International Symposium on Robot and Human Interactive Communication (RO–MAN), New York, NY, USA, 26–31 August 2016; pp. 1104–1111. [Google Scholar]
- Pathi, S.K.; Kiselev, A.; Loutfi, A. Estimating F-formations for mobile robotic telepresence. In Proceedings of the ACM/IEEE International Conference on Human–Robot Interaction, Vienna, Austria, 6–9 March 2017. [Google Scholar]
- Pathi, S.K.; Kristofferson, A.; Kiselev, A.; Loutfi, A. Estimating Optimal Placement for a Robot in Social Group Interaction. In Proceedings of the 2019 28th IEEE International Conference on Robot and Human Interactive Communication, RO–MAN, New Delhi, India, 14–18 October 2019. [Google Scholar]
- Barua, H.B.; Pramanick, P.; Sarkar, C.; Mg, T.H. Let me join you! Real-time F-formation recognition by a socially aware robot. arXiv 2020, arXiv:2008.10078. [Google Scholar]
- Tseng, S.H.; Chao, Y.; Lin, C.; Fu, L.C. Service robots: System design for tracking people through data fusion and initiating interaction with the human group by inferring social situations. Robot. Auton. Syst. 2016, 83, 188–202. [Google Scholar] [CrossRef]
- Patterson, M. Spatial factors in social interactions. Hum. Relat. 1968, 21, 351–361. [Google Scholar] [CrossRef]
- Walters, M.L.; Syrdal, D.S.; Koay, K.L.; Dautenhahn, K.; TeBoekhorst, R. Human approach distances to a mechanical-looking robot with different robot voice styles. In Proceedings of the RO-MAN 2008—The 17th IEEE International Symposium on Robot and Human Interactive Communication, Munich, Germany, 1–3 August 2008; pp. 707–712. [Google Scholar]
- Hinds, P.J.; Roberts, T.L.; Jones, H. Whose job is it anyway? A study of human–robot interaction in a collaborative task. Hum.-Comput. Interact. 2004, 19, 151–181. [Google Scholar]
- Friedman, B.; Kahn, P.H., Jr.; Hagman, J. Hardware companions? What online AIBO discussion forums reveal about the human–robotic relationship. In Proceedings of the SIGCHI Conference on Human Factors in Computing Systems, Ft. Lauderdale, FL, USA, 5–10 April 2003; pp. 273–280. [Google Scholar]
- Hall, E.T.; Birdwhistell, R.L.; Bock, B.; Bohannan, P.; Diebold, A.R., Jr.; Durbin, M.; Edmonson, M.S.; Fischer, J.L.; Hymes, D.; Kimball, S.T.; et al. Proxemics [and comments and replies]. Curr. Anthropol. 1968, 9, 83–108. [Google Scholar] [CrossRef]
- Sommer, R. Personal Space. The Behavioral Basis of Design; Prentice Hall: Englewood Cliffs, NJ, USA, 1969. [Google Scholar]
- Marshall, P.; Rogers, Y.; Pantidi, N. Using F-formations to analyse spatial patterns of interaction in physical environments. In Proceedings of the ACM Conference on Computer Supported Cooperative Work, CSCW, Hangzhou, China, 19–23 March 2011. [Google Scholar]
- Serna, A.; Pageaud, S.; Tong, L.; George, S.; Tabard, A. F-formations and collaboration dynamics study for designing mobile collocation. In Proceedings of the 18th International Conference on Human–Computer Interaction with Mobile Devices and Services Adjunct, MobileHCI 2016, Florence, Italy, 6–9 September 2016; Association for Computing Machinery, Inc.: New York, NY, USA, 2016; pp. 1138–1141. Available online: http://dl.acm.org/citation.cfm?doid=2957265.2962656 (accessed on 6 March 2019).
- Murphy-Chutorian, E.; Trivedi, M.M. Head pose estimation in computer vision: A survey. IEEE Trans. Pattern Anal. Mach. Intell. 2009, 31, 607–626. [Google Scholar] [CrossRef]
- Alletto, S.; Serra, G.; Calderara, S.; Cucchiara, R. Head pose estimation in first-person camera views. In Proceedings of the International Conference on Pattern Recognition, Stockholm, Sweden, 24–28 August 2014. [Google Scholar]
- Robertson, N.; Reid, I. Estimating gaze direction from low-resolution faces in video. In European Conference on Computer Vision; Springer: Berlin/Heidelberg, Germany, 2006; pp. 402–415. [Google Scholar]
- Tosato, D.; Spera, M.; Cristani, M.; Murino, V. Characterizing humans on riemannian manifolds. IEEE Trans. Pattern Anal. Mach. Intell. 2012, 35, 1972–1984. [Google Scholar] [CrossRef]
- Tosato, D.; Farenzena, M.; Spera, M.; Murino, V.; Cristani, M. Multi-class classification on riemannian manifolds for video surveillance. In European Conference on Computer Vision; Springer: Berlin/Heidelberg, Germany, 2010; pp. 378–391. [Google Scholar]
- Raytchev, B.; Yoda, I.; Sakaue, K. Head pose estimation by nonlinear manifold learning. In Proceedings of the International Conference on Pattern Recognition, Cambridge, UK, 26 August 2004. [Google Scholar]
- Fanelli, G.; Gall, J.; Van Gool, L. Real time head pose estimation with random regression forests. In Proceedings of the IEEE Computer Society Conference on Computer Vision and Pattern Recognition, Colorado Springs, CO, USA, 20–25 June 2011. [Google Scholar]
- Ruiz, N.; Chong, E.; Rehg, J.M. Fine-grained head pose estimation without keypoints. In Proceedings of the IEEE Computer Society Conference on Computer Vision and Pattern Recognition Workshops, Salt Lake City, UT, USA, 18–22 June 2018. [Google Scholar]
- Godec, M.; Roth, P.M.; Bischof, H. Hough-based tracking of non-rigid objects. Comput. Vis. Image Underst. 2012, 117, 1245–1256. [Google Scholar] [CrossRef]
- Rother, C.; Kolmogorov, V.; Blake, A. “Grabcut”: Interactive foreground extraction using iterated graph cuts. ACM Trans. Graph. 2004, 23, 309–314. [Google Scholar] [CrossRef]
- Alletto, S.; Serra, G.; Calderara, S.; Cucchiara, R. Understanding social relationships in egocentric vision. Pattern Recognit. 2015, 48, 4082–4096. [Google Scholar] [CrossRef]
- Katevas, K.; Haddadi, H.; Tokarchuk, L.; Clegg, R.G. Detecting group formations using iBeacon technology. In Proceedings of the 2016 ACM International Joint Conference on Pervasive and Ubiquitous Computing: Adjunct, Heidelberg, Germany, 12–16 September 2016; pp. 742–752. [Google Scholar]
- Hung, H.; Englebienne, G.; CabreraQuiros, L. Detecting conversing groups with a single worn accelerometer. In Proceedings of the 16th International Conference on Multimodal Interaction, Istanbul, Turkey, 12–16 November 2014; pp. 84–91. [Google Scholar]
- Tao, Y.; Mitsven, S.G.; Perry, L.K.; Messinger, D.S.; Shyu, M.L. Audio-Based Group Detection for Classroom Dynamics Analysis. In Proceedings of the 2019 International Conference on Data Mining Workshops (ICDMW), Beijing, China, 8–11 November 2019; pp. 855–862. [Google Scholar]
- Solera, F.; Calderara, S.; Cucchiara, R. Socially constrained structural learning for groups detection in crowd. IEEE Trans. Pattern Anal. Mach. Intell. 2015, 38, 995–1008. [Google Scholar] [CrossRef] [Green Version]
- Fern, O.T.; Denman, S.; Sridharan, S.; Fookes, C. Gd-gan: Generative adversarial networks for trajectory prediction and group detection in crowds. In Asian Conference on Computer Vision; Springer: Singapore, 2018; pp. 314–330. [Google Scholar]
- Hung, H.; Kröse, B. Detecting F-formations as dominant sets. In Proceedings of the ICMI’11-Proceedings of the 2011 ACM International Conference on Multimodal Interaction, Alicante, Spain, 14–18 November 2011. [Google Scholar]
- Setti, F.; Lanz, O.; Ferrario, R.; Murino, V.; Cristani, M. Multi-scale f-formation discovery for group detection. In Proceedings of the 2013 IEEE International Conference on Image Processing, ICIP 2013-Proceedings, Melbourne, VIC, Australia, 15–18 September 2013; pp. 3547–3551. [Google Scholar]
- Ricci, E.; Varadarajan, J.; Subramanian, R.; Bulo, S.R.; Ahuja, N.; Lanz, O. Uncovering interactions and interactors: Joint estimation of head, body orientation and f-formations from surveillance videos. In Proceedings of the IEEE International Conference on Computer Vision (ICCV), Santiago, Chile, 7–15 December 2015; pp. 4660–4668. [Google Scholar]
- Zhang, L.; Hung, H. Beyond F-formations: Determining social involvement in free standing conversing groups from static images. In Proceedings of the IEEE Computer Society Conference on Computer Vision and Pattern Recognition, Las Vegas, NV, USA, 27–30 June 2016; pp. 1086–1095. [Google Scholar]
- Vazquez, M.; Steinfeld, A.; Hudson, S.E. Parallel detection of conversational groups of free-standing people and tracking of their lower-body orientation. In Proceedings of the IEEE International Conference on Intelligent Robots and Systems, Hamburg, Germany, 28 September–2 October 2015. [Google Scholar]
- Aghaei, M.; Dimiccoli, M.; Ferrer, C.C.; Radeva, P. Towards social pattern characterization in egocentric photo-streams. Comput. Vis. Image Underst. 2018, 171, 104–117. [Google Scholar] [CrossRef] [Green Version]
- Swofford, M.; Peruzzi, J.; Tsoi, N.; Thompson, S.; Martín-Martín, R.; Savarese, S.; Vázquez, M. Improving Social Awareness Through DANTE: Deep Affinity Network for Clustering Conversational Interactants. In Proceedings of the ACM on Human–Computer Interaction, New York, NY, USA, 28 May 2020; Volume 4, pp. 1–23. [Google Scholar]
- Hüttenrauch, H.; Eklundh, K.S.; Green, A.; Topp, E.A. Investigating spatial relationships in human–robot interaction. In Proceedings of the 2006 IEEE/RSJ International Conference on Intelligent Robots and Systems, Beijing, China, 9–15 October 2006; pp. 5052–5059. [Google Scholar]
- Yamaoka, F.; Kanda, T.; Ishiguro, H.; Hagita, N. How close? Model of proximity control for information-presenting robots. In Proceedings of the 2008 3rd ACM/IEEE International Conference on Human–Robot Interaction (HRI), Amsterdam, The Netherlands, 12–15 March 2008; pp. 137–144. [Google Scholar]
- Kuzuoka, H.; Suzuki, Y.; Yamashita, J.; Yamazaki, K. Reconfiguring spatial formation arrangement by robot body orientation. In Proceedings of the 2010 5th ACM/IEEE International Conference on Human–Robot Interaction (HRI), Osaka, Japan, 2–5 March 2010; pp. 285–292. [Google Scholar]
- Vroon, J.; Joosse, M.; Lohse, M.; Kolkmeier, J.; Kim, J.; Truong, K.; Englebienne, G.; Heylen, D.; Evers, V. Dynamics of social positioning patterns in group-robot interactions. In Proceedings of the IEEE International Workshop on Robot and Human Interactive Communication, Kobe, Japan, 31 August–4 September 2015. [Google Scholar]
- Johal, W.; Jacq, A.; Paiva, A.; Dillenbourg, P. Child-robot spatial arrangement in a learning by teaching activity. In Proceedings of the 25th IEEE International Symposium on Robot and Human Interactive Communication, RO-MAN 2016, New York, NY, USA, 26–31 August 2016. [Google Scholar]
- Kristoffersson, A.; Eklundh, K.S.; Loutfi, A. Measuring the Quality of Interaction in Mobile Robotic Telepresence: A Pilot’s Perspective. Int. J. Soc. Robot. 2013, 5, 89–101. [Google Scholar] [CrossRef]
- Fangkai, Y.; Christopher Peters, C. AppGAN: Generative adversarial networks for generating robot approach behaviors into small groups of people. In Proceedings of the 2019 28th IEEE International Conference on Robot and Human Interactive Communication (RO-MAN), New Delhi, India, 14–18 October 2019. [Google Scholar]
- Gao, Y.; Yang, F.; Frisk, M.; Hemandez, D.; Peters, C.; Castellano, G. Learning socially appropriate robot approaching behavior toward groups using deep reinforcement learning. In Proceedings of the 2019 28th IEEE International Conference on Robot and Human Interactive Communication (RO-MAN), New Delhi, India, 14–18 October 2019. [Google Scholar]
- Cao, Z.; Simon, T.; Wei, S.E.; Sheikh, Y. Realtime multi-person 2D pose estimation using part affinity fields. In Proceedings of the 30th IEEE Conference on Computer Vision and Pattern Recognition, CVPR 2017, Honolulu, HI, USA, 21–26 July 2016. [Google Scholar]
- Narasimhan, K.P.; White, G. An agent-based analyses of f-formations. In Proceedings of the International Conference on Practical Applications of Agents and Multi-Agent Systems, Salamanca, Spain, 22–24 May 2013; Springer: Berlin/Heidelberg, Germany, 2013; pp. 239–250. [Google Scholar]
- Support Vector Machines. Available online: https://www.datacamp.com/community/tutorials/svm-classification-scikit-learn-python (accessed on 26 November 2021).
- Polynomial Kernel. Available online: https://en.wikipedia.org/wiki/Polynomial_kernel (accessed on 26 November 2021).
- Support Vector Machines Kernels. Available online: https://scikit-learn.org/stable/modules/svm.html#svm-kernels (accessed on 23 December 2021).
- Zen, G.; Lepri, B.; Ricci, E.; Lanz, O. Space speaks: Towards socially and personality aware visual surveillance. In Proceedings of the 1st ACM International Workshop on Multimodal Pervasive Video Analysis, Firenze, Italy, 29 October 2010; pp. 37–42. [Google Scholar]
- Alameda-Pineda, X.; Staiano, J.; Subramanian, R.; Batrinca, L.; Ricci, E.; Lepri, B.; Lanz, O.; Sebe, N. Salsa: A novel dataset for multimodal group behavior analysis. IEEE Trans. Pattern Anal. Mach. Intell. 2015, 38, 1707–1720. [Google Scholar] [CrossRef] [Green Version]
- Pathi, S.K.; Kristoffersson, A.; Kiselev, A.; Loutfi, A. F-Formations for Social Interaction in Simulation Using Virtual Agents and Mobile Robotic Telepresence Systems. Multimodal Technol. Interact. 2019, 3, 69. [Google Scholar] [CrossRef] [Green Version]
- Unity Real-Time Development Platform | 3D, 2D VR & AR Engine. Available online: https://unity.com/ (accessed on 10 October 2021).
- Make Human Community. Available online: http://makehumancommunity.org/ (accessed on 6 April 2021).
- Mixamo. Available online: https://www.mixamo.com/ (accessed on 15 June 2021).
- GitHub-DeNA/Chainer_Realtime_Multi-Person_Pose_Estimation: Chainer version of Realtime Multi-Person Pose Estiamtion. Available online: https://github.com/DeNA/Chainer_Realtime_Multi-Person_Pose_Estimation (accessed on 26 November 2020).
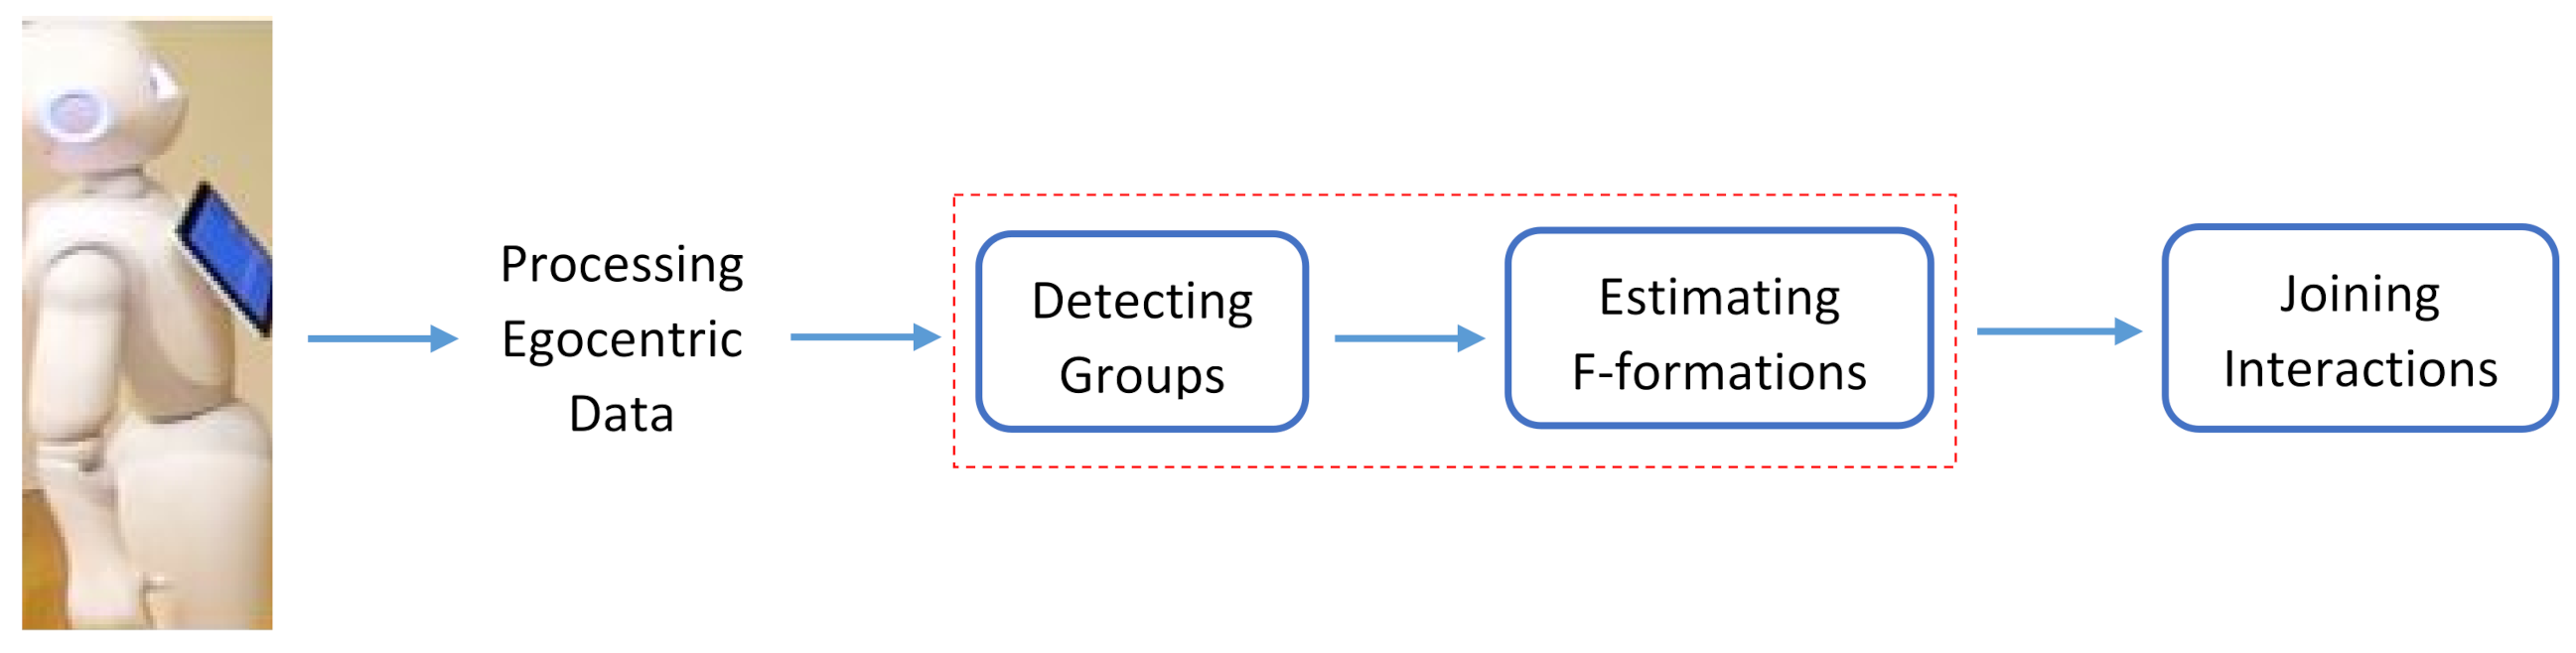
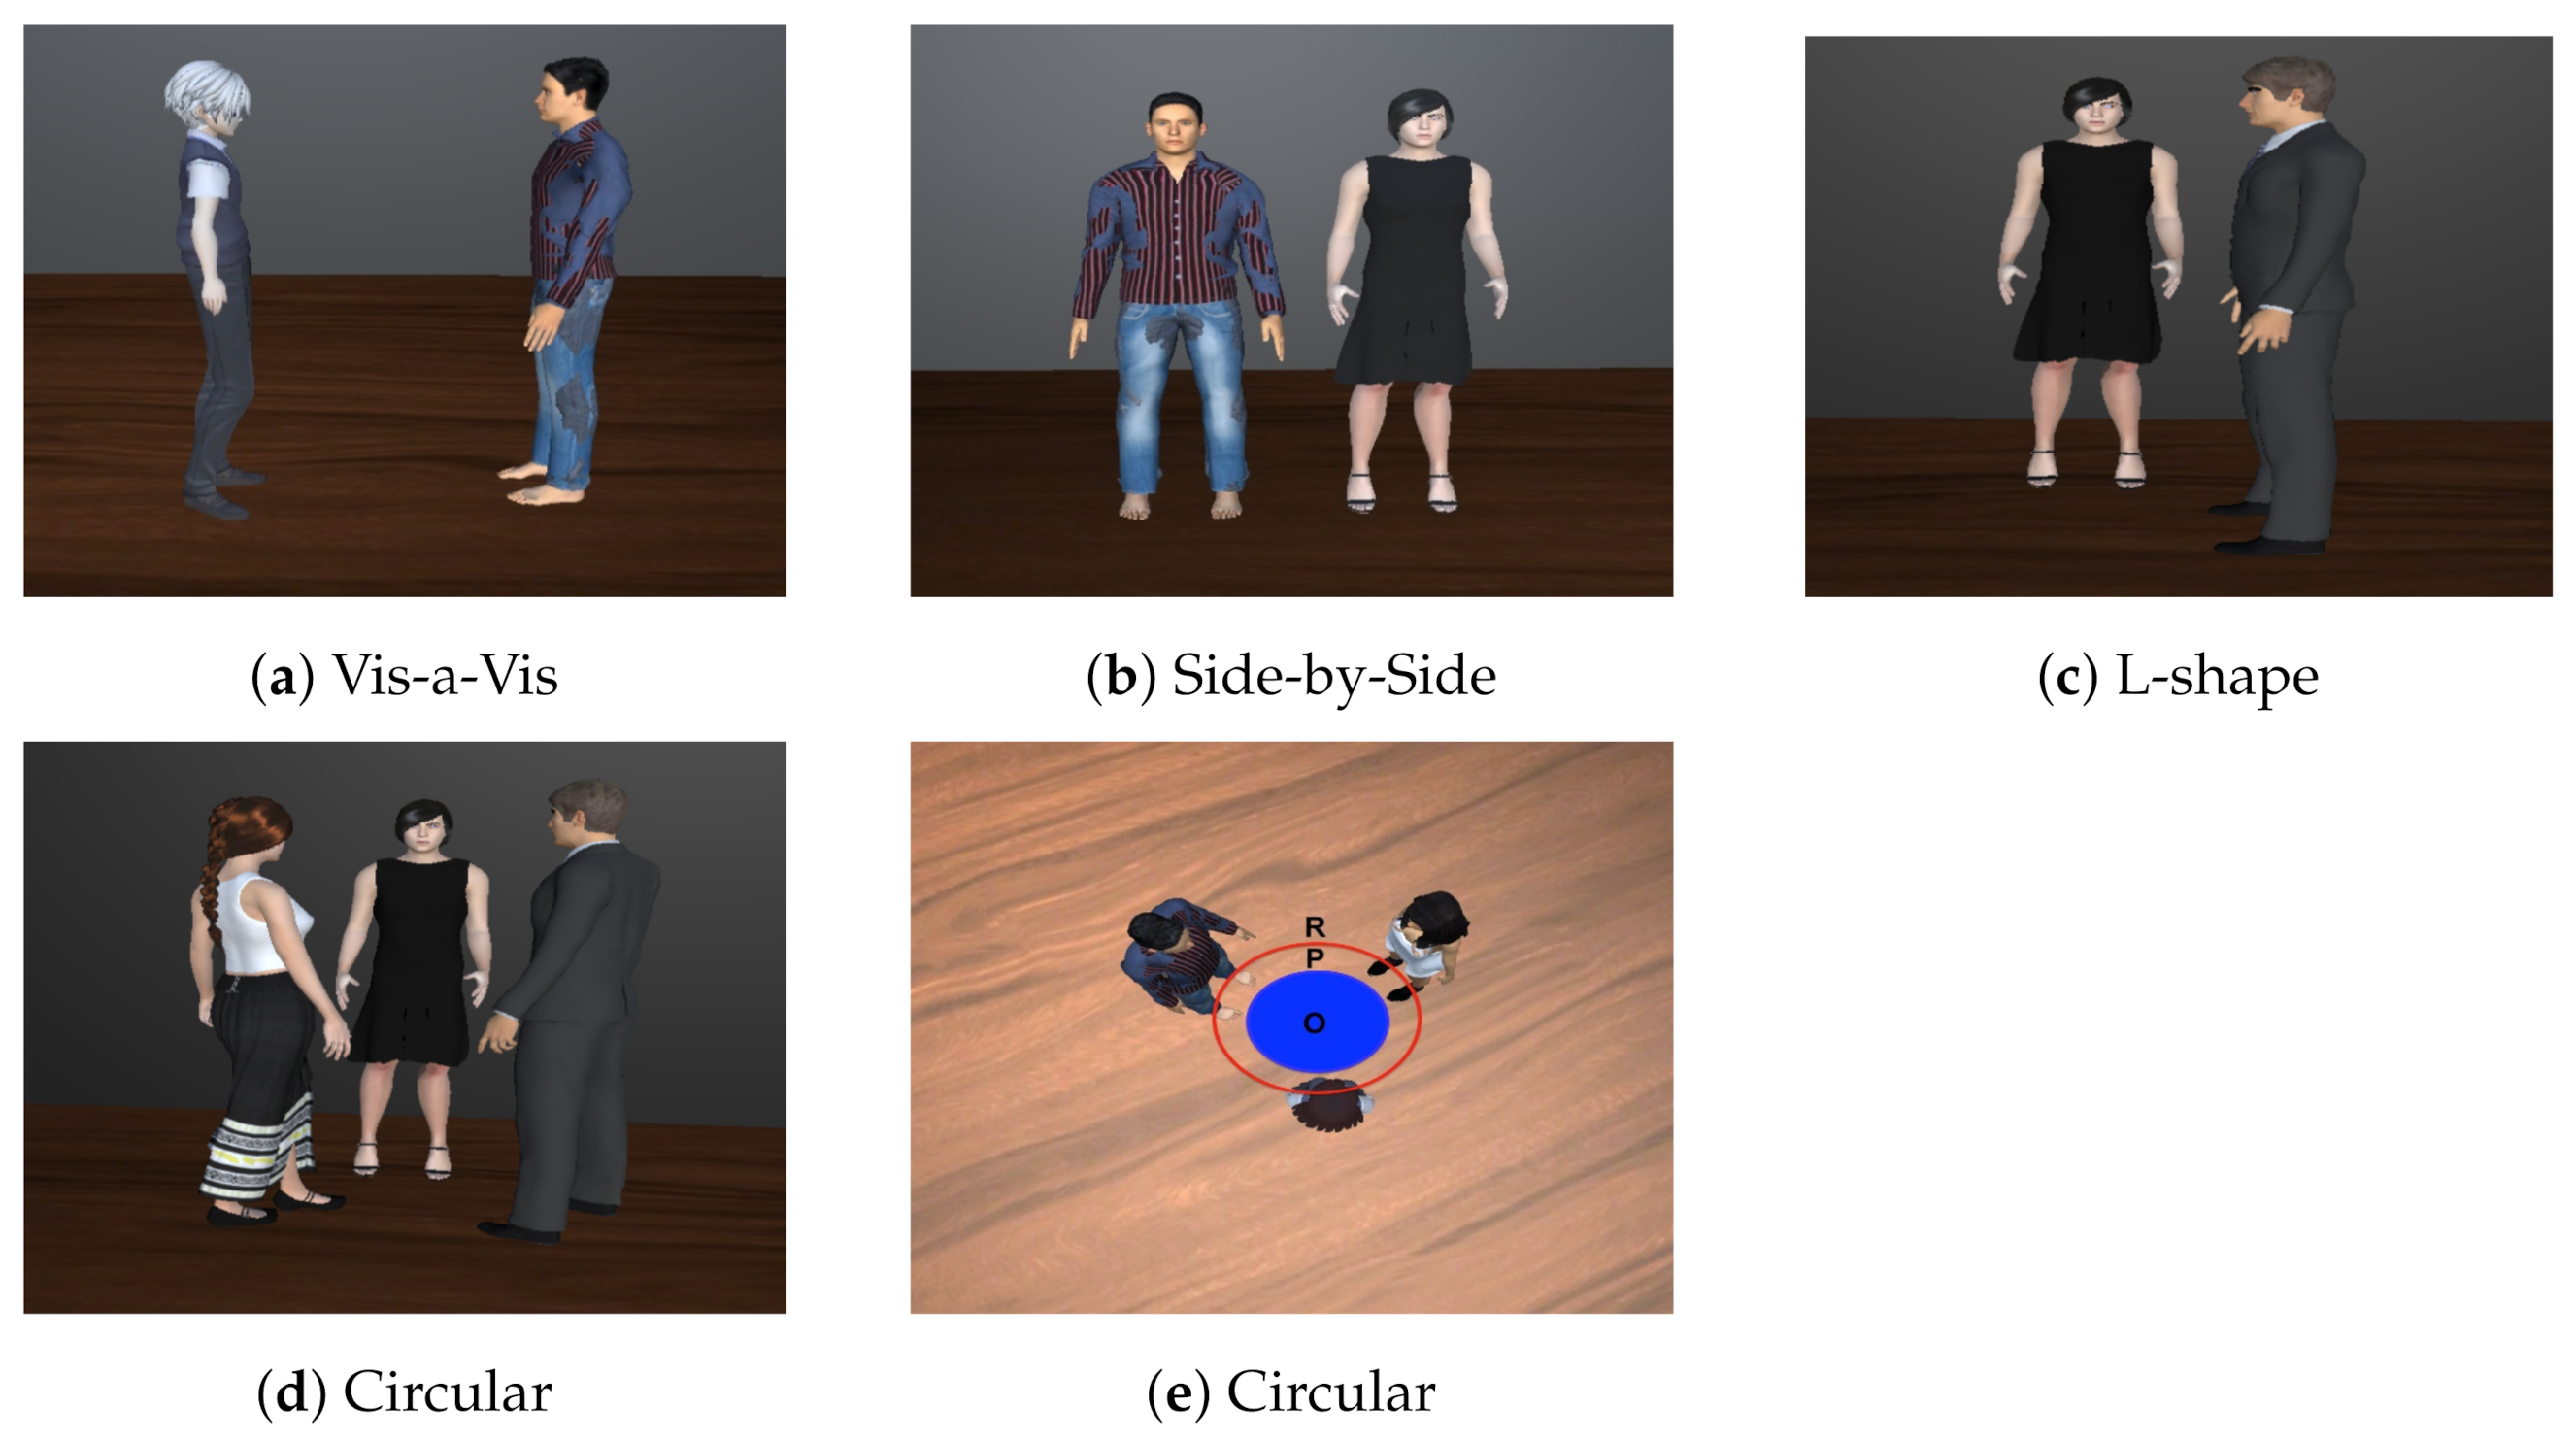
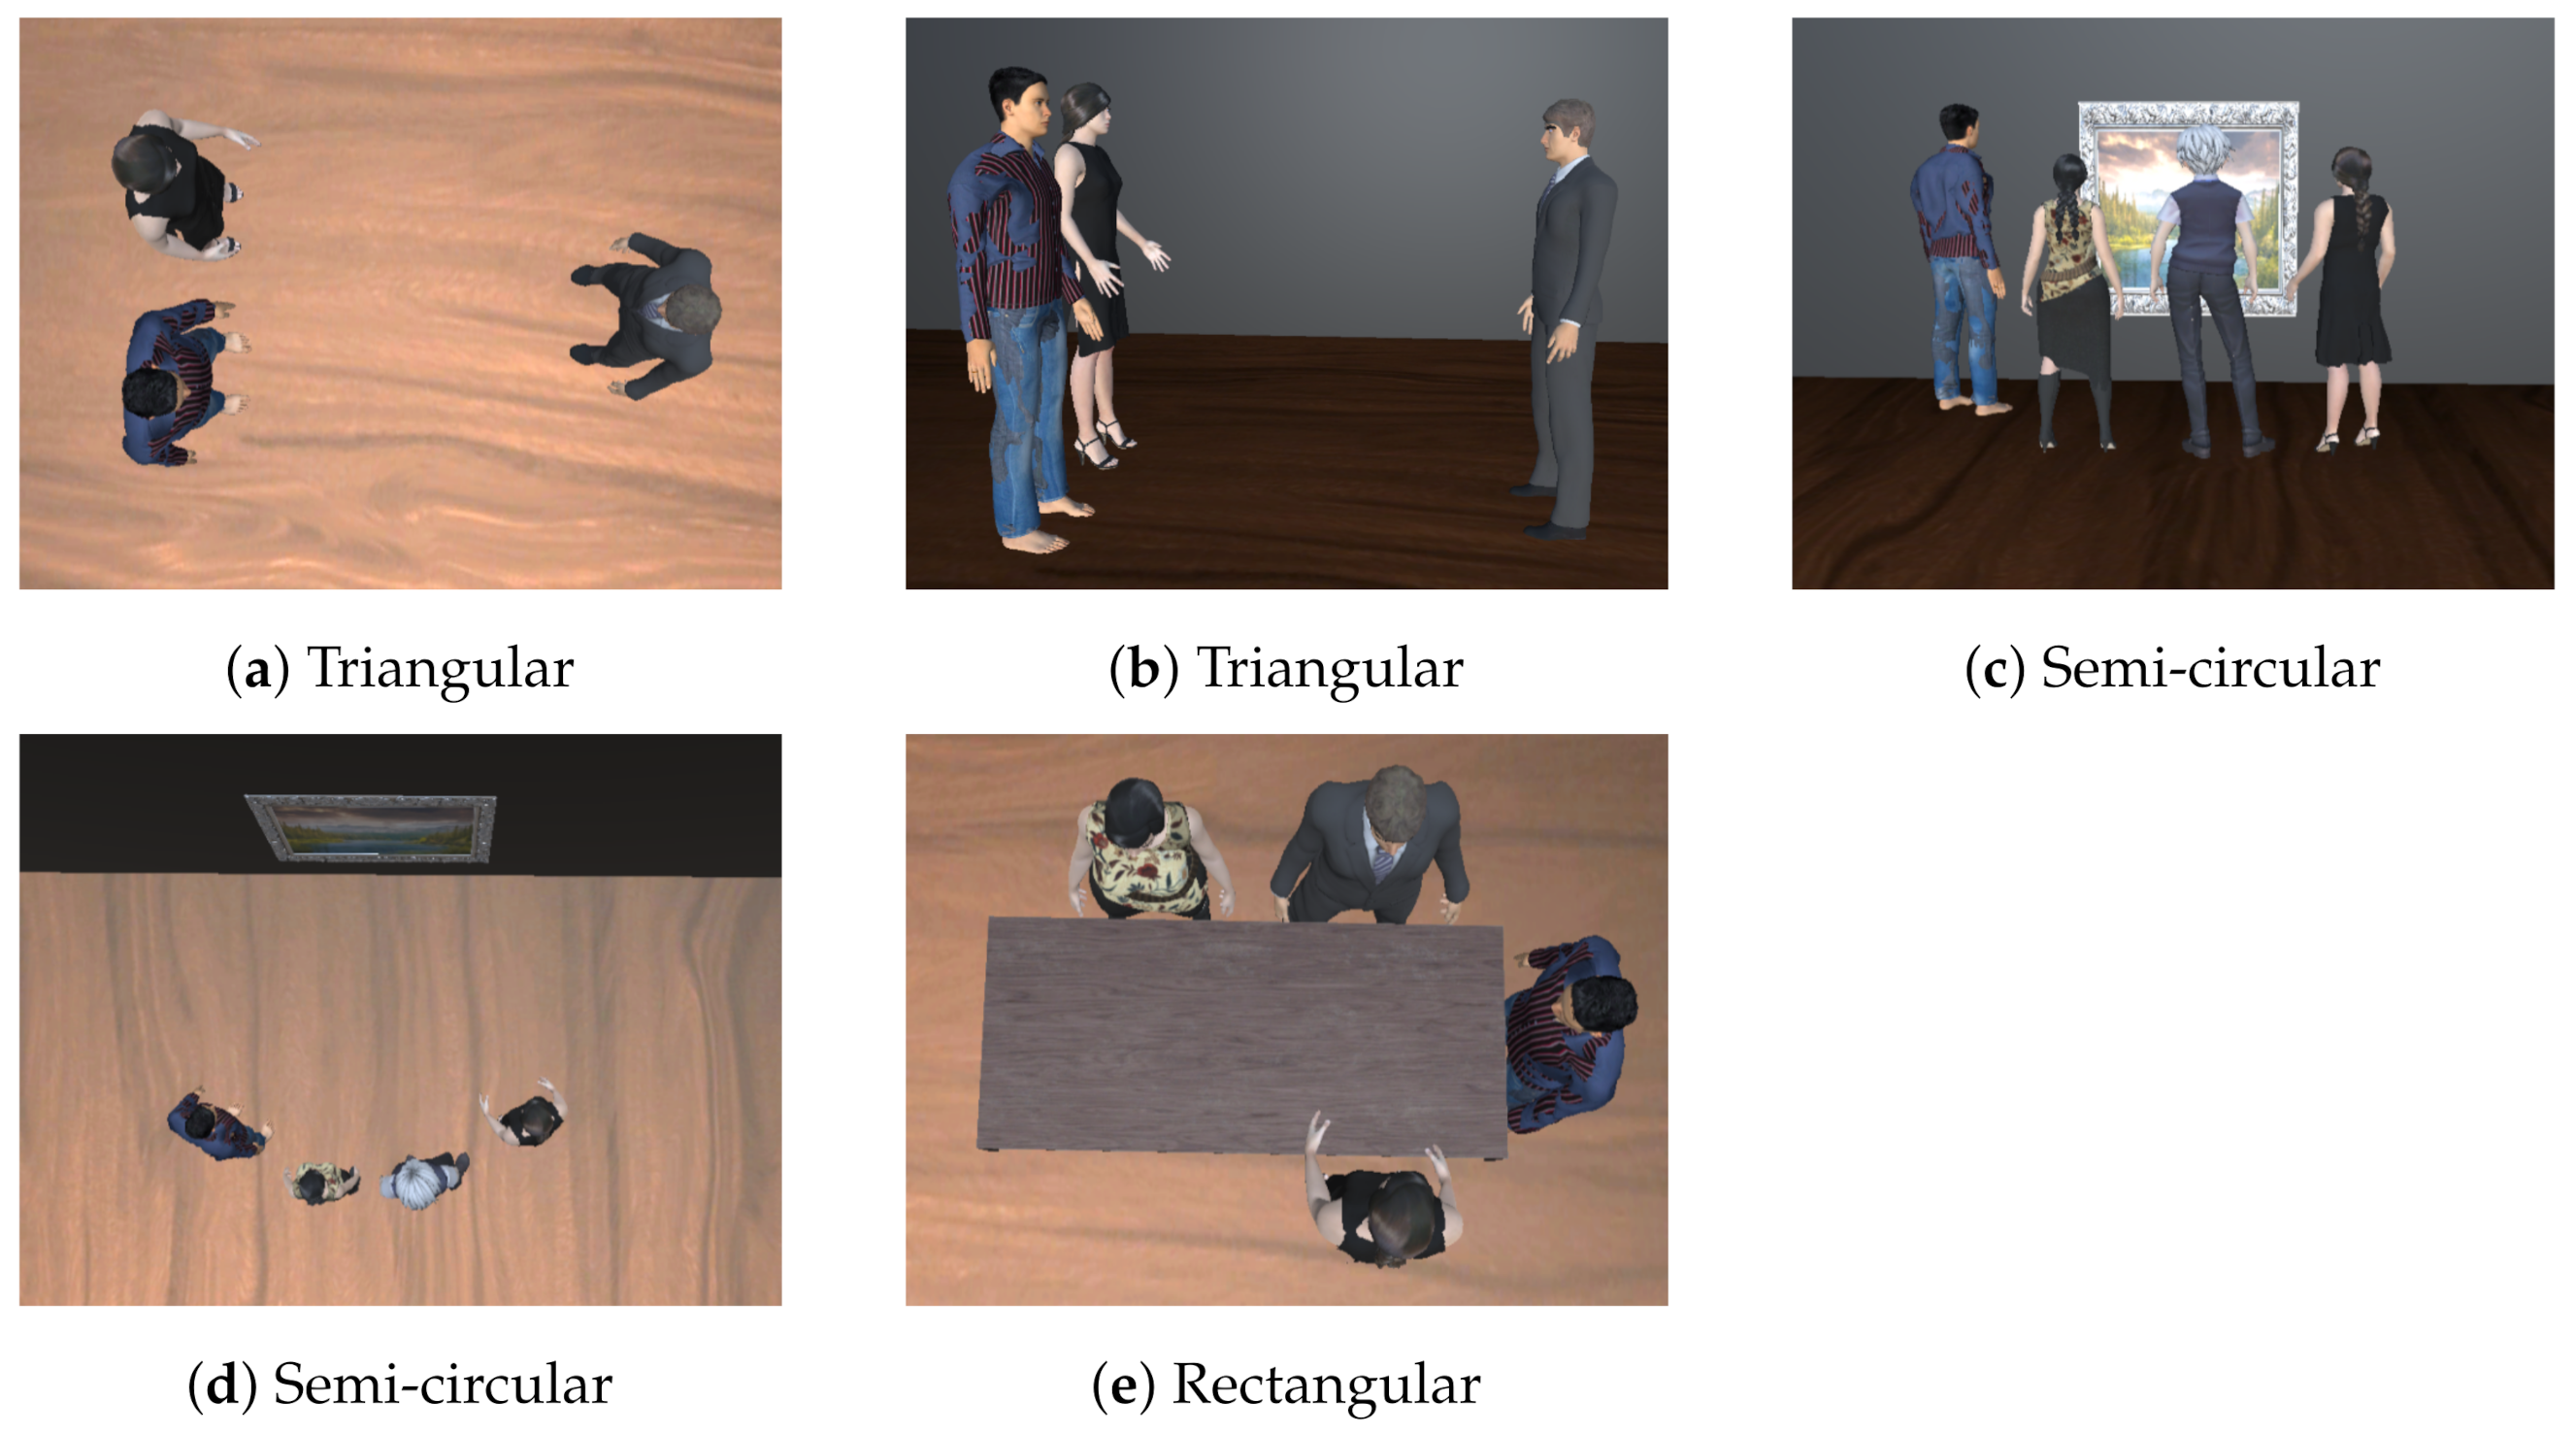
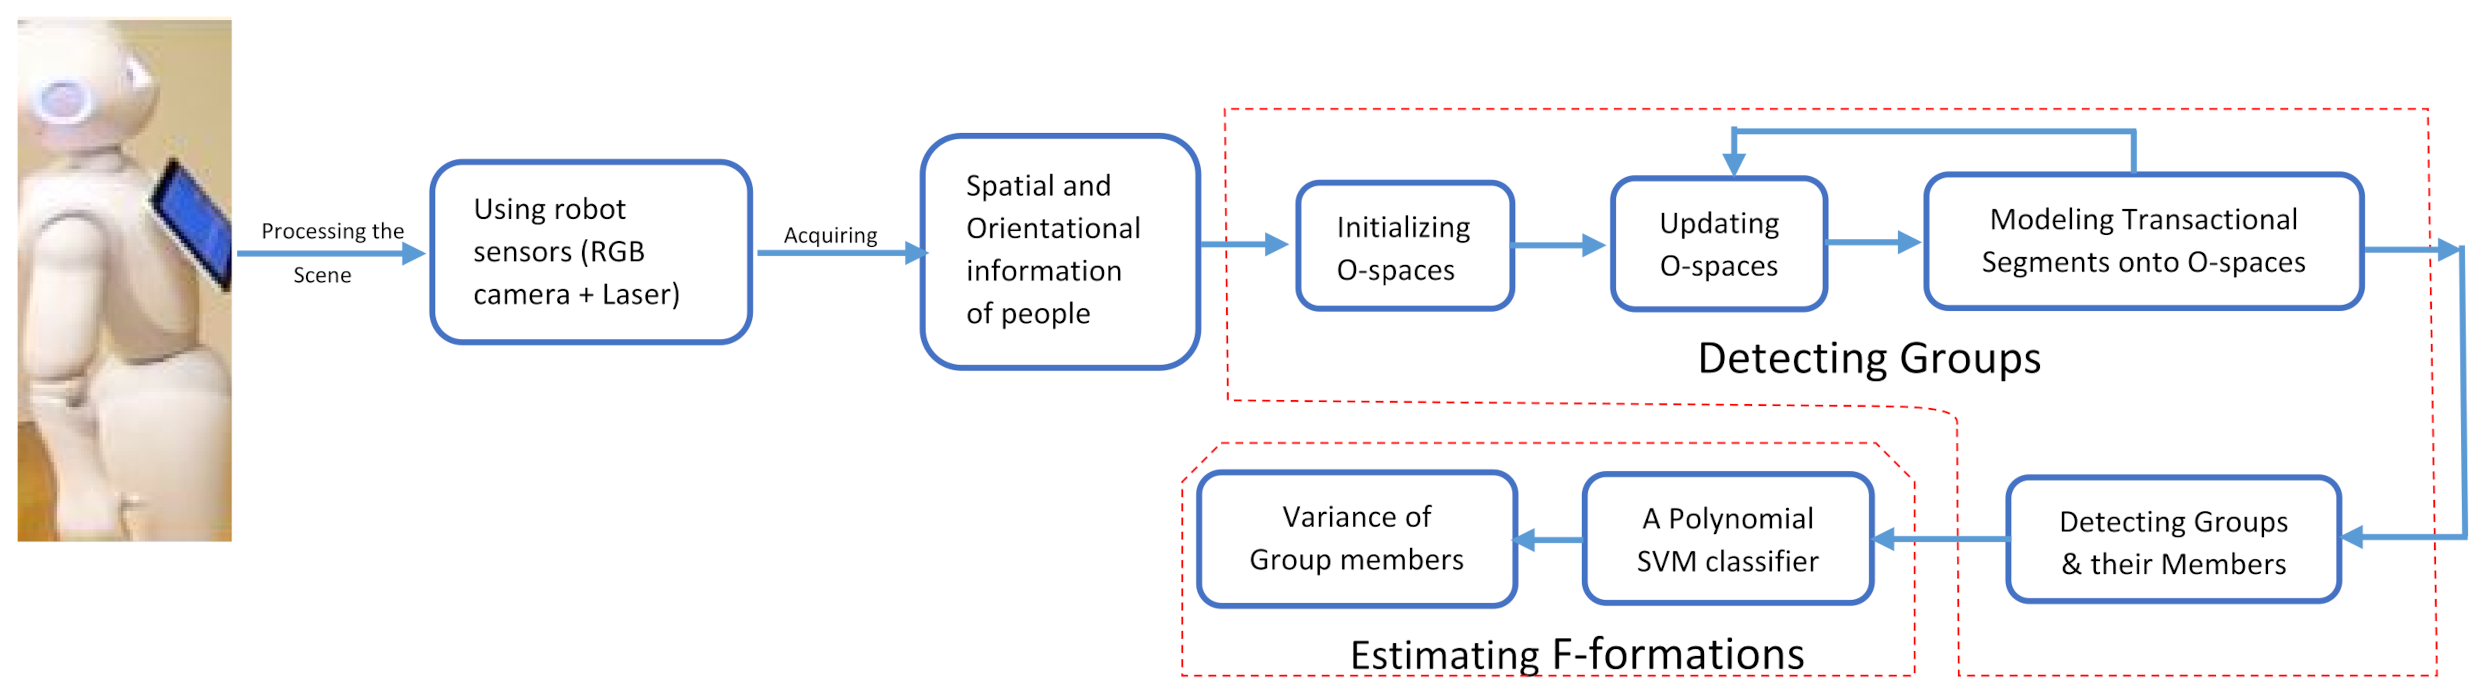
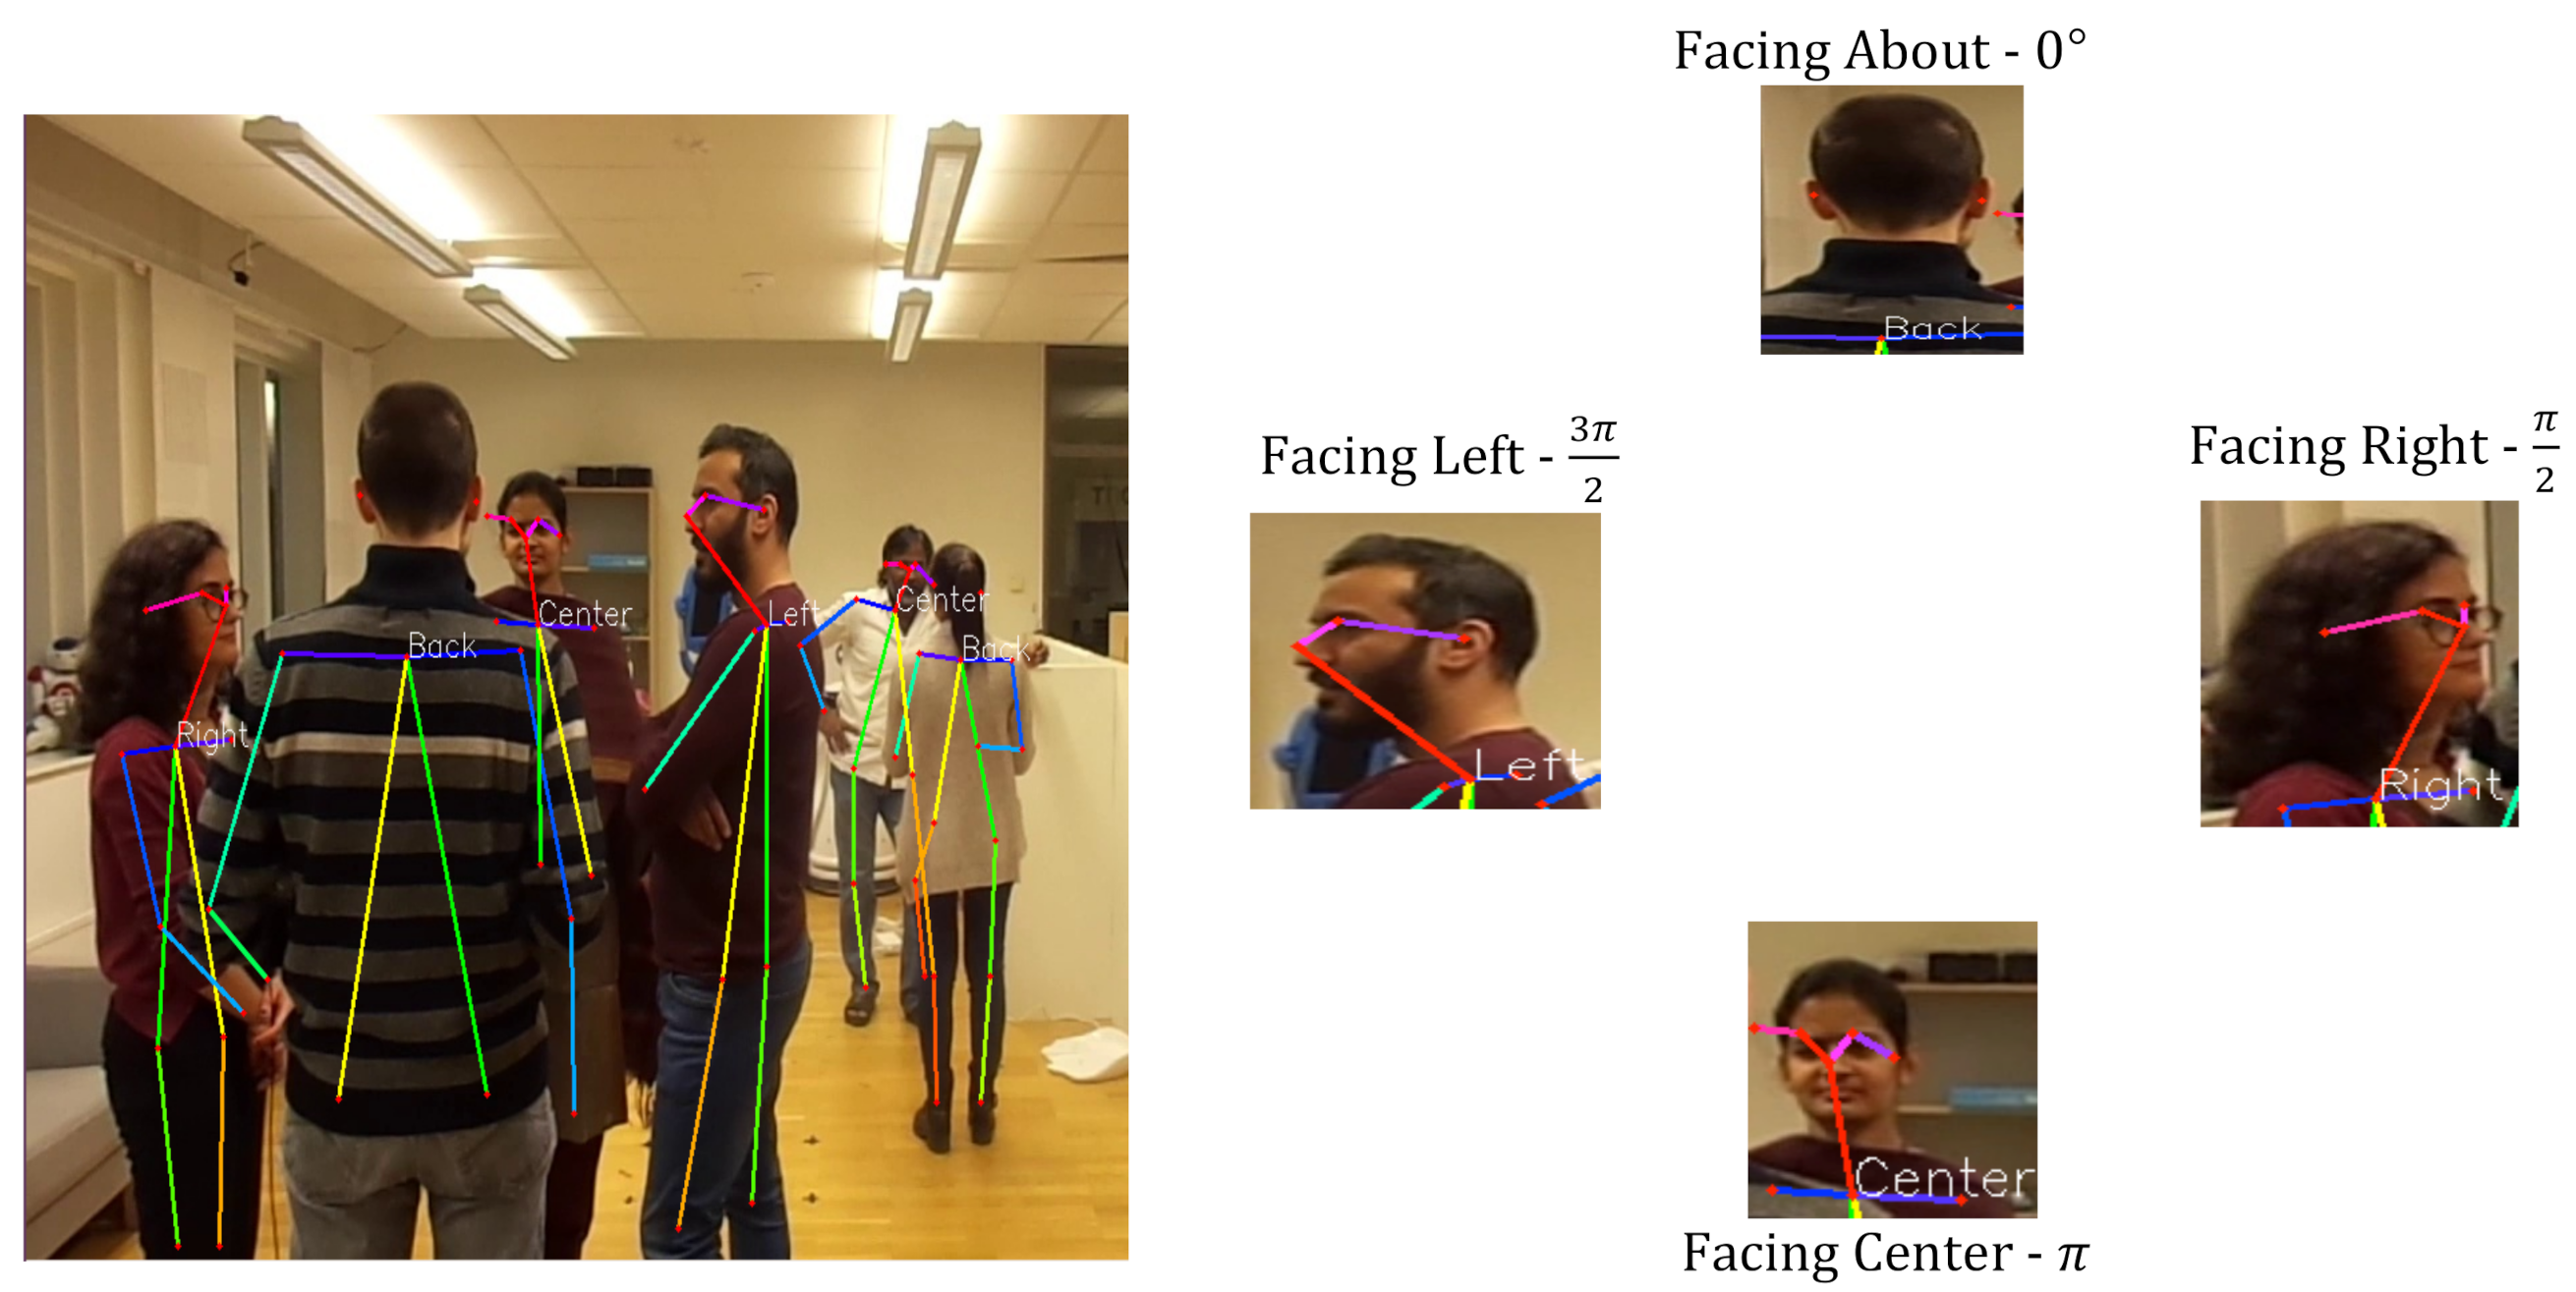
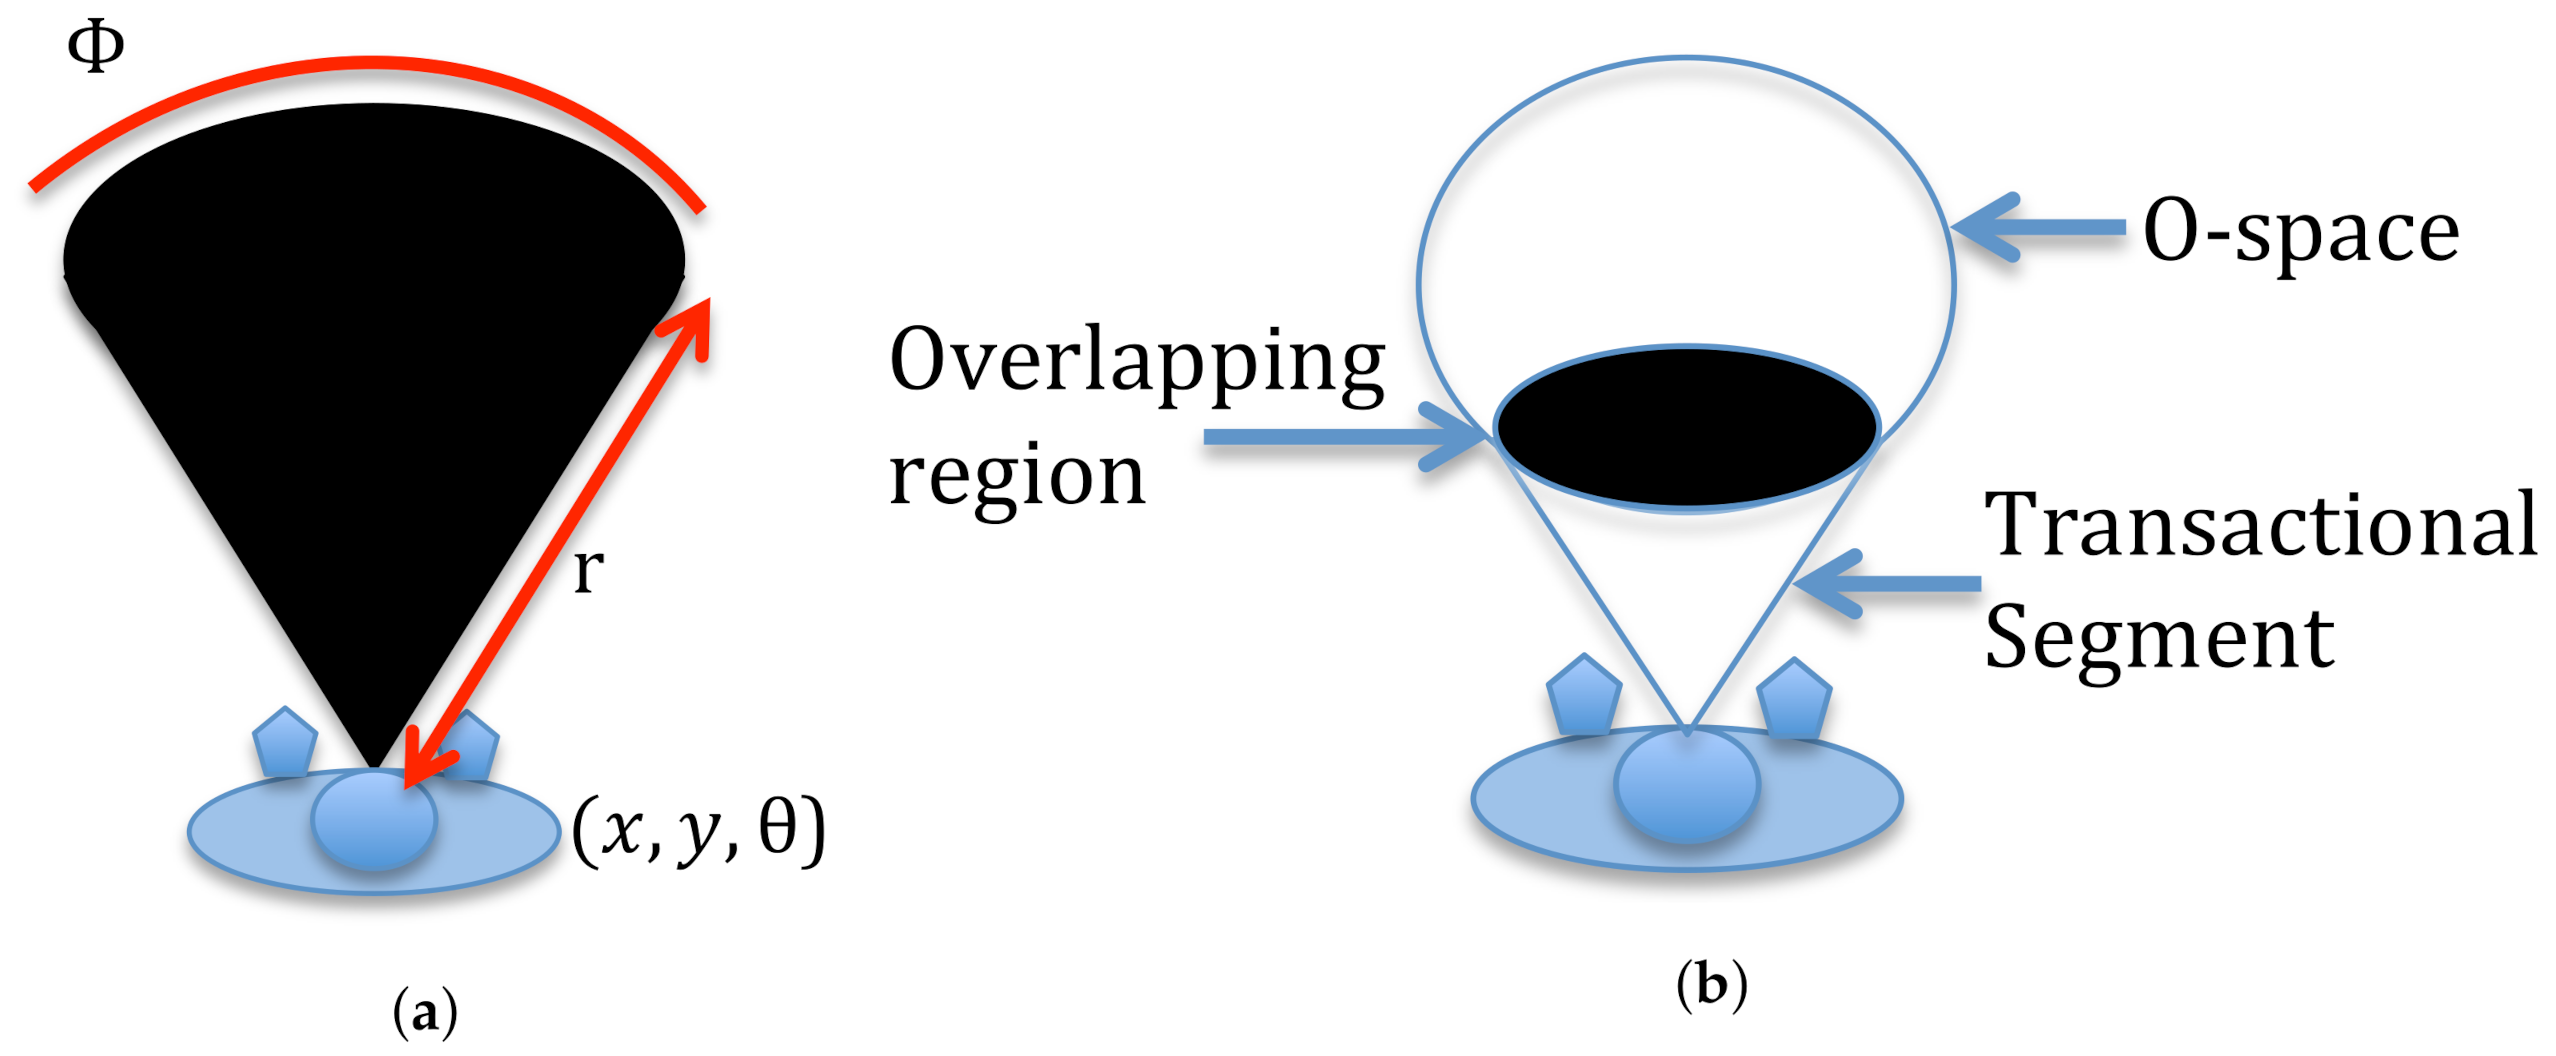
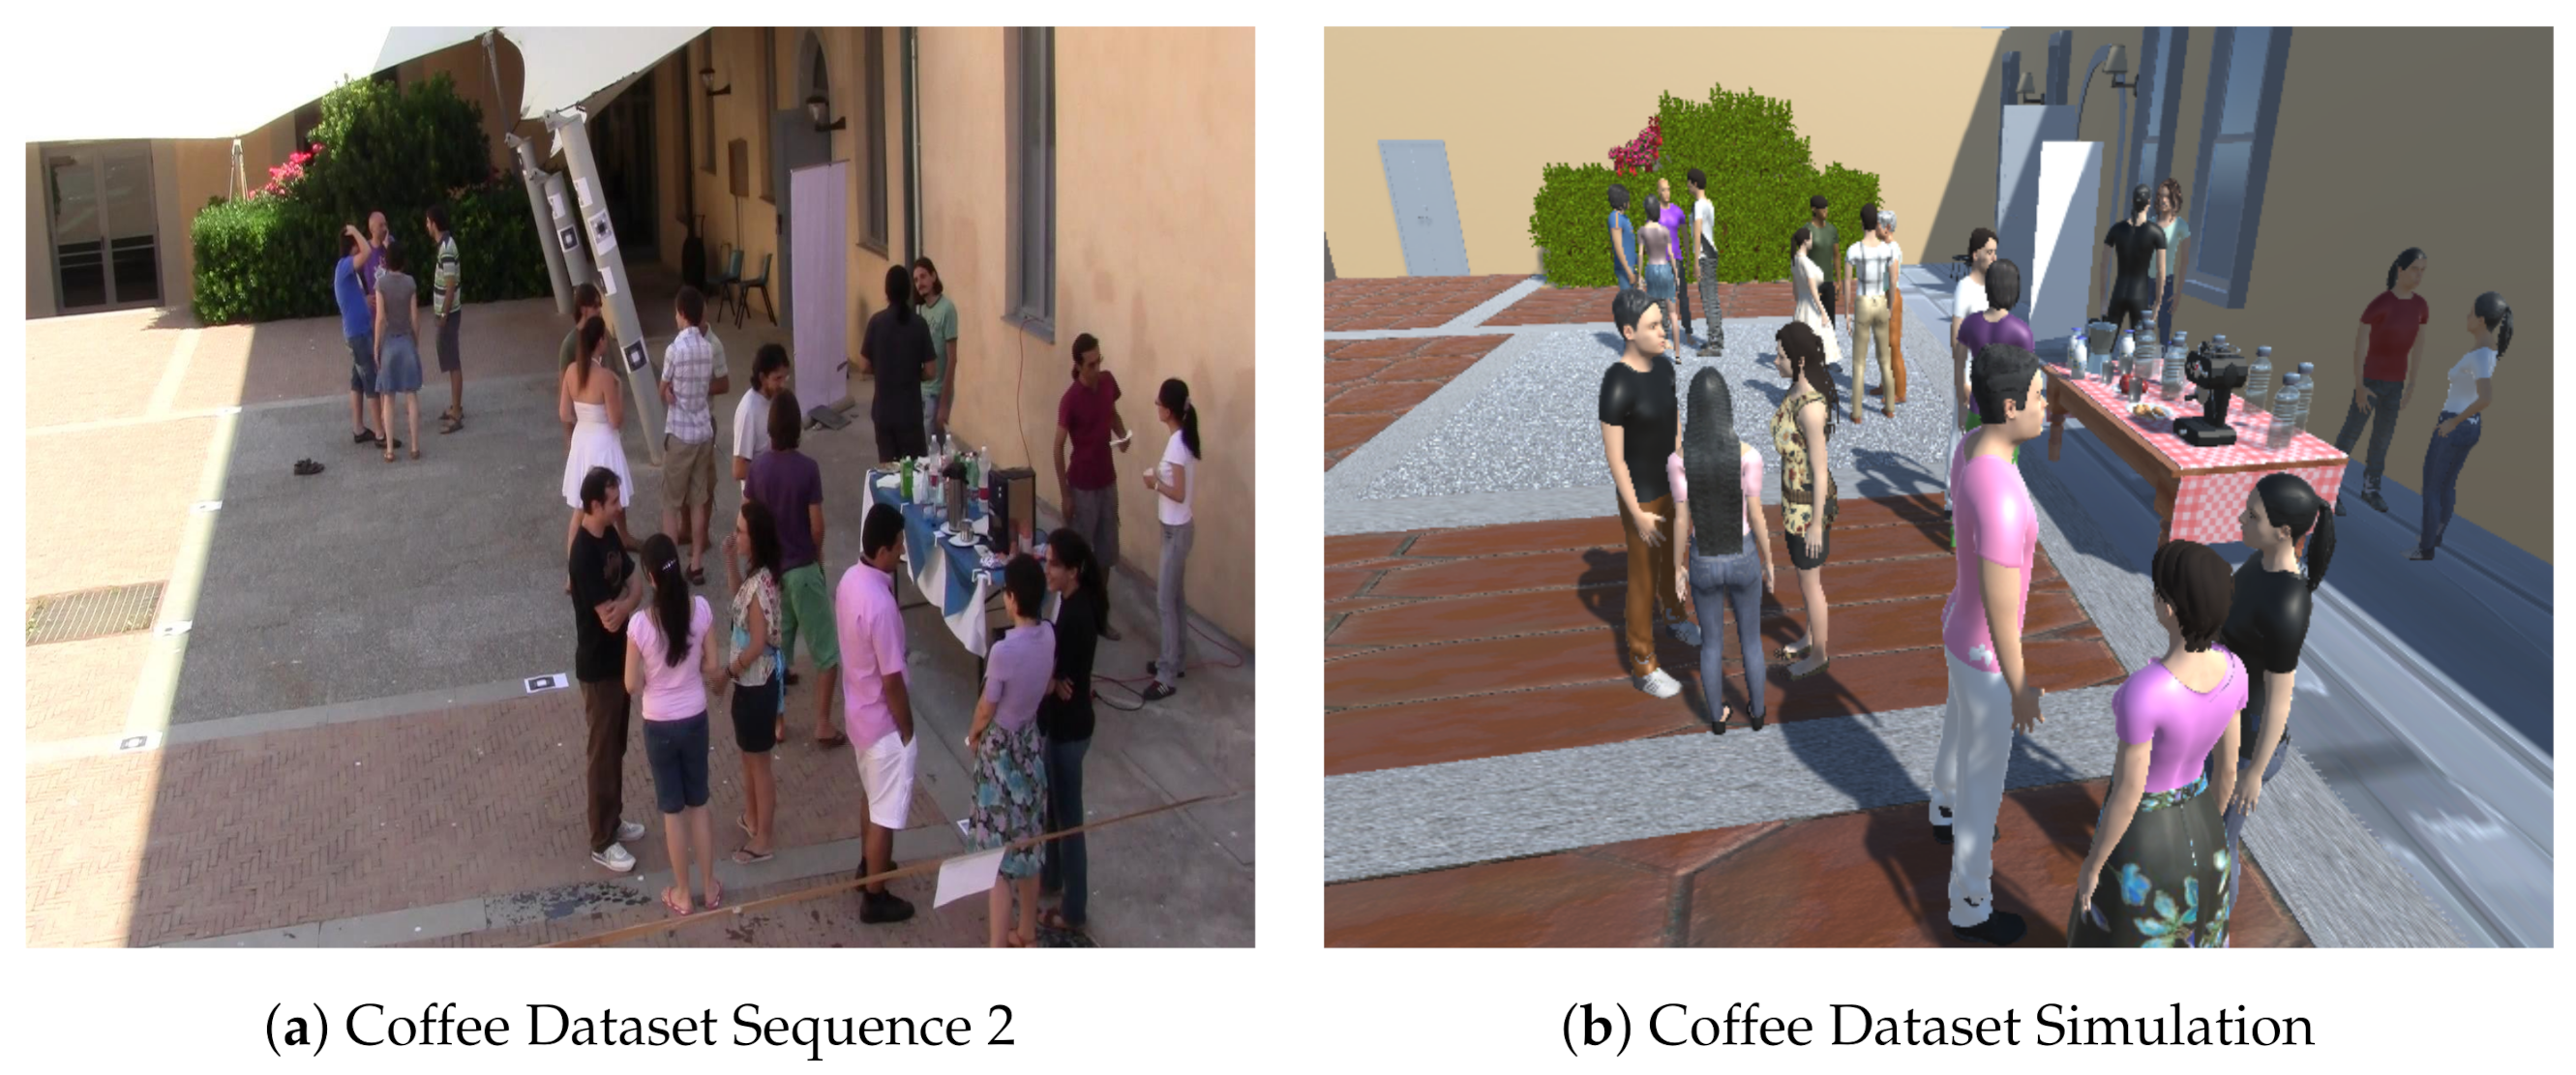
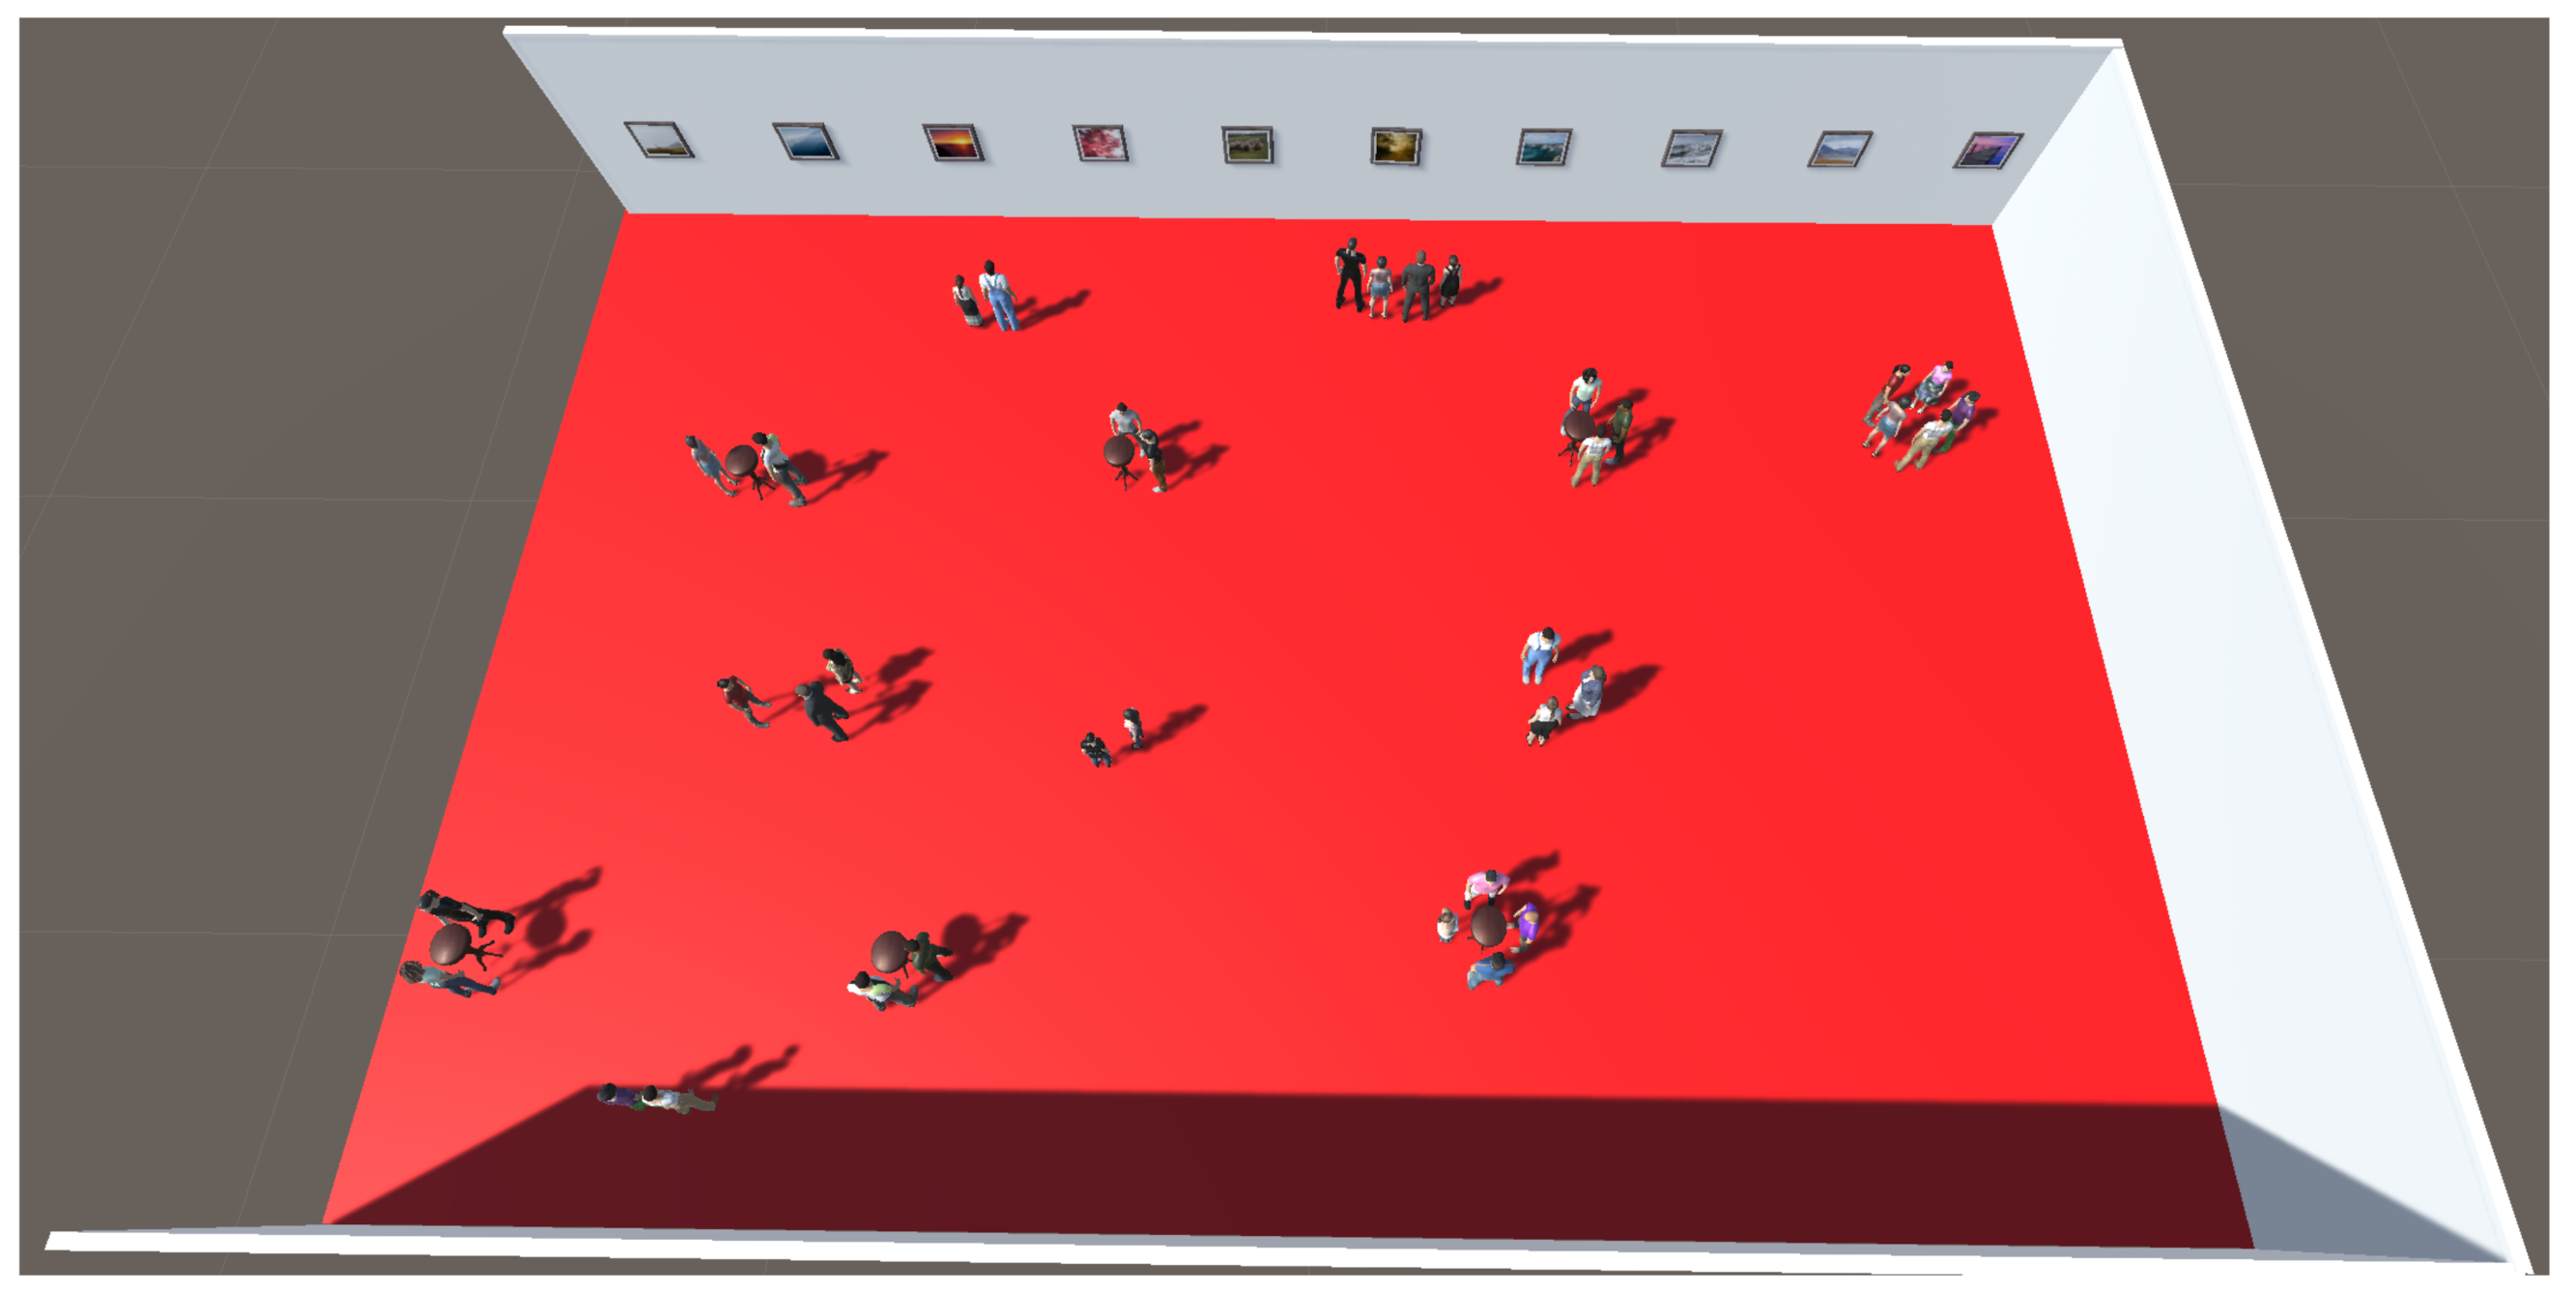

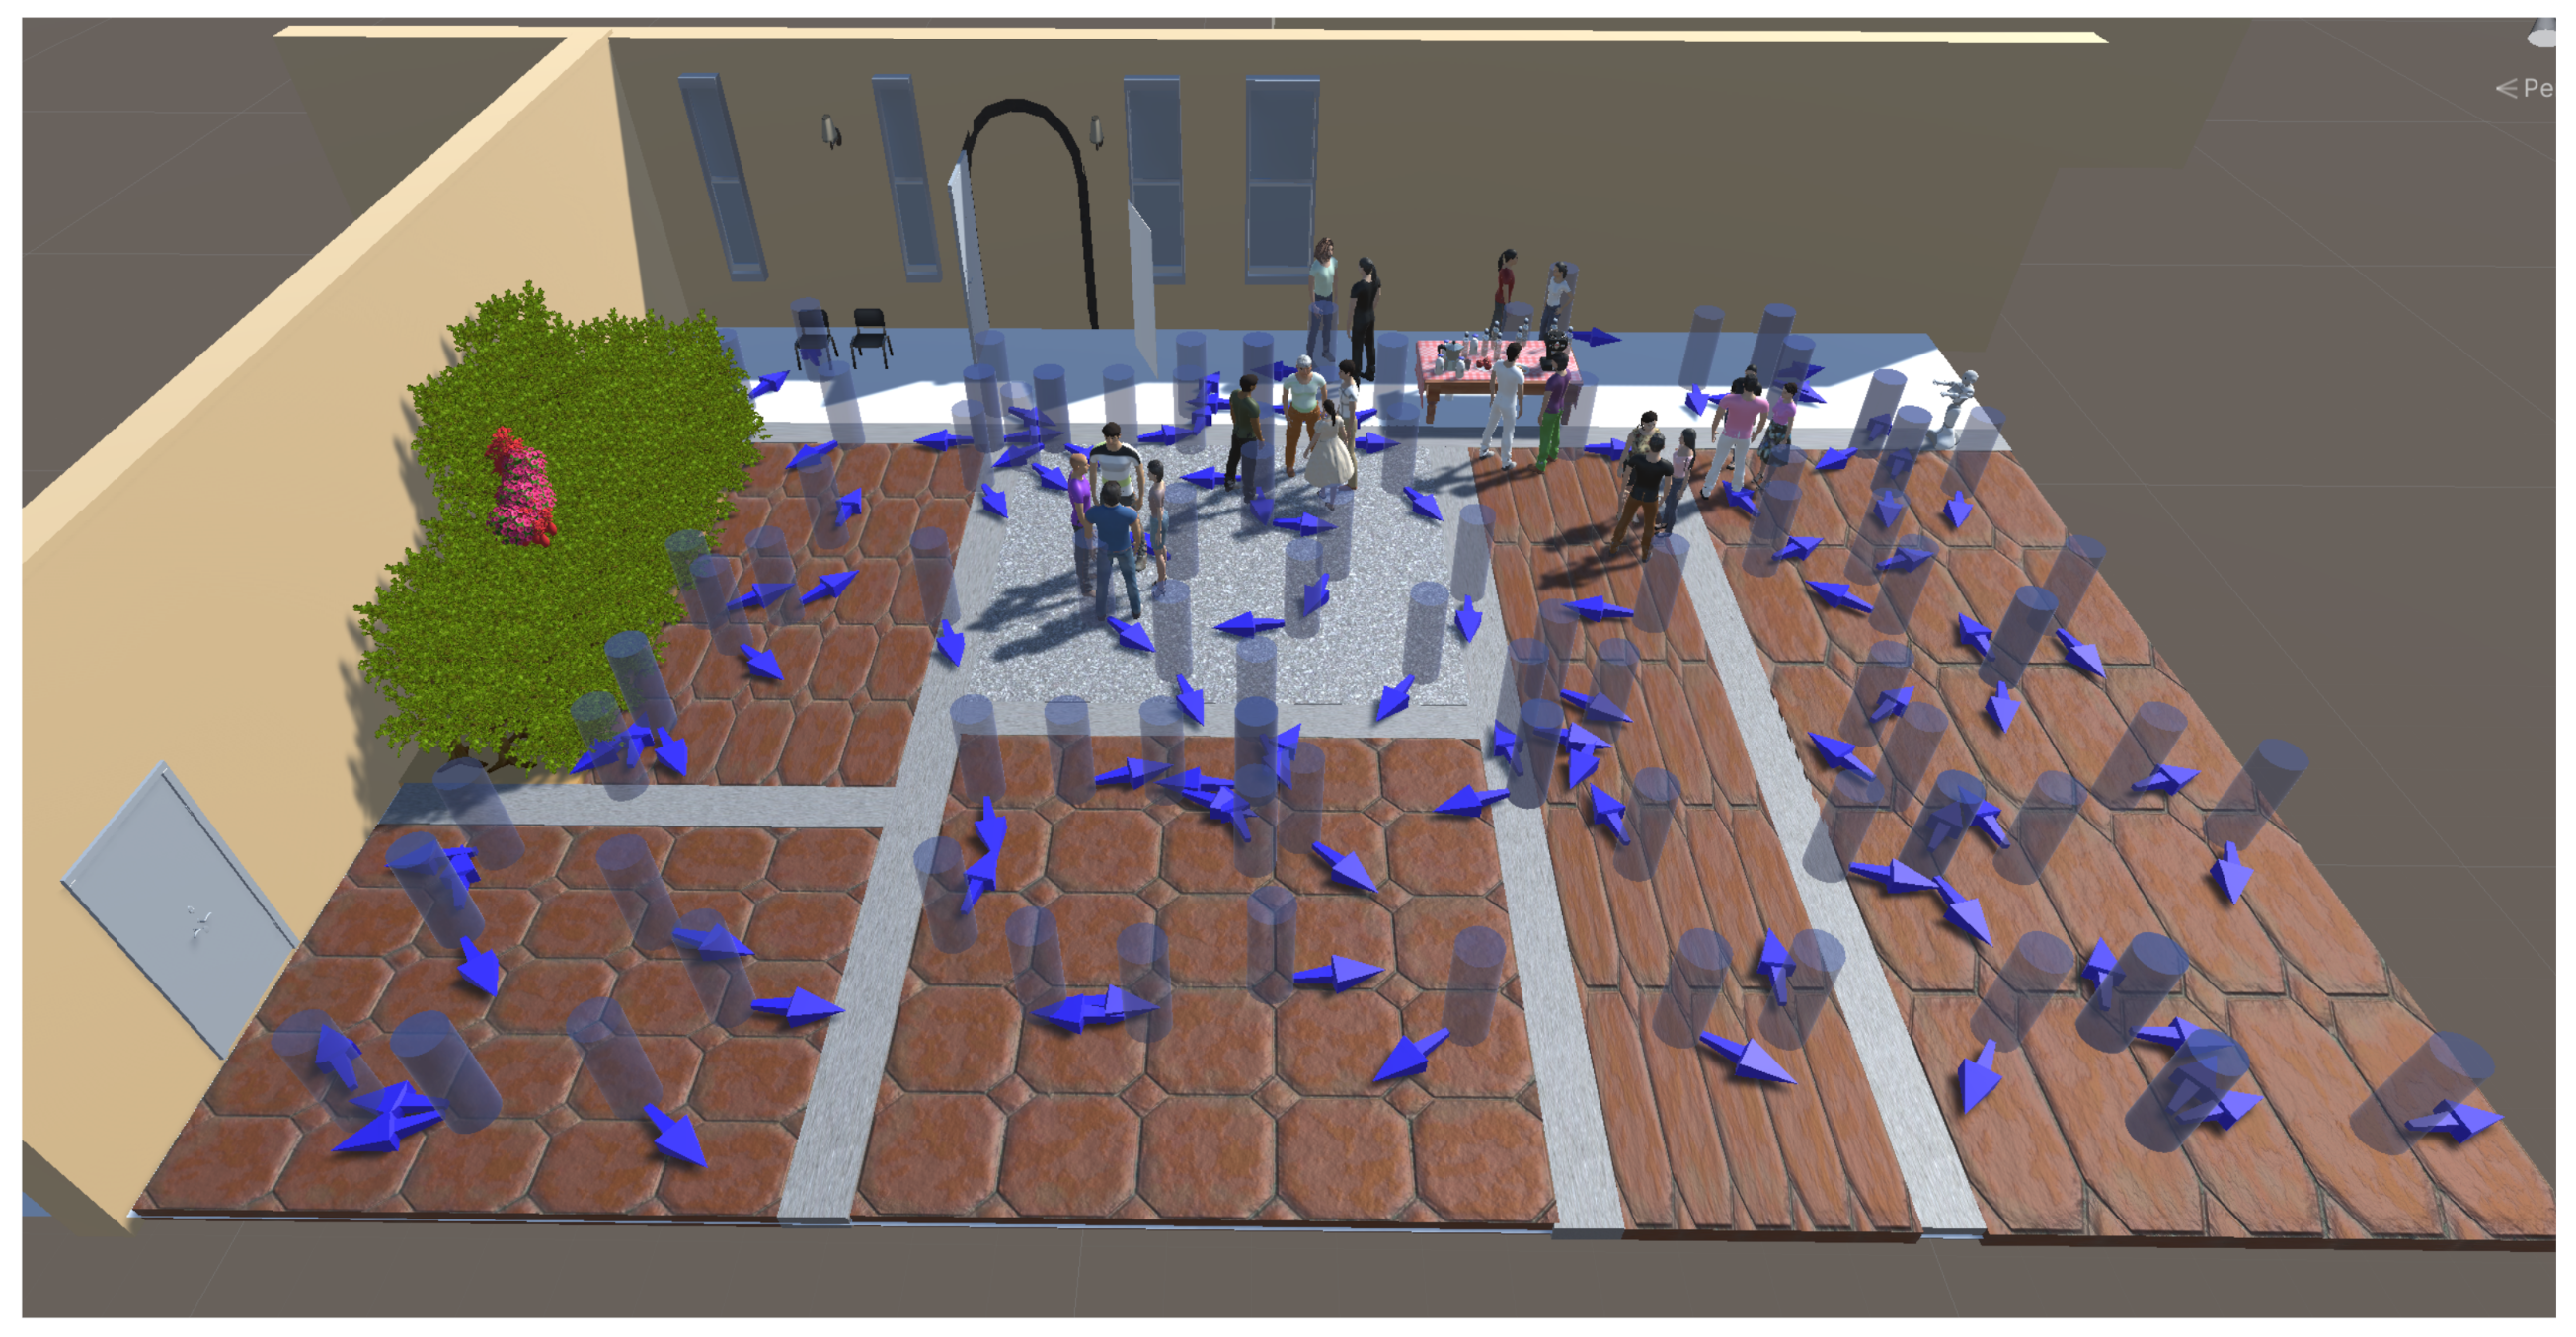
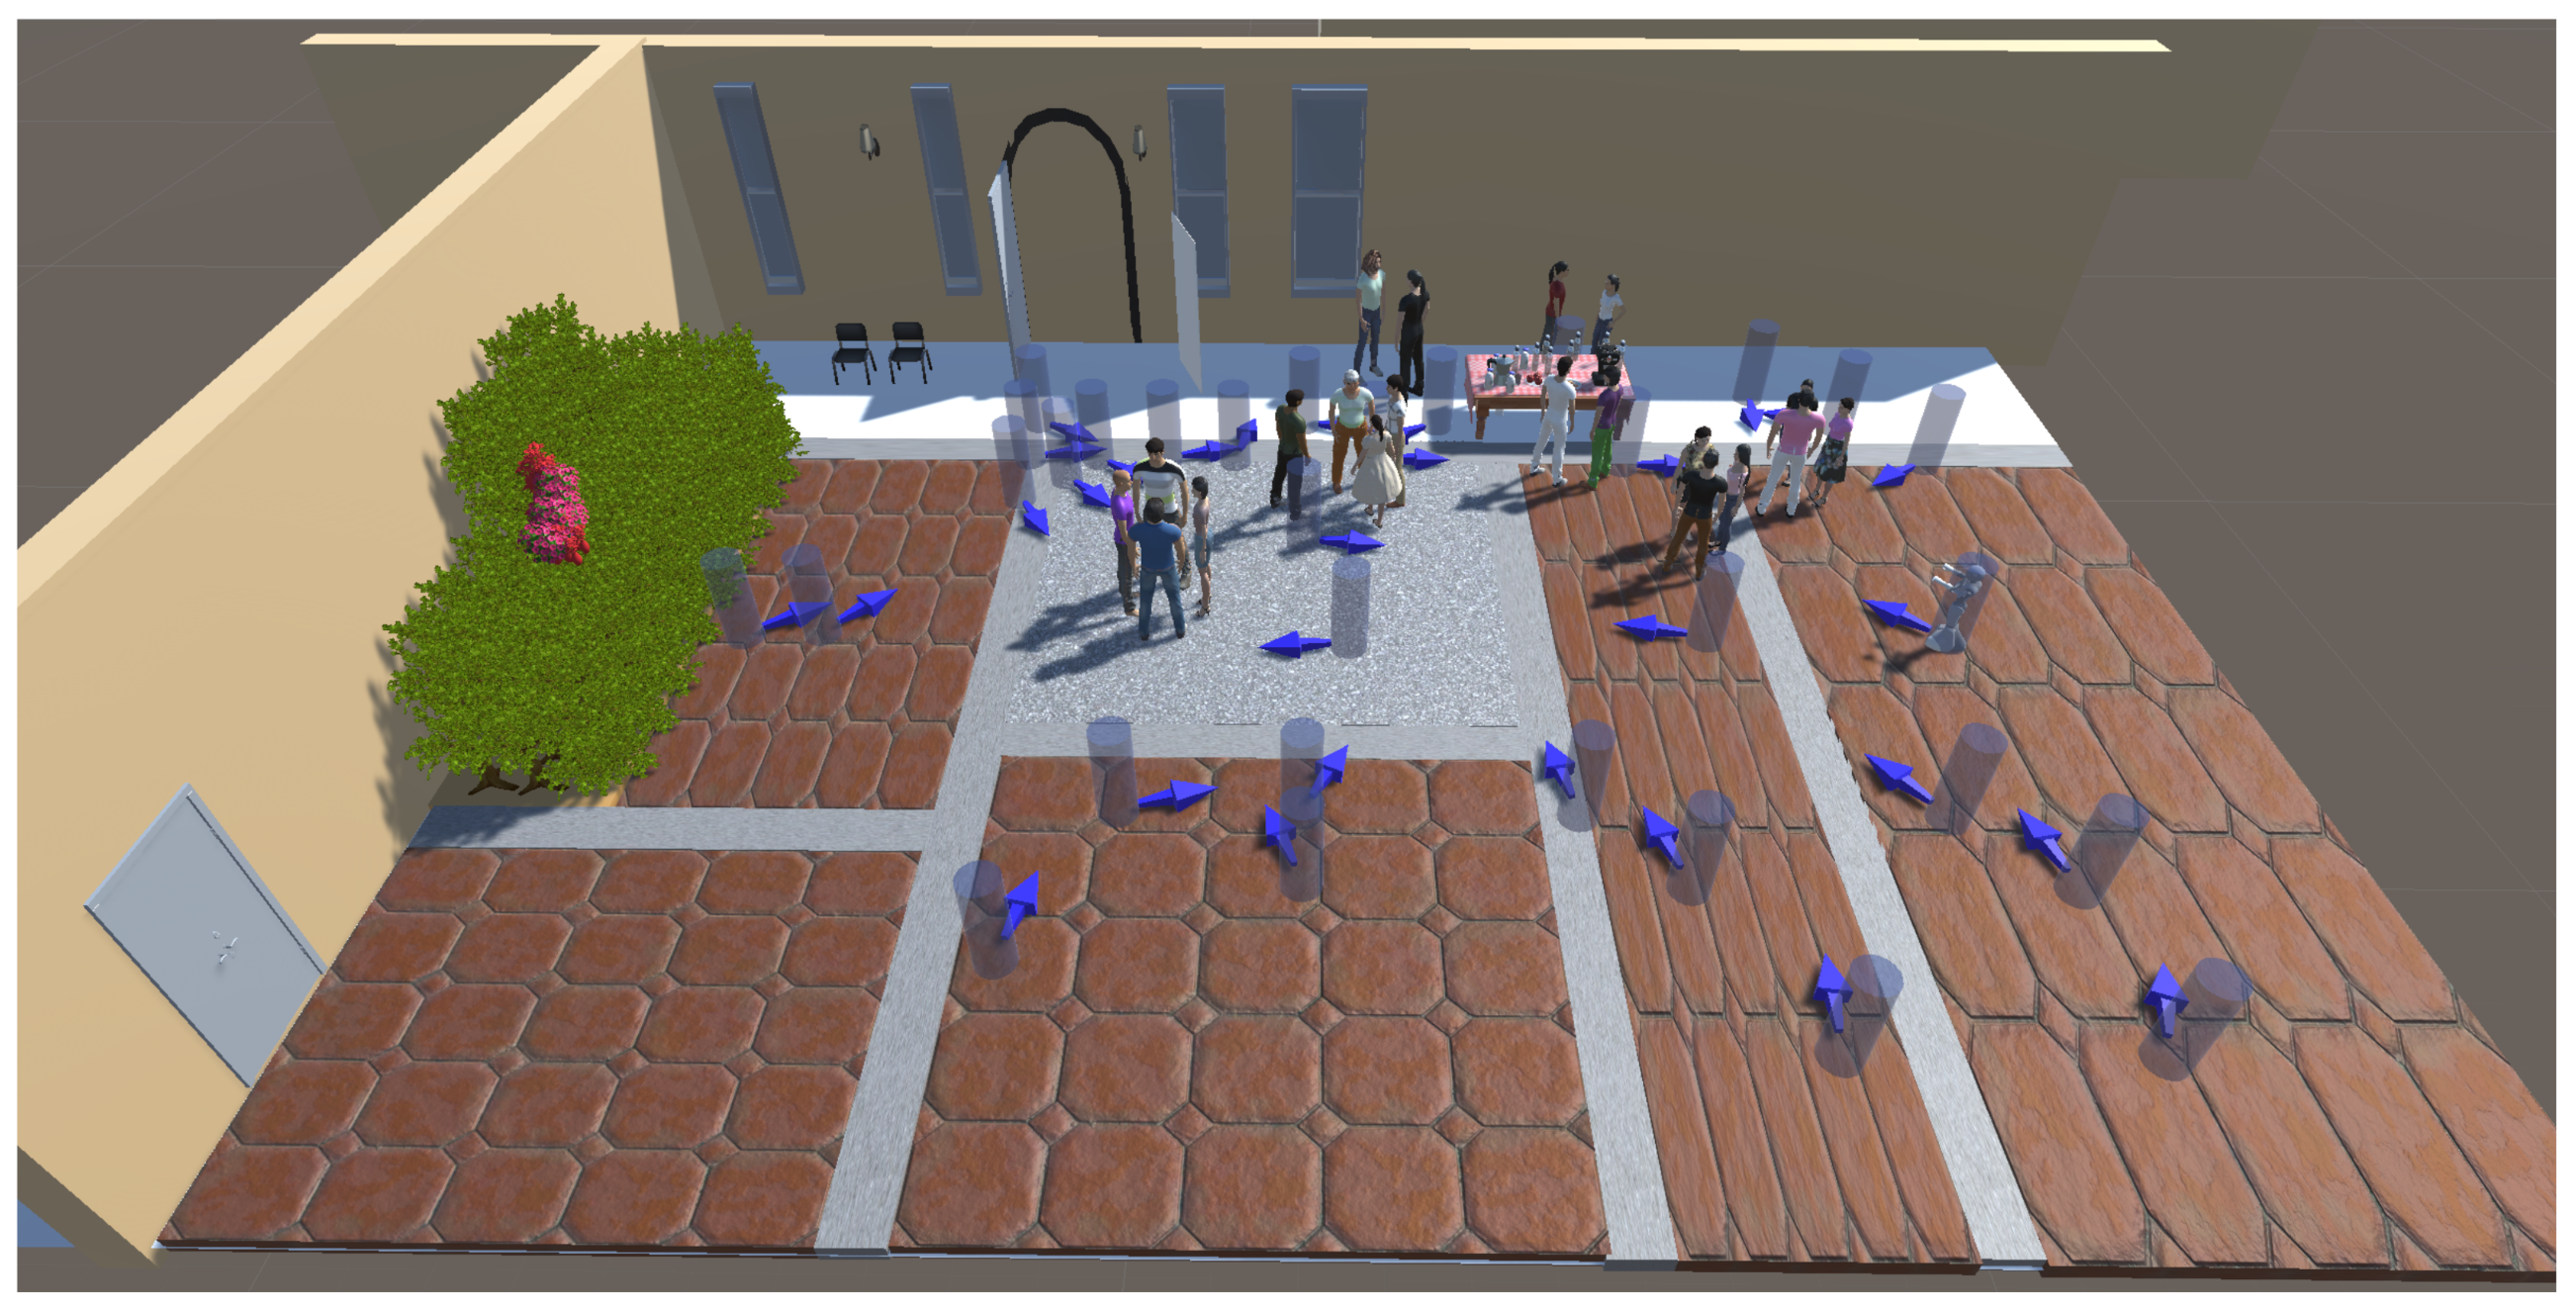
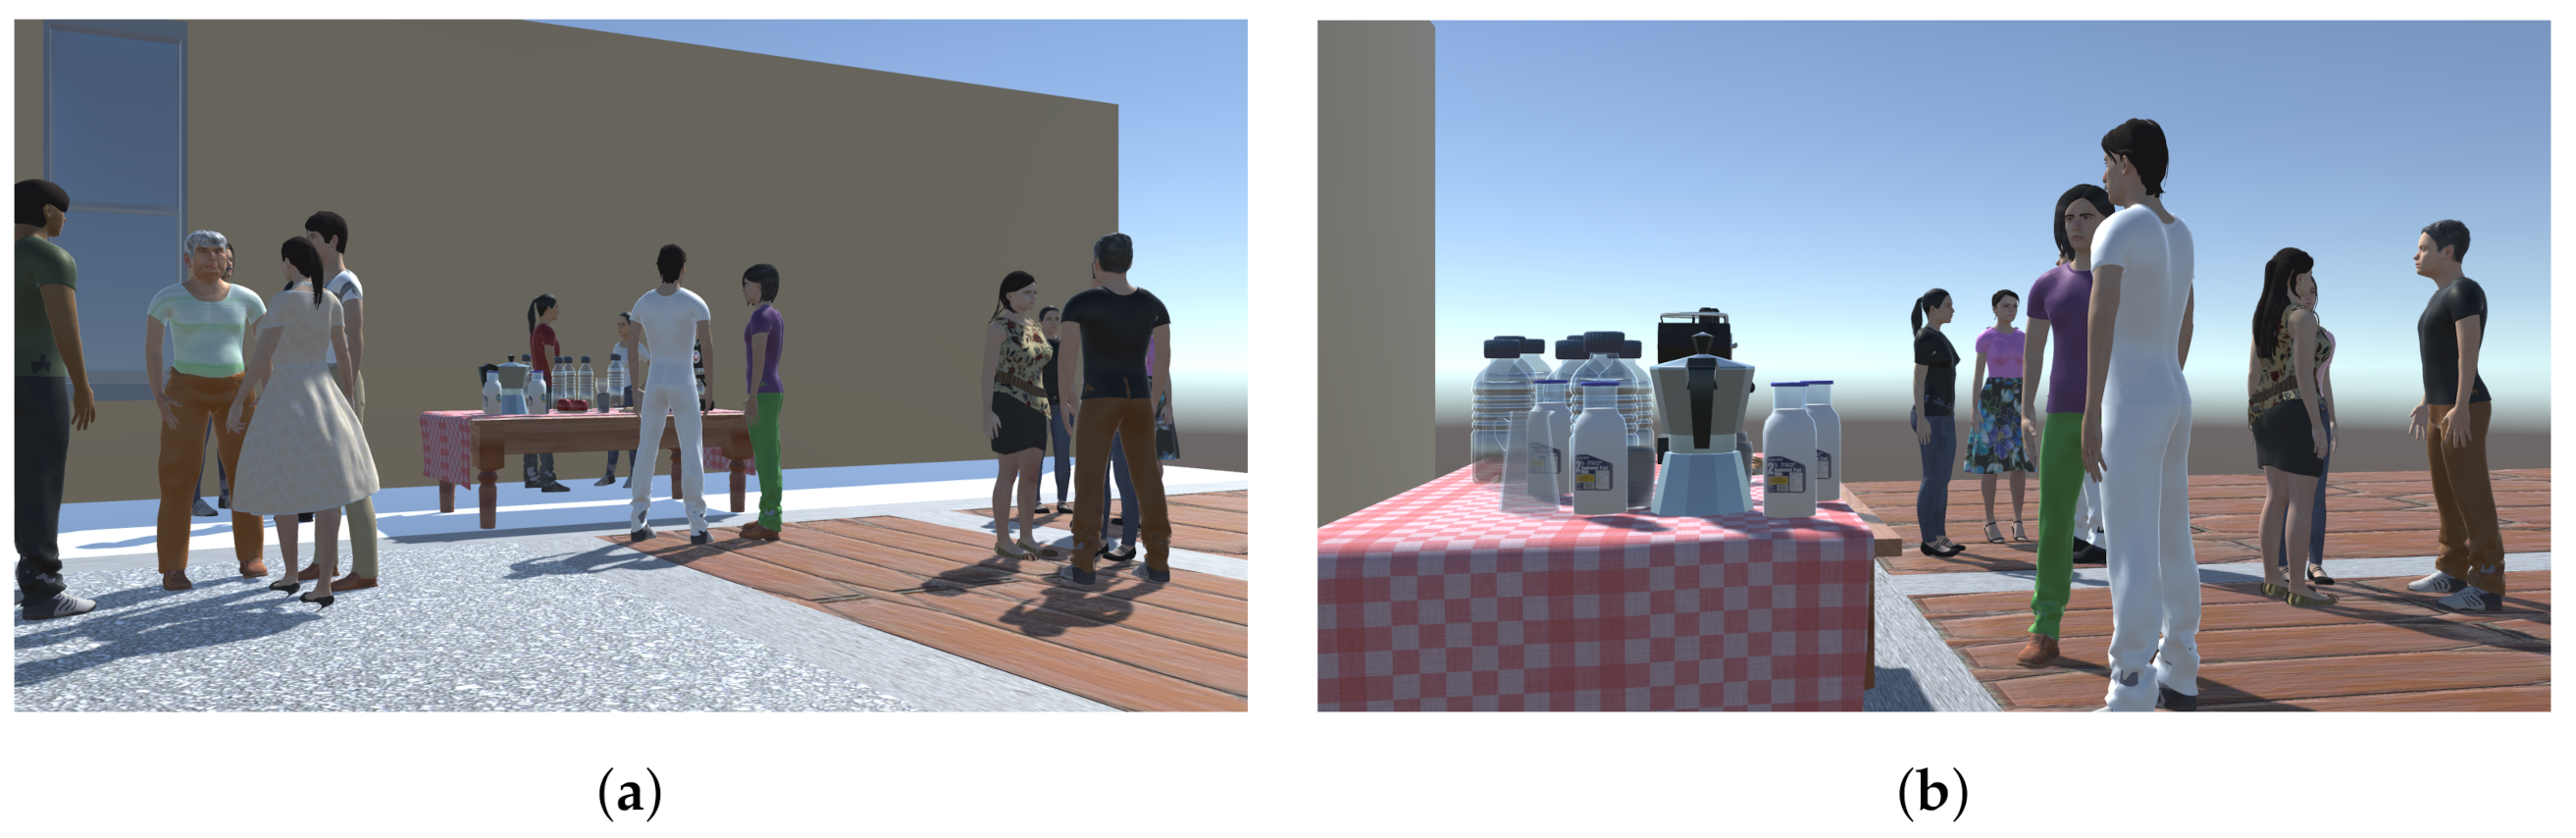
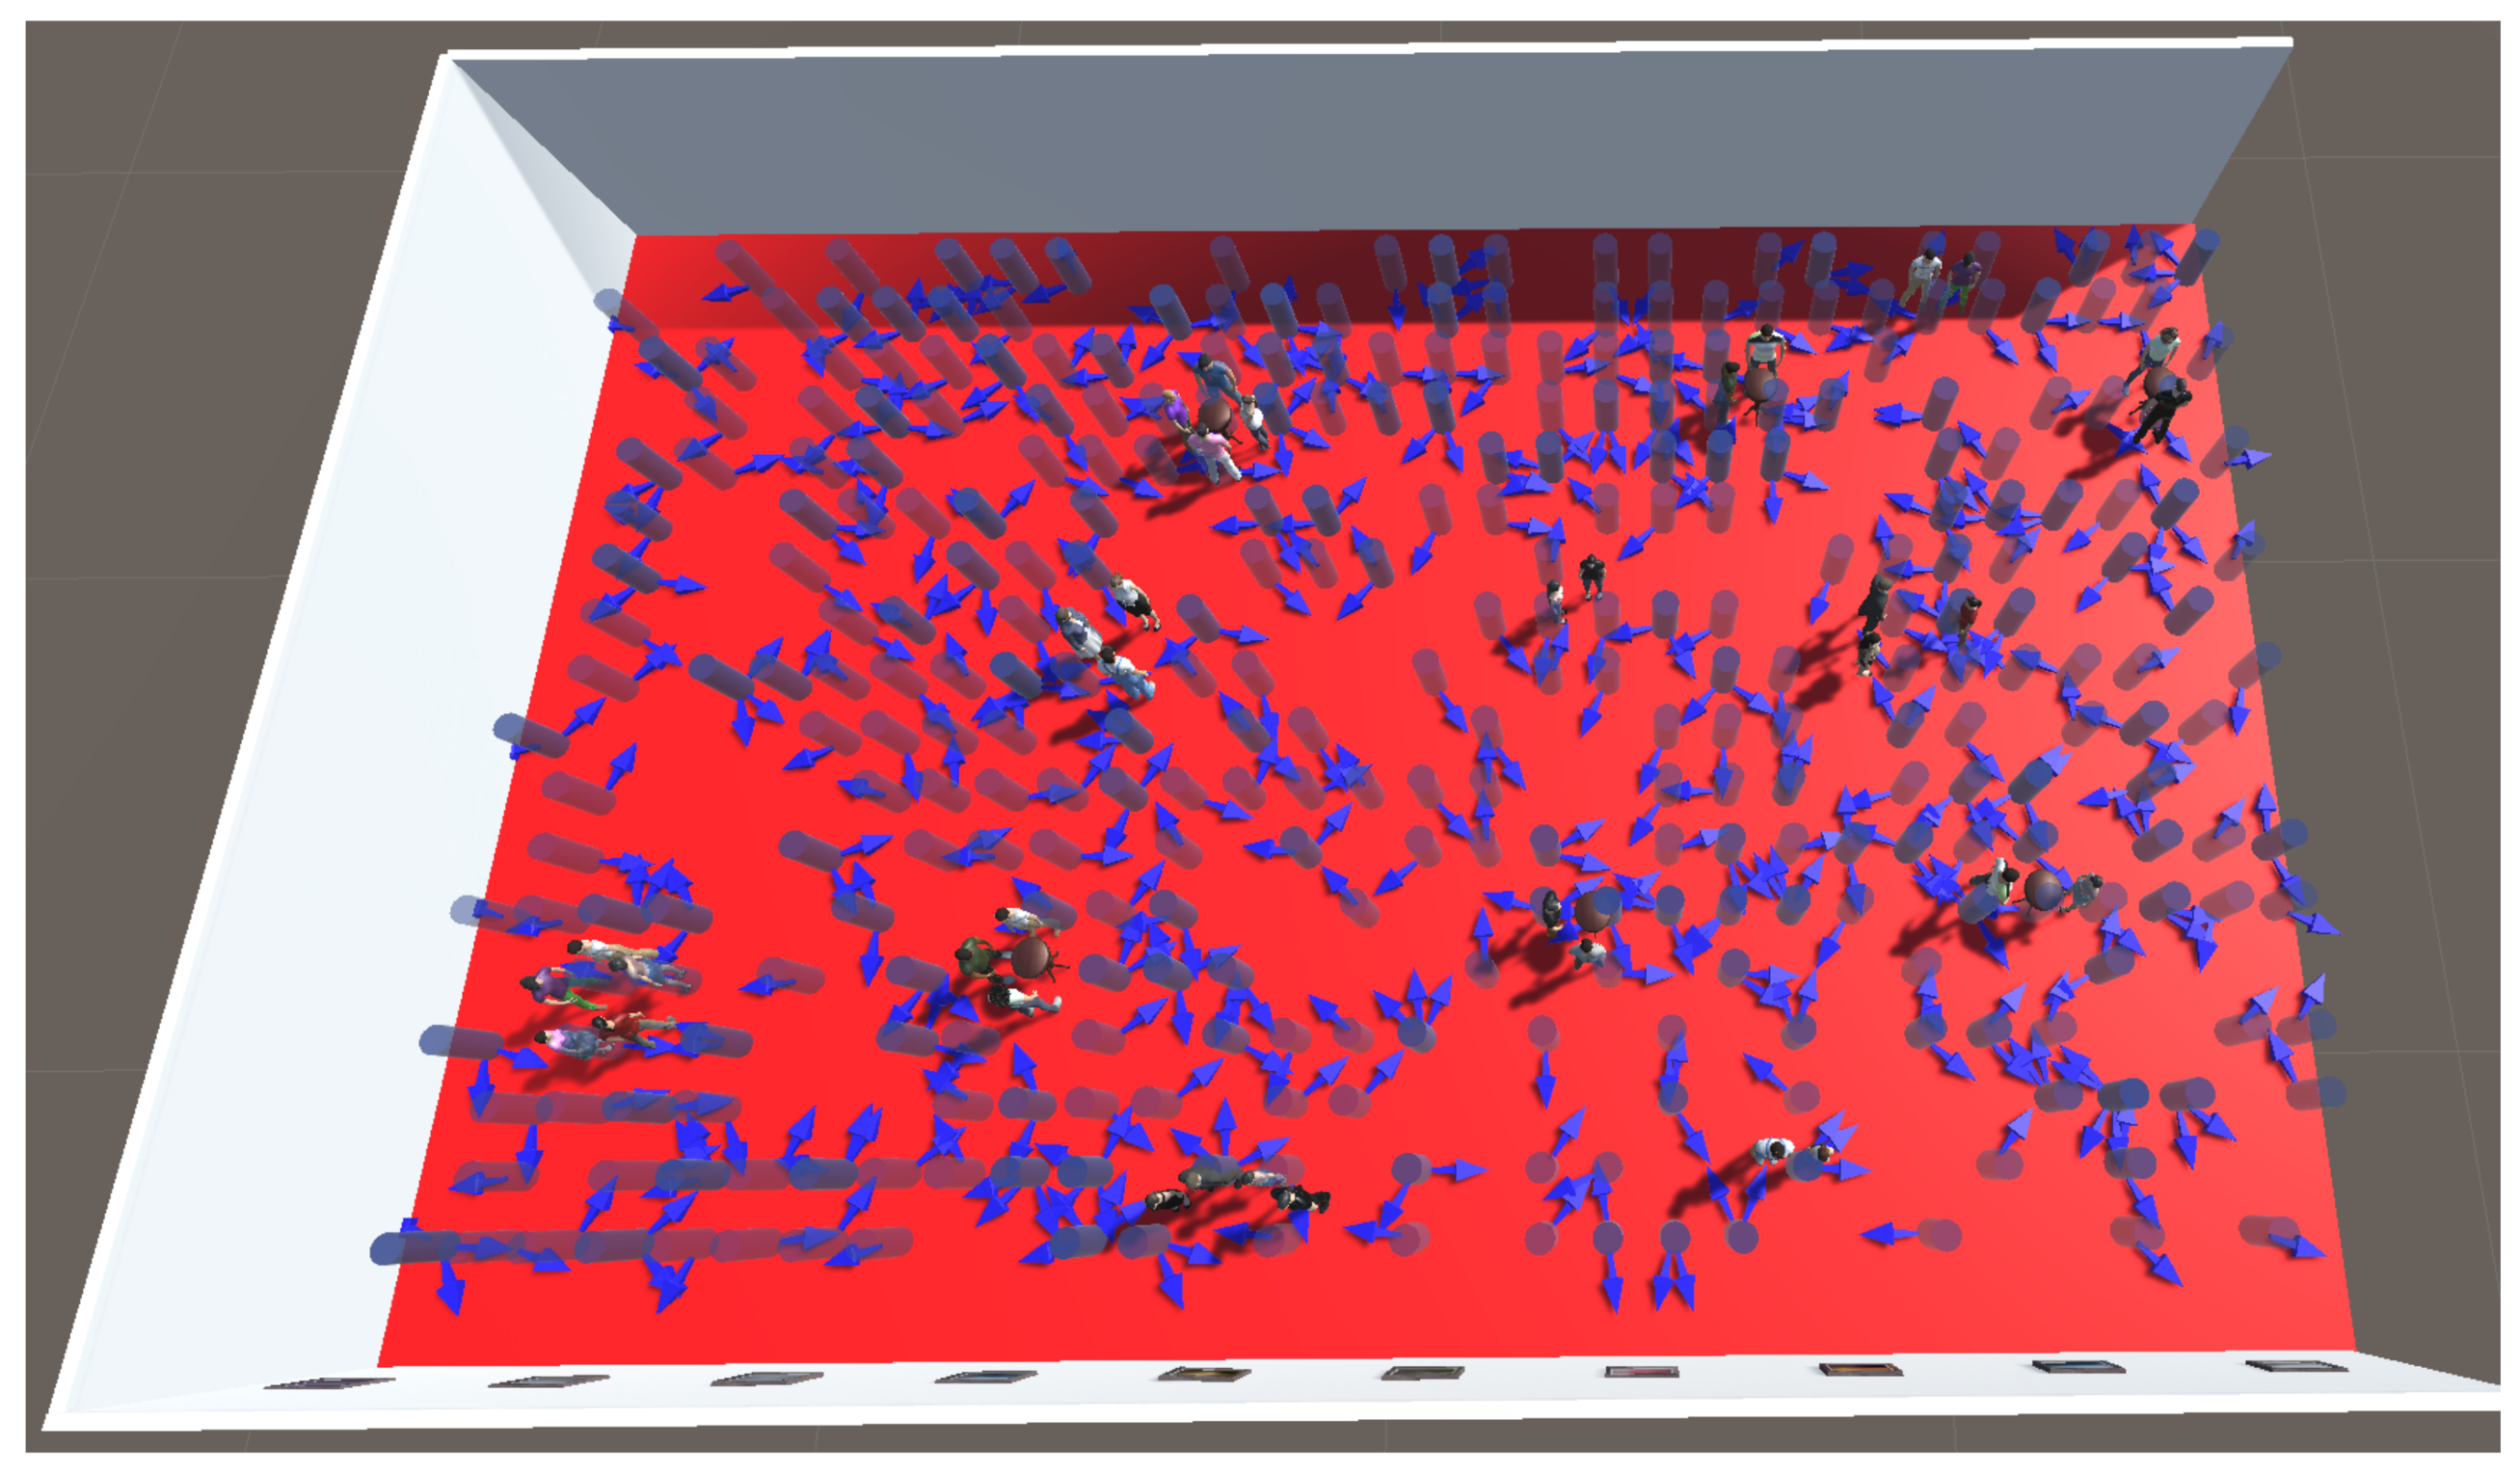
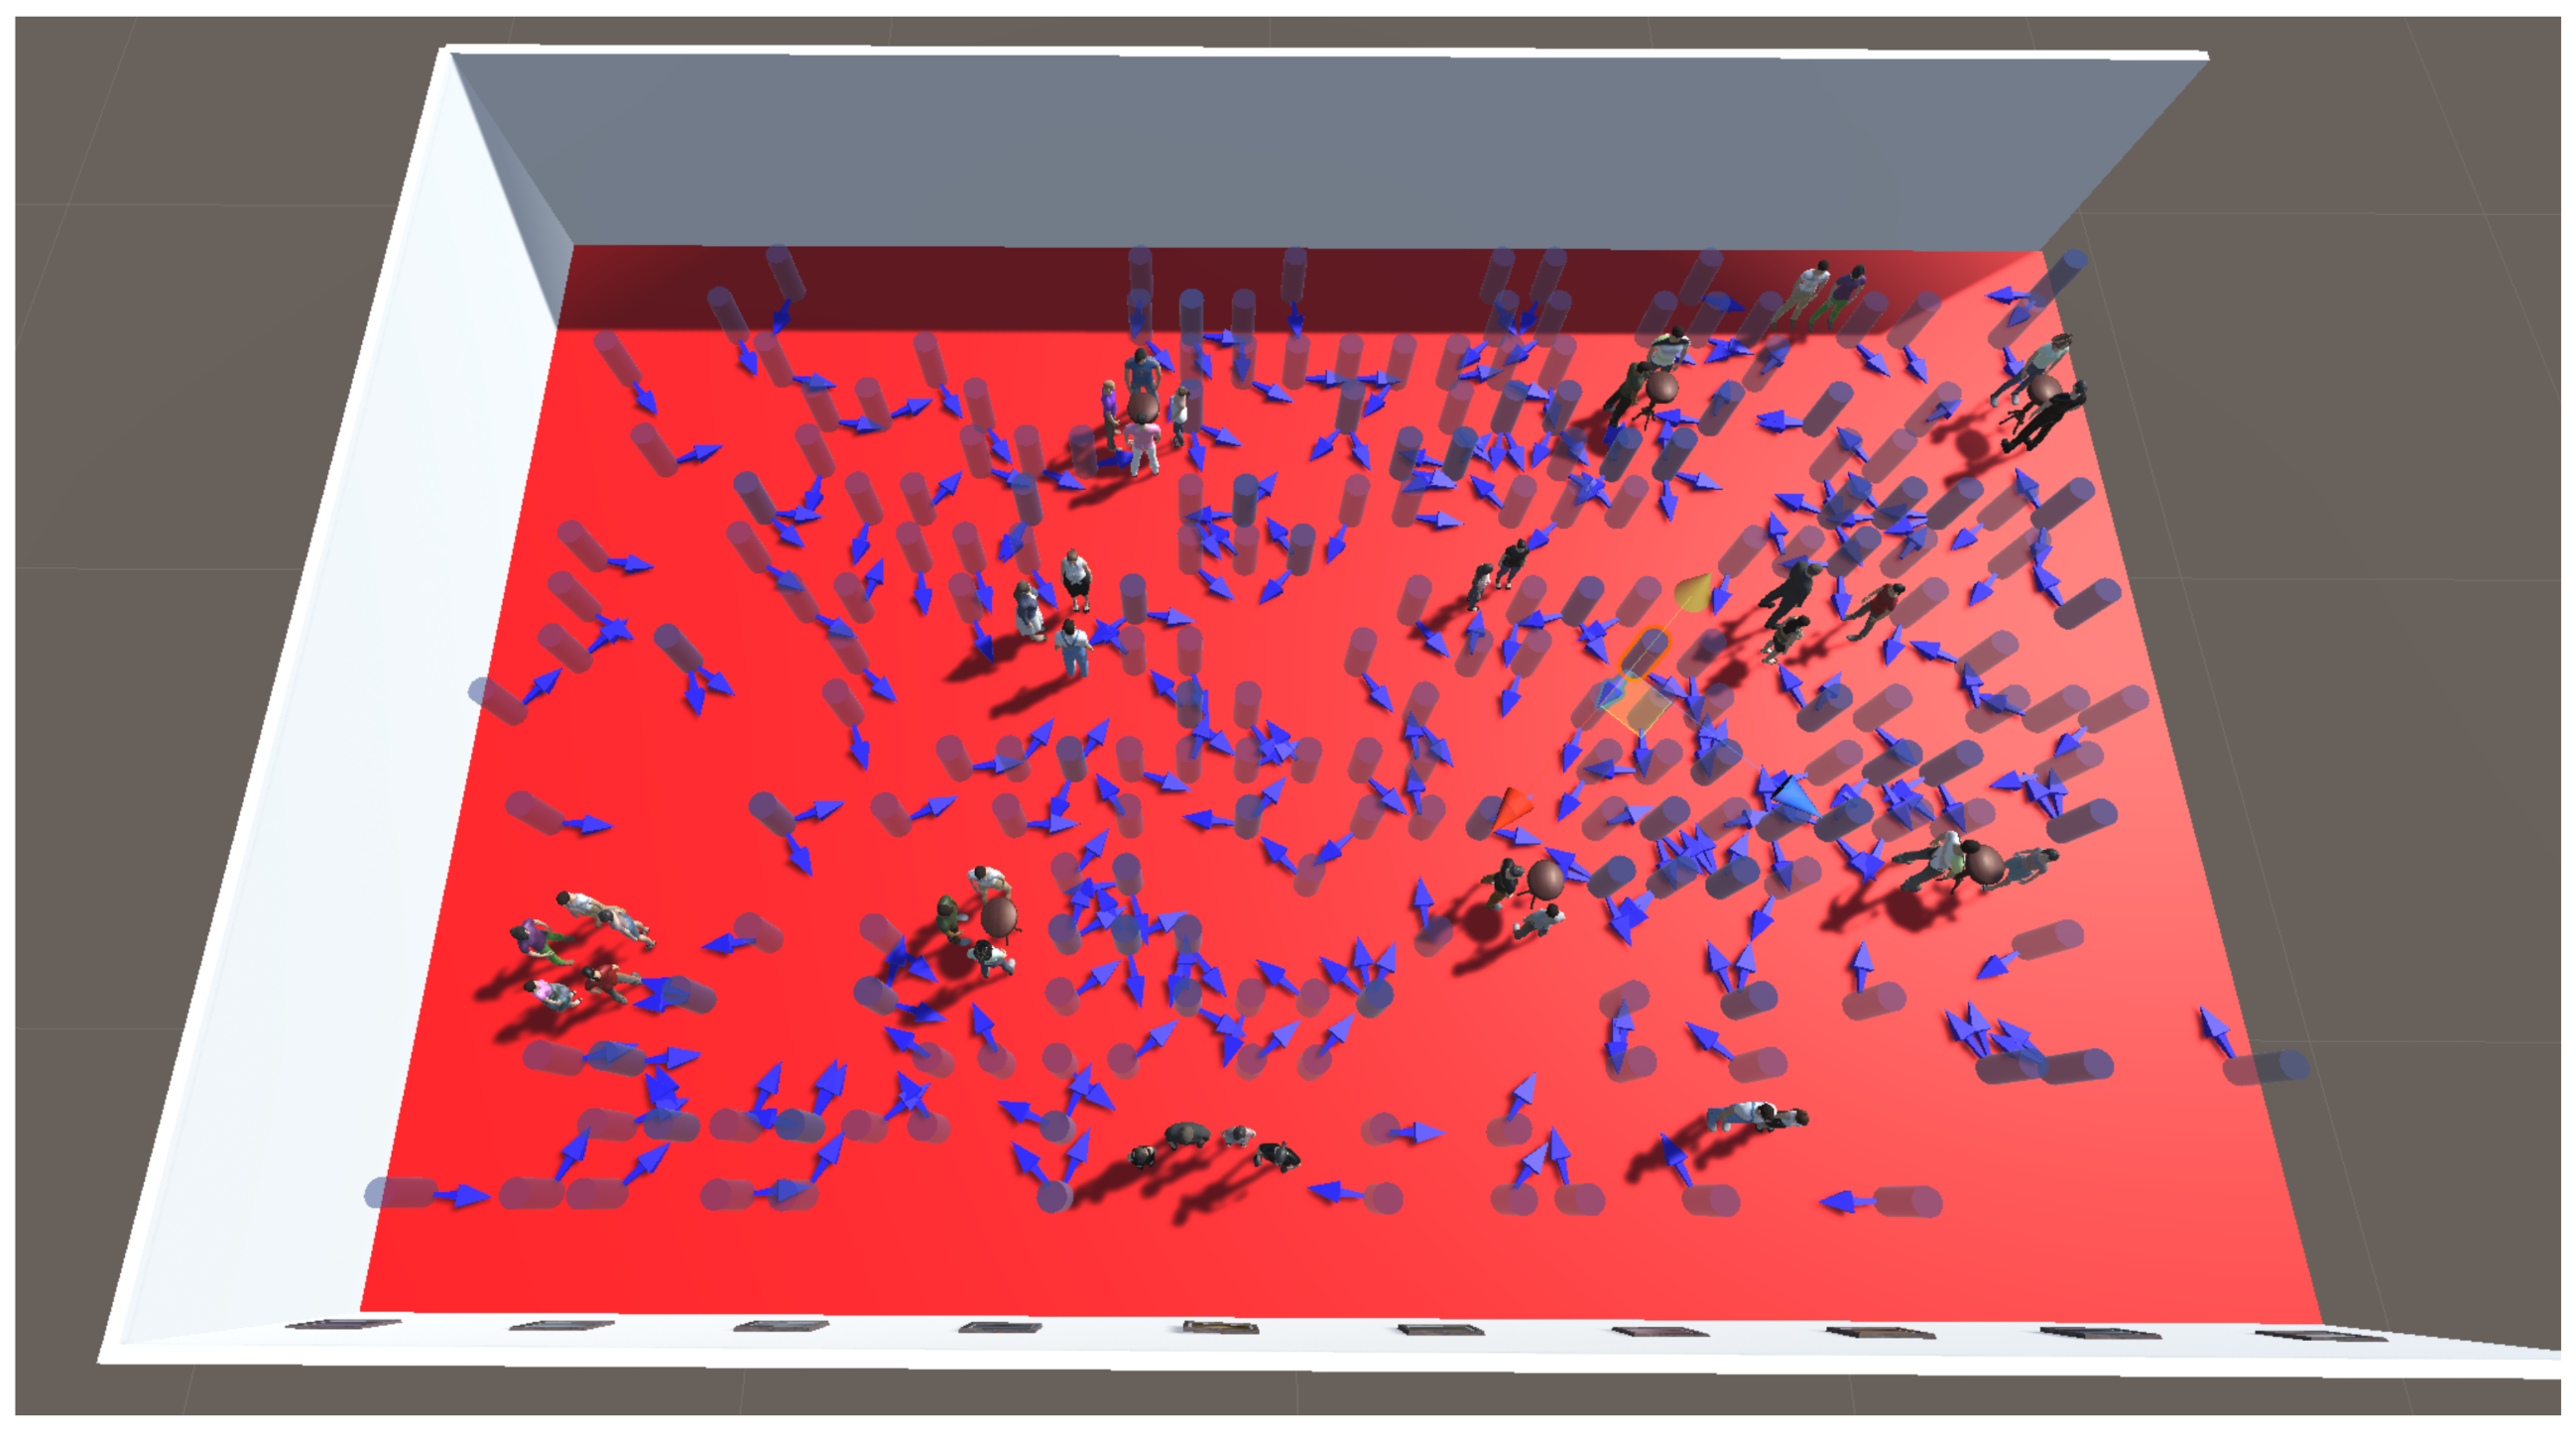
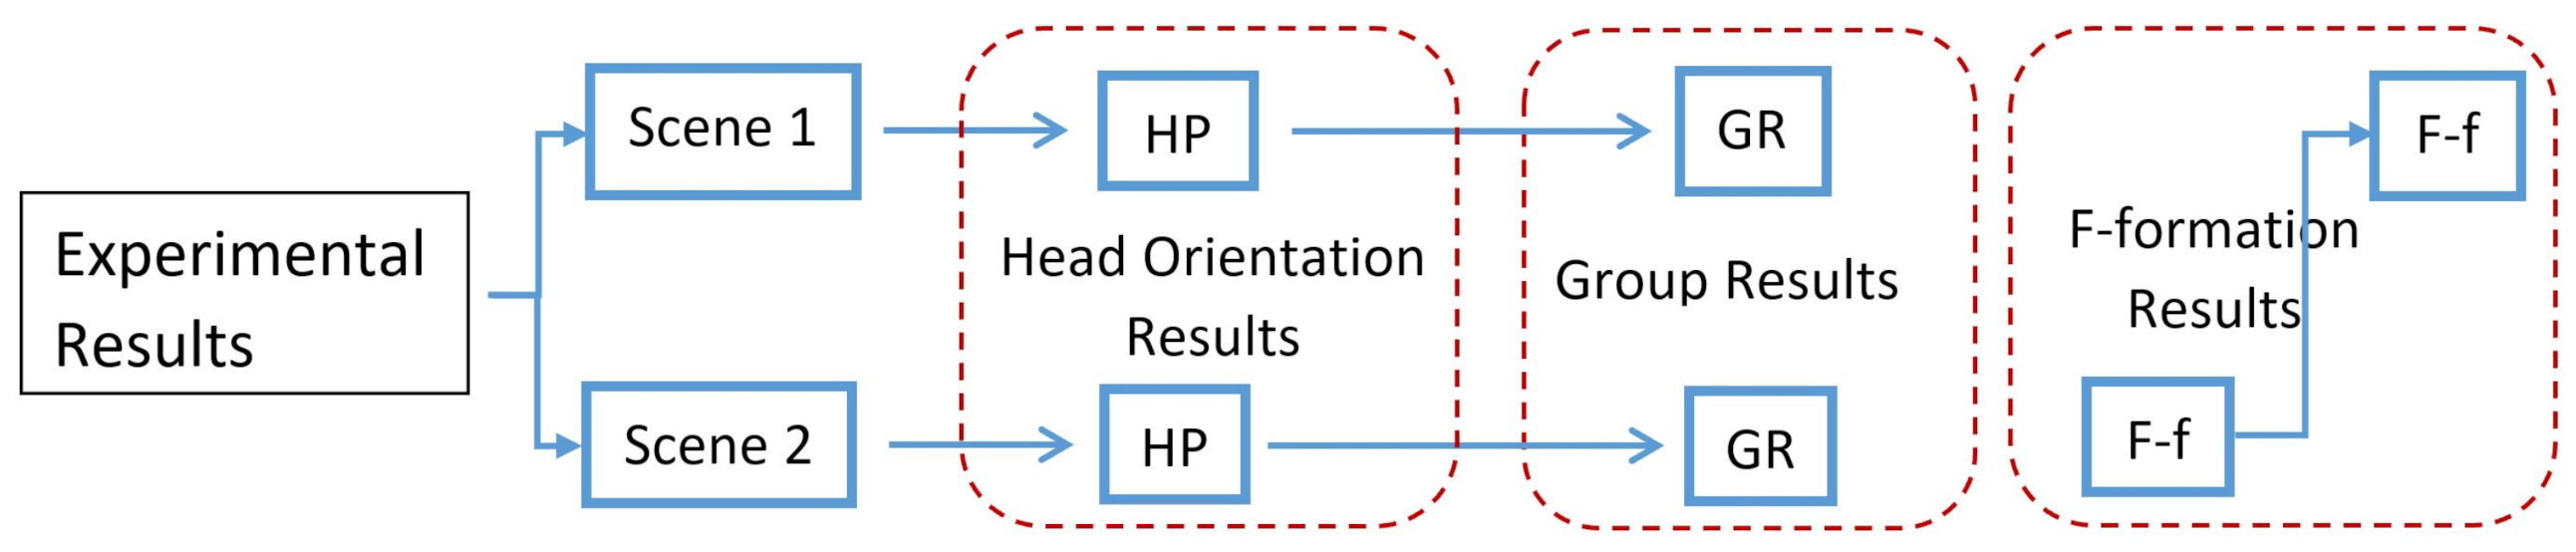

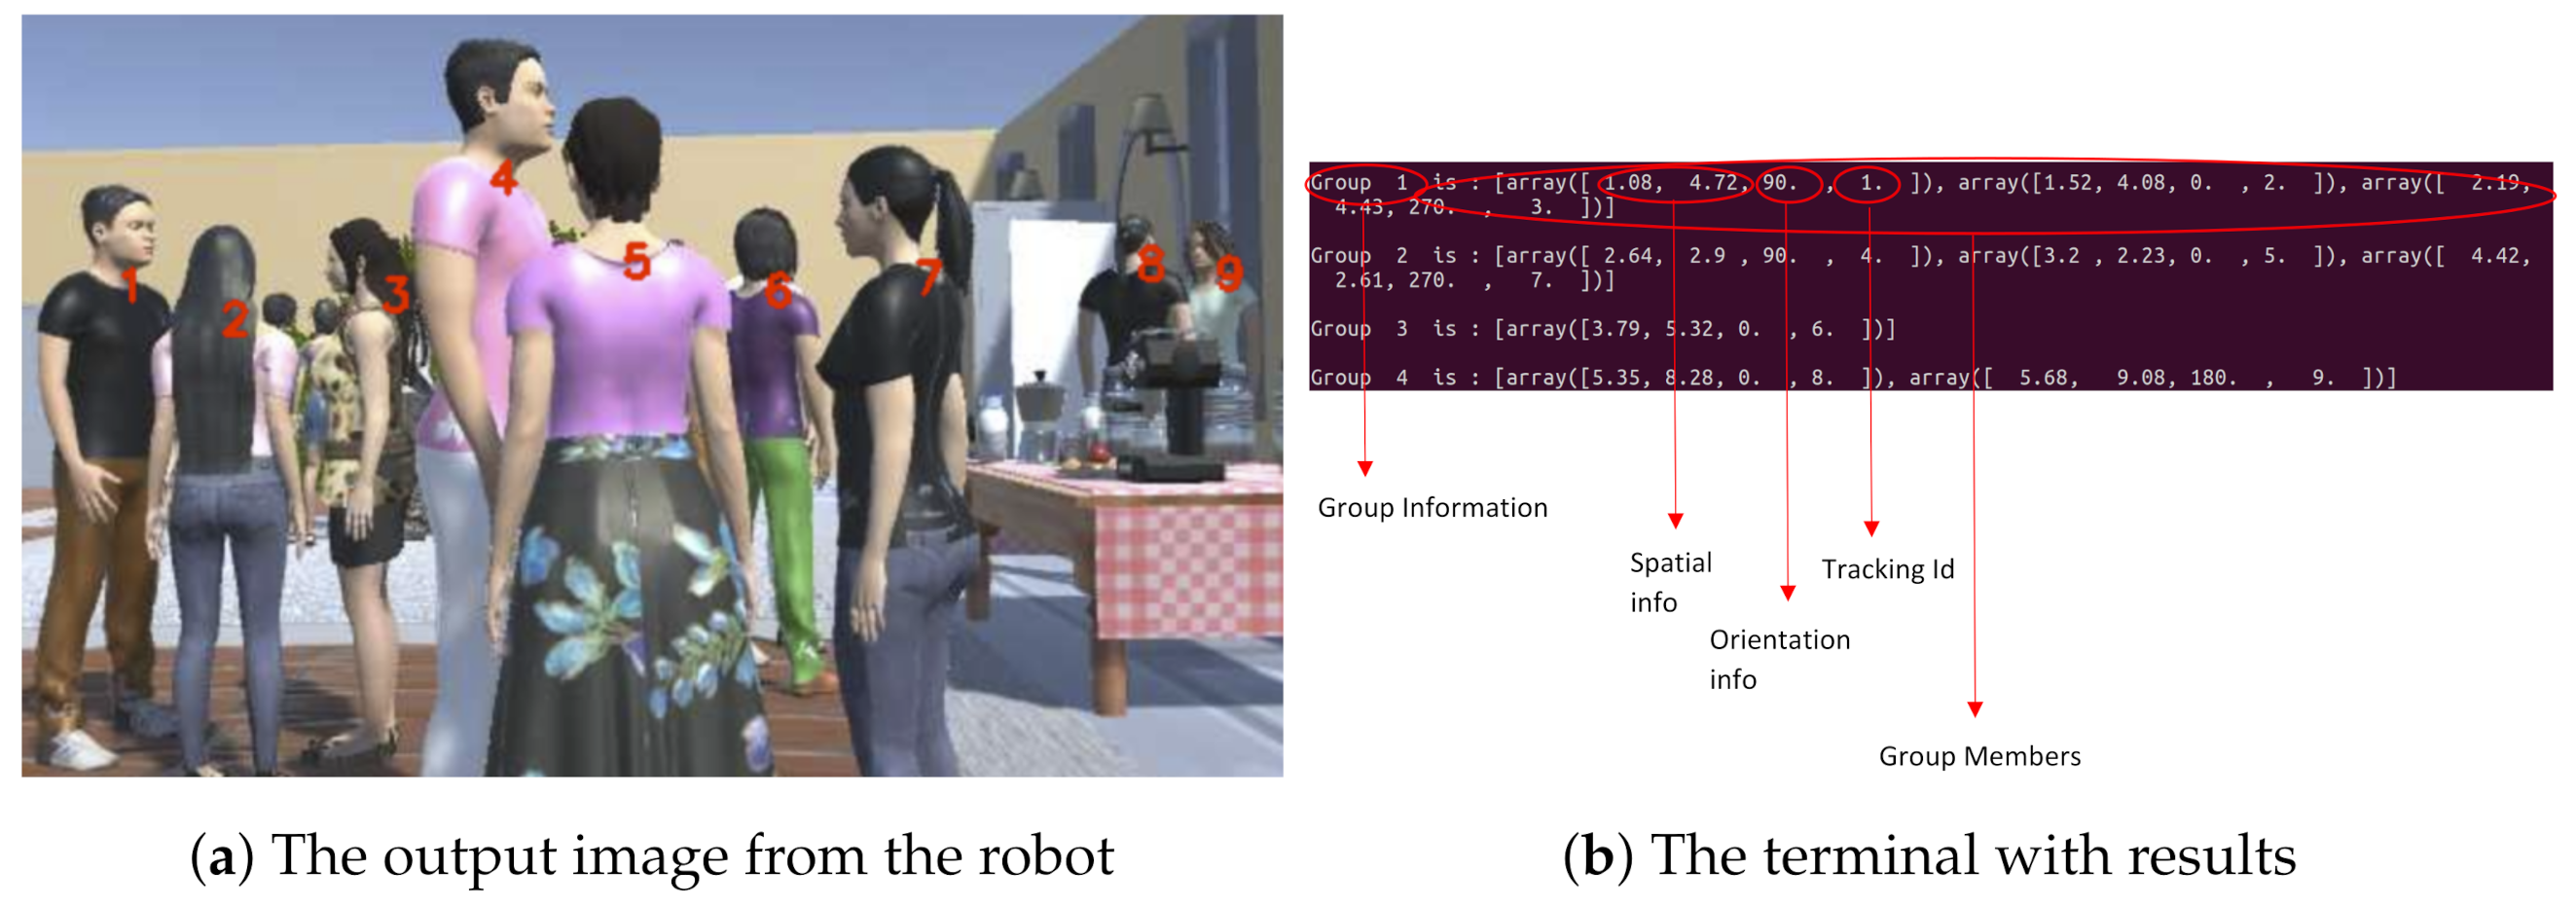

Publisher’s Note: MDPI stays neutral with regard to jurisdictional claims in published maps and institutional affiliations. |
© 2022 by the authors. Licensee MDPI, Basel, Switzerland. This article is an open access article distributed under the terms and conditions of the Creative Commons Attribution (CC BY) license (https://creativecommons.org/licenses/by/4.0/).