1. Introduction
Drivers being drowsy and falling asleep behind the wheel is one of the major contributors to vehicle crashes worldwide. The most effective countermeasure against sleepiness is sleep [
1]. Removing the human driver by automating the driving task is seen as a solution to prevent all human errors caused by distraction or sleepiness [
2]. However, automated driving is far from autonomous operation, and human contribution is still crucial. Drivers are expected to take over when the automation fails or reaches its operational limits. With the development of SAE level 4 automated driving vehicles (ADVs), drivers are expected to be allowed to sleep while the system is operating and even in the lower levels 2 and 3 it is foreseeable that drivers may fall asleep voluntarily or involuntarily. Driver monitoring systems will be required to measure driver state before taking over [
3,
4]. Even state-of-the-art take-over times of 2.2 s [
5] to 10 s [
6,
7] are not sufficient for sleeping drivers [
8]. Hirsch et al. [
8] propose 1–2 min for taking driving position after sleeping.
Generally, sleep and short naps are shown to enhance cognitive and motoric performance in terms of vigilance, alertness, and executive functions [
9]. Therefore, it could be argued that the possibility of sleeping while driving increases traffic safety [
10]. However, the possibility to sleep during the drive is limited until automated driving systems (ADS) can perform all driving tasks under all road conditions without the driver being required to intervene [
11]. Drivers experiencing sleep inertia (SI) may have difficulties taking back vehicle control and driving safely. According to [
12], SI defines a period of transitory hypovigilance, confusion, disorientation of behavior, and impaired cognitive and sensory-motor performance that immediately follows waking up. SI following sleep is a disadvantage and a potential safety threat in SAE level 4 automated driving because the driver might have to take over and operate manually [
13]. Currently, it is not known whether drivers are able to drive safely immediately after waking up. Previous driving simulator studies that have addressed drivers’ take-over performance from automated to manual driving after sleep revealed ambiguous findings. Some studies showed that take-over and driving performance were impaired [
2,
11,
13], while another study showed no impairments after a 20 min afternoon nap [
8].
The presented study investigates whether SI affects drivers’ driving and cognitive performance after different sleep durations.
1.1. Sleep
In automated driving, sleep is a potential driver state. Sleep itself is not a constant state but rather characterized by alternation of different sleep stages. Sleep is a rather complex interaction of physiological and behavioral processes. Up to now, two states have been defined: rapid eye movement (REM) and non-REM. Phases of non-REM sleep alternate cyclically with those of REM sleep occurring on average 4–6 times per night [
14,
15]. Starting with non-REM sleep after the transition from wakefulness to sleep, the first REM phase occurs after about 90 min and lasts approximately 10 min. It then ideally reoccurs every 90–120 min. While REM sleep becomes longer during the night, the phase of non-REM sleep gets shorter [
14].
Further, non-REM sleep can be broken down into three stages: N1, N2, and N3 sleep, whereby sleep stage N3 is also known as slow-wave sleep (SWS) [
14,
16]. These different sleep stages are reflected in brain waves. The first sleep stage (N1) is considered as rather light sleep or the phase of falling asleep. The duration tends to last one to five min, representing around 5% of the total sleep cycle [
15]. N2 follows stage N1. It is marked by light sleep before reaching a deep sleep stage. In general, N2 is considered as the beginning of actual sleep [
14]. If a person is awakened from this sleep stage, they are subsequently aware of their sleep. In stage N2, humans spend the majority (>50%) of their time while being asleep [
14]. The following N3 sleep is considered the deepest sleep stage. Therefore, this state is the most challenging sleep stage to be awakened. At the end of N3 sleep, there may be a return to the previous phase or a transition to the REM stage [
14,
15]. The REM stage derives its name from the notable observable appearance of rapid eye movements [
14].
1.2. Sleep Inertia and Prior Sleep Duration
A nap is defined as a sleep that is distinct from and substantially shorter than a typical sleeping episode. More precisely, “a ‘nap’ may be considered as any sleep period <50% of a person’s average nocturnal sleep length” [
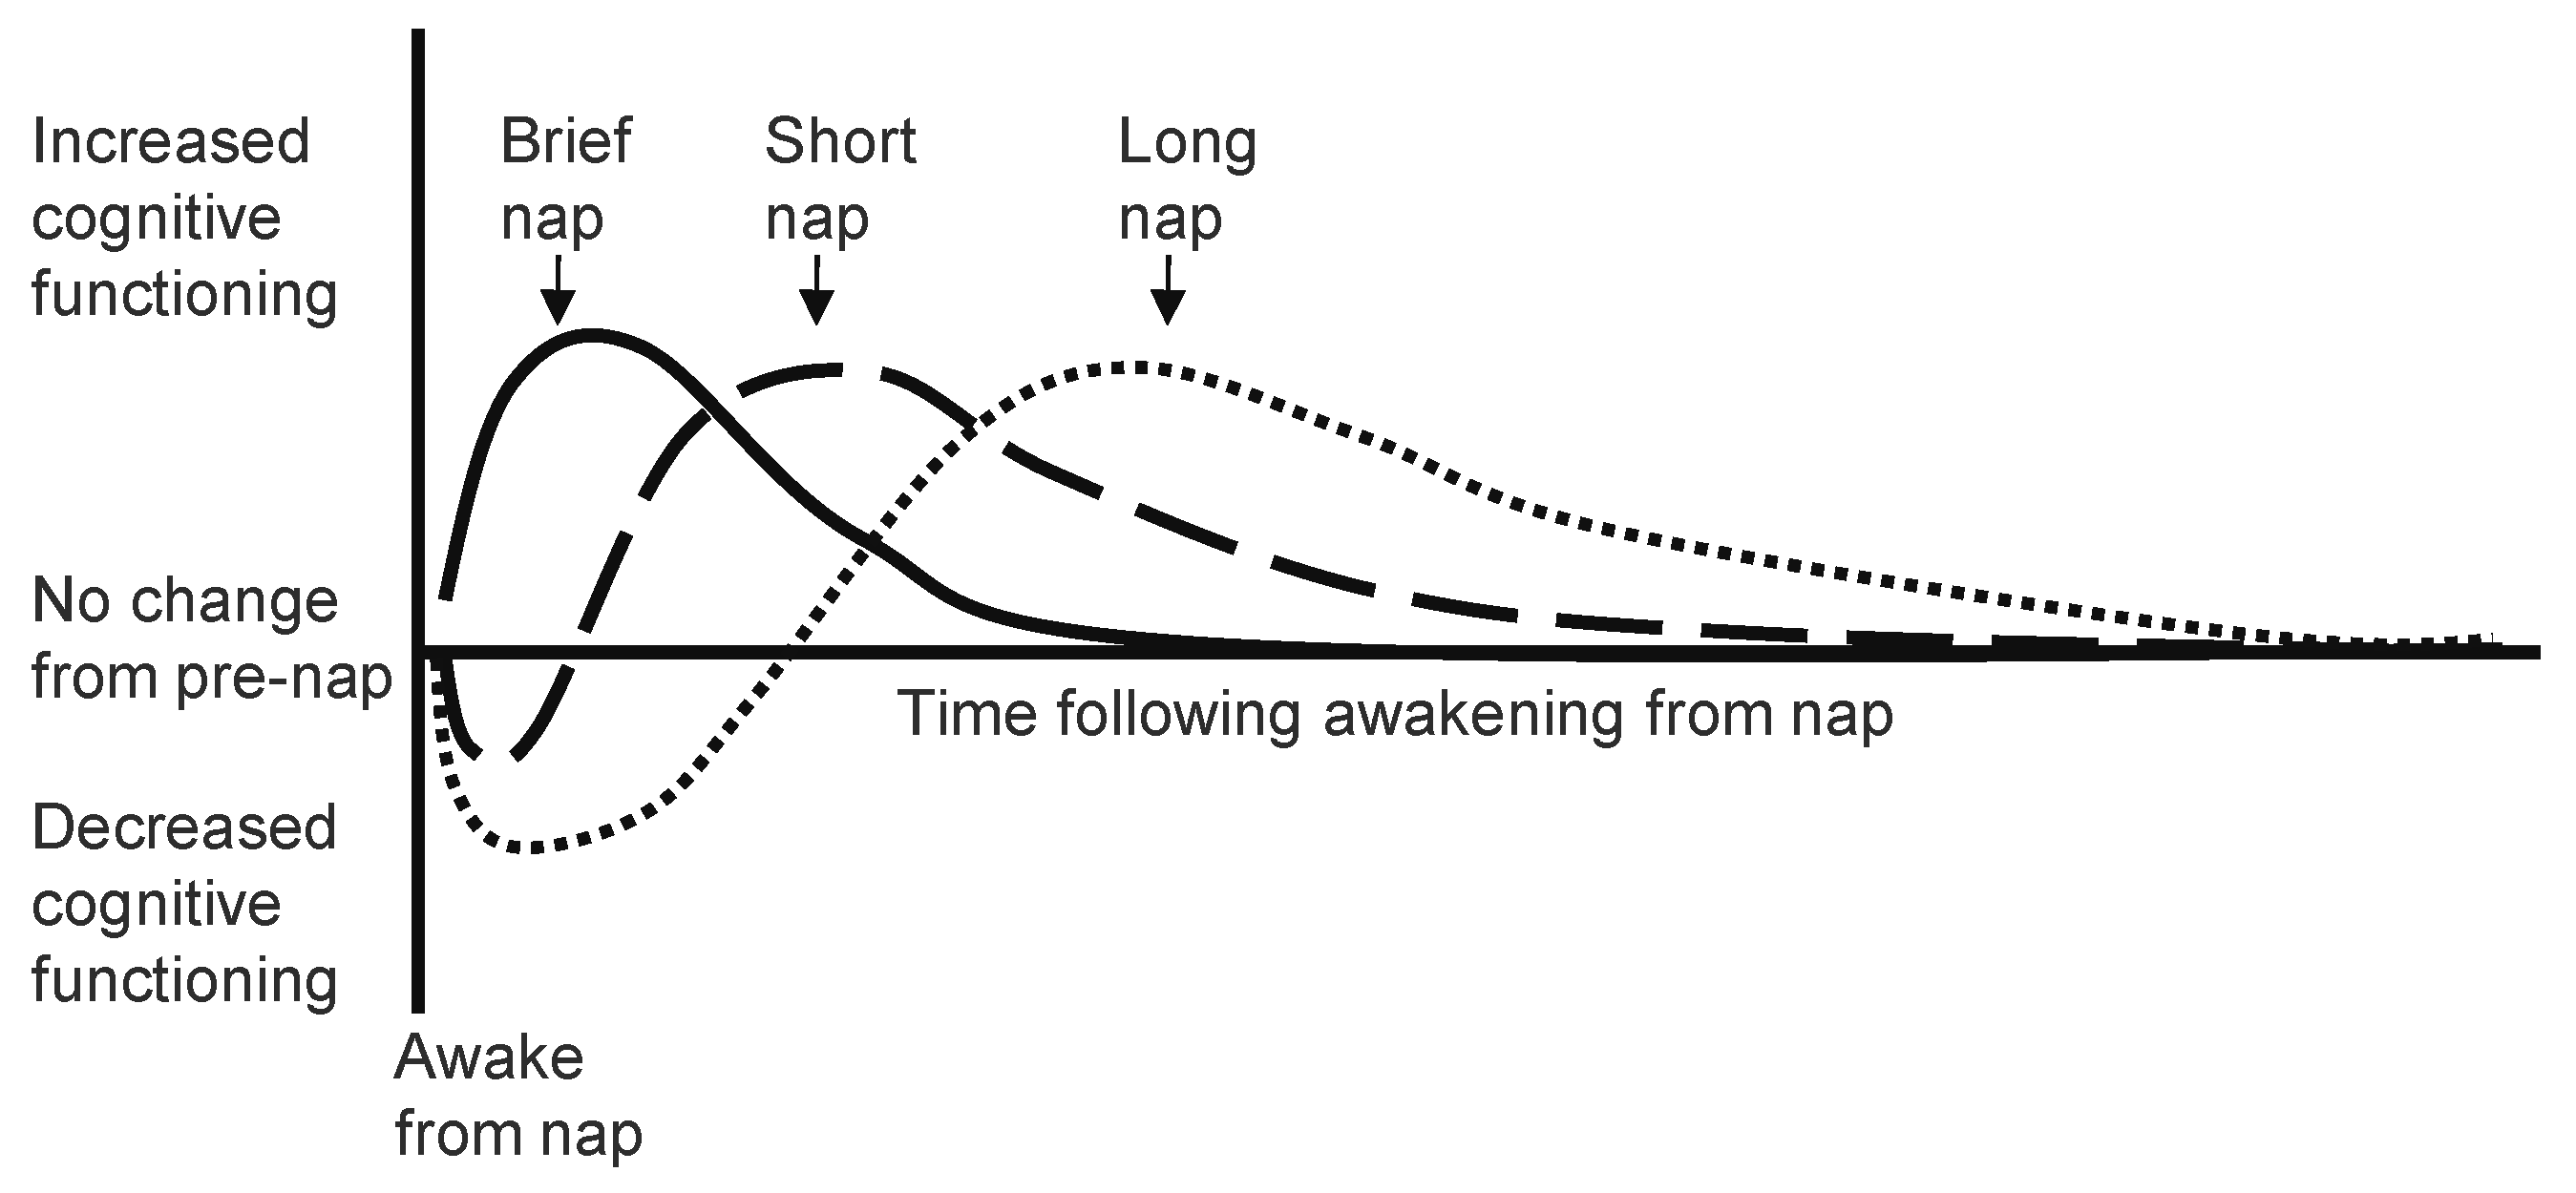
17] (pp. 313–114). Napping is an important countermeasure against sleepiness; however, a potential disadvantage of napping is the possibility of experiencing sleep inertia following the nap. Considering studies on sleep length, the results showed an influence on alertness and cognitive performance. In general, naps of various durations (ranging from 5 min to 2 h) have been shown to benefit cognition. However, the differences between the nap lengths that are most evident arise from the development of these benefits in the post-nap period [
18].
Figure 1 illustrates the relative changes in the adverse and beneficial effects of brief, short, and long naps after waking from sleep.
Sleep inertia has been shown to occur, but its magnitude depends on several factors: previous sleep duration, sleep stage before waking, and previous sleep deprivation. SI also depends on the time of day when waking up [
19,
20].
Studies investigating the effects of daytime naps on SI showed that naps of up to five min do not provide any benefits in performance or alertness (e.g., [
21]). For a 10 min nap, [
21] found performance improvements immediately following the nap. The improvement was evident in all performance measures and subjective scales, which lasted up to 155 min after sleep. This outcome suggests that the benefits of a 10 min nap are immediate and relatively long-lasting, with no sleep inertia. However, a previous study in 2002, [
22], could not replicate the same results. There was no significant improvement in alertness or performance at the first test point five min after waking. The first significant improvements were seen 35 min after waking, suggesting that sleep inertia masked the benefits of a 10 min nap in the first min immediately after waking. Since the papers did not provide any information on sleep architecture, it is unclear whether there were any differences in the two 10 min conditions that could have influenced the results [
23]. Overall, no study of 10 min afternoon naps reports sleep inertia per se, but not all studies can report an immediate improvement in performance and alertness [
23]. However, other studies show that a nap of the same length preceded by sleep deprivation or extended wakefulness does not seem to produce the same homeostatic benefits and show signs of SI [
23].
Studies on 15 min afternoon naps have shown low levels of sleep inertia up to 15 min after waking. Comparable results have been found in studies on 20 min naps. For example, ref. [
21] found that performance improvements were not observed until 35 min after waking. Another study discovered that subjective alertness and performance did not differ between the nap group and the no-nap group within the first 10 min after waking [
24]. Other studies have reported similar results, although the influence of previous sleep deprivation needs to be considered regarding differences in the severity and duration of SI. Studies under sleep pressure have shown that a 20 min nap is not short enough to prevent sleep inertia. Any homeostatic benefit of napping is initially outweighed by sleep inertia. This is different under well-rested conditions. Here, a 20 min nap appears to bring benefits [
23].
In contrast, evidence of sleep inertia was consistently found in all studies of 30 min naps (e.g., [
21,
25]). Therefore, it appears that sleep inertia is immediately evident after a 30 min nap with a significant decline in performance compared to pre-nap and measured performance without a nap. In their review on sleep inertia, Tassi and Muzet [
20] claim that the stages of sleep could explain the effects of sleep duration before waking up. In general, deep sleep or SWS (N3) begins under well-rested conditions in the first sleep cycle of a habitual nocturnal sleep approximately 30 min after sleep onset. Therefore, naps of 30 min or less are intended to prevent SWS under the same conditions [
23].
However, prior sleep-wake history should always be considered when estimating SI effects. For example, sleep inertia is evident if a 10 min nap is preceded by sleep deprivation. The difference in the effects of SI is also evident for naps between 10 min and 20 min. Under well-rested conditions or moderate sleep restriction, this nap duration seems to have the best cost/benefit trade-off. They seem to have a positive effect on immediate performance. While in conditions of more significant sleep loss, 10 to 20 min naps have significant sleep inertia [
23].
1.3. Sleep Inertia in Automated Driving Systems
Studies of automation in aviation [
26] showed that planned naps of 40 min and a recovery period of 20 min seem to be an effective and acute relief from sleepiness during long-distance flights. In response, strategic naps are recommended in operator guidelines for aircraft operators (so called ‘NASA nap’) [
2].
Only a few studies have addressed sleep in automated driving. Previous studies have investigated the effects of naps of less than 30 min of sleep on take-over performance. While the driving simulator study by [
8] was conducted in the afternoon and the participants were awakened after a 15–20 min sleep duration, the participants in the [
2,
10,
13] studies were awakened right after detecting stable sleep. Further, the participants in the Hirsch et al. [
8] study were not sleep-deprived while the participants in the [
2,
10,
13] studies were asked to only sleep 4h the night before the drive. The study in [
8] could not find any differences in the driving performance compared to a group that did not sleep. Wörle et al. [
2,
10,
13], on the other hand, found differences in all three studies in the morning drive compared to the performance when the participants were alert. The results were mixed, which could be due to the different experimental designs. Nevertheless, because of these mixed results, it has not yet been fully proven whether the drivers can take over the vehicle control safely and are capable of driving safely after sleep.
Sleep deprivation and extended wakefulness influence the magnitude and severity of sleep inertia effects. However, as research has shown, naps between 10–20 min seem to have the best cost/benefit trade-off under well-rested conditions [
23]. Like the study in [
6], our study shall clarify how a short sleep duration of well-rested participants affects driving performance and cognitive performance. For longer sleep durations of 30 min or more, recent literature has shown immediate performance declines [
23]. Resting or sleep durations of less than five min, on the other hand, showed no effects on performance [
21]. Accordingly, after the longer sleep duration (30–60 min), greater SI effects are expected on driving performance and cognitive performance compared to the short sleep duration (10–20 min) and when resting, but not sleeping for 20 min.
Further on in this paper, the terms L4 time no-sleep, L4 time 20 min sleep, and L4 time 60 min sleep are used. They correspond to L4 time slots for rest and sleep that a SAE level 4 equipped vehicle may offer.
2. Materials and Methods
2.1. Participants
The participants in this study were not sleep-deprived to test conditions as close to everyday routine as possible. The probability of sleep inertia occurring is lower under non-deprived conditions. Furthermore, the probability of the participants of falling asleep during the experiment is reduced [
19]. Thus, some screening criteria were set to increase the probability of testing participants who were highly likely to fall asleep. A screening questionnaire was sent to the participants in order to ensure that they meet the following criteria:
Driver’s license class B;
No shift work;
No visits abroad with a time difference within the past three months;
No medication that helps or disturbs sleep;
No sleep sickness, sleep disturbance, or difficulty in falling asleep;
Average sleeping times between six and eight hours;
Frequency of afternoon naps at least once a week;
Sleep Inertia Questionnaire (SIQ) mean score of at least M = 2.5.
Out of 19 invited participants, five did not complete all sleep conditions, either by not falling asleep or not sleeping enough. They were excluded from the analysis. One dropped out due to simulator sickness. Thirteen participants completed the study (10 male, 3 female). On average, participants were 25.385 years old (SDage = 6.639 years, range = 19–46 years) and slept around 7.31 h (SD = 0.418 h) on a typical night. They reported lying down at least once a week for naps, while three participants reported napping up to 3–5 times a week (M = 2.692, SD = 0.821, rated on a 5-point Likert scale 1 = never or less than once per month to 5 = every day or almost every day). The average length of the reported naps was 43.077 min (SD = 11.691 min). Furthermore, they stated that they had no to little difficulty falling asleep. Furthermore, the participants were asked prior to the test to rate their subjective sleep inertia. The mean score of the sleep inertia questionnaire was 3.266 (SD = 0.565, rated on a 5-point Likert scale 1 = never to 5 = every time), which means sleep inertia was "somewhat" evident after waking up.
2.2. Experimental Procedure and Test Drive
Since SAE level 4 is not available in series production cars, the study was conducted in the high-fidelity driving simulator at the Fraunhofer Institute for Industrial Engineering (IAO) in Stuttgart during daytime. The driving simulator consisted of a full-vehicle Porsche Macan mock-up with a realistic driver’s cockpit and interior. With this set-up, the participants should get a driving experience as similar as possible to actual driving (see
Figure 2).
The driving situation was displayed using the SILAB 6.0 simulator software from the Würzburger Institute for Traffic Science (WIVW GmbH). Following a familiarization drive, one of the three sleep conditions (L4 time no-sleep, L4 time 20 min sleep, and L4 time 60 min sleep) were conducted on a two-lane highway. Depending on the defined sleep durations, a test drive lasted between 60 min and 90 min. The environmental conditions are designed to be monotonous: evening hours, low traffic volume, and mostly straight road segments. The driven route consisted of five segments, with some of them repeated on the drive (see
Figure 3).
Before the test drive started, the participants were told to conduct a 2 min mathematical addition test (2-digit numbers based on [
27]) and rate their subjective sleepiness on the Karolinska Sleepiness Scale (KSS).
The drive then started at a rest area and the participants were asked to drive manually on a two-lane highway with low traffic volume (segment 3a (S3a) in
Figure 3). With a speed limit of 130 km/h, segment 3a took about 10 min. Additional traffic was only driving on the left side of the road. A construction site followed the highway. The two lanes narrowed to one lane, and a truck pulled in front of the vehicle (S4a). In this segment, the participants were asked to activate the cruise control to maintain a constant distance (10 m) to the truck. The truck maintained a speed of approximately 40 km/h within the construction site and braked five times at irregular intervals, with braking points at 250 m, 300 m, 400 m, and 500 m after the start of the construction site. When exiting the construction site, the cruise control was deactivated, and a traffic jam became visible (S5). When approaching the traffic jam, the availability of the SAE level 4 ADS and the system limit was communicated via audio (speed limit of 60 km/h). In addition, a 60 min delay due to the traffic jam was indicated, and a recommendation to use the time for a power nap was made. This segment lasted 20 min for the L4 time no-sleep, and also 20 min for the L4 time 20 min sleep condition and 60 min for the L4 time 60 min sleep. To monitor if the participants fell asleep, the Hypnodyne Zmax [
28] device was used. The Zmax records physiological data such as electrical activity in the brain (EEG), photoplethysmography (PPG), breathing, head movements (XYZ), and environmental sounds. The device includes a sensor, a headband, and dry electrodes. Unlike conventional EEG measurements, where the electrodes are placed over the entire skull, the utilized electrodes are attached to the forehead. The Zmax records physiological data with a sample rate of 256 per second and a bandwidth of 0.1–128 Hz. During recording, the data are displayed in real-time on a user interface provided by the supplier Hypnodynecorp. Using the displayed physiological data, it was feasible to identify the onset of N1 and N2 sleep to determine sleep after AASM [
16]. Participants were defined as being asleep at the onset of N2.
After the defined L4 time an alarm clock sounded, and the participants were again asked to conduct the addition test and rate their subjective sleepiness (KSS). During the test time of the addition test the traffic jam remained unchanged at 50 km/h for approximately three min. After these three min, the surrounding vehicles accelerated and overtook at approximately 70 km/h. At the same time, the automated system accelerated the participants’ vehicle up to 60 km/h. When system limits were met (speed limit above 60 km/h), the system issued an audio-visual request to intervene. The whole traffic jam dissolved within a time window of 1.5 min. After all vehicles had exited the traffic jam, or were out of sight, segment S5 ended. Low traffic on the two-lane highway followed for 10 min, as a repetition of segment S3b. This was followed by a repetition of the construction site (S2b). The drive ended in parking position in a rest area where the participants again were asked to conduct the addition test and to rate their subjective sleepiness (KSS).
The experimental design was a complete within-subject design. Thus, each participant participated at least three times on different days. The design was chosen on the assumption that driving performance, sleep, and the experience of sleep inertia remain relatively stable within a single person but differ between different subjects. Potential carry-over effects caused by the within-design were reduced by a thorough training of relevant performance indicators i.e., the calculation test, the activation of SAE L4, and the takeover during a familiarization drive of 10 min (see
Section 2.3 for details). Possible problematic effects of within-subject designs include carry-over effects which needed to be looked out in this study. Due to the high drop-out rate risk, randomization was omitted, and the participants were classified into sleep conditions during the drive sessions. Therefore, they were always told to close their eyes during the traffic jam and to take a nap. If both sleep conditions were already completed, the participants were asked to close their eyes and simply relax.
Three sleep conditions were defined as factor levels for the independent variable sleep duration. On the one hand, sleep duration was defined by the L4 time, the time that the participants slept or relaxed during segment 5 (traffic jam, see
Figure 3). On the other hand, it was defined by the sleep efficiency. The sleep efficiency was calculated as the share of the actual time slept from the provided sleep time (L4 time). The sleep conditions were considered as successful if a sleep efficiency of at least 50% is achieved. This is based on the literature findings of a positive impact of 10–20 min sleep durations, as well as the evidence of SI for naps of 30 min sleep and more [
21,
23].
2.3. Assessment of Driving Behavior
Performance parameters were compared for each sleep condition after L4 time to investigate the impact of sleep duration on the strength of sleep inertia and on the driving performance. In segment 3b, the driving parameters speed (m(v), sd(v)), the standard deviation of lateral lane position (SDLP), and the frequency of steering wheel direction reversal (SWDR) were calculated for the 22 km of manual driving. Brake reaction time was assessed in segment 4b. The two segments were practiced in the familiarization drive. Segment 4b was driven at full length while segment 3b was kept shorter. Additionally, the activation and deactivation of the SAE level 4 ADS was practiced by reducing the speed limit to 50 km/h and after approx. one min increasing the speed limit to 130 km/h again until the construction zone.
To assess the effect of sleep inertia on cognitive performance, the number of sums attempted within two min as a measure of speed and the percentage of correct answers as a measure of accuracy were computed after the alarm clock sounded at the end of segment 5. Further, to be able to make statements about the duration of SI effects on cognitive performance, the parameters were also calculated and compared before the drive, at the end of the L4 time, and after the drive. The calculation test was practiced once with the participants after they completed the familiarization drive.
KSS ratings after each sleep duration were compared to evaluate if there were changes in the perceived sleepiness as a function of sleep duration.
3. Results
The statistical tests were selected depending on whether variables are normally or not normally distributed. The impact of SI on measures of driving behavior, cognitive performance, and the KSS ratings was assessed by calculating one-way repeated measures ANOVAs when variables were normally distributed. When variables were not normally distributed, the non-parametric Friedman test was calculated. For the duration of SI effects on cognitive performance, a two-way rmANOVA was calculated. All tests used a significance level of α = 0.05.
Five out of 13 test persons in the L4 60 min sleep condition woke up 4, 7, 16, 22, and 25 min before the alarm. Since SI diminishes over time, our analysis possibly underestimates the intensity and effects of sleep inertia in our test sample. We did an explorative analysis with n = 8 participants that slept until the end, but the results showed no relevant differences, potentially because of the very small number of participants. Therefore, we further analysed the n = 13 participants.
3.1. Driving Performance
3.1.1. Take-Over Time
Take-over was offered in our study without time pressure. Take-over times ranged from 3.15 min to 4.09 min after the alarm bell, with a mean value in both conditions of 3.56 min (SD = 0.27 min).
3.1.2. Speed Choice and Speed Keeping
The mean speeds were almost identical and close to the specified maximum speed of 130 km/h (F(2,24) = 0.764, p = 0.477, η2 = 0.008). Averaged over the 10 min highway section after the L4 time 20 min sleep condition, the mean speed was 130.082 km/h (SD = 3.191 km/h), while after the 60 min sleep condition and wakefulness, it was 129.385 km/h (SD = 3.327 km/h) and 129.425 km/h (SD = 4.248 km/h), respectively.
The participants’ speed-keeping ability was relatively similar between the conditions. Speed deviation was highest after L4 time 60 min sleep (
M = 2.899 km/h,
SD = 1.246 km/h). Participants varied less after L4 time 20 min sleep (
M = 2.564 km/h,
SD = 1.23 km/h) than after L4 time no-sleep (
M = 2.758 km/h,
SD = 2.116 km/h). For the standard deviation of speed, the Friedman test revealed no significant effects of sleep duration (
X2F (2) = 0.154,
p = 0.926,
W = 0.006). The boxplots in
Figure 4 visualize the mean differences in speed choice and speed keeping split by the conditions, the median, and the individual data points of each participant with outliers.
3.1.3. Standard Deviation of Lane Position and Steering Wheel Direction Reversal
After the L4 time 60 min sleep (
M = 0.255 m,
SD = 0.079 m), the deviation from the lateral lane position was slightly greater than after the L4 time 20 min sleep (
M = 0.249 m,
SD = 0.077 m) and the L4 time no-sleep (
M = 0.247,
SD = 0.086 m, see
Figure 5). In all sleep conditions, the interindividual variance was small. The SDLP was not significantly affected by different sleep durations (
F(2,24) = 0.25,
p = 0.781,
η2 = 0.002).
The mean SWDR was around five reversals over zero per kilometer, averaged over the 10 min highway (see
Figure 5). The average number of zero-crossings over one kilometer in the 60 min condition was 5.119 reversals (
SD = 2.26). In the 20 min and no-sleep condition there were 5.098 (
SD = 1.436) and 5.434 (
SD = 2.398) reversals over zero, respectively. Most steering inputs were given after the L4 time no-sleep.
However, the differences in steering input were minor, and a Friedman test revealed no significant influence of sleep duration on the number of zero-crossings per kilometer (X2F (2) = 2.46, p = 0.292, W = 0.095).
3.1.4. Reaction Time
For the brake reaction time, the rmANOVA revealed an effect of sleep duration (
F(2,24) = 6.646,
p = 0.005,
η2 = 0.074). Post-hoc tests showed a significant effect of 66 ms slower brake reaction after the 20 min sleep duration compared to the long duration of up to 60 min (
t(12) = 4.14,
p = 0.004). The brake reaction time in the 20 min sleep (
t(12) = 1.65,
p = 0.375) and 60 min sleep condition (
t(12) = −1.91,
p = 0.241) did not differ significantly from the no-sleep drive (
Figure 6).
3.2. Cognitive Performance
The number of attempted sums in the addition test showed that 22 sums were completed in the conditions L4 time no-sleep (
M = 22.538,
SD = 2.876) and in L4 time 60 min sleep (
M = 22.007,
SD = 4.329) (
Figure 7). 21 sums were completed in the L4 time 20 min sleep drive (
M = 20.923,
SD = 4.132). Respectively, for the comparison between conditions directly after L4, the rmANOVA revealed no significant differences (
F(2,24) = 1.33,
p = 0.281,
η2 = 0.033).
To investigate the development of sleep inertia over time, the performance before the test drive, after waking from L4 time, and at the end of the drive was compared. The number of sums participants attempted was reduced immediately after L4 time in both sleep durations. Thus, at the end of the drives the performance was similar to the beginning. The interaction between the scoring time and the sleep duration approached significance (
F(4,48) = 3.332,
p = 0.017,
η2 = 0.021). First, Bonferroni’s post-hoc tests were calculated based on the hypotheses that had been formulated. They revealed no significant differences. On an explorative basis, without Bonferroni adjustment, the post-hoc tests revealed an impaired performance for the L4 time 20 min sleep immediately after waking compared to the end (
t(12) = −3.655,
p = 0.003) and the beginning of the drive (
t(12) = −2.465,
p = 0.03). The performance did not differ between the test points in the L4 time no-sleep condition and the L4 time 60 min sleep condition (see
Figure 7).
On average, the percentage of correct answers for all sleep conditions was around 92%. A total of nine participants made no errors (
Figure 7). There was no statistically significant difference for the analysis of the percentage of correct answers (sleep duration:
X2F(2) = 0.615,
p = 0.735,
W = 0.024; time:
X2F(2) = 0.4308,
p = 0.116,
W = 0.166; sleep duration x time:
X2F(8) = 5.956,
p = 0.652,
W = 0.057).
3.3. Subjective Sleepiness and Perceived SI
The participants´ ratings of their subjective sleepiness reflect the results from the objective performance parameters. They rated their subjective sleepiness on the KSS, whereby the higher the rating, the sleepier they felt.
On average, participants rated their sleepiness level after the short (
M = 7.154,
SD = 1.142) and long sleep duration (
M = 6.692,
SD = 1.377) as rather sleepy compared to the no sleep condition (
M = 5.231,
SD = 1.377), see
Table 1. There was a main effect of sleep duration on the subjective sleepiness
F(1.398,16.776) = 8.47,
p = 0.006). Post hoc analyses using the Bonferroni adjusted alpha levels indicated that the participants felt sleepier after the L4 time 20 min than after the L4 time no-sleep (
t(12) = 4.06,
p = 0.002). By trend, participants rated their sleepiness higher when waking up from the 30–60 min sleep compared to the L4 time no-sleep (
t(12) = 2.37,
p = 0.053). The rating after waking from L4 time 20 min sleep and L4 time 60 min sleep did not differ significantly (
t(12) = 1.39,
p = 0.285).
Furthermore, after each drive, the perceived sleep inertia was assessed immediately after waking up as well as the drivers’ perceived readiness to take over the vehicle (scale from 1 = fully ready to 5 = not ready).
At the end of the L4 no-sleep condition, the participants reported no perception of SI, or at most a slight perception. Within the L4 time 20 min sleep condition the majority of participants experienced a relatively mild influence of SI, which was perceived within an estimated period of up to five min after waking up. For the L4 time 60 min sleep condition the responses to perceived SI were mixed. Some experienced no SI while others reported feelings of SI. Statements regarding the readiness to take over showed similar results. For the manual take over, participants felt on average “fully ready” or “rather ready” after the no-sleep condition (M = 1.76, SD = 0.973). The response in the L4 time 20 min sleep condition was somewhat lower that after the L4 time no-sleep with a tendency from “rather ready” to “neither ready nor not ready” (M = 2.308, SD = 1.264). After the L4 time 60 min sleep condition, the results showed a similar readiness to take over manually (M = 2.23, SD = 1.367).
4. Discussion
This study investigated SI effects as a function of sleep duration on driving and cognitive performance. Therefore, three sleep conditions were implemented to assess manual driving behavior and cognitive performance after sleeping 10–20 min, 30–60 min, or resting without sleep for 20 min. It was hypothesized that driving performance and cognitive performance would be more impaired in the long sleep condition (30–60 min) than in the short sleep condition (10–20 min) and the no-sleep condition.
The hypothesis can be rejected, however, under important limitations. The number of valid participants was low, even for a within-subjects design. Thirteen out of 19 participants finished the test. Furthermore, sleep inertia is not a stable phenomenon and depends on multiple individual and situational factors, hence even in a within-subjects design, the variance is probably high and only very large effects will become significant with 13 participants in a within-subjects design. This may be acceptable, as we assume that small and medium effects may not play an important role in practice. Outliers of heavily impaired driving performance however would play an important role. We did not find them in the small sample.
An additional limitation was that, in the 60 min condition, five out of 13 participants woke up before the alarm bell. Furthermore, some participants did not sleep continuously. In some cases, participants woke up two to seven times. For participants who woke up, their possible sleep inertia was likely to be already diminishing when the performance tasks were performed. This assumption could be supported by [
29] suggestion that at moderate levels of sleepiness, drivers are able to regulate their arousal. Similar to sleepiness, SI is characterized by a low arousal level [
13]. The participants’ statements at the end of the drives support this. They reported that the feeling of SI and/or sleepiness disappeared after the addition test or in general within a few min. However, an analysis of the remaining eight participants who slept until the alarm bell in the 60 min condition, did not reveal any significant differences from the 13 participants sample size.
What we can learn from the results is that performance quality was not affected heavily. Besides no significant differences, the mean values and variances do not differ much in mean speed (M(v)), speed variance (sd(v)), lane keeping (SLDP), steering (SWDR), and likewise the correct answers in the calculation test did not vary. Hirsch et al. [
8] found similar results for not sleep-deprived napping drivers. Wörle et al. [
2,
13] however found significant differences in driving parameters for sleep-deprived participants that were woken up after reaching N2 sleep. Studies on cognitive performance accuracy that did not involve sleep deprivation also found similar results (e.g., [
30,
31]). Likewise, ref. [
20] concluded in their review that for participants who are not sleep-deprived, sleep inertia affects speed more than accuracy.
Cognitive speed was more likely to be affected even for the not sleep-deprived napping drivers of our study. In the 20 min condition, the 13 participants calculated fewer sums after sleep than before sleep and at the end of the drive (only significant without Bonferroni adjustments). In the 60 min condition we see similar results on descriptive base, considering that 5 out of 13 participants woke up before the alarm bell. With no sleep, we do not see a performance drop. Furthermore, the brake reaction time shows slower reactions after 20 min (on a descriptive base compared to no sleep and significantly compared to 60 min). Based on these results, we may conclude that there is likely to be a large effect of impaired reaction time under the influence of sleep inertia directly after waking up and little or no effect on driving quality in normal driving conditions.
A higher number of test participants would make the results more reliable. Sleep studies require high efforts especially in testing time and in drop-outs of participants who do not fall asleep. We tried to compensate this with a selective sample of participants who passed a screening and reported regular naps and a disposition for SI. Hence, we probably overestimate the accuracy of SI in the total population. Although the study’s findings provide new insights for the question of whether drivers should be allowed to sleep in SAE level 4 ADV, they also show inconsistencies with other studies (e.g., [
8,
13]). When comparing the studies, one difference is in the SI induction and the moment the participants were awakened. While the SI after waking up in this study under well-rested preconditions seems to affect the performance less severely, other studies indicate that SI affects drivers’ driving performance more severely with a suboptimal precondition: sleep deprivation. Therefore, further studies should investigate the development of SI and the relationship between different intensities of sleep inertia and driving performance. Furthermore, edge cases (e.g., naps after a sleepless night) should be explored to address measures to counteract severe sleep inertia and possible arrangements in a real-world context. Applied research, in the meanwhile, may focus on countermeasures to reduce the effects of SI on driving.
An emerging question from this study, which should be considered in further research, is how the effects of SI relate to different and more challenging road conditions. In this study, drivers took over manually after a traffic jam on an empty and straight road. However, studies suggest that subjects may still perform simple, highly trained tasks during the transition period between sleep and wake (known as SI). Therefore, performance in a more complex and more demanding task may react differently to sleep inertia. More crowded highways or complex interactions with other road users should be investigated. Testing protocols could be adapted from drowsy driving studies or drunk driving studies. Furthermore, the transition itself could be designed to support incapacitated drivers e.g., by cooperative control or safe parking. So far, only driving simulator studies have been conducted. In the future Wizard-of-Oz vehicles will allow testing of sleepiness and sleep conditions in real cars and in real traffic [
32].
5. Conclusions
With the development of SAE level 4 automated driving vehicles, drivers are expected to be allowed to sleep while the system is operating. However, the possibility to sleep during the drive is limited as long as the driver is required to intervene. A take-over time of several min needs to be assured after sleep. Without considering SI effects, a take-over time of 3–4 min would allow for a comfortable seat adjustment and take-over. Considering SI effects, a take-over time of 10–15 min might be appropriate. Due to SI, post-sleep performance impairments are a disadvantage and potential safety issue.
The study confirms that sleep inertia occurs after sleeping in automated vehicles. Very short naps of less than 20 min do not prevent sleep inertia even if the subjects are not sleep-deprived. Individuals who are planning to take a nap before driving should take this outcome into consideration. However, the impairments caused by sleep inertia in the study were low and short lasting. Nevertheless, the study provides valuable insights into the effects of sleep inertia on driving and cognitive performance, which can inform further research in real-world driving studies. Future studies should also investigate the severity of impairments and driving safely, as well as possible countermeasures to speed up the decrease of sleep inertia and prevent falling asleep during the time that should be reserved for recovering from SI. Waking up several min before a takeover apparently wipes out SI effects.


 ,
, 


