Article

EEG, Pupil Dilations, and Other Physiological Measures of Working Memory Load in the Sternberg Task

by
Mohammad Ahmadi
1,*,
Samantha W. Michalka
2,
Marzieh Ahmadi Najafabadi
3,
Burkhard C. Wünsche
1 and
Mark Billinghurst
4
1
Department of Computer Science, University of Auckland, Auckland 1010, New Zealand
2
Department of Computational Neuroscience and Engineering, Olin College of Engineering, Needham, MA 02492, USA
3
Department of Science, Ontario Institute of Technology, Oshawa, ON L1G0C5, Canada
4
Auckland Bioengineering Institute, University of Auckland, Auckland 1010, New Zealand
*
Author to whom correspondence should be addressed.
Multimodal Technol. Interact. 2024, 8(4), 34; https://doi.org/10.3390/mti8040034
Submission received: 1 March 2024 / Revised: 3 April 2024 / Accepted: 13 April 2024 / Published: 19 April 2024

Abstract

:
Recent evidence shows that physiological cues, such as pupil dilation (PD), heart rate (HR), skin conductivity (SC), and electroencephalography (EEG), can indicate cognitive load (CL) in users while performing tasks. This paper aims to investigate physiological (multimodal) measurement of CL in a Sternberg memory task as the difficulty level increases in both maintenance and probe phases. For this purpose, we designed a Sternberg memory test with four levels of difficulty determined by the number of letters in the words that need to be remembered. Our behavioral performance results show that the CL of the task is related to the number of letters in non-semantic words, which confirms that this task serves as an appropriate metric of CL (the task difficulty increases as the number of letters in words increases). We were interested in investigating the suitability of multimodal physiological measures as correlates of four CL levels for both the maintenance and probe phases in the Sternberg memory task. Our motivation was to: (1) design and create four levels of task difficulty with a gradual increase in CL rather than just high and low CL, (2) use the Sternberg test as our test bed, (3) explore both the maintenance and probe phases for measurement of CL, and (4) explore the correlation of physiological cues (PD, HR, SC, EEG) with CL in both phases. Testing with the system, we found that for both the maintenance and probe phases, there was a significant positive linear relationship between average baseline corrected PD and CL. We also observed that the average baseline corrected SC showed significant increases as the number of letters in the words increased for both the maintenance and probe phases. However, the HR analysis did not show any correlation with an increase in CL in either of the maintenance or probe phases. An additional analysis was conducted to investigate the correlation of these physiological signals for high (seven-letter words) versus low (four-letter words) CL loads. Our EEG analysis for the maintenance phase found significant positive linear relationships between the power spectral density (PSD) and CL for the upper alpha bands in the centrotemporal, frontal, and occipitoparietal regions of the brain and significant positive linear relationships between the PSD and CL for the lower alpha band in the frontal and occipitoparietal regions. However, our EEG analysis of the probe phase did not show any linear relationship between the PSD and CL in any region. These results suggest that PD, SC, and EEG could be used as suitable metrics for the measurement of cognitive load in Sternberg memory tasks. We discuss this, limitations of the study, and directions for future work.

1. Introduction

Cognitive load (CL) is a useful measure for detecting if people are struggling or having difficulty performing a task. Measuring CL is important for learning applications (i.e., being able to dynamically adapt task difficulty based on users’ performance) or in applications that require users to have an awareness of their own or others’ cognitive level, such as training. Previous studies have introduced a variety of subjective (questionnaires) and objective methods (physiological signals) for measuring CL. CL can also be measured using several different physiological cues such as EEG, PD, SC, and HR [1,2,3,4].
The measurement of CL can benefit human–computer interaction (HCI). For example, in a brain–computer interface (BCI), physiological measures could be combined to create individual cognitive models during user interaction with the system [5]. Similarly, for educational and training systems, multiple studies [6,7] have investigated the benefits of combining subjective (questionnaires) and objective measures of the learning process to better understand the cognitive state of the learner.
The advantage of using these physiological measures or wearable sensors for EEG, GSR, eye tracking, and HR detection are not just limited to CL measurement but also used for emotional measurement [7,8,9] and much more. Some of the advantages and disadvantages of measuring CL using these objective or subjective measures are briefly discussed in Section 2. Recent developments of machine learning (ML) algorithms enable applications (or tasks and scenarios) such as VR training applications or non-VR educational applications to use these inputs to adapt to users’ cognitive load by adjusting task difficulty, guidance, and feedback.
HCI systems are known to take advantage of multimodal approaches and thus, the next generation of HCI will be mostly multimodal [10,11]. Multimodal HCI could provide the possibility of measuring the cognitive state through using multiple physiological sensors and obtaining a better understanding of the CL and emotional state of the user during learning or interaction [7]. There has been some investigation of the measurement of CL using multimodal techniques, but still more work needs to be carried out on (1) how reliable physiological measures are individually and how sensitive they are with slight increases in CL; (2) how they differ in different designs, scenarios, and CL tasks; and (3) how this measurement changes through the different stages of interaction with task. In this paper, we will investigate the following research questions:
RQ: Can multiple physiological signals be used to reliably measure the cognitive load state in cognitive tasks?
RQa: How can physiological signals be used to measure different levels of cognitive load imposed by cognitive tasks and how sensitive are these measurements?
RQb: What are the physiological changes in these measurements through the different stages of interaction with the task?
To answer the above research questions, we use Sternberg’s memory task [12,13] (for reasons explained in Section 6) as our test bed, with four levels of difficulty and four levels of CL. We investigate the measurement of CL for the different levels of difficulty and investigate CL’s correlation with individual physiological sensors at different stages (maintenance and probe phase) while the user interacts with the task.
The goal of our research is to investigate what physiological signals are accurate measures of CL and so can be used to detect these CL changes for HCI systems without interrupting the users as they interact with the system. Being able to detect and measure the user’s cognitive load through physiological cues could help improve individual performance. For example, measuring the user’s cognitive load could be used to adapt a virtual reality (VR) training system application according to the user’s CL level. We want to investigate how reliable, sensitive, and accurate each of the physiological measures are using four levels of CL as the difficulty level slightly increases and, also, to find the limitations of each physiological signal for different designs, scenarios, and CL tasks.
Our contribution to the current state of multimodal measurement of CL are (1) providing an empirical experimental paradigm and design that could isolate and separate CL from other cognitive operations such as motor response (the modified Sternberg’s memory task), (2) introducing and investigating the measurement of CL with four levels of CL as it gradually increases instead of binary low–high CL levels, (3) exploring the correlation of CL with physiological signals using four physiological sensors (EEG, PD, SC, HR), and (4) exploring these correlations in different states (both maintenance and probe phases) of user interaction with tasks.

2. Related Work

Researchers have studied cognitive load for many years. Cognitive load is defined as the amount of mental effort required to learn new materials or perform a task [14,15,16,17,18]. Cognitive load theory (CLT) suggests that every individual has a fixed [19], limited working memory capacity [20,21] that varies between different individuals [22,23].
Cognitive load theory [14,15] explains that successful completion of any task requires a complex interaction between long-term memory, working memory, and sensory inputs. Previously learned knowledge and skills are stored in long-term memory. Working memory is where sensory and long-term memory interface and new sensory information is compiled and integrated into long-term memory [24]. Although sensory and long-term memory have a flexible capacity for processing large amounts of information, working memory has a limited capacity [19,22]. Multiple research papers have shown that learning, performance, stress, and burnout can be predicted by measuring CL [25,26,27,28].
A broad range of measurements of the peripheral nervous system are shown to be reliable indicators of changes in CL [20], for example, ocular information [29] (such as pupil dilation [30,31]), cardiovascular information (such as blood pressure [32], heart rate (HR) [2,29,33,34], and heart rate variability (HRV) [35,36,37]), and the electrical conductance of the skin (SC) [3,38]. On the other hand, the central nervous system oversees memory. Emotions, stress, and frustration impact both the central and peripheral nervous system. The peripheral nervous system can be functionally divided into the somatic (controlling bodily and muscle movements) and the autonomic (controlling our inner organs) systems. Furthermore, the sympathetic nervous system (SNS) and the parasympathetic nervous system (PNS) are part the of autonomic nervous system. The SNS is physiologically excitatory; it increases physiological arousal when it is active, while the PNS is the opposite, and it inhibits physiological arousal when active.
In order to identify the cognitive processes and model how they operate and interact, it is critical to accurately assess the cognitive states and measure CL. Multiple methods are known in the literature for assessing the CL of a user while performing multitask activity [39]: (1) measuring performance based on error rates (e.g., [40]) and learning times (e.g., [41,42]), (2) user’s self-rating scales (e.g., [43]), and (3) measuring physiological cues. The first two are subjective measures (e.g., [44]), while the third one is an objective measure. Some of the disadvantages of subjective measures are that they cannot dynamically assess the user’s cognitive load, they are interruptive, and they rely on the user’s ability to rate their own cognitive load level. On the other hand, one of the biggest advantages of objective measures is that they provide real-time cognitive measures without impacting or interrupting the user’s performance. These physiological measures have been shown to be sensitive to variation in CL over time [45,46].

2.1. Heart Rate (HR)

Previous studies have investigated CL measurement using different HR measurement methods, such as within-beat analysis (WIB), empirical mode decomposition (EMD), heart rate variability (HRV) [37], and low-frequency (LF) and high-frequency (HF) bands by using time domain or frequency domain analysis (FFT analysis and various methods of wavelet transformations) [37,47]. More detailed information about HR metrics and CL measurement methods is given in [35,47]. It has been shown that the LF/HF ratio (the ratio of the power of the LF to HF bands) estimates the ratio between SNS and PNS activity and is a reliable indicator of CL changes [37]. HRV has also been shown to correlate with CL [9,35], where a low HRV indicates a calm state and a high HRV indicates stress or frustration.
In this paper, we chose to not use the above mentioned methods and instead use an averaging method due to HR limitations. Some of these limitations include (1) HR data are linear and constant and (2) HR shows a slow reaction to CL changes; therefore, the HR reaction to changes in CL might not be detectable in shorter periods (e.g., few seconds). Previous studies using the HR method for arithmetic stress tests have shown an increase in HR as math equations were presented [48,49,50]. The HR averaging method might be a better method for CL measurement in applications that have a shorter period. Due to this limitation for our experimental paradigm (short period), we used an averaging method, explained in Section 4. Based on the prior literature, we hypothesized that our averaged heart rate would increase with the increase in CL for both maintenance and probe phases [48,49,50,51].

2.2. Skin Conductance (SC)

Changes in the sympathetic nervous system (SNS) affect sweating, which changes the skin’s salt content and hence, its electrical conductivity [52,53]. Thus, changes in skin conductance (SC), also known as galvanic skin response (GSR), have been shown to be related to changes in the SNS [54]. Studies have shown that when the arousal level increases, SC also increases. GSR is shown to be related to stress, excitement, engagement, frustration, and anger and is shown to be consistent with the self-reported assessment of arousal [55].
Studies have shown that there is a reliable relationship between SC and cognitive activities [56,57,58]. Shi et al. [59] found that SC increases as the CL of the task increases and has been proven to be a real-time indicator of CL using ML. They extract six features from their GSR data including peak number, peak amplitude, rise duration, peak area, accumulative GSR, and power spectrum for measurement of CL during two different arithmetic experiments for their ML classifier. They show a high accuracy of CL detection with the above mentioned feature classifier in their experiment. In [60,61,62], they extract the slow-varying tonic and fast-varying phasic components of GSR to detect the CL changes using fast Fourier transform (FFT) to extract SC frequency and amplitude on n-back test and other CL tasks. They showed that SC frequency and amplitude serve as a good metric for detection of high–low CL.
To simplify our analysis, we chose an averaging method rather than extract the tonic and phasic components of GSR, which is explained in Section 4. Based on the prior literature, we hypothesized that our averaged SC would increase with the increase in CL for both maintenance and probe phases.

2.3. Pupillary Response

The pupillary response is shown to be a very sensitive and reliable measure for CL [63]. The pupillary dilation is controlled by the sympathetic pathways from the central nervous system [63]. The sympathetic nervous system is associated with activation, so there is reason to believe that task-evoked dilation is a measure of cognitive effort. The history of the relationship between working memory and pupil response goes back to the 1960s [64], when Hess showed that as the difficulty of multiplication tasks increased, the users’ pupil diameter also increased. Similarly, Kahneman and Beatty [65] showed that pupil size increased when the number of digits in a memory task increased. Users were verbally presented with digits that they had to reproduce after a short delay. The authors’ results showed that the pupil size increases during the encoding phase and decreases during the recall phase.
Beatty et al. [66] studied the impact of memory overload. In their study, participants were presented with an increasing number of digits and asked for immediate recall. Their study showed that the pupillary diameter increased as the number of digits increased, but the pupillary diameter correlation stops when a certain maximum value is exceeded (cognitive overload); this cognitive overload was reported as seven digits. Their conclusion was that once the memory is overloaded, pupillary dilation does not increase anymore. Peavler [67] reported similar results in their study.
Blink rates have also been reported in several studies as an indicator of CL. In [4], eye blinks (blink rate, blink number) have been used to assess the level of CL in arithmetic tasks. The authors show that with increasing task difficulty the blink number and blink rate decrease. However, for our analysis, we chose not to analyze the blink rate or blink number.
Based this prior literature, we hypothesized that the average PD will increase with the increase in CL for both maintenance and probe phases [64,65].

2.4. Electroencephalography (EEG)

EEG measures neural activity in the brain and shows changes in neural activity almost immediately, which makes it one of the most responsive and reliable measurements of CL. The frequency-domain analysis of EEG is one of the most practical methods for this purpose, which transforms the data from the time domain to the frequency domain and divides them into several different frequency bands (e.g., alpha), then power spectral density (PSD) is computed from each band for CL measurement across different levels of CL. The diversity of neural activity changes happening in the brain during interaction with the tasks adds complexity to the analysis and the use of EEG for CL detection. There is no clear correlation between EEG signals and CL, but in some studies an increase or decrease in alpha, beta, and theta bands is reported with an increase in CL [1,68], which creates uncertainty about the direction of these relationships with CL.
Klimesch showed that an increase in theta and lower beta band powers in the frontal midline regions are related to an increase in CL [69]. Studies conducted in [46,70,71] showed an increase in alpha and beta band power related to an increase in mental workload. For example, alpha power in the right frontal and parietal regions and also an increase in beta band power in the temporal region was shown as an indicator of higher mental workload [69,72,73]. A recent meta-analysis by Chikhi et al. [68] and systematic review by Pavlov et al. [1] of working memory papers summarizes the current literature on EEG measurement of CL, showing an increase in frontal theta (4–8 Hz) relationship for high compared to lower CL, showing that the frontal theta power has a proportional relationship with the number of items to be maintained in memory [74,75,76,77,78]. Harmony et al. [79] and Petsche et al. [80] found that the theta and delta band increase is related to task difficulty in arithmetic tasks. Itthipuripat et al. [81] also found this increase in the frontal theta band followed by an increase in the alpha band in the Sternberg task for the maintenance phase. However, some studies reported the opposite, arguing a decrease in theta power associated with CL (e.g., Brzezicka et al. [82]). This was also found in [83], where the theta and alpha band power decreased when subjects encoded new information.
The alpha band shows more inconsistency; in some studies, an increase in the alpha band tends to be the measure for an increase in CL [77,84], while the opposite trend is reported in other studies [85,86]. The meta-analysis of Chikhi et al. [68] reported an overall inverse correlation of CL and alpha band power, especially in the parietal regions, and the alpha band increased systematically with memory load in both parietal-occipital (e.g., Pz and O2 and lateral electrodes (e.g., CP5 and T8) for the maintenance phase in the Sternberg task. This inconsistency is also reported with the beta band. Some studies in the literature such as Chikhi et al. [68] found a positive correlation between cognitive load and beta band power; Chen et al. and Kornblith et al. [87,88] found that beta band power increases with increases in CL, but other studies found the opposite (negative) correlation between CL and the beta band [81,89]. Itthipuripat et al. [81] found a significant decrease in the beta band after showing each letter in the Sternberg task.
Overall, these inconsistencies suggest that additional studies are needed to investigate the relationship of CL with lower and higher alpha, beta, and theta across different brain regions using several levels of difficulty. Additionally, it is still unclear what are the changes in these frequency bands in different brain regions in the probe phase, as most of the studies in the literature only analyze the maintenance phase. Informed by the highly variable literature on CL and EEG band power, we hypothesized that we would observe an increase in theta, alpha, and beta and an increase in frontal theta, parietal alpha, and temporal beta in the maintenance phase and expect an increase in frontal theta and parietal alpha in the probe phase.

2.5. Multi-Modal Sensing

Research on the measurement of CL using multiple signal modalities suggests that these modalities can carry complementary and overlapping information, so a fusion of these physiological signals could help for better and more accurate CL detection. Some studies such as [90,91,92] explore the measurement of different levels of CL and CL correlation with several physiological signals such as SC, PD, HR, and EEG, while others utilize machine learning (ML) techniques to detect and classify the CL using these signals [93]. However, there is still a need for an investigation of the limitations and benefits of using a multi-modal approach for CL detection and CL correlation with individual signals.
Previous work found that with increasing CL the HR accelerates, but there is lower heart rate variability [29,33,94,95,96]. This CL correlation is also observed in pupillary response, for example, an increase in saccades [30,97,98] in blink rate [99] and pupil dilation [20,100,101]. This reaction of the autonomous nervous system and the correlation of signals with CL suggests that the fusion of multi-modal signals has the potential to improve the accuracy of CL detection.
Some of the common multi-modal fusion strategies with ML are feature-level fusion, decision-level fusion, and hybrid fusion. For example, in [4], multiple features of GSR (accumulative GSR, power spectrum) and also eye blinks (blink rate, blink number) were used to assess the level of CL in arithmetic tasks using ML techniques. Nourbakhsh et al. [4] used ML to classify blinking and used GSR data for the feature extraction and classification. They reported these significant correlations of accumulative GSR, the power spectrum of GSR, blink number, and blink rate with CL and showed the accuracy of the CL classifier using these features with SVM and naïve Bayes (NB). Nourbakhsh et al. [4] also reported that by using feature-level fusion (combining GSR and blink features), the accuracy of the CL classifier model was improved. Haapalainen et al. [33] used NB for ECG and eye movement feature extraction in high–low CL task detection; they also reported an improvement in accuracy from 76% to 80% by using feature-level fusion. In [34], Ferreira et al. used ECG, EEG, and GSR features for CL classification in high–low CL tasks, and they reported an accuracy of up to 73% for a 10-second model and 86% for a 60 s model with decision-level fusion.
Zhang et al. [102] also explored decision fusion to achieve a more robust prediction. They combined sub-decisions of models trained on each modality and experimented with using hybrid fusion, a combination of feature fusion and decision fusion, to improve the performance of CL inference. The authors reported that the accuracy of feature-level fusion, 84%, was higher than the best accuracy of each single-modality classification. The highest observed accuracy of decision-level fusion was 82% and the highest accuracy of hybrid-level fusion was reported as 83%. In [103], Jimenez-Molina et al. used EDA, ECG, PPG, EEG, temperature, and pupil dilation signals for feature extraction steps in SVM, multinomial logistic regression (m-LR), and multi-layer perceptron (MLP) for CL classification. The authors also observed an improvement in accuracy with feature fusion. Siegel et al. [104] used PPG and pupillary response for feature extraction steps and CL classification using feature fusion for a very wide data set and achieved an accuracy of 79%.

3. Method

In our study, we used the Sternberg memory-search task [12,13], which is a well-known test for measuring short-term memory and cognitive load. We designed and modified this test (maintenance, probe, and feedback phase) for the purpose of this study (1) to isolate and separate the CL compound with other cognitive operations such as motor responses and (2) to create four levels of difficulty to illustrate four levels of CL. The aim of this study was (1) to test the effectiveness of common physiological measures of cognitive load using the Sternberg memory-search task with four levels of CL and (2) to measure, analyze, and compare the different levels of CL in both maintenance and probe phases.

3.1. Participants

Fifteen participants (14 males; 1 female; age range: 18–30, M = 23 years old) took part in the study. We recruited participants with good uncorrected vision and no prior eye surgeries. Due to a sensor connection failure, heart rate data were only collected for 12 participants, and the SC data were only collected for 10 participants. For some participants, the eye tracker also failed to capture eye and eye dilation, so we excluded the participants who had more than 75% data lost due to the eye tracker failure from data analysis, and only 11 participants were used for PD analysis. For the EEG data analysis, we had all 15 participants. Participants were given a NZD 20 supermarket voucher as compensation. The study was approved by the University of Auckland Human Participants Ethics Committee, Reference number UAHPEC22022.

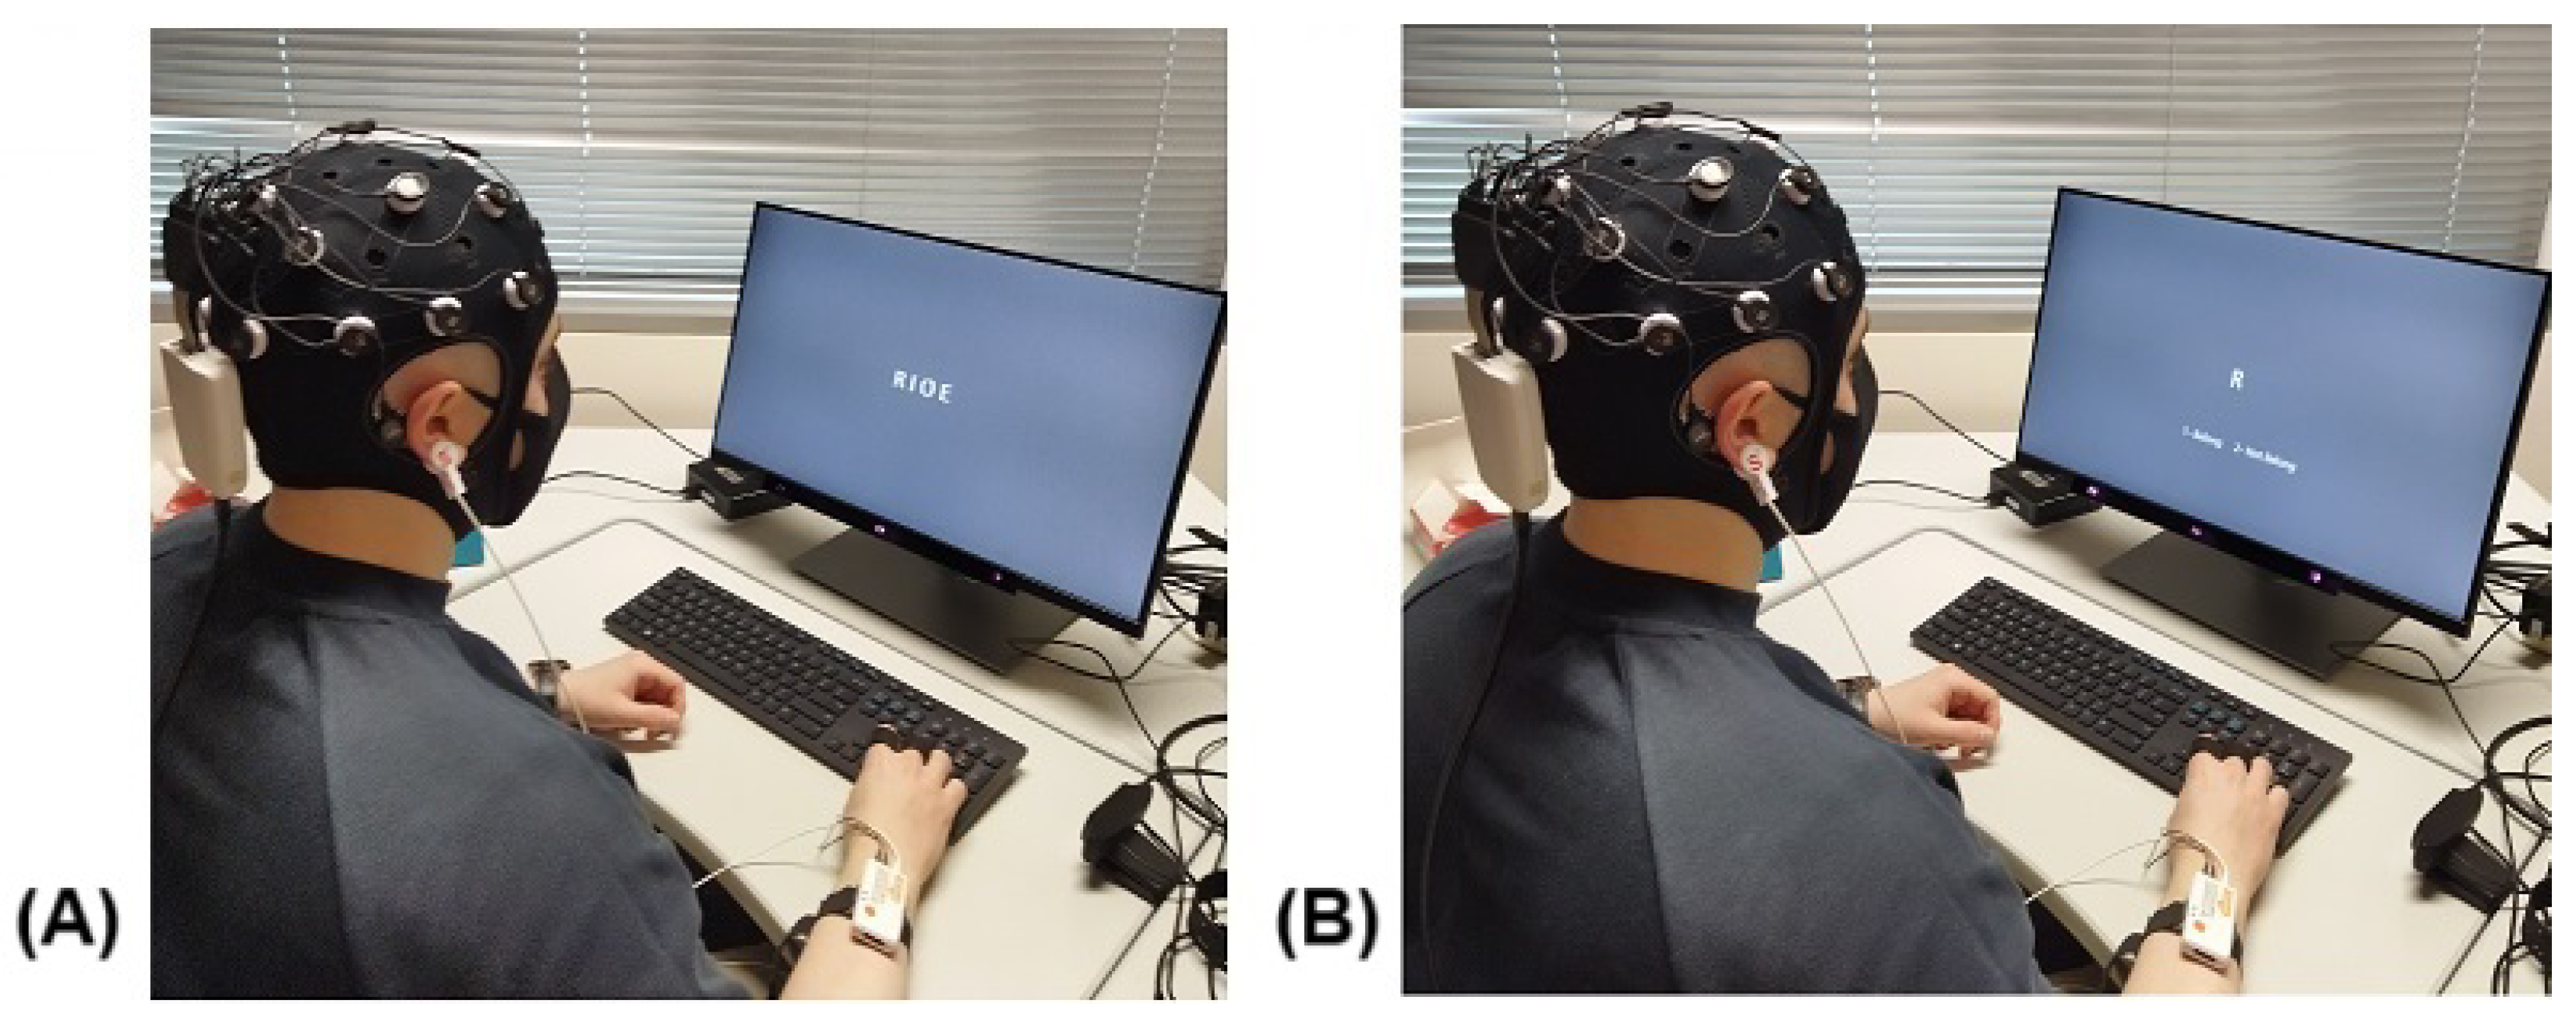
3.2. Equipment and Data Collection

Participants were required to wear an EEG gel cap (Enobio 20 gel cap) [105] and Shimmer hardware [106] was worn on the wrist of the participants’ non-dominant hand, as illustrated in Figure 1. The participant was instructed to sit on a chair 45 cm from a monitor (monitor resolution of 1920 × 1080), as illustrated in Figure 1.
The EEG data were collected using the Enobio 20 gel cap [105] and were sent through the Lab Streaming Layer (LSL) to the iMotion software to be synchronized with other physiological data using event markers. During task performance, EEG data were continuously recorded from 20 electrodes with the Enobio 20 gel cap [105] using the electrode placement following the international 10–20 system. Electrodes were placed at the following scalp locations: frontal regions (Fpz, Fz, F3/F4, F7/F8), central regions (Cz, C3/C4, C5/C6), temporal regions (T7/T8, P7/P8), and the parietal regions (Pz, P3/P4, CP5/CP6). The EEG data were collected at a sampling rate of 500 samples per second.
iMotion [107] is a multidisciplinary sensor monitoring software that allows a researcher to easily design stimuli (and event markers for these stimuli) and also record physiological feedback. iMotion used the eye tracker (Tobii Pro X3-120) [108] to track and record eye data and Shimmer hardware [106] to capture GSR and heart rate data. The captured data were recorded by iMotion and could be visualized and replayed together or individually.

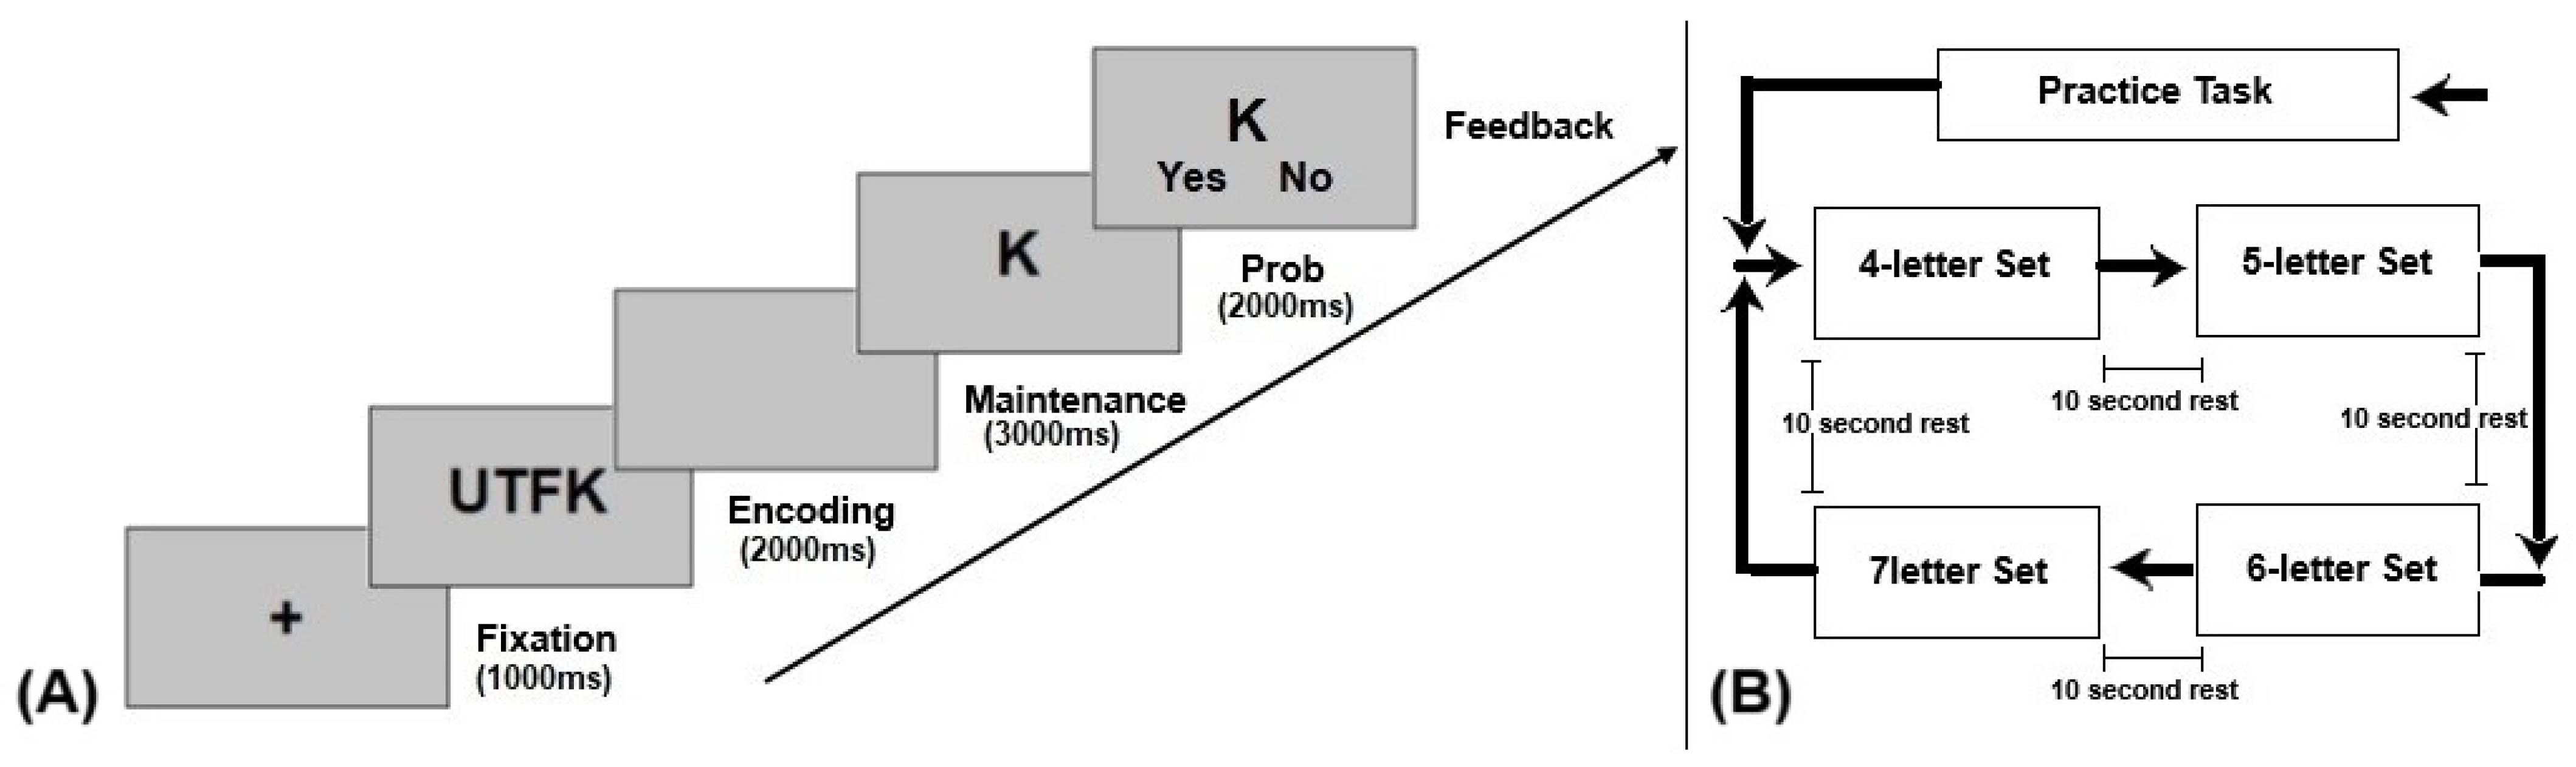
3.3. Experimental Task and Procedure

For this study, we used the Sternberg memory-search task (non-semantic words type). The test has four phases: an encoding phase (2 s), a maintenance phase (3 s), a probe phase (2 s), and a response (feedback) phase (free to respond up to a maximum of 3 s), as illustrated in Figure 2A. During the encoding phase, a memory set of a combination of random letters as a single non-semantic word was presented to the participant. For example, we showed the participants a combination of 4-letter words (or 4/5/6/7-letter words) for 2 s.
The words were non-semantic and made up of random sets of characters, such as “UTFK”. Each word was capitalized with a font size of 72 and appeared in the center of the monitor in white color with a gray background. Figure 1A illustrates the encoding phase. In the maintenance phase, we showed three seconds of blank (gray background). In the probe phase, we displayed a random letter (e.g., “K” in white color with a gray background, capitalized with a font size of 72), with the probability of 0.6 of the probe matching one of the stimuli to be remembered. In the response phase, we asked the subjects to answer whether or not the given letter (e.g., letter “K”) was present (belongs to the memory set) in the encoding phase by pressing the allocated key for “Yes” or “No” on the keyboard. Figure 1B illustrates the response phase. For each set (4/5/6/7-letter word), we repeated the above procedure for a total of 20 non-semantic words. Each block of the sets contained 10 trials starting with a 4-letter word and a 10 s rest at the beginning of each set see Figure 2B). The second block set was a 5-letter word and continued with 6-letter and 7-letter words with a 10 s rest in between, and the cycle was repeated for another round starting with a 4-letter word see Figure 2B).
To reduce blink artifacts and EEG noise, we asked the participants to only blink during the fixation period at the beginning of each trial. At the beginning of the study, we also let participants practice the task for 1 min using different words that were not used in the task in order to familiarize themselves with the response keys as well as the study procedure.

4. Data Preprocessing

As the aim of this study was to investigate the effectiveness of physiological cognitive load measures with the Sternberg task, we chose to focus our analysis on the maintenance and probe phase of our study (see Figure 2A). In order to relate the CL imposed by each difficulty level, we only analyzed trials in which the participant successfully responded (Hit).

4.1. Baseline Correction: SC, PD, and HR

The skin conductance (SC) amplitude, heart rate (HR), and pupil dilation (PD) data were calculated using an iMotion internal function and the data were stored in a .csv-format file for offline analysis. These data were collected at a sampling rate of 120 samples per second. The baseline correction just applied to SC, PD, and HR. We calculated the baseline from the 10 s rest period at the beginning of each set (see Figure 2B). The baseline was determined for each set by measuring from a 1000 ms period preceding the end of the rest period (10 s rest at the beginning of each set). This baseline was calculated for each physiological sensor, SC, PD, and HR, using an averaging method from the rest period. The baseline was calculated for each difficulty set separately and stored in a .csv format. The baseline correction was conducted by subtracting the baseline value from the trial data for both the maintenance and probe phases. This baseline correction was applied for all of the trials using the baseline calculated at the previous step for each difficulty set. The same process was applied for each physiological sensor: SC, PD, and HR. The averaging method was then used for the final step to calculate the average baseline correction over trials for each difficulty set. These average baseline corrected data were used for statistical analysis of each above mentioned physiological sensor.
With regard to the methods explained in the related work Section 2 and the related literature on processing the SC, PD, and HR, the proposed averaging method avoids any complexity and heavy computation to extract the future for data analysis. This method simplifies unnecessary steps to measure CL and to show the CL correlation with the above mentioned physiological signals.

4.2. EEG Preprocessing

The EEG analysis was performed using custom MATLAB code and functions from the EEGLAB Toolbox [109]. The data were first re-referenced against the average mastoids, highpass filtered above 0.05 Hz, notch filtered to remove line noise using Cleanline, and resampled to 250 Hz. Eye-blinks were rejected using the automatic rejection via the i c f l a g function in EEGLAB with a threshold of 0.7 and component from data that were highpass filtered above 2 Hz. Data were subsequently cleaned using the c l e a n r a w d a t a function with a flatline criterion of 10, channel criterion of 0.6, line noise criterion of 6, burst criterion of 80, window criterion of 0.5, and burst rejection. The data were re-referenced against the mastoid.
Events were created based on behavioral performance, i.e., correct or incorrect response for each level of difficulty (corresponding to 4/5/6/7-letter words). We only focused on the correct response epochs, as there were insufficient trials with incorrect responses for analysis. We calculated the log power spectral density for each subject, condition (4/5/6/7-letter words), and channel in both the maintenance and probe phases. This was carried out by using the EEGLAB function spectopo. We then calculated the mean absolute power for the following bands: delta (1–4 Hz), theta (4–8 Hz), lower alpha (8–10.5 Hz), upper alpha (10.5–13 Hz), lower beta (13–20 Hz), and upper beta (20–30 Hz). Then, to increase the normality of the data for statistical analysis, we log-transformed the values (log power spectral density). Due to our blocked experimental design, the fast-moving spectrotempoal dynamics of EEG, and to avoid potential effects of other cognitive processes that might reflect the pre-trial interval, we did not apply the baseline correction. To simplify our analysis, the eighteen channels were clustered into three clusters based on the prior literature [68] as follows: frontal (F3, F4, F7, F8, Fz), centrotemporal (C3, C4, CP5, CP6, T7, T8, Cz), and occipitoparietal (P3, P4, P7, P8, Pz). For each frequency band across all electrodes, we also performed additional analysis and looked at the contrast between low- and high-load conditions.

4.3. Statistical Analysis

We used two methods of statistical analysis to investigate the physiological correlates of CL with the Sternberg memory-search task. Our experimental design included a cognitive load parameter of four-, five-, six-, and seven-letter (non-semantic) words, with only correct trials being included in the analysis. First, we tested if each physiological measurement showed a linear relationship with CL using a linear mixed effects model, following similar methodology as [90]. Each model was fit using restricted maximum likelihood with the fitlme function in MATLAB. The model formula was “Physiological Measurement 1 + Load + (1 + Load | Participant )”. The load was modeled as a fixed and random effect to allow the slopes of the regression model to vary across individuals, because we anticipated a different rate of change across participants, partially due to variations in physiology. The pupil dilation analysis included an additional effect to model which eye (left or right). The EEG data included multiple comparisons (frequency bands x channel clusters), so we used the Holm–Bonferroni method to adjust the reported p-values.
In order to make an easier comparison to CL experiments that solely contrast low- versus high-load conditions, we also conducted a second analysis. We compared our “lower load” (four letters) and “higher load” (seven letters) conditions with repeated measures ANOVA, followed by post hoc paired comparisons. Estimates indicate that working memory capacity is approximately four items [21,110], which is our lowest number of letters (low load), and we anticipated that this might result in some differences between these findings and those that use a low load of a lower number of stimuli (e.g., one to three items). Estimates of effect size (HG) [111] use Hedges’ g; this is also known as the unbiased estimate of Cohen’s d.

5. Results

As most psychology studies just investigate the correlations of CL in the maintenance phase [1,68], one of the motivations of this study was to see these correlations of CL not just in the maintenance phase but also in the probe phase. We were interested to see what are the CL correlation in individual physiological signals and changes in this CL correlation from the maintenance to the probe phase. As our main objective for future work was to extend this study to VR training applications and most VR applications consist of encoding (study) and probe (play) phases, our goal was to investigate to what extent we can still see these correlations of CL for each individual physiological signal in the probe phase.

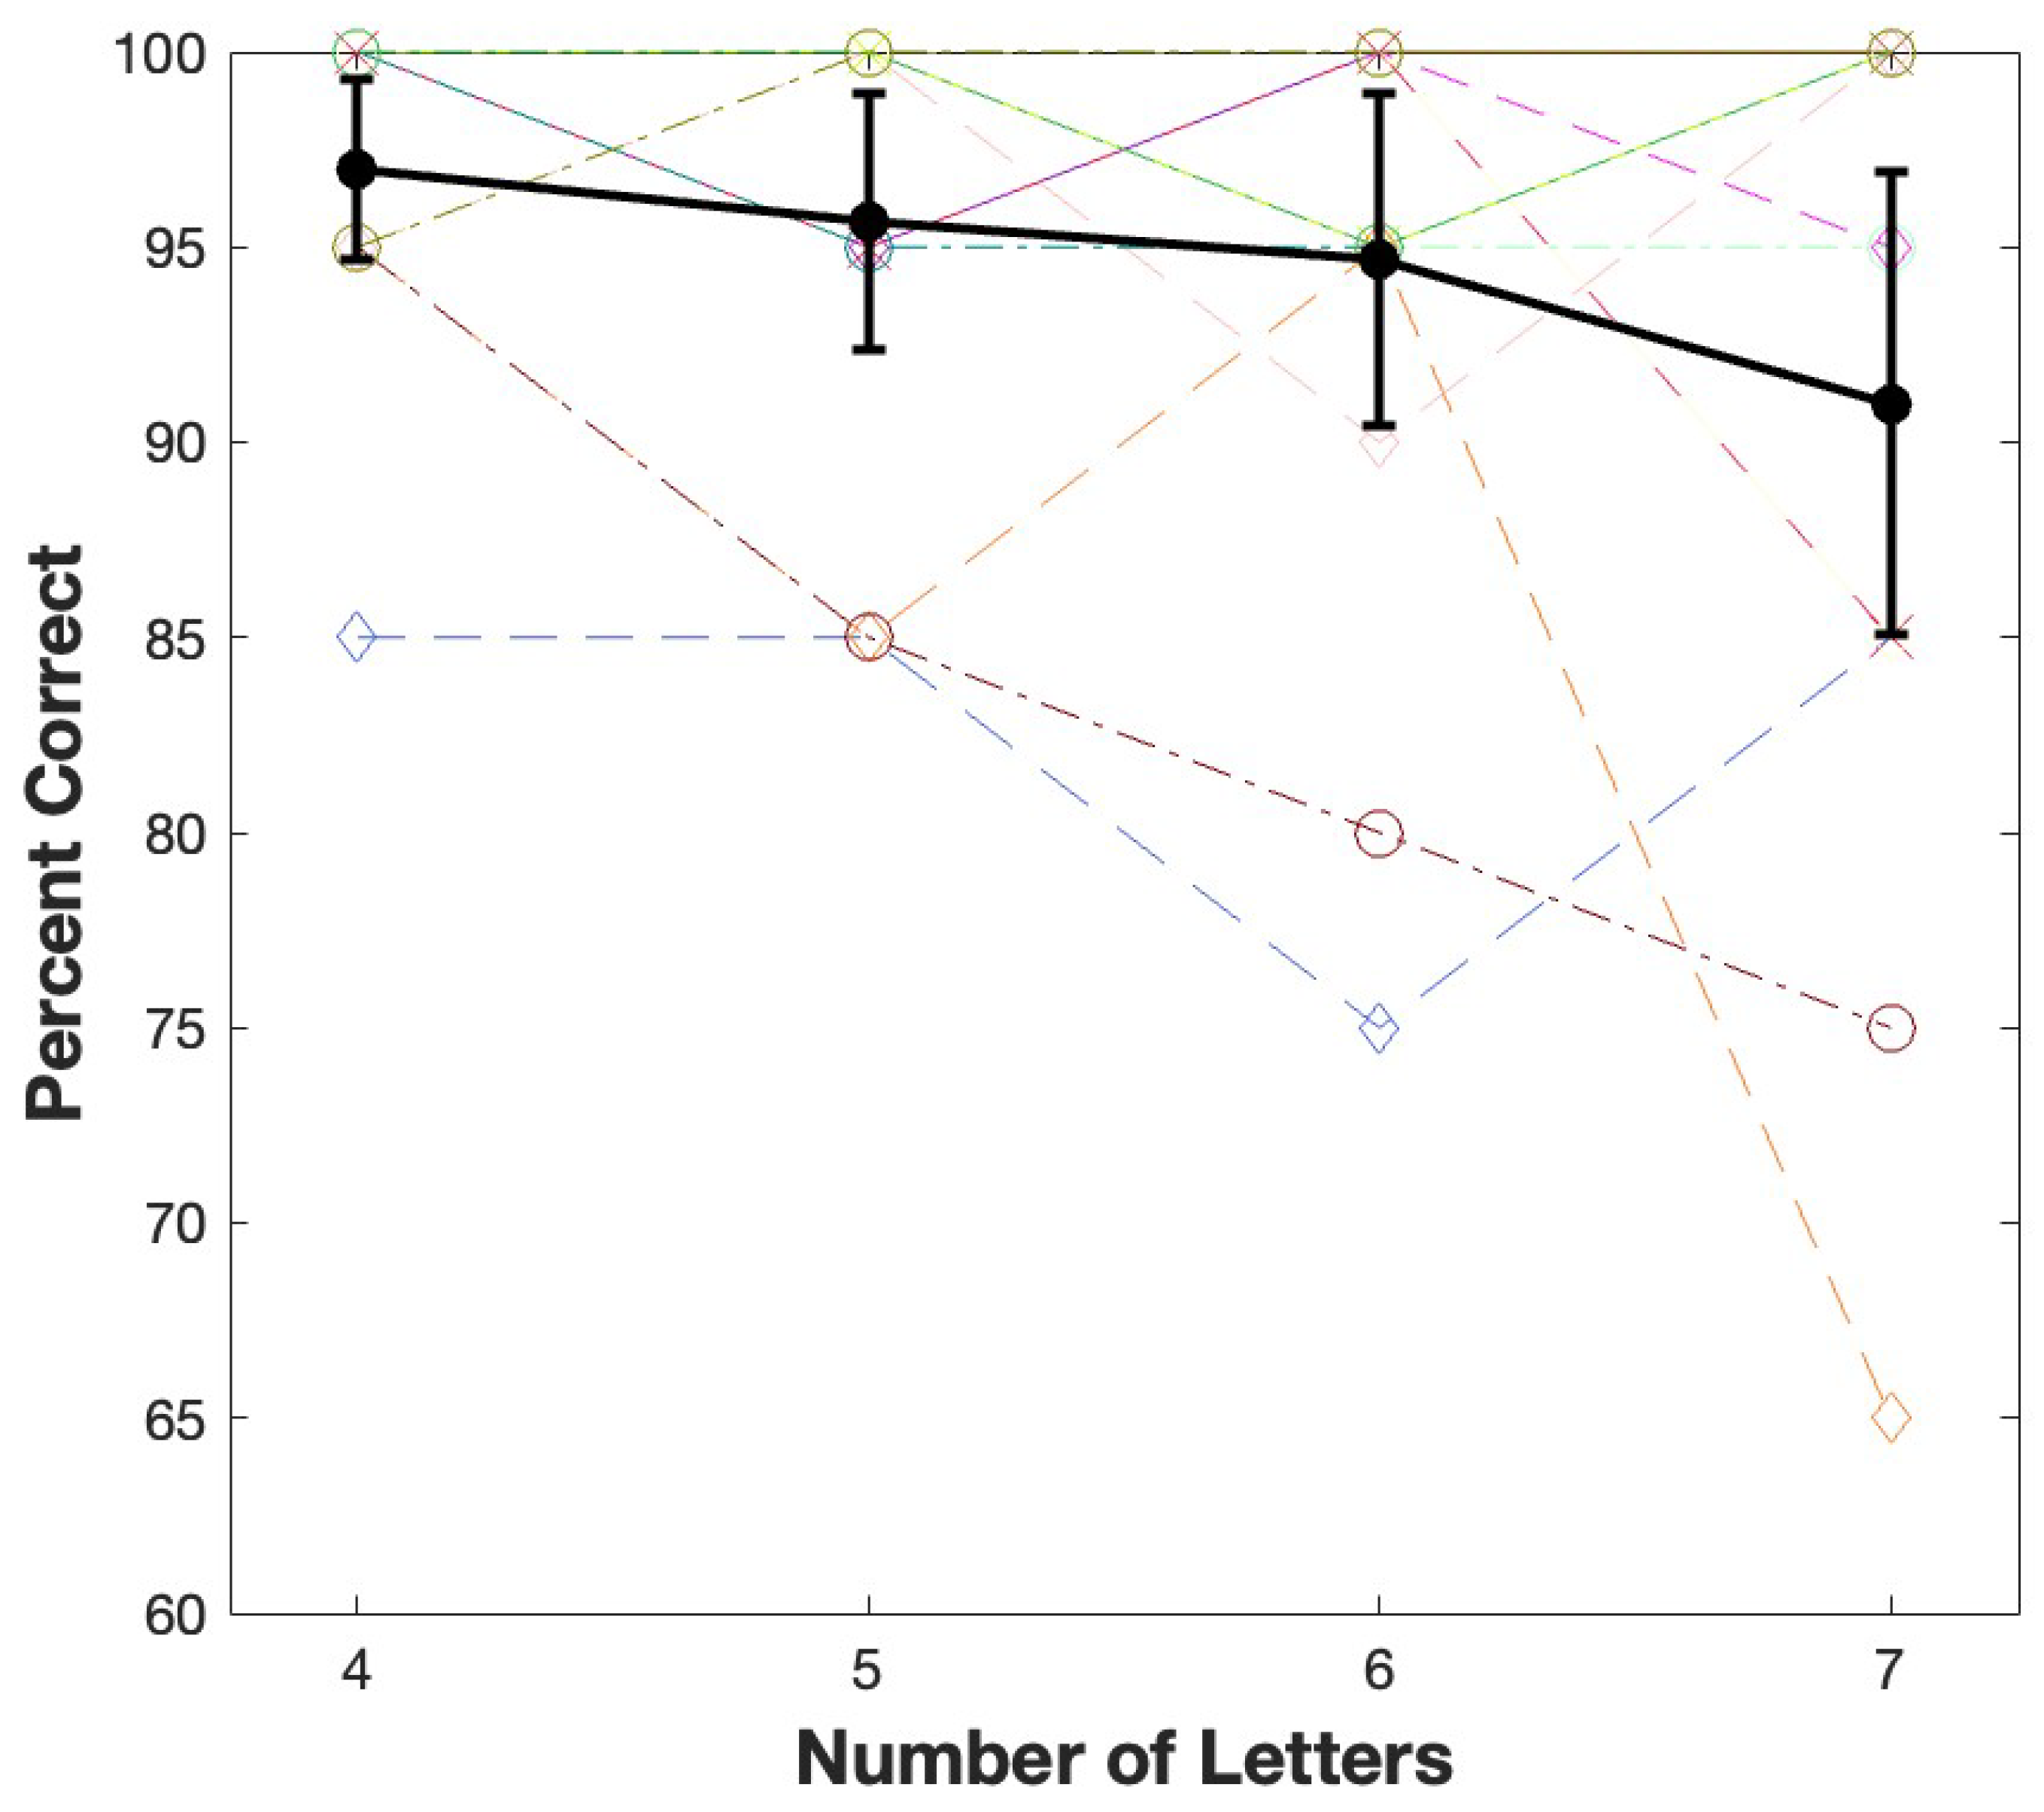
5.1. Behavioral Performance

To analyze the behavioral data, we divided the trial into Hit and Miss based on participant answers in the response phase. If the participant correctly identified the letter belonging to the set that was shown in the encoding phase we consider that trial as a Hit; otherwise, it is a Miss. Figure 3 illustrates the behavioral results. As the number of letters in the word increased, the percentage of correct trials decreased (the dashed lines represent individual subject accuracy). The mean and standard deviation for these data are illustrated in Table 1. The linear mixed model (LMM) results for the factor of CL are illustrated in Table 2. This result implies a relationship between CL and the percent of correct responses. This significant effect indicates a decrease in accuracy of 1.9 for each increase in CL level.
For our high–low (H-L) comparison, four-letter combinations (L) versus seven-letter -combinations (H) yielded a mean difference of 6 and a standard deviation of 10.4. The statistical t-test showed a significant difference between the high- and lower-load conditions, t ( 14 ) = 2.24 , p < 0.05 , with a large Hedges’ g effect size of −0.7 [ 95 % CI: 1.5 , 0.01 ] . This result confirmed that the task difficulty increased as the number of combination letters in a word increased, suggesting that this task serves as an appropriate metric of CL.

5.2. Maintenance Phase

The maintenance phase is the 3 s period in each trial after the non-semantic word stimulus has been removed. During this time, participants attempt to maintain the letters in memory before responding to a probe (see Figure 2A). The screen looks the same regardless of the number of letters to be remembered, which indicates that the differences observed during this period are the effect of cognitive load, not the stimuli themselves.

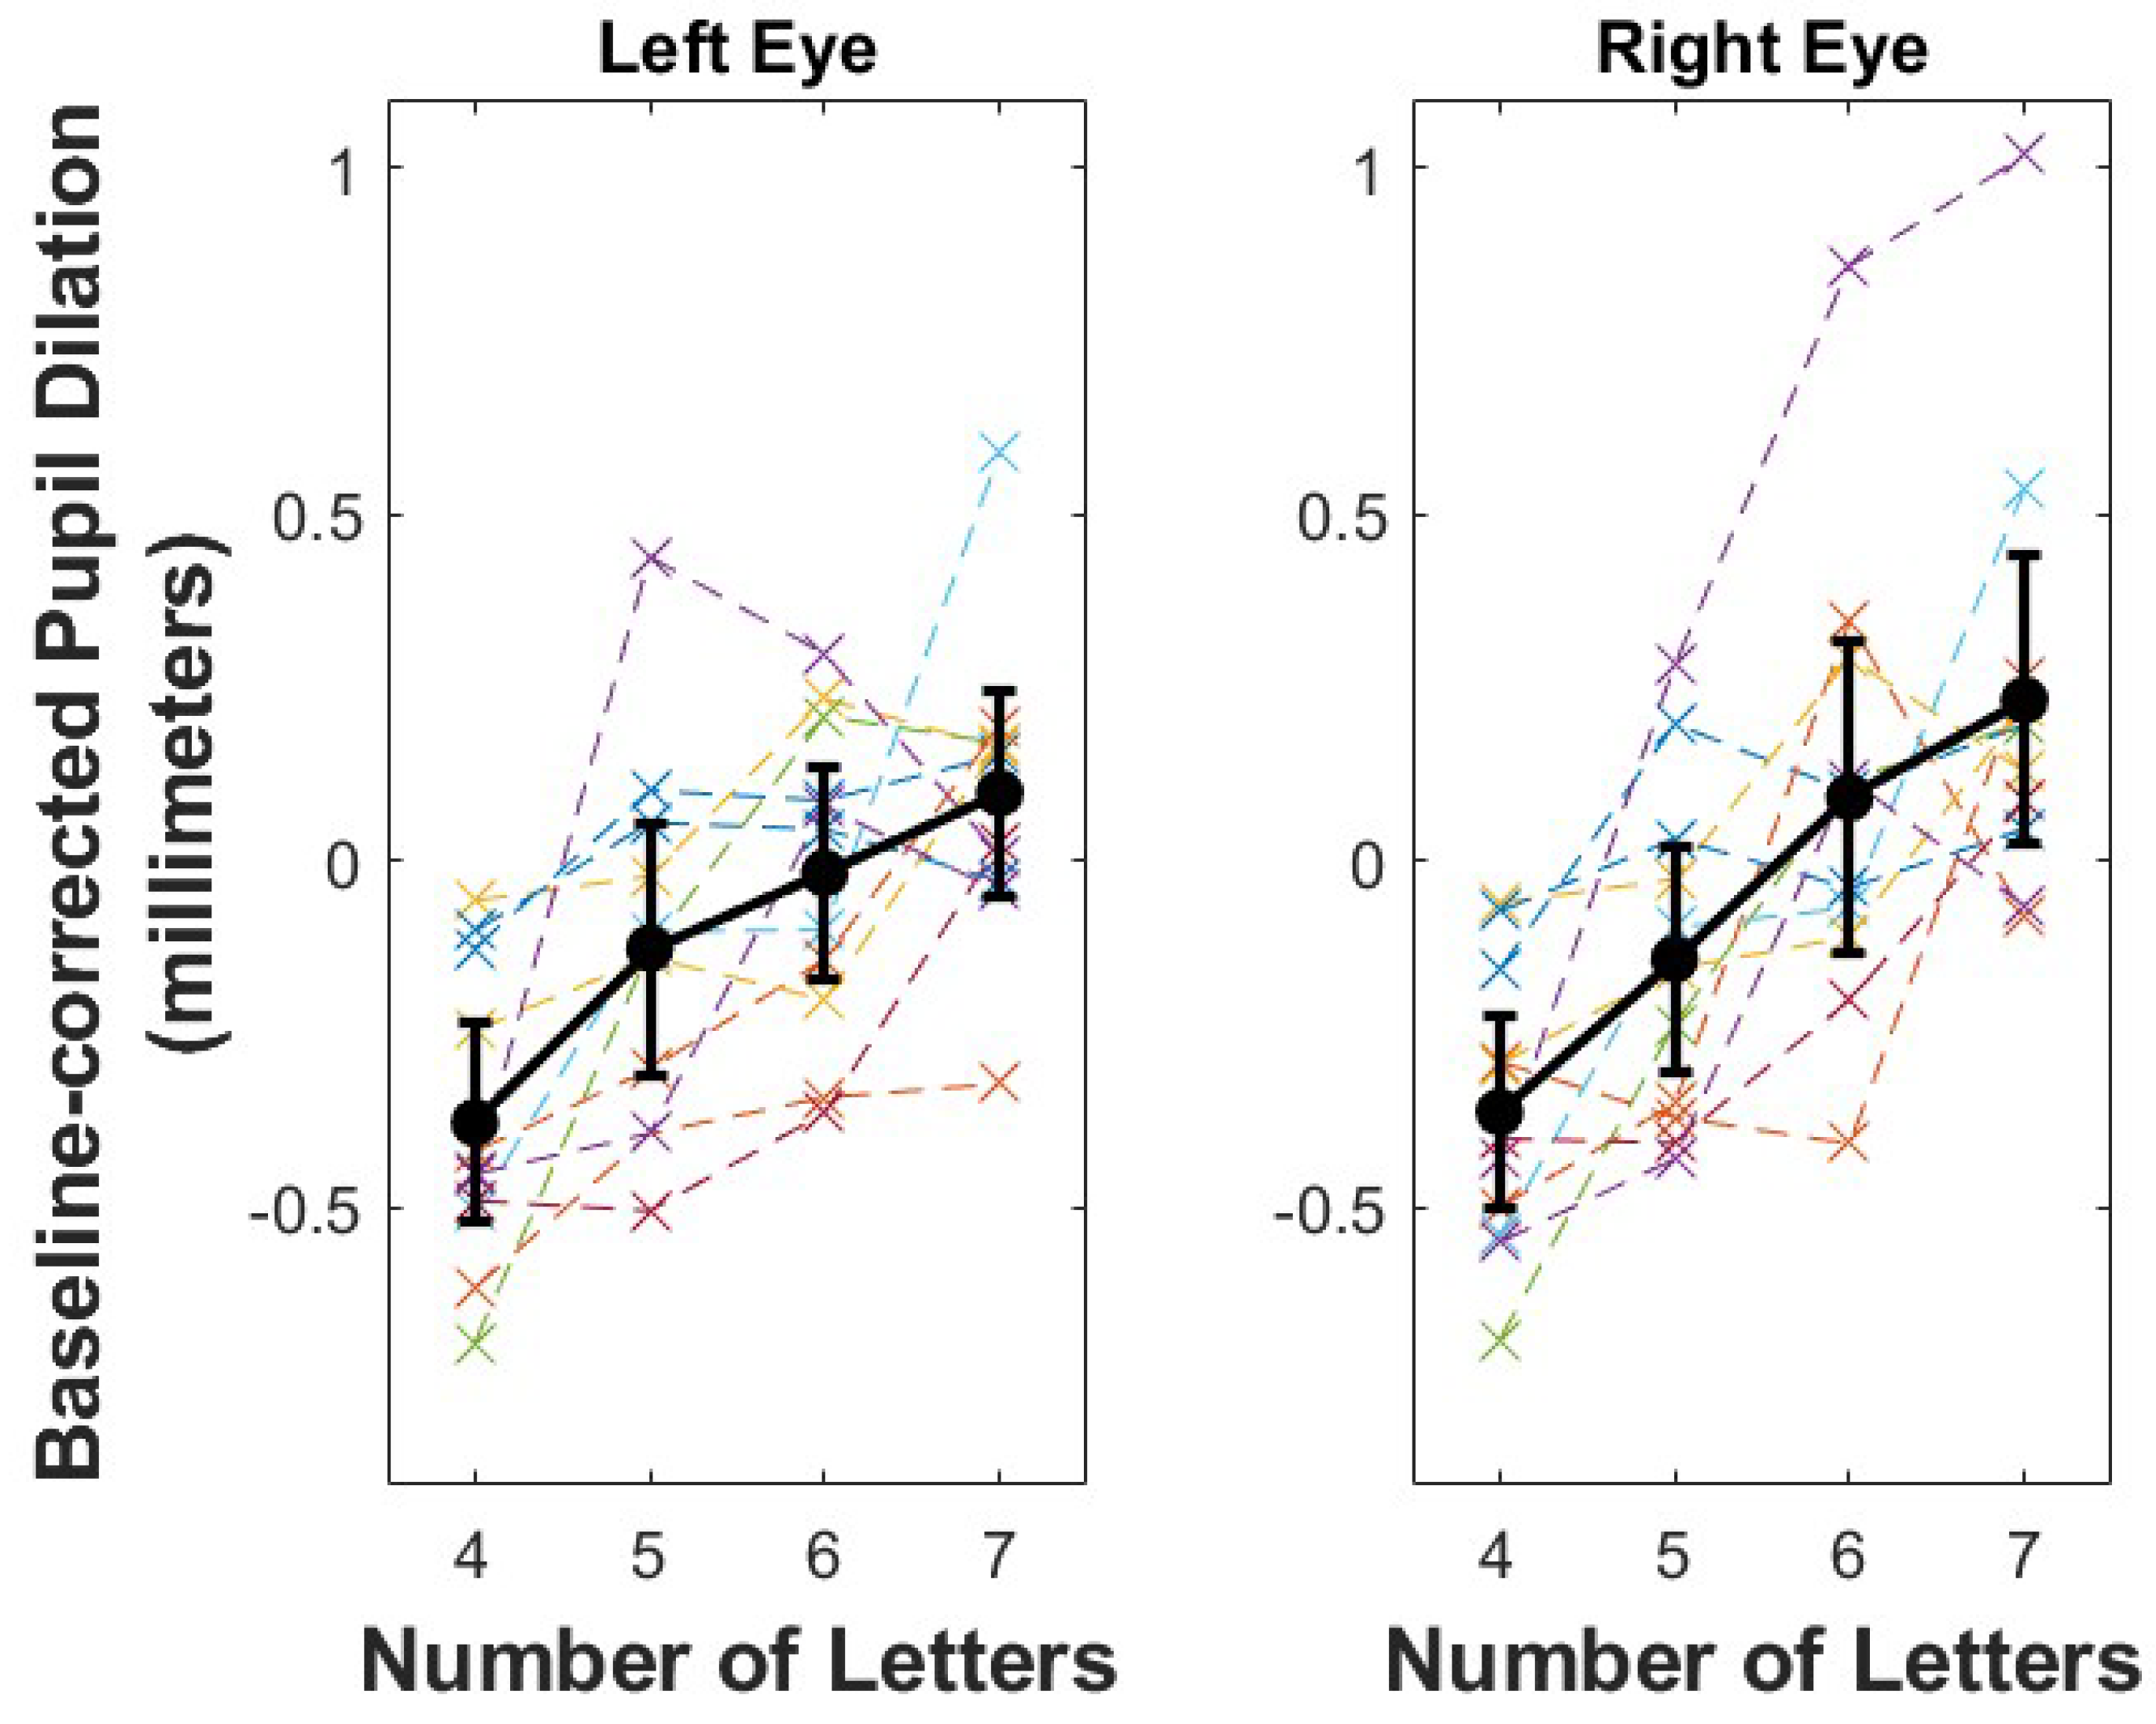
5.2.1. Pupil Dilation (PD)

Figure 4 shows our averaged baseline-corrected pupil dilation (PD) analysis in each eye for each CL level difficulty (four levels of CL). The result shows that with an increase in CL, the change in PD relative to the baseline period increased. These data (mean, SD) are illustrated in Table 1. The model also included a fixed effect of eye (left vs. right), which shows no significant effect between left and right eyes. The linear mixed model result shows a significant linear relationship of CL for each additional letter to be remembered with PD, with an increase of 0.16 mm [ 95 % CI: 0.1 , 0.2 ] (Table 2). For our high–low (H-L) comparison in the left eye, four-letter combinations (L) of 0.31 mm versus seven-letter combinations (H) of 0.12 mm, a paired t-test revealed a statistically significant difference between the high- and lower-load conditions, t ( 10 ) = 4.2 , p = 0.002 , and a Hedges’ g effect size of 1.55 [ 95 % CI: 0.61 , 2.93 ] . For our high–low (H-L) comparison in the right eye, four-letter combinations (L) of 0.26 mm versus seven-letter combinations (H) of 0.24 mm, a paired t-test revealed a statistically significant difference between the high- and lower-load conditions, t ( 10 ) = 4.72 , p = 8.1 × 10 4 and a Hedges’ g effect size of 2.0 [ 95 % CI: 0.89 , 3.71 ] . We observed a highly consistent relationship between CL and PD within subjects for the right eye for ten of eleven participants and the left eye for all eleven participants.

5.2.2. Skin Conductance Responses (SCR)

Figure 5A shows our averaged baseline-corrected skin conductance response (SCR) analysis for each CL level difficulty (four levels of CL). The result shows that with an increase in CL, the change in conductance relative to the baseline period increased. These data (mean, SD) are illustrated in Table 1. The linear mixed model result shows a significant linear relationship of CL for each additional letter to be remembered with SC with an increase of 0.032 μ Siemens [ 95 % CI: 0.007 , 0.06 ] (see Table 2). For our high–low (H-L) comparison, four-letter combinations (L) of 0.055 μ S versus seven-letter combinations (H) of 0.033 μ S, a paired t-test revealed a statistically significant difference between the high- and lower-load conditions, t ( 9 ) = 2.89 , p = 0.018 , and a Hedges’ g effect size of 1.2 [ 95 % CI: 0.2 , 2.57 ] . Of the ten participants with SCR data for the five-letter combination condition (five-letter CL), two had greater skin conductivity and one had the lowest skin conductivity compared to the high-load condition.

5.2.3. Heart Rate (HR)

Figure 5B shows our averaged baseline-corrected heart rate (HR) analysis for each CL level difficulty (four levels of CL). These data (mean, SD) are illustrated in Table 1. The linear mixed model result shows no significant linear relationship between CL and the baseline-corrected HR (see Table 2). For our high–low (H-L) comparison, four-letter combinations (L) of 1.38 Δ b p m versus seven-letter combinations (H) of −0.28 Δ b p m , a paired t-test also did not show a significant difference between the high- and lower-load conditions, t ( 11 ) = 1.46 , p = 0.17 and a large Hedges’ g effect size of −0.7 [ 95 % CI: 2.0 , 0.37 ] . We also observed highly inconsistent results across participants, with four participants having a faster HR for the high load and seven participants showing a faster HR for the lower load.

5.2.4. Electroencephalography (EEG)

The main objective of our EEG analysis was to evaluate the correlation between the log power spectral density (PSD) and CL. To reduce dimensionality, we clustered our electrodes into three regions: frontal, centrotemporal, and occipitoparietal. To calculate PSD, we used the EEGLAB function spectopo and calculated the mean absolute power for the delta, theta, lower alpha, upper alpha, lower beta, and upper beta frequency bands. Figure 6 shows the mean log power spectral density of four levels of CL across frequency bands and electrode clusters. For simplicity, individual participant lines are not included.
Table 3 shows the results of the 15 mixed effects models (five bands × three channel clusters), with a post hoc Holm–Bonferroni p-value correction for multiple comparisons. This linear mixed model (LMM) result and significant relationship between CL and PSD is shown in Table 3 and illustrated with solid lines in Figure 6. These results show a significant linear relationship between PSD and cognitive load for all three channel clusters in the upper alpha band (centrotemporal, frontal, occipitoparietal) and a linear relationship between PSD and cognitive load for the lower alpha band in frontal and occipitoparietal channel clusters.
In addition, we conducted a high–low (H-L) CL comparison for our EEG data (four-letter combinations (L) versus seven-letter combinations (H)), which is often referred to as high–low CL in the literature. A repeated-measures ANOVA with factors of CL, frequency band, and channel cluster indicated a significant interaction between frequency band and channel cluster, F(10,140) = 2.39, p = 0.01. The post hoc comparison of each band and channel cluster was then conducted using the Tukey–Kramer method; Table 4 shows this result. The result showed significant differences for the upper and lower alpha (for the channel clusters centrotemporal, frontal, and occipitoparietal), theta (for the channel clusters centrotemporal, frontal, and occipitoparietal), and lower beta (for the channel clusters centrotemporal and frontal) between the high- and lower-load conditions.

5.3. Probe Phase

In the probe phase of each trial, the participant was shown a random letter for 2 s (see Figure 2A). The participants were instructed not to respond during the probe phase, but simply to note if the letter was a member of the set of letters that they remembered or not. This design aimed to separate the cognitive response of the probe from the motor response component.

5.3.1. Pupil Dilation (PD)

Figure 7 shows our averaged baseline-corrected pupil dilation (PD) analysis in each eye for each CL level difficulty (four levels of CL). This result shows that with an increase in CL, the change in PD relative to the baseline period increased. These data (mean, SD) are illustrated in Table 5. The model also included a fixed effect of eye (left vs. right), which shows no significant difference between the left and right eyes. The linear mixed model result shows a significant linear relationship of CL for each additional letter remembered with an increase in PD of 0.18 mm [ 95 % CI: 0.12 , 0.24 ] (Table 6). For our high–low (H-L) comparison in the left eye, four-letter combinations (L) of 0.38 mm versus seven-letter combinations (H) of 0.10 mm, a paired t-test revealed a statistically significant difference between the high- and lower-load conditions, t ( 10 ) = 5.37 , p < 0.001 , and a Hedges’ g effect size of 2.0 [ 95 % CI: 0.97 , 3.62 ] . For our high–low (H-L) comparison in the right eye, four-letter combinations (L) of 0.36 mm versus seven-letter combinations (H) of 0.23 mm, a paired t-test revealed a statistically significant difference between the high- and lower-load conditions, t ( 10 ) = 4.9 , p < 0.001 , and a Hedges’ g effect size of 2.08 [ 95 % CI: 0.96 , 3 . 80 ] . We observed a highly consistent relationship between CL and PD within subjects for the right eye in ten of eleven participants and the left eye for all eleven participants.

5.3.2. Skin Conductance Responses (SCR)

Figure 8A shows our averaged baseline-corrected skin conductance response (SCR) analysis for each CL level difficulty (four levels of CL). This result shows that with an increase in CL, the change in conductance relative to the baseline period increased. These data (mean, SD) are illustrated in Table 5. The linear mixed model result shows a significant linear relationship of CL for each additional letter remembered with an increase in SC of 0.034 μ Siemens [ 95 % CI: 0.007 , 0.061 ] (see Table 6). For our high–low (H-L) comparison, four-letter combinations (L) of 0.058 μ S versus seven-letter combinations (H) of 0.034 μ S, a paired t-test revealed a statistically significant difference between the high- and lower-load conditions, t ( 9 ) = 2.87 , p = 0.018 , and a Hedges’ g effect size of 1.15 [ 95 % C I : 0.19 , 2.49 ] ). Of the ten participants with SCR data for the five-letter combination condition (five-letter CL), one had greater skin conductivity and one had the lowest skin conductivity compared to the high-load condition.

5.3.3. Heart Rate (HR)

Figure 8B shows our averaged baseline-corrected heart rate (HR) analysis for each CL level difficulty (four levels of CL). These data (mean, SD) are illustrated in Table 5. The linear mixed model result shows no significant linear relationship between CL and the baseline-corrected HR (see Table 6). For our high–low (H-L) comparison, four-letter combinations (L) of 2.04 Δ bpm versus seven-letter combinations (H) of 1.58 Δ bpm, a paired t-test also did not show a significant difference between the high- and lower-load conditions, t ( 11 ) = 0.6 , p = 0.55 , and a large Hedges’ g effect size of −0.24 [ 95 % CI: 1.23 , 0.68 ] . We also observed highly inconsistent results across participants, with three participants having a faster HR for the high load and three participants showing a faster HR for the lower load.

5.3.4. Electroencephalography (EEG)

Table 7 shows the results of the 15 mixed effects models (five bands × three channel clusters) with a post hoc Holm–Bonferroni p-value correction for multiple comparisons. This linear mixed model (LMM) result and significant correlation between CL and PSD is shown in Table 7 and illustrated with solid lines in Figure 9.
The results of our linear mixed model (LMM) for the probe period show no significant linear relationships between PSD and cognitive load for any region (channel clusters) after correcting for multiple comparisons (corrected p-value using Holm–Bonferroni method). The upper alpha and lower beta frequencies do visually appear to scale linearly with the number of letters, but drop off after six letters, which could indicate participants struggling after exceeding their memory capacity.
In addition, we conducted a high–low (H-L) CL comparison for our EEG data (four-letter combinations (L) versus seven-letter combinations (H)), which is often referred to as high–low CL in the literature. A repeated-measures ANOVA with factors of CL, frequency band, and channel cluster indicated a significant interaction between the frequency band and CL, F(5,70) = 4, p = 0.003. Also, a repeated-measures ANOVA with factors of CL, frequency band, and channel cluster indicated a significant interaction between the frequency band and channel cluster, F(10,140) = 10.23, p < 0.001. The post hoc comparison of each band and channel cluster was then conducted using the Tukey–Kramer method; Table 8 shows this result. The result showed significant differences for the centrotemporal upper alpha and upper beta and also for the occipitoparietal delta between the high- and lower-load conditions.

6. Discussion

The aim of this study was to test the effectiveness of common physiological measures of CL using the Sternberg memory-search task as the difficulty level increases (four levels of CL). We were also interested in investigating how reliable these measurements of CL were with physiological cues in the probe phase by analyzing and comparing the different levels of CL in both the maintenance and probe phases.
For this purpose, we specifically used the Sternberg memory-search task to design four levels of difficulty and measure participants’ CL using multimodal physiological signals (EEG, SC, HR, PD). Some of the reasons for using the Sternberg memory-search task in this study include the fact that in the classic Sternberg task, only one item is probed, which means that maintaining the order of the presented items is irrelevant to the task; to analyze and measure CL using EEG signals, it is important to isolate and have a clear separation between maintenance, probe, and feedback with other cognitive operations such as motor responses. The difficulty in the isolation of directly working memory-related cognitive operations makes the task hardly suitable for EEG. Unlike the n-back test or other well-known CL tasks, the Sternberg memory-search task has all of the above mentioned features.
Most of the existing examples of physiological measures of CL in the literature were mainly analyzed using the maintenance phase. Our main goal is to extend these physiological measures of CL to a VR environment for training purposes and most VR studies are task-based, which does not include maintenance. Rather, they just contain an encoding phase and feedback or probe phase. Thus, we were interested in investigating to what extent we still can find these correlations of CL with physiological cues in the probe phase and transform the correlation of CL from the maintenance phase to the probe phase.
In addition, the measures of CL in the literature usually use shorter time windows (several seconds) and are stimulus-based, while VR studies are mainly task-based and require a longer period (several minutes) to solve tasks. This study contributes to the CL literature by (1) measuring CL with several different physiological cues (multi-modal CL measurement), (2) including four levels of cognitive load, enabling high- vs. low-load comparisons and linear models of CL, and (3) looking at the correlation of CL with individual physiological signals in both the maintenance and probe phase.
Our behavioral measures statistically confirm that differences in workload were indeed experienced: as the number of letters in non-semantic words to be remembered increased, the CL increased, and the task performance was shown to decrease. These behavioral findings indicate that the number of letters in the Sternberg memory-search task serves as an appropriate metric for the CL.
In the maintenance phase, we observed that the SC measurement had a statistically significant positive relationship with CL, supporting our hypothesis. We also observed the same significant positive relationship with the CL during our probe phase as well. The linear mixed model demonstrates a linear relationship with a positive slope between SCR and CL in both maintenance and probe phases. Our paired t-test comparison of the high versus lower CL for both maintenance and probe phases also shows a significant difference between the SCR in the high versus lower loads. This result is aligned with the previous studies in the literature [59], which shows that with an increase in CL, the SC increases. This finding suggests that the average SC is a reliable measure of CL for both maintenance and probe phases.
Our PD results in the maintenance and probe phases showed a reliable relationship with CL, with all participants showing significantly larger pupil dilation for the high load compared to the lower-load condition (high vs. low CL). Our PD paired t-test showed this significant increase in both eyes as CL increases in the high–low comparison for both maintenance and probe phases. Our linear mixed model for both the maintenance and probe phases also showed a significant linear increase in pupil size as CL increased, which aligned with our hypothesis. Our results confirm the previous finding of a positive correlation between CL and PD [65,66,67]. This finding suggests that PD is a reliable measure of CL for both maintenance and probe phases.
Comparing the maintenance to the probe phase, the SCR and PD results suggest that (1) there were no differences between these two phases and we observed statistical significance with a positive slope between SCR or PD and CL for both phases. (2) We still can observe these SCR and PD correlations with CL in the probe phase. Overall, SC and PD appear to serve as a moderately effective and reliable measure of CL in the Sternberg memory-search task. The contribution of this finding with the average SC or PD method to the state of knowledge are (1) the average SC or PD method for measurement of CL could not just apply to the maintenance phase but also the probe phase as well, which suggests that it might a reliable measurement of CL in studies that require longer time periods to solve tasks (several minutes); (2) the result suggests the possibility of CL measurement using PD or SC with even a very simple averaging method; furthermore, there is no need for expensive and complex methods such as extraction of the tonic and phasic components of GSR data.
Our HR result showed highly inconsistent results across participants and showed no relationship between CL and our average baseline-corrected HR in both the maintenance and probe phases. However, due to sensor disconnection, we had a low sample size (a few trials in 11 participants) for our HR data. In addition, the most common HR analysis is using heart rate variability (HRV) [9,62] and due to the short duration of the maintenance and probe phases, we were not able to extract HRV for our data analysis. We had hypothesized that HR would increase with CL, but we observed no consistent relationship between average HR and CL. Apart from the sensor disconnection, which left us with less data, another limitation of HR analysis and validation of CL measurement using HR was its very slow response period to react to changes in CL, meaning that it requires (1) a longer duration to extract HRV and (2) a longer duration to respond to CL changes. For paradigms with longer duration, HRV analysis is an alternative approach for CL measurement that might reveal a better result.
Based on the prior literature looking at EEG and cognitive load, we hypothesized that we would observe an increase in theta, alpha, and beta bands and an increase in frontal theta, parietal alpha, and temporal beta in the maintenance phase and an increase in frontal theta and parietal alpha in the probe phase [46,70,71]. Our results show similar alignment with our hypotheses based on the literature [1,68,79,81,112] (see Figure 6). We observed an overall increase in EEG power as CL increases during the maintenance phase but this relationship does not continue robustly in the probe phase (see Figure 9). In the maintenance phase, this relationship was statistically significant for all channel clusters in the upper alpha band and, in the occipitoparietal and frontal channels, in the lower alpha band, which supported our hypothesis. However, in the probe phase, the upper alpha and lower beta frequencies do visually appear to scale linearly with the number of letters (not statistically significant), but drop off after six letters, which could indicate participants exceeding their memory capacity. Our result in the theta and beta bands also did not support our hypothesis and we did not observe an increase in the theta and beta bands in our result for the maintenance phase. Finally, our result did not support our hypothesis for the probe phase either (an increase in frontal theta and parietal alpha).
In our direct comparison of the high- versus lower-load conditions, we observed that the upper and lower alpha was significantly different in all regions for the maintenance phase. We additionally observed differences in the centrotemporal and frontal electrodes for lower beta and in all regions for the theta band. This high–low comparison for the probe phase just continues in the centrotemporal upper alpha, although we did not observe any significance in centrotemporal upper beta in the maintenance phase, but we started to observe this significance in the probe phase.
In conclusion, (1) the LMM illustrates the measurement of CL for the maintenance phase with an increase in PSD in the alpha band in most all regions but did not continue in the probe phase; (2) we did not observe any significant increases in theta in any region for the maintenance or probe phase; (3) the high–low comparison illustrates significant theta and lower alpha in all regions in the maintenance phase, which did not continue in the probe phase, also the significant upper alpha in all regions in the maintenance phase, which this significant just continued for the centrotemporal region in the probe phase, as well as, the significant lower beta for the centrotemporal region in the maintenance phase turned to upper beta in the probe phase.
As our analysis focuses on both maintenance and probe periods, our findings can help to elucidate the effectiveness of physiological measurements of CL with evidence for additional probe phases. In contrast, most studies in regard to the measurement of CL with physiological cues are just focused on the maintenance phase.

7. Limitations

One of the biggest limitations of the current study is the number of sensor failures, disconnections, and loss of data, especially with the HR and eye tracker sensor. The problem with the eye tracker was mostly in a loss of detecting both eyes of the participants. The eye tracker was mounted on the monitor in front of the participant and had a fixed field of view to detect eyes. Thus, with small movements of the head, the eye tracker was not be able to find and track the eyes. Note that this limitation is solved in head-mounted VR displays with an integrated eye tracker.
As one of our future goals is to expand our results to measuring the CL in VR experiences, this will require future VR experiences to detect both fast and slow changes in CL and to be robust enough to let the learner move physically within VR as well. To expand these measurements of CL with physiological cues for VR studies, one of the limitations of our current research is that the physiological responses were measured during a short period and were stimulus-based. In contrast, VR studies are task-based and require a longer period to interact with the system. This is especially important for CL measurement with EEG signals.
The limitation of a long period for CL measurement is not well-aligned with some physiological measurements, such as HR metrics, which are slow and require a longer period to react to CL changes; EEG, which is fast and shows its reaction to CL changes in shorter periods; or PD, which starts to react to CL changes after 500 to 600 ms after stimulus onset and also requires 2.6 to 3 s of rest to return to normal (pupil) dilation (if it needs to be used for its baseline correction). It is also unclear if these findings can be generalized to more complex and longer-period tasks. Another challenge in expanding CL detection to VR learning applications is additional sources of noise such as physical movement that are always part of VR. The user’s physical movement could interfere with physiological signal measurements (especially in EEG, but also in other sensors as well). Future studies will need to investigate if these signals are robust enough to measure CL in the presence of movements and also investigate other VR effects in physiological signals.

8. Conclusions

We used the Sternberg memory-search task and designed four levels of CL, 4/5/6/7-letter words, to measure CL with multi-modal physiological measurements: SCR, PD, HR, and EEG frequency band power. The purpose of this study was to investigate the feasibility of measurements of CL using the Sternberg memory-search task with a multi-modal physiological measurement method to compare these correlation changes with CL in both maintenance and probe phases.
For this study, the CL of the task was related to the number of letters in non-semantic words. The PD and SCR are both shown as reliable metrics, with all participants showing an increase in pupil dilation under higher CL for both maintenance and probe phases and also a positive correlation of SC with an increase in CL.
EEG demonstrated promising metrics of CL showing a significant linear relationship with CL in the maintenance phase (positive linear relationship with CL with an increase in the alpha band). We also expected to observe an increase in frontal theta and temporal beta bands, but the result did not show any significant correlation of CL in those regions in the maintenance phase. Unfortunately, we did not observe any continuation of this linear relationship with CL in the probe phase and the result did not support our hypothesis for the probe phase (an increase in frontal theta and parietal alpha in the probe phase).
However, we observed the following major shift of PSD in three channel clusters in the high–low comparison: (1) we observed a significant increase in the theta band in all channel cluster regions, which disappeared in the probe phase; (2) we observed a significant increase in the lower alpha band in all channel cluster regions, which disappeared in the probe phase; (3) we observed a significant increase in the upper alpha band in all channel cluster regions, which just continued in the centrotemporal region in the probe phase; (4) we observed a significant increase in the lower beta band in the centrotemporal and frontal regions, which disappeared in the probe phase; (5) we observed a significant increase in the upper beta band in the centrotemporal region in the probe phase, which we did not observe in the maintenance phase; and, (6) surprisingly, we observe a significant correlation of the delta band in the occipitoparietal region in the probe phase.
Overall, the SC and PD show a slower reaction (few seconds delay) to changes in CL compared to EEG. Although the EEG signals react faster to these changes in CL, the complexity and sensitivity of this signal to other artifacts such as blinking or muscle movement are inevitable and expensive to process. This paper provides statistical evidence for individual physiological signals in support of measurement of CL with a multi-modal approach in both the maintenance and probe phases. This also demonstrated a comparison of the measurement of CL with physiological signals as the difficulty slightly increased with four levels of CL, as well as additional binary high–low difficulty level at different stage of user interaction with the system.

9. Future Work

VR is used increasingly in training applications [113], but very little research has focused on real-time adaptive training based on users’ CL state in VR using physiological metrics. As we aim to extend this study and investigate the measurement of CL using multi-modal techniques with several physiological cues in a VR environment, the first step is to investigate the feasibility and limitations of these measurements of CL while participants perform a series of short-sequence memory tasks requiring moderate movement. The question here is if these metrics are reliable for the measurement of CL with the presence of muscle movement.
In this study, we showed that pupil dilation, SCR, and EEG demonstrate a reliable relationship with CL. The second step of our research will be to demonstrate the CL measurement of learners through physiological cues in VR applications in real time and adapt the VR training system accordingly. This could be conducted through the use of ML classification to investigate how accurately we can detect human CL changes while learners interact with the VR environment.

Author Contributions

Conceptualization, M.A.; Formal analysis, M.A., S.W.M. and M.A.N.; Methodology, M.A.; Software, M.A.N.; Supervision, B.C.W. and M.B.; Writing—original draft, M.A.; writing—review and editing, S.W.M., B.C.W. and M.B. All authors have read and agreed to the published version of the manuscript.

Funding

This research received no external funding.

Institutional Review Board Statement

The study was conducted in accordance with the Declaration of Helsinki, and approved by the University of Auckland Human Participants Ethics Committee (protocol code UAHPEC22022, 30 April 2021).

Informed Consent Statement

Informed consent was obtained from all subjects involved in the study.

Data Availability Statement

All the data is containted within the article.

Conflicts of Interest

The authors declare no conflicts of interest. The funders had no role in the design of the study; in the collection, analyses, or interpretation of data; in the writing of the manuscript, or in the decision to publish the results.

References

  1. Pavlov, Y.G.; Kotchoubey, B. Oscillatory brain activity and maintenance of verbal and visual working memory: A systematic review. Psychophysiology 2022, 59, e13735. [Google Scholar] [CrossRef] [PubMed]
  2. Jerčić, P.; Sennersten, C.; Lindley, C. Modeling cognitive load and physiological arousal through pupil diameter and heart rate. Multimed. Tools Appl. 2020, 79, 3145–3159. [Google Scholar] [CrossRef]
  3. Setz, C.; Arnrich, B.; Schumm, J.; La Marca, R.; Tröster, G.; Ehlert, U. Discriminating stress from cognitive load using a wearable EDA device. IEEE Trans. Inf. Technol. Biomed. 2009, 14, 410–417. [Google Scholar] [CrossRef] [PubMed]
  4. Nourbakhsh, N.; Wang, Y.; Chen, F. GSR and blink features for cognitive load classification. In Proceedings of the IFIP Conference on Human-Computer Interaction, Cape Town, South Africa, 2–6 September 2013; Springer: Berlin/Heidelberg, Germany, 2013; pp. 159–166. [Google Scholar]
  5. Ikehara, C.S.; Crosby, M.E. Assessing cognitive load with physiological sensors. In Proceedings of the 38th Annual Hawaii International Conference on System Sciences, Big Island, HI, USA, 3–6 January 2005; IEEE: Piscataway, NJ, USA, 2005; p. 295a. [Google Scholar]
  6. Makransky, G.; Terkildsen, T.S.; Mayer, R.E. Role of subjective and objective measures of cognitive processing during learning in explaining the spatial contiguity effect. Learn. Instr. 2019, 61, 23–34. [Google Scholar] [CrossRef]
  7. Sridhar, P.K.; Chan, S.W.; Nanayakkara, S. Going beyond performance scores: Understanding cognitive-affective states in kindergarteners. In Proceedings of the 17th ACM Conference on Interaction Design and Children, Trondheim, Norway, 19–22 June 2018; pp. 253–265. [Google Scholar]
  8. Dissanayake, T.; Rajapaksha, Y.; Ragel, R.; Nawinne, I. An ensemble learning approach for electrocardiogram sensor based human emotion recognition. Sensors 2019, 19, 4495. [Google Scholar] [CrossRef] [PubMed]
  9. Haag, A.; Goronzy, S.; Schaich, P.; Williams, J. Emotion recognition using bio-sensors: First steps towards an automatic system. In Tutorial and Research Workshop on Affective Dialogue Systems; Springer: Berlin/Heidelberg, Germany, 2004; pp. 36–48. [Google Scholar]
  10. Sharma, R.; Pavlović, V.I.; Huang, T.S. Toward multimodal human–computer interface. In Advances in Image Processing and Understanding: A Festschrift for Thomas S Huang; World Scientific: Singapore, 2002; pp. 349–365. [Google Scholar]
  11. Blikstein, P.; Worsley, M. Multimodal learning analytics and education data mining: Using computational technologies to measure complex learning tasks. J. Learn. Anal. 2016, 3, 220–238. [Google Scholar] [CrossRef]
  12. Sternberg, S. High-speed scanning in human memory. Science 1966, 153, 652–654. [Google Scholar] [CrossRef] [PubMed]
  13. Sternberg, S. Retrieval of contextual information from memory. Psychon. Sci. 1967, 8, 55–56. [Google Scholar] [CrossRef]
  14. Sweller, J.; Chandler, P. Evidence for cognitive load theory. Cogn. Instr. 1991, 8, 351–362. [Google Scholar] [CrossRef]
  15. Sweller, J. Cognitive load theory. In Psychology of Learning and Motivation; Elsevier: Amsterdam, The Netherlands, 2011; Volume 55, pp. 37–76. [Google Scholar]
  16. Chen, S.; Epps, J.; Chen, F. A comparison of four methods for cognitive load measurement. In Proceedings of the 23rd Australian Computer-Human Interaction Conference, Canberra, Australia, 28 November–2 December 2011; pp. 76–79. [Google Scholar]
  17. Miller, G.A. The magical number seven, plus or minus two: Some limits on our capacity for processing information. Psychol. Rev. 1956, 63, 81. [Google Scholar] [CrossRef]
  18. Yerkes, R.M.; Dodson, J.D. The relation of strength of stimulus to rapidity of habit-formation. In Punishment: Issues and Experiments; Ardent Media: Wilkes-Barre, PA, USA, 1908; pp. 27–41. [Google Scholar]
  19. Baddeley, A.D.; Hitch, G. Working memory. In Psychology of Learning and Motivation; Elsevier: Amsterdam, The Netherlands, 1974; Volume 8, pp. 47–89. [Google Scholar]
  20. Paas, F.; Tuovinen, J.E.; Tabbers, H.; Van Gerven, P.W. Cognitive load measurement as a means to advance cognitive load theory. Educ. Psychol. 2003, 38, 63–71. [Google Scholar] [CrossRef]
  21. Cowan, N. The magical mystery four: How is working memory capacity limited, and why? Curr. Dir. Psychol. Sci. 2010, 19, 51–57. [Google Scholar] [CrossRef] [PubMed]
  22. Engle, R.W.; Kane, M.J. Executive attention, working memory capacity, and a two-factor theory of cognitive control. In Psychology of Learning and Motivation; Elsevier: Amsterdam, The Netherlands, 2004. [Google Scholar]
  23. Oberauer, K.; Süß, H.M.; Wilhelm, O.; Sander, N. Individual differences in working memory capacity and reasoning ability. In Variation in Working Memory; Oxford University Press: Oxford, UK, 2007. [Google Scholar]
  24. Young, J.Q.; Van Merrienboer, J.; Durning, S.; Ten Cate, O. Cognitive load theory: Implications for medical education: AMEE Guide No. 86. Med. Teach. 2014, 36, 371–384. [Google Scholar] [CrossRef] [PubMed]
  25. Iskander, M. Burnout, cognitive overload, and metacognition in medicine. Med. Sci. Educ. 2019, 29, 325–328. [Google Scholar] [CrossRef] [PubMed]
  26. Sweller, J. Cognitive load theory, learning difficulty, and instructional design. Learn. Instr. 1994, 4, 295–312. [Google Scholar] [CrossRef]
  27. Ayres, P. Impact of reducing intrinsic cognitive load on learning in a mathematical domain. Appl. Cogn. Psychol. Off. J. Soc. Appl. Res. Mem. Cogn. 2006, 20, 287–298. [Google Scholar] [CrossRef]
  28. McKendrick, R.; Feest, B.; Harwood, A.; Falcone, B. Theories and methods for labeling cognitive workload: Classification and transfer learning. Front. Hum. Neurosci. 2019, 13, 295. [Google Scholar] [CrossRef] [PubMed]
  29. Fridman, L.; Reimer, B.; Mehler, B.; Freeman, W.T. Cognitive load estimation in the wild. In Proceedings of the 2018 Chi Conference on Human Factors in Computing Systems, Montreal, Canada, 21–26 April 2018; pp. 1–9. [Google Scholar]
  30. Biswas, P.; Prabhakar, G. Detecting drivers’ cognitive load from saccadic intrusion. Transp. Res. Part F Traffic Psychol. Behav. 2018, 54, 63–78. [Google Scholar] [CrossRef]
  31. Madore, K.P.; Khazenzon, A.M.; Backes, C.W.; Jiang, J.; Uncapher, M.R.; Norcia, A.M.; Wagner, A.D. Memory failure predicted by attention lapsing and media multitasking. Nature 2020, 587, 87–91. [Google Scholar] [CrossRef]
  32. Romine, W.L.; Schroeder, N.L.; Graft, J.; Yang, F.; Sadeghi, R.; Zabihimayvan, M.; Kadariya, D.; Banerjee, T. Using Machine Learning to Train a Wearable Device for Measuring Students’ Cognitive Load during Problem-Solving Activities Based on Electrodermal Activity, Body Temperature, and Heart Rate: Development of a Cognitive Load Tracker for Both Personal and Classroom Use. Sensors 2020, 20, 4833. [Google Scholar] [CrossRef]
  33. Haapalainen, E.; Kim, S.; Forlizzi, J.F.; Dey, A.K. Psycho-physiological measures for assessing cognitive load. In Proceedings of the 12th ACM International Conference on Ubiquitous Computing, Copenhagen, Denmark, 26–29 September 2010; pp. 301–310. [Google Scholar]
  34. Ferreira, E.; Ferreira, D.; Kim, S.; Siirtola, P.; Röning, J.; Forlizzi, J.F.; Dey, A.K. Assessing real-time cognitive load based on psycho-physiological measures for younger and older adults. In Proceedings of the 2014 IEEE Symposium on Computational Intelligence, Cognitive Algorithms, Mind, and Brain (CCMB), Orlando, FL, USA, 9–12 December 2014; IEEE: Piscataway, NJ, USA, 2014; pp. 39–48. [Google Scholar]
  35. Hughes, A.M.; Hancock, G.M.; Marlow, S.L.; Stowers, K.; Salas, E. Cardiac measures of cognitive workload: A meta-analysis. Hum. Factors 2019, 61, 393–414. [Google Scholar] [CrossRef]
  36. Dias, R.D.; Zenati, M.A.; Stevens, R.; Gabany, J.M.; Yule, S.J. Physiological synchronization and entropy as measures of team cognitive load. J. Biomed. Inform. 2019, 96, 103250. [Google Scholar] [CrossRef]
  37. Solhjoo, S.; Haigney, M.C.; McBee, E.; van Merrienboer, J.J.; Schuwirth, L.; Artino, A.R., Jr.; Battista, A.; Ratcliffe, T.A.; Lee, H.D.; Durning, S.J. Heart rate and heart rate variability correlate with clinical reasoning performance and self-reported measures of cognitive load. Sci. Rep. 2019, 9, 14668. [Google Scholar] [CrossRef]
  38. Healey, J.A.; Picard, R.W. Detecting stress during real-world driving tasks using physiological sensors. IEEE Trans. Intell. Transp. Syst. 2005, 6, 156–166. [Google Scholar] [CrossRef]
  39. Charleton, S.; O’Brien, T. Measurement of cognitive states in testing and evaluation. In Handbook of Human Factors and Evaluation; Routlege: London, UK, 2002; pp. 97–126. [Google Scholar]
  40. Ayres, P.; Sweller, J. Locus of difficulty in multistage mathematics problems. Am. J. Psychol. 1990, 103, 167–193. [Google Scholar] [CrossRef]
  41. Chandler, P.; Sweller, J. The split-attention effect as a factor in the design of instruction. Br. J. Educ. Psychol. 1992, 62, 233–246. [Google Scholar] [CrossRef]
  42. Chandler, P.; Sweller, J. Cognitive load theory and the format of instruction. Cogn. Instr. 1991, 8, 293–332. [Google Scholar] [CrossRef]
  43. Sweller, J.; Ayres, P.; Kalyuga, S. Measuring cognitive load. In Cognitive Load Theory; Springer: Berlin/Heidelberg, Germany, 2011; pp. 71–85. [Google Scholar]
  44. Hart, S.G.; Staveland, L.E. Development of NASA-TLX (Task Load Index): Results of empirical and theoretical research. In Advances in Psychology; Elsevier: Amsterdam, The Netherlands, 1988; Volume 52, pp. 139–183. [Google Scholar]
  45. Van Gog, T.; Paas, F.; Savenye, W.; Robinson, R.; Niemczyk, M.; Atkinson, R.; Johnson, T.E.; O’connor, D.L.; Rikers, R.M.; Ayres, P.; et al. Data collection and analysis. In Handbook of Research on Educational Communications and Technology 3e; Routledge: London, UK, 2008; pp. 763–806. [Google Scholar]
  46. Antonenko, P.; Paas, F.; Grabner, R.; Van Gog, T. Using electroencephalography to measure cognitive load. Educ. Psychol. Rev. 2010, 22, 425–438. [Google Scholar] [CrossRef]
  47. Shaffer, F.; Ginsberg, J.P. An overview of heart rate variability metrics and norms. Front. Public Health 2017, 5, 290215. [Google Scholar] [CrossRef]
  48. Brown, T.G.; Szabo, A.; Seraganian, P. Physical versus psychological determinants of heart rate reactivity to mental arithmetic. Psychophysiology 1988, 25, 532–537. [Google Scholar] [CrossRef]
  49. Linden, W. What do arithmetic stress tests measure? Protocol variations and cardiovascular responses. Psychophysiology 1991, 28, 91–102. [Google Scholar] [CrossRef] [PubMed]
  50. Ushiyama, K.; Ogawa, T.; Ishii, M.; Ajisaka, R.; Sugishita, Y.; Ito, I. Physiologic neuroendocrine arousal by mental arithmetic stress test in healthy subjects. Am. J. Cardiol. 1991, 67, 101–103. [Google Scholar] [CrossRef] [PubMed]
  51. Boutcher, Y.N.; Boutcher, S.H. Cardiovascular response to Stroop: Effect of verbal response and task difficulty. Biol. Psychol. 2006, 73, 235–241. [Google Scholar] [CrossRef] [PubMed]
  52. Ayata, D.; Yaslan, Y.; Kamaşak, M. Emotion recognition via galvanic skin response: Comparison of machine learning algorithms and feature extraction methods. IU-J. Electr. Electron. Eng. 2017, 17, 3147–3156. [Google Scholar]
  53. Critchley, H.D. Electrodermal responses: What happens in the brain. Neuroscientist 2002, 8, 132–142. [Google Scholar] [CrossRef] [PubMed]
  54. Lidberg, L.; Wallin, B.G. Sympathetic skin nerve discharges in relation to amplitude of skin resistance responses. Psychophysiology 1981, 18, 268–270. [Google Scholar] [CrossRef] [PubMed]
  55. Lang, P.J.; Greenwald, M.K.; Bradley, M.M.; Hamm, A.O. Looking at pictures: Affective, facial, visceral, and behavioral reactions. Psychophysiology 1993, 30, 261–273. [Google Scholar] [CrossRef] [PubMed]
  56. Boucsein, W. Electrodermal Activity; Springer: Berlin/Heidelberg, Germany, 2012. [Google Scholar]
  57. McEwen, B.S.; Sapolsky, R.M. Stress and cognitive function. Curr. Opin. Neurobiol. 1995, 5, 205–216. [Google Scholar] [CrossRef]
  58. Miller, L.H.; Shmavonian, B.M. Replicability of two GSR indices as a function of stress and cognitive activity. J. Personal. Soc. Psychol. 1965, 2, 753. [Google Scholar] [CrossRef]
  59. Shi, Y.; Ruiz, N.; Taib, R.; Choi, E.; Chen, F. Galvanic skin response (GSR) as an index of cognitive load. In Proceedings of the CHI’07 Extended Abstracts on Human Factors in Computing Systems, San Jose, CA, USA, 28 April–3 May 2007; pp. 2651–2656. [Google Scholar]
  60. Gavas, R.; Das, R.; Das, P.; Chatterjee, D.; Sinha, A. Inactive-state recognition from EEG signals and its application in cognitive load computation. In Proceedings of the 2016 IEEE International Conference on Systems, Man, and Cybernetics (SMC), Budapest, Hungary, 9–12 October 2016; IEEE: Piscataway, NJ, USA, 2016; pp. 3606–3611. [Google Scholar]
  61. Gupta, K.; Hajika, R.; Pai, Y.S.; Duenser, A.; Lochner, M.; Billinghurst, M. In ai we trust: Investigating the relationship between biosignals, trust and cognitive load in vr. In Proceedings of the 25th ACM Symposium on Virtual Reality Software and Technology, Parramatta, NSW, Australia, 12–15 November 2019; pp. 1–10. [Google Scholar]
  62. Johannessen, E.; Szulewski, A.; Radulovic, N.; White, M.; Braund, H.; Howes, D.; Rodenburg, D.; Davies, C. Psychophysiologic measures of cognitive load in physician team leaders during trauma resuscitation. Comput. Hum. Behav. 2020, 111, 106393. [Google Scholar] [CrossRef]
  63. Van Gerven, P.W.; Paas, F.; Van Merriënboer, J.J.; Schmidt, H.G. Memory load and the cognitive pupillary response in aging. Psychophysiology 2004, 41, 167–174. [Google Scholar] [CrossRef] [PubMed]
  64. Hess, E.H.; Polt, J.M. Pupil size in relation to mental activity during simple problem-solving. Science 1964, 143, 1190–1192. [Google Scholar] [CrossRef] [PubMed]
  65. Kahneman, D.; Beatty, J. Pupil diameter and load on memory. Science 1966, 154, 1583–1585. [Google Scholar] [CrossRef] [PubMed]
  66. Beatty, J.; Lucero-Wagoner, B. The pupillary system. In Handbook of Psychophysiology; Cambridge University Press: Cambridge, UK, 2000; Volume 2. [Google Scholar]
  67. Peavler, W.S. Pupil size, information overload, and performance differences. Psychophysiology 1974, 11, 559–566. [Google Scholar] [CrossRef] [PubMed]
  68. Chikhi, S.; Matton, N.; Blanchet, S. EEG power spectral measures of cognitive workload: A meta-analysis. Psychophysiology 2022, 59, e14009. [Google Scholar] [CrossRef] [PubMed]
  69. Klimesch, W. EEG alpha and theta oscillations reflect cognitive and memory performance: A review and analysis. Brain Res. Rev. 1999, 29, 169–195. [Google Scholar] [CrossRef] [PubMed]
  70. Huang, R.S.; Jung, T.P.; Makeig, S. Tonic changes in EEG power spectra during simulated driving. In Proceedings of the International Conference on Foundations of Augmented Cognition, San Diego, CA, USA, 19–24 July 2009; Springer: Berlin/Heidelberg, Germany, 2009; pp. 394–403. [Google Scholar]
  71. Gevins, A.; Smith, M.E.; Leong, H.; McEvoy, L.; Whitfield, S.; Du, R.; Rush, G. Monitoring working memory load during computer-based tasks with EEG pattern recognition methods. Hum. Factors 1998, 40, 79–91. [Google Scholar] [CrossRef] [PubMed]
  72. Fink, A.; Grabner, R.; Neuper, C.; Neubauer, A. EEG alpha band dissociation with increasing task demands. Cogn. Brain Res. 2005, 24, 252–259. [Google Scholar] [CrossRef] [PubMed]
  73. Brouwer, A.M.; Hogervorst, M.A.; Van Erp, J.B.; Heffelaar, T.; Zimmerman, P.H.; Oostenveld, R. Estimating workload using EEG spectral power and ERPs in the n-back task. J. Neural Eng. 2012, 9, 045008. [Google Scholar] [CrossRef]
  74. Gärtner, M.; Grimm, S.; Bajbouj, M. Frontal midline theta oscillations during mental arithmetic: Effects of stress. Front. Behav. Neurosci. 2015, 9, 133588. [Google Scholar] [CrossRef]
  75. Roux, F.; Uhlhaas, P.J. Working memory and neural oscillations: Alpha–gamma versus theta–gamma codes for distinct WM information? Trends Cogn. Sci. 2014, 18, 16–25. [Google Scholar] [CrossRef] [PubMed]
  76. Deiber, M.P.; Missonnier, P.; Bertrand, O.; Gold, G.; Fazio-Costa, L.; Ibanez, V.; Giannakopoulos, P. Distinction between perceptual and attentional processing in working memory tasks: A study of phase-locked and induced oscillatory brain dynamics. J. Cogn. Neurosci. 2007, 19, 158–172. [Google Scholar] [CrossRef] [PubMed]
  77. Jensen, O.; Tesche, C.D. Frontal theta activity in humans increases with memory load in a working memory task. Eur. J. Neurosci. 2002, 15, 1395–1399. [Google Scholar] [CrossRef] [PubMed]
  78. Onton, J.; Delorme, A.; Makeig, S. Frontal midline EEG dynamics during working memory. Neuroimage 2005, 27, 341–356. [Google Scholar] [CrossRef] [PubMed]
  79. Harmony, T.; Fernández, T.; Silva, J.; Bernal, J.; Díaz-Comas, L.; Reyes, A.; Marosi, E.; Rodríguez, M.; Rodríguez, M. EEG delta activity: An indicator of attention to internal processing during performance of mental tasks. Int. J. Psychophysiol. 1996, 24, 161–171. [Google Scholar] [CrossRef] [PubMed]
  80. Petsche, H.; Pockberger, H.; Rappelsberger, P. EEG topography and mental performance. In Topographic Mapping of Brain Electrical Activity; Elsevier: Amsterdam, The Netherlands, 1986; pp. 63–98. [Google Scholar]
  81. Itthipuripat, S.; Wessel, J.R.; Aron, A.R. Frontal theta is a signature of successful working memory manipulation. Exp. Brain Res. 2013, 224, 255–262. [Google Scholar] [CrossRef] [PubMed]
  82. Brzezicka, A.; Kamiński, J.; Reed, C.M.; Chung, J.M.; Mamelak, A.N.; Rutishauser, U. Working memory load-related theta power decreases in dorsolateral prefrontal cortex predict individual differences in performance. J. Cogn. Neurosci. 2019, 31, 1290–1307. [Google Scholar] [CrossRef] [PubMed]
  83. Lang, W.; Lang, M.; Kornhuber, A.; Diekmann, V.; Kornhuber, H. Event-related EEG-spectra in a concept formation task. Hum. Neurobiol. 1988, 6, 295–301. [Google Scholar] [PubMed]
  84. Klimesch, W. Alpha-band oscillations, attention, and controlled access to stored information. Trends Cogn. Sci. 2012, 16, 606–617. [Google Scholar] [CrossRef]
  85. Michels, L.; Bucher, K.; Lüchinger, R.; Klaver, P.; Martin, E.; Jeanmonod, D.; Brandeis, D. Simultaneous EEG-fMRI during a working memory task: Modulations in low and high frequency bands. PLoS ONE 2010, 5, e10298. [Google Scholar] [CrossRef]
  86. Palva, S.; Palva, J.M. New vistas for α-frequency band oscillations. Trends Neurosci. 2007, 30, 150–158. [Google Scholar] [CrossRef] [PubMed]
  87. Chen, Y.; Huang, X. Modulation of alpha and beta oscillations during an n-back task with varying temporal memory load. Front. Psychol. 2016, 6, 2031. [Google Scholar] [CrossRef] [PubMed]
  88. Kornblith, S.; Buschman, T.J.; Miller, E.K. Stimulus load and oscillatory activity in higher cortex. Cereb. Cortex 2016, 26, 3772–3784. [Google Scholar] [CrossRef] [PubMed]
  89. Proskovec, A.L.; Heinrichs-Graham, E.; Wilson, T.W. Load modulates the alpha and beta oscillatory dynamics serving verbal working memory. NeuroImage 2019, 184, 256–265. [Google Scholar] [CrossRef] [PubMed]
  90. Ahmadi, M.; Michalka, S.W.; Lenzoni, S.; Ahmadi Najafabadi, M.; Bai, H.; Sumich, A.; Wuensche, B.; Billinghurst, M. Cognitive Load Measurement with Physiological Sensors in Virtual Reality during Physical Activity. In Proceedings of the 29th ACM Symposium on Virtual Reality Software and Technology, Christchurch, New Zealand, 9–11 October 2023; pp. 1–11. [Google Scholar]
  91. Ahmadi, M.; Bai, H.; Chatburn, A.; Najatabadi, M.A.; Wünsche, B.C.; Billinghurst, M. Comparison of Physiological Cues for Cognitive Load Measures in VR. In Proceedings of the 2023 IEEE Conference on Virtual Reality and 3D User Interfaces Abstracts and Workshops (VRW), Shanghai, China, 25–29 March 2023; IEEE: Piscataway, NJ, USA, 2023; pp. 837–838. [Google Scholar]
  92. Ahmadi, M.; Bai, H.; Chatburn, A.; Wuensche, B.; Billinghurst, M. PlayMeBack-Cognitive Load Measurement using Different Physiological Cues in a VR Game. In Proceedings of the 28th ACM Symposium on Virtual Reality Software and Technology, Tsukuba, Japan, 29 November–1 December 2022; pp. 1–2. [Google Scholar]
  93. Ahmadi, M.; Farrokhi Nia, A.; Michalka, S.W.; Sumich, A.L.; Wuensche, B.; Billinghurst, M. Comparing Performance of Dry and Gel EEG Electrodes in VR using MI Paradigms. In Proceedings of the 29th ACM Symposium on Virtual Reality Software and Technology, Christchurch, New Zealand, 9–11 October 2023; pp. 1–2. [Google Scholar]
  94. Gjoreski, M.; Kolenik, T.; Knez, T.; Luštrek, M.; Gams, M.; Gjoreski, H.; Pejović, V. Datasets for cognitive load inference using wearable sensors and psychological traits. Appl. Sci. 2020, 10, 3843. [Google Scholar] [CrossRef]
  95. Ahmed, M.U.; Begum, S.; Gestlöf, R.; Rahman, H.; Sörman, J. Machine Learning for Cognitive Load Classification–A Case Study on Contact-Free Approach. In Proceedings of the Artificial Intelligence Applications and Innovations: 16th IFIP WG 12.5 International Conference, AIAI 2020, Neos Marmaras, Greece, 5–7 June 2020; Springer: Berlin/Heidelberg, Germany, 2020; pp. 31–42. [Google Scholar]
  96. Pettersson, K.; Tervonen, J.; Närväinen, J.; Henttonen, P.; Määttänen, I.; Mäntyjärvi, J. Selecting feature sets and comparing classification methods for cognitive state estimation. In Proceedings of the 2020 IEEE 20th International Conference on Bioinformatics and Bioengineering (BIBE), Cincinnati, OH, USA, 26–28 October 2020; IEEE: Piscataway, NJ, USA, 2020; pp. 683–690. [Google Scholar]
  97. Stuyven, E.; Van der Goten, K.; Vandierendonck, A.; Claeys, K.; Crevits, L. The effect of cognitive load on saccadic eye movements. Acta Psychol. 2000, 104, 69–85. [Google Scholar] [CrossRef] [PubMed]
  98. Zagermann, J.; Pfeil, U.; Reiterer, H. Measuring cognitive load using eye tracking technology in visual computing. In Proceedings of the 6th Workshop on Beyond Time and Errors on Novel Evaluation Methods for Visualization, Baltimore, MD, USA, 24 October 2016; pp. 78–85. [Google Scholar]
  99. Ranti, C.; Jones, W.; Klin, A.; Shultz, S. Blink rate patterns provide a reliable measure of individual engagement with scene content. Sci. Rep. 2020, 10, 8267. [Google Scholar] [CrossRef] [PubMed]
  100. Fehringer, B.C. One threshold to rule them all? Modification of the Index of Pupillary Activity to optimize the indication of cognitive load. In Proceedings of the ACM Symposium on Eye Tracking Research and Applications, Stuttgart, Germany, 2–5 June 2020; pp. 1–5. [Google Scholar]
  101. Duchowski, A.T.; Krejtz, K.; Krejtz, I.; Biele, C.; Niedzielska, A.; Kiefer, P.; Raubal, M.; Giannopoulos, I. The index of pupillary activity: Measuring cognitive load vis-à-vis task difficulty with pupil oscillation. In Proceedings of the 2018 CHI Conference on Human Factors in Computing Systems, Montreal, QC, Canada, 21–26 April 2018; pp. 1–13. [Google Scholar]
  102. Zhang, L.; Wade, J.; Bian, D.; Fan, J.; Swanson, A.; Weitlauf, A.; Warren, Z.; Sarkar, N. Cognitive load measurement in a virtual reality-based driving system for autism intervention. IEEE Trans. Affect. Comput. 2017, 8, 176–189. [Google Scholar] [CrossRef] [PubMed]
  103. Jimenez-Molina, A.; Retamal, C.; Lira, H. Using psychophysiological sensors to assess mental workload during web browsing. Sensors 2018, 18, 458. [Google Scholar] [CrossRef]
  104. Siegel, E.; Wei, J.; Gomes, A.; Oliviera, M.; Sundaramoorthy, P.; Smathers, K.; Vankipuram, M.; Ghosh, S.; Horii, H.; Bailenson, J.; et al. HP Omnicept Cognitive Load Database (HPO-CLD)—Developing a Multimodal Inference Engine for Detecting Real-Time Mental Workload in VR; Technical Report; HP Labs: Palo Alto, CA, USA, 2021. [Google Scholar]
  105. Enobio®. Enobio® EEG Systems. Available online: https://neuroelectrics.com/solutions/enobio (accessed on 2 June 2022).
  106. Shimmer. Available online: https://shimmersensing.com/ (accessed on 2 June 2022).
  107. iMotion. Available online: https://imotions.com/platform/ (accessed on 2 June 2022).
  108. iMotion. Eye Tracker. Available online: https://imotions.com/biosensor/eye-tracking-screen-based/ (accessed on 2 June 2022).
  109. Delorme, A.; Makeig, S. EEGLAB: An open source toolbox for analysis of single-trial EEG dynamics including independent component analysis. J. Neurosci. Methods 2004, 134, 9–21. [Google Scholar] [CrossRef]
  110. Cowan, N. The magical number 4 in short-term memory: A reconsideration of mental storage capacity. Behav. Brain Sci. 2001, 24, 87–114. [Google Scholar] [CrossRef] [PubMed]
  111. Lakens, D. Calculating and reporting effect sizes to facilitate cumulative science: A practical primer for t-tests and ANOVAs. Front. Psychol. 2013, 4, 863. [Google Scholar] [CrossRef] [PubMed]
  112. Jensen, O.; Gelfand, J.; Kounios, J.; Lisman, J.E. Oscillations in the alpha band (9–12 Hz) increase with memory load during retention in a short-term memory task. Cereb. Cortex 2002, 12, 877–882. [Google Scholar] [CrossRef]
  113. Kavanagh, S.; Luxton-Reilly, A.; Wünsche, B.C.; Plimmer, B. A systematic review of Virtual Reality in education. Themes Sci. Technol. Educ. 2017, 10, 85–119. [Google Scholar] [CrossRef]
Figure 1. A study participant wearing a Shimmer sensor on the wrist to capture GSR and HR data and an EEG Enobio 20 gel cap. The eye tracker (Tobii Pro X3-120) was mounted on the display to capture subject PD data (physiological sensors) and the iMotion GUI displays the stimuli on a monitor. (A) The encoding phase; (B) the response phase.
Mti 08 00034 g001
Figure 2. (A) Schematic depiction of the Sternberg memory-search task (for the 4-letter word UTFK); (B) diagram of the experimental design.
Mti 08 00034 g002
Figure 3. Behavioral performance: average percent correct versus CL (bold black lines represent mean, error bars show 95% confidence intervals, and dashed lines show individual participants).
Mti 08 00034 g003
Figure 4. Average baseline-corrected pupil dilation (maintenance phase) in each CL level (the dashed lines show individual participants; the bold black lines represent means; the error bars show 95% confidence intervals).
Mti 08 00034 g004
Figure 5. (A) GSR data—maintenance phase: the CL versus average baseline-corrected SC; (B) HR data—maintenance phase: the CL versus average baseline-corrected HR (the dashed lines show individual participants; the bold black lines represent means; the error bars show 95% confidence intervals).
Mti 08 00034 g005
Figure 6. The CL versus log power spectral density (maintenance phase) for 6 frequency bands (region: blue = centrotemporal, red = frontal, yellow = occipitoparietal (color-coded lines)). Solid lines = significant effect of CL in the LMM; dotted lines = not significant.
Mti 08 00034 g006
Figure 7. Average baseline-corrected pupil dilation (probe phase) at each CL level (the dashed lines show individual participants; the bold black lines represent means; the error bars show 95% confidence intervals).
Mti 08 00034 g007
Figure 8. (A) GSR data—probe phase: the CL versus average baseline-corrected SC; (B) HR data—probe phase: the CL versus average baseline-corrected HR (the dashed lines show individual participants; the bold black lines represent means; the error bars show 95% confidence intervals).
Mti 08 00034 g008
Figure 9. The CL versus log power spectral density (probe phase) for 6 frequency bands (regions: blue = centrotemporal, red = frontal, yellow = occipitoparietal (color-coded lines)). Solid lines = significant effect of CL in the LMM; dotted lines = not significant.
Mti 08 00034 g009
Table 1. Physiological cues’ (maintenance phase) mean and standard deviation.
Physiological CueCombination Letter
4567
BehavioralMean97.3694.8690.2479.41
Std.2.314.777.8179.4
SCRMean−0.05−0.040.020.03
Std.0.050.110.050.08
Eye LeftMean-0.24-0.100.060.11
Std.0.330.190.150.24
Eye RightMean−0.13−0.080.170.24
Std.0.390.210.330.22
HRMean1.40.19−0.06−0.3
Std.2.271.042.132.17
Table 2. Physiological cues’ (maintenance phase) statistical result (LMM).
MeasurementBehavioralSCRPDHR
Estimate−0.0190.030.16-0.52
SE0.0080.0130.030.35
t Stat−2.522.575.16−1.5
df58388546
p-value0.0140.014 1.55 × 10 6 0.14
CL std0.020.020.0840.96
AIC−139−64.68.61207
Model R 2 0.610.120.590.31
Table 3. Linear mixed model (LMM)—EEG statistical results in the maintenance phase. CT = centrotemporal, F = frontal, OP = occipitoparietal, L-A = lower alpha, U-A = upper alpha, L-B = lower beta, U-B = upper beta. Top bar abbreviations: ES = estimate, SE = standard error, p = p-value, C-p = corrected, RF = random effect standard deviation, AIC = Akaike information criterion. R 2 is for the whole model.
EsSEtStatpC-pRFAIC R 2
Delta
CT0.370.060.560.571.000.1643420.45
F−0.030.06−0.530.61.000.1642520.38
OP−0.050.07−0.690.491.000.1545430.4
Theta
CT0.080.061.280.21.000.238820.77
F0.090.061.380.171.000.1938920.7
OP0.160.072.470.0140.160.239700.69
L-A
CT0.210.073.090.0020.260.1545870.82
F0.210.063.430.00060.00880.145820.81
OP0.220.063.60.00030.00490.1145540.8
U-A
CT0.360.093.98 7.2 × 10 5 0.00120.2646510.73
F0.370.093.97 7.7 × 10 5 0.00120.2946560.74
OP0.370.094.24 2.4 × 10 5 0.00040.2546560.72
L-B
CT0.060.061.020.31.000.1933900.82
F0.080.051.590.111.000.1532630.83
OP−0.0060.07−0.090.921.000.2333070.8
U-B
CT−0.0080.06−0.140.891.000.1930790.8
F0.030.050.560.571.000.1530010.8
OP−0.070.09−0.750.451.000.3231890.79
Table 4. Repeated-measures ANOVA (post hoc Tukey–Kramer method)—EEG statistical results in the maintenance phase. CT = centrotemporal, F = frontal, OP = occipitoparietal. Top bar abbreviations: Reg = region, H-L = high minus low load, SE = standard error, p = p-value, L and U = lower and upper (95%CI), ES = effect size (Hedges’ g).
BandRegH−LSEpLUES
deltaCT−1.35.460.814−13.0010.40−0.037
F−3.76.480.577−17.5910.19−0.12
OP−6.865.600.269−19.645.92−0.18
thetaCT8.353.320.0241.2215.470.16
F7.833.200.0280.9714.690.18
OP10.773.430.0073.4118.130.24
lower
Alpha
CT22.434.980.0004911.7533.120.27
F21.364.330.0002212.0630.660.27
OP22.294.200.0001113.2931.290.30
upper
Alpha
CT27.645.510.0001915.8139.480.42
F27.774.84 5.1 × 10 5 17.3938.160.41
OP27.474.76 4.8 × 10 5 17.2737.680.43
lower
Beta
CT13.986.400.0460.2627.700.31
F15.076.050.0262.0828.060.33
OP10.256.490.136−3.6624.170.26
upper
Beta
CT11.758.620.194−6.7330.240.25
F13.528.090.116−3.8330.890.30
OP8.828.190.300−8.7526.40.20
Table 5. Physiological cues’ (probe phase) mean and standard deviation.
Physiological CueCombination Letter
4567
SCRMean−0.05−0.040.020.03
Std.0.060.110.0570.086
Eye LeftMean−0.38−0.12−0.020.09
Std.0.210.270.230.22
Eye RightMean−0.36−0.140.090.23
Std.0.20.240.330.31
HRMean2.041.71.751.57
Std.1.861.741.671.72
Table 6. Physiological cues’ (probe phase) statistical result (LMM).
MeasurementSCRPDHR
Estimate0.0340.17−0.13
SE0.0130.030.22
tStat2.556.0−0.6
df388546
p-value0.014 4.05 × 10 8 0.55
CL std0.020.080.56
AIC−63.410.7191.25
Model R 2 0.220.690.5
Table 7. Linear mixed model (LMM)—EEG statistical results in probe phase. CT = centrotemporal, F = frontal, OP = occipitoparietal, L-A = lower alpha, U-A = upper alpha, L-B = lower beta, U-B = upper beta. Top bar abbreviations: ES = estimate, SE = standard error, p = p-value, C-p = corrected, RF = random effect standard deviation, AIC = Akaike information criterion. R 2 is for the whole model.
EsSEtStatpC-pRFAIC R 2
Delta
CT−0.090.07−1.250.201.000.244530.42
F−0.140.08−1.790.070.950.2543760.32
OP−0.220.07−2.970.0030.0540.1746620.38
Theta
CT0.090.051.720.081.000.0940450.65
F0.080.061.310.191.000.1740080.54
OP0.050.070.750.450.950.1939990.62
L-A
CT0.130.081.540.121.000.2246980.72
F0.080.080.10.311.000.2446780.72
OP0.120.091.340.181.000.2645460.72
U-A
CT0.20.082.70.0070.120.246020.66
F0.170.081.960.0540.700.2545850.66
OP0.150.072.010.0440.660.1944780.65
L-B
CT0.060.051.290.21.000.1435210.74
F0.050.041.10.271.000.0134470.73
OP0.0070.080.0890.920.920.2735150.72
U-B
CT−0.10.04−2.490.0130.20.1330610.79
F−0.060.04−1.480.141.000.1131550.72
OP−0.110.1−1.060.291.000.432820.77
Table 8. Repeated-measures ANOVA (post hoc Tukey–Kramer method)—EEG statistical results in probe phase. CT = centrotemporal, F = frontal, OP = occipitoparietal. Top bar abbreviations: Reg = region, H-L = high minus low load, SE = standard error, p=p-value, L and U = lower and upper (95%CI), ES = effect size (Hedges’ g)).
BandRegH-LSEpLUES
deltaCT−0.340.200.118−0.790.10−0.18
F−0.490.230.056−1.000.15−0.33
OP−0.740.180.001−1.13−0.34−0.39
thetaCT0.270.170.131−0.090.630.11
F0.250.200.225−0.170.680.14
OP0.160.190.406−0.240.560.08
lower
Alpha
CT0.380.280.195−0.220.980.10
F0.260.300.388−0.370.900.07
OP0.320.270.251−0.250.900.09
upper
Alpha
CT0.590.250.0370.041.130.18
F0.490.270.098−0.101.080.15
OP0.400.270.153−0.170.980.12
lower
Beta
CT0.190.150.217−0.130.520.08
F0.100.110.392−0.140.340.04
OP0.030.230.899−0.480.540.01
upper
Beta
CT0.320.140.034−0.62-0.02−0.15
F0.220.140.142−0.520.08−0.11
OP0.350.310.285−1.020.32−0.15
Disclaimer/Publisher’s Note: The statements, opinions and data contained in all publications are solely those of the individual author(s) and contributor(s) and not of MDPI and/or the editor(s). MDPI and/or the editor(s) disclaim responsibility for any injury to people or property resulting from any ideas, methods, instructions or products referred to in the content.

