Article

Emotion-Aware In-Car Feedback: A Comparative Study

1
Faculty of Engineering, Free University of Bozen-Bolzano, 39100 Bolzano, BZ, Italy
2
Department of Computer Science, University of Bath, Claverton Down, Bath BA2 7AY, UK
*
Authors to whom correspondence should be addressed.
Multimodal Technol. Interact. 2024, 8(7), 54; https://doi.org/10.3390/mti8070054
Submission received: 6 May 2024 / Revised: 4 June 2024 / Accepted: 17 June 2024 / Published: 25 June 2024

Abstract

:
We investigate personalised feedback mechanisms to help drivers regulate their emotions, aiming to improve road safety. We systematically evaluate driver-preferred feedback modalities and their impact on emotional states. Using unobtrusive vision-based emotion detection and self-labeling, we captured the emotional states and feedback preferences of 21 participants in a simulated driving environment. Results show that in-car feedback systems effectively influence drivers’ emotional states, with participants reporting positive experiences and varying preferences based on their emotions. We also developed a machine learning classification system using facial marker data to demonstrate the feasibility of our approach for classifying emotional states. Our contributions include design guidelines for tailored feedback systems, a systematic analysis of user reactions across three feedback channels with variations, an emotion classification system, and a dataset with labeled face landmark annotations for future research.

1. Introduction

Driver emotions play a vital role in ensuring road safety. Although in-car driver emotion detection has been extensively studied using facial expression analysis [1,2,3], speech emotion recognition [4,5,6], and physiological signal monitoring (e.g., movement, voice patterns, heart rate, brain activity, electrodermal activity) [7,8], personalised feedback mechanisms to help drivers regulate their emotions remain largely unexplored [9]. Timely, relevant, and actionable feedback is essential for drivers to adjust their behaviour and emotional state effectively. Effective in-vehicle feedback should not be a one-size-fits-all approach. Ideally, the feedback adapts to the specific emotion a driver is experiencing. Positive emotions might require gentle reinforcement, while negative emotions might necessitate calming or corrective measures. By tailoring feedback to the unique needs of each emotional state (positive, neutral, and negative), we can maximise its effectiveness in helping drivers maintain a safe and focused state while driving.
To begin, it is essential to differentiate between various emotional terms [10,11]. Affect, the broadest category, encompasses both positive and negative feeling states. Emotions are intense, event-triggered, and short-lived bioregulatory reactions [10,11], which can be classified using discrete labels, such as Ekman’s [12] basic emotions, i.e., anger, fear, disgust, happiness, sadness, and surprise. Moods, however, are less intense but last longer, and are influenced by various factors such as environment, relationships, and even diet [13]. Feelings, as described by Damasio, bridge the gap between emotions and moods, allowing us to experience a mix of emotions within a single situation [10]. Although understanding these distinctions is important, this study specifically focuses on emotions in the context of driving. To investigate feedback for the most relevant emotions for car design, we will use the circumplex model, which categorises emotions based on their valence and arousal (cf. Figure 1).
In a first-of-its-kind investigation, this comparative study tackles the critical challenge of understanding driver-preferred feedback mechanisms for managing emotions behind the wheel. Specifically, we investigate the following research questions to address the gap in personalised in-car feedback systems that consider driver emotions and individual preferences:
  • RQ1: Impact on Emotions: To what extent can in-car feedback systems influence drivers’ emotional states?
  • RQ2: Feedback Preferences: What are the differences in the effectiveness and user preference of various feedback modalities (light, sound, vibration)?
  • RQ3: Safety of Testing: Is it safe to conduct road testing of such in-car interventions, and what measures can be taken to ensure safety during testing?
To address these research questions, we employed a novel approach that combines unobtrusive vision-based emotion detection with self-labelling. In a simulated driving environment, we captured the emotional states of 21 participants. We explored their preferences for multi-modal feedback visual (light), auditory (music), and vibrotactile-(subtle, moderate, and high) in regulating the emotion states. By analysing these preferences over three trials, we establish design guidelines for in-vehicle feedback systems that effectively assist drivers in maintaining optimal emotional states for safe driving. Furthermore, we used facial marker data collected during the experiment to build a machine-learning classification system that employed a range of models, including Random Forest (RF), Gradient Boosting (GB), Support Vector Machine (SVM), and Multilayer Perceptron (MLP), capable of categorising participants’ emotional states into positive, neutral, or negative.
We then conducted a series of analyses to investigate the impact of various feedback modalities on drivers’ emotional states and preferences. Participants reported generally positive experiences with the feedback, with most finding it comfortable and not distracting. When it came to preferences, choices varied depending on emotional state. Vibrotactile Feedback was preferred during negative and neutral states, while Auditory Feedback was preferred during positive states. The combination of light and music was seen as most effective for promoting positive emotions and engagement. The results confirmed the feedback’s effectiveness in influencing participants’ emotions, particularly benefiting negatively aroused participants. Thematic analysis of self-reported data revealed two key themes: emotional regulation and feedback preferences. Participants reported that emotion-based feedback helped them regulate emotions and maintain a calmer state but expressed varying preferences for different feedback modalities, highlighting the importance of personalised feedback options. We also created a 3-class affect recognition system using facial landmark data to classify drivers’ emotional states, achieving an F1-score of 0.7706. This unobtrusive emotion recognition approach demonstrates the potential for personalized emotion-based in-car feedback systems. Summarising, the following are our main contributions:
  • Design Guidelines for Tailored In-Car Feedback: This study provides guidelines on creating personalised in-car feedback systems that adapt to a driver’s emotional state (positive, neutral, or negative).
  • Emotion Classification System using Facial Landmark Data: We developed a machine learning classification system that utilises only facial landmark data to categorise drivers’ emotional states into positive, neutral, or negative, enabling unobtrusive and accurate emotion detection.
  • Dataset with Labeled Face Landmark Annotations: To facilitate future research in this area, we created a dataset containing fully labeled face landmark annotations, which can be used to improve emotion detection algorithms and evaluate more effective in-car feedback systems.
  • Finally, it is worth noting the significance of the user study involving video stimuli, which constitutes a valuable contribution. We were pleasantly surprised by participants’ immersion in the presented mood, underscoring the relevance and impact of such investigations.

2. Related Work

Existing research in automotive user interfaces and driver state detection focuses on distraction and workload [14]. While researchers have widely explored emotion tracking during driving, we focus on delivering optimal feedback to enhance drivers’ emotions. This section presents a brief overview of existing literature, emphasising our work’s basis in the key areas of affect models, in-car stress measurement, and sensory stimulation.

2.1. Theoretical Models for Understanding Emotions

Affect models are theoretical frameworks used to understand and represent human emotions and moods. Numerous models have been proposed in the literature to describe and measure emotional states. One such model is the Pleasure, Arousal, Dominance (PAD) emotional state model developed by Mehrabian and Russell in the 1970s [15]. It describes emotional states based on three dimensions: Pleasure (how positive or negative the emotion is), Arousal (the level of excitement or calmness), and Dominance (the feeling of control or lack thereof). Plutchik’s wheel of emotions presents another way of understanding emotions [16]. It provides the connections between various emotions and how they interact to create more complex emotional experiences. The model suggests that emotions can be conceptualized as a three-dimensional space, with eight primary emotions (joy, trust, fear, surprise, sadness, anticipation, anger, and disgust) arranged as a wheel. The vector model is another approach to representing emotions. It represents emotions as vectors in a multi-dimensional space, with the direction of the vector indicating the type of emotion and the length indicating the intensity [17]. However, in our experiment, we adopted the widely used Russell’s circumplex model [12], which is a two-dimensional representation of emotional states. The model measures valence (the positivity of one’s emotions) on the horizontal axis and arousal (the intensity of the state) on the vertical axis. This model is commonly used in Human-Computer Interaction research to understand people’s emotional states and develop working interventions.
Moreover, there are various approaches to measuring emotions. These methods range from physiological measures to self-report questionnaires, each with its own strengths and limitations. Some widely used methods include the Positive and Negative Affect Schedule (PANAS) questionnaire [18], the Self-Assessment Manikin (SAM) [19], and physiological measures such as eye-movement patterns, heart rate variability, and skin conductance [20]. The PANAS questionnaire consists of two 10-item scales measuring positive and negative affect. SAM is another method used to measure emotions, which typically uses pictorial representations of figures to help participants rate their emotional state. In our experiment, we drew inspiration from the work of Hatashi et al. and substituted the SAM images with emojis [21]. This modification aimed to make the self-reporting process more engaging and accessible to participants. Additionally, we reduced the scale to a 5-point system, like the approach used in recognising emotions from smartphone touch and sensor data in the wild [22]. By simplifying the scale, we aimed to make it easier for participants to rate their emotional state quickly and accurately. Using input from a webcam and MediaPipe (https://developers.google.com/mediapipe/solutions/vision/face_landmarker, accessed on 1 May 2024), we extracted real-time facial landmarks and developed a pipeline for identifying emotional states.

2.2. In-Car Affective Computing

Affective computing in automobiles has emerged as a key area of research to enhance driver safety and well-being. This domain focuses on recognizing a driver’s emotional state using a combination of in-car sensor data, which includes, but is not limited to, the following: cameras have been used to monitor facial expressions and body language of drivers and passengers [23,24]; microphones have been deployed to detect changes in voice tone and volume as indicators of emotional state [25,26]; biosensors have also been leveraged to track emotional response [27,28]. Beyond these modalities, other signals like steering wheel angle [29] and seat pressure [30] have been explored as potential sources of emotional data in the driving context. The data from these sensors is analysed using machine learning to measure emotion.
For a more comprehensive review of the methods and approaches for driver emotion recognition, we refer to the survey by Zepf et al. [31]. Expanding upon the groundwork of emotion detection, researchers have investigated feedback mechanisms tailored to drivers and passengers based on detected emotional states. Fakhrhosseini et al. explored the use of music to mitigate angry driving [32], and Ambient Breath explored just-in-time breathing intervention with auditory, wind, and visual feedback [33]. Balters et al. performed an on-road study of a haptic seat for guided breathing exercises in a car [34]. Examples of other works focusing on providing intervention for guided breathing involve haptic and voice-based stimuli [35,36]. In addition to exploring different feedback mechanisms with a single modality, researchers have also investigated the benefits of using multimodal feedback. Lee et al. found that multimodal feedback can improve performance in perceptually demanding situations [37]. Inspired by notification methods for wearable rings [38], we conducted a first study to compare the performance of Auditory, Visual, and Vibrotactile Feedback to calm the driver’s emotions.

3. Concept

This study follows a two-part approach to investigate the impact of multimodal feedback on driver emotions. The first part involves emotion elicitation using carefully selected video clips, while the second part focuses on providing personalised feedback during a driving task.
Participants begin by providing consent and completing demographic questionnaires. They are then situated in the driving simulator, where they watch a series of video clips designed to elicit the three emotional states. After each video, participants complete a self-report questionnaire to assess their emotional response to the clip.
Following the emotion elicitation phase, participants engage in a driving task within the simulator. During the span of the experiment, we captured the participants’ facial expressions and emotional states in real time and saved the data for later analysis. Based on the detected emotions, we provide the participants with personalised multimodal feedback through Visual (smart LED strips), Auditory (music), and Vibrotactile (vibrations through the massage seat) channels. The order of the feedback modalities is counter-balanced for each participant to control for potential order effects.
After the driving tasks and watching all the videos, participants complete a post-study questionnaire to provide insights into their experience and preferences regarding the different feedback modalities. This study compares the participants’ emotional states during the driving task with the feedback interventions to assess the effectiveness of multimodal feedback in regulating driver emotions and promoting a positive driving experience. Furthermore, we trained emotion recognition models using the collected data and utilised them to label the feedback data. Subsequently, we validated the feedback data with the self-reported forms from the participants.

4. User Study

The feedback mechanisms explored in this study included Visual, Auditory, and Vibrotactile modalities. The following sections describe the details of the experiment, including the participants, apparatus, procedure, experimental design, data collection, and analysis.

4.1. Apparatus

The study was conducted in a controlled laboratory environment using a driving simulator setup, cf. Figure 2. The configuration included a Windows 10 PC, a projector for displaying a realistic driving scene, and two internal displays for presenting emotion-eliciting video clips. Participants were seated in a standard bucket seat mounted on the driving simulator.
The MediaPipe FaceLandmarker model was used to capture and analyze participants’ facial expressions in real-time using a high-resolution webcam for emotion recognition. This model tracked facial landmarks and stored the data in CSV format, allowing for analysis and synchronisation with timelines from the driving simulator and video playback. The multimodal feedback system included:
  • Visual Feedback: This part of the setup featured Philips Hue white and color ambiance light strips (1800 lumens, 20 W) mounted in front of the driving simulator’s windshield. The lights were connected to a Philips Hue Bridge and managed through the Philips Hue API (https://github.com/nirantak/hue-api, accessed on 1 May 2024).
  • Audio Feedback: The setup also included multimedia speakers placed on each side of the participant, connected to a Windows 10 PC via a 3.5 mm audio jack. These speakers were controlled through the PC’s audio settings and custom Python scripts.
  • Vibrotactile Feedback: A massage seat (https://www.amazon.com/dp/B0CM3H474R/, accessed on 1 May 2024) was fixed onto the bucket seat frame of the driving simulator. It contained ten massage motors (four vibrotactile motors for the lower torso and six for the upper torso) and a heating function. The seat operated on a 12 V DC adapter and featured a built-in control panel for manually adjusting massage modes and intensities.

4.2. Participants

The study included 21 participants (3 females, 18 males) from a nearby science park, ranging in age from 28 to 49 years (M = 32.57, SD = 4.34). All participants possessed a valid driver’s license and/or had experience with car simulators. Six of them used their cars daily, whereas seven used them seasonally. Additionally, none of the participants self-reported color blindness.
Nearly half (10 out of 21) had an engineering background. Figure 3 illustrates the frequency of various emotional experiences reported by participants during car driving, quantified on a Likert scale from 1 (=never) to 5 (=very often). This chart summarizes the emotional landscape of driving, highlighting the predominant feelings experienced by drivers.
The emotional states included Surprise, Disgust, Fear, Sadness, Anger, and Happiness, as encountered by the drivers. Surprise is primarily observed at the lower frequency (never) and higher mid-range frequency, suggesting a polarisation in experiences of unexpected events while driving. Disgust, on the other hand, is predominantly noted at lower frequencies (never and rarely), indicating that this emotion is infrequently elicited during driving scenarios. In contrast, Fear shows a more uniform distribution across the scale, with a slight concentration towards less frequent occurrences, highlighting occasional anxiety or apprehension among drivers. Sadness, similar to Fear, is distributed across all frequencies but tends toward the lower end, implying that while some drivers occasionally experience sadness, it is generally not a dominant emotion. Anger is notably concentrated at the lowest frequency, suggesting that feelings of anger are uncommon for most participants while driving. Conversely, Happiness demonstrated significant reporting at the highest frequency (very often), with a broad spread across other levels as well, indicating that driving is predominantly a positive experience for many participants.

4.3. Design

Upon arrival, participants were familiarised with the driving simulator, ensuring they were comfortable with the apparatus and the projected video environment. To evoke various emotions (Positive, Neutral, Negative), participants were shown short video clips as suggested by Schaeffer and Juckel et al [39,40]. The first video clip was from Mr. Bean and features a scene where he is being chased by airport police and was meant to elicit a positive emotion. This clip is 131 s long. The second clip is from Blue 2 and shows a man clearing some drawers. It was 40 s long and had a low arousal and positive affect score of 1.63, representing a relatively low level of positive emotions experienced by viewers. These scores were determined using self-report measures in a validation study by Schaefer et al. [39], where arousal, Positive, and negative affect were assessed using the PANAS and positive and negative affect scores were derived from the Differential Emotions Scale (DES). The Blue 2 clip also had a negative affect score of 1.21, indicating a low level of negative emotions, making it appropriate for inducing a neutral emotional state. Lastly, the third clip is from The Perfect World and stars Kevin Costner. This clip was 267 s long and had an arousal score of 5.78, suggesting a relatively high level of emotional intensity. It had a positive affect score of 1.98 and a negative affect score of 1.86, indicating a mix of positive and negative emotions, with a slight predominance of negative emotions.
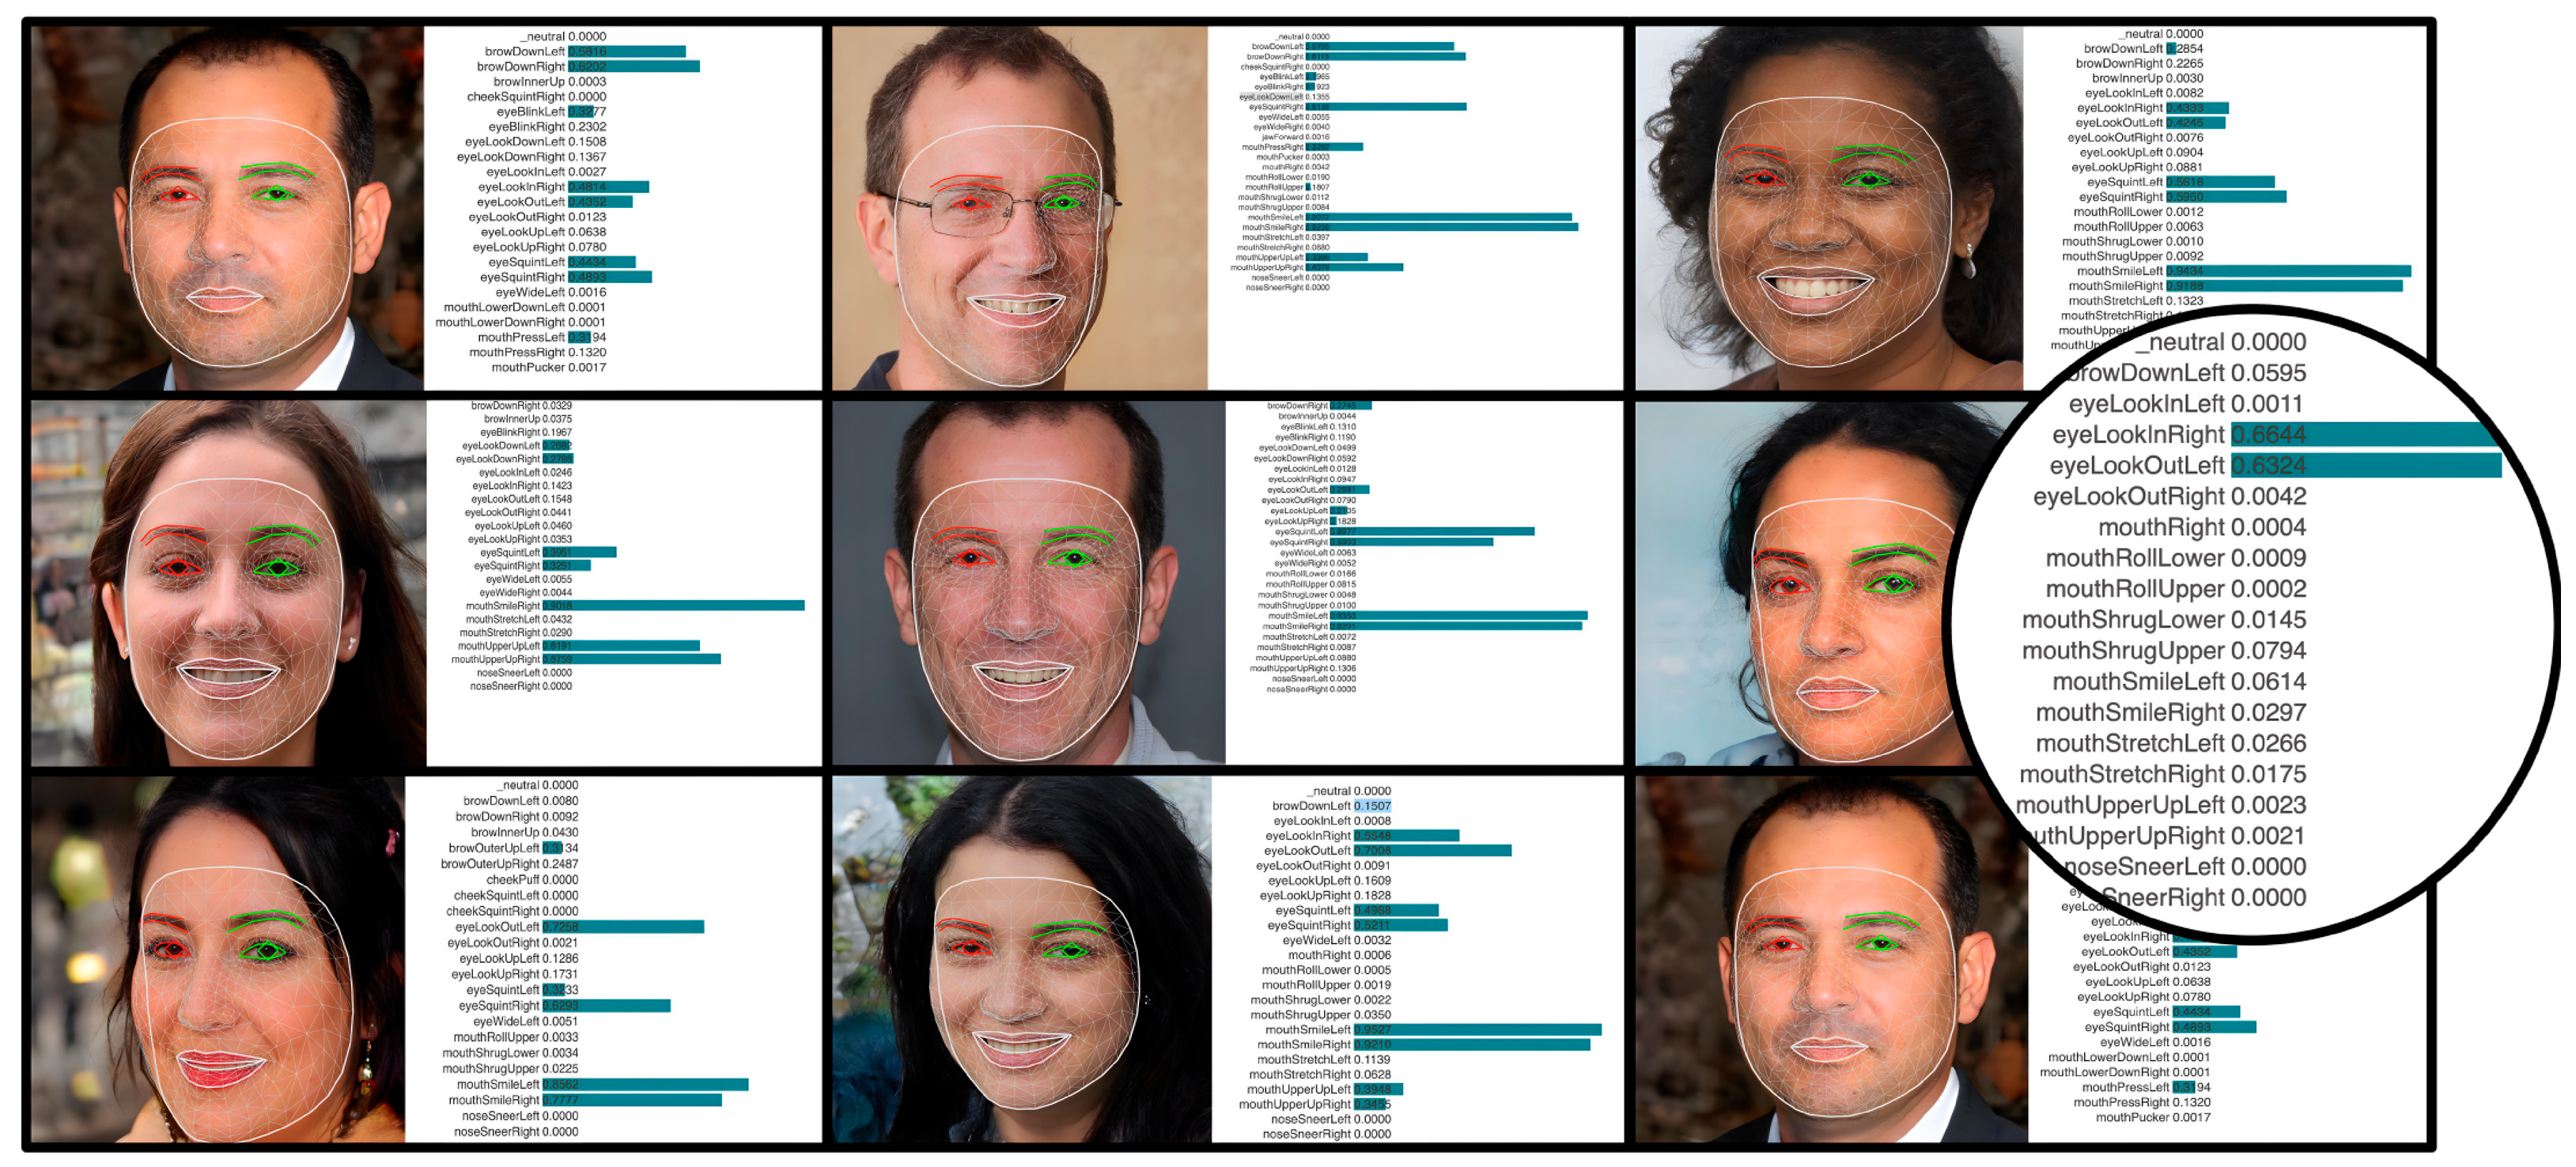
During the emotion elicitation phase, the Media Pipe FaceLandmarker model continuously monitored the participants’ facial expressions, detecting and tracking 478 facial landmarks in real-time during the entire experimentation period, cf. Figure 4.
These landmarks included the face contours, eyebrows, eyes (including the iris), and lips, with each landmark represented with its x, y, and z coordinates. Additionally, the model captured 52 face-blend shape scores, which quantified the intensity of various facial expressions, such as smiling, frowning, and other emotion-related movements. The landmark data, consisting of the 478 facial landmark coordinates and 52 face blend shape scores, was then stored for later analysis.
Following the emotion elicitation phase, participants engaged in a driving task within the simulator. Throughout the driving task, the emotion detection system actively gauged the participants’ emotional states based on their facial landmarks, triggering the corresponding feedback mechanisms accordingly.
The feedback mechanisms were tailored to promote a positive or neutral emotional state regardless of the individual’s initial emotions. These feedback modalities were inspired by the work of Wilson and Brewster [41], Ju et al. [42], Wilson et al. [43], and Roumen et al. [38], which is effectively summarised in Table 1.
The types of feedback and their respective parameters for each emotional state were randomised and maintained for 20 s each and included:
  • Positive Emotion: Visual feedback with warm, vibrant colours, e.g., orange with hue of 5000, saturation of 254, brightness of 254, and RGB value of (255, 130, 0); Auditory Feedback with upbeat, joyful music; and Vibrotactile Feedback with subtle vibration intensity. The choice of warm colours, like orange, for the Visual Feedback was based on studies emphasising their link to positive emotions and their capacity to evoke feelings of warmth and excitement [44]. Upbeat and joyful music was selected to complement this Visual Feedback, as research suggests music can influence emotional states [45,46]. The concept of “haptic empathy” [42] inspired the idea of Vibrotactile Feedback. This concept suggests that Vibrotactile Feedback can convey emotional meaning. For positive feedback, a subtle vibration was selected. Only one of the lower torso motors was activated with the lowest device-specific speed.
  • Neutral Emotion: Visual Feedback with a soft and neutral colour, e.g., blue, with a hue of 46,920, saturation of 254, brightness of 254, and an RGB value of (0, 143, 255), was chosen to create a calming atmosphere [44]; Auditory Feedback with relaxing, ambient music; and Vibrotactile Feedback with mild vibration intensity (only two of the lower torso motors were active with an intermediate device-specific speed). Relaxing and ambient music was chosen to maintain the neutral emotion.
  • Negative Emotion: Visual Feedback with cool and soothing colour, e.g., green, with a hue 25,500, saturation 254, brightness 254, and an RGB value of (0, 255, 128) were chosen to help regulate negative emotions or improve this state to a neutral state; Auditory Feedback with slow, calming music; and Vibrotactile Feedback with intermittent, pulsating vibration pattern (poke effect—with ten motors running simultaneously with the maximum device-specific speed). The strong, pulsating vibrotactile (with all motors active) was used to grab attention and disrupt the negative state.
After the driving task, participants completed a post-questionnaire to provide subjective evaluations of their emotional experiences, the effectiveness of the feedback mechanisms, their perceived level of distraction for each feedback modality, and their overall satisfaction. The study itself was based on a within-subjects design, where every participant was exposed to all three emotional states (positive, neutral, and negative) as well as various feedback interventions. To mitigate potential order effects, the sequence of these conditions was counterbalanced among participants. The study’s independent variables were the emotional states and the different feedback types (visual, audio, and vibrotactile). The dependent variables included participants’ subjective emotional evaluations, their assessments of the feedback’s effectiveness, their perceptions of noticeability and distraction for each feedback type, and their overall workload assessment and satisfaction with the experiment.

4.4. Data Collection and Analysis

The study collected quantitative and qualitative data to understand how emotion-based feedback affected emotional well-being and driving experience. Participants completed pre- and post-questionnaires to provide subjective evaluations of their emotional experiences during each phase of the experiment.
The facial landmark data collected during the driving task was preprocessed, filtered, and cleaned for further analysis. The qualitative data from the open-ended questions in the post-questionnaire was analysed to identify common patterns in the participants’ subjective experiences and preferences regarding the emotion-based feedback system. Task load ratings were collected using the NASA TLX questionnaires.

5. Results

5.1. Emotional Sensing

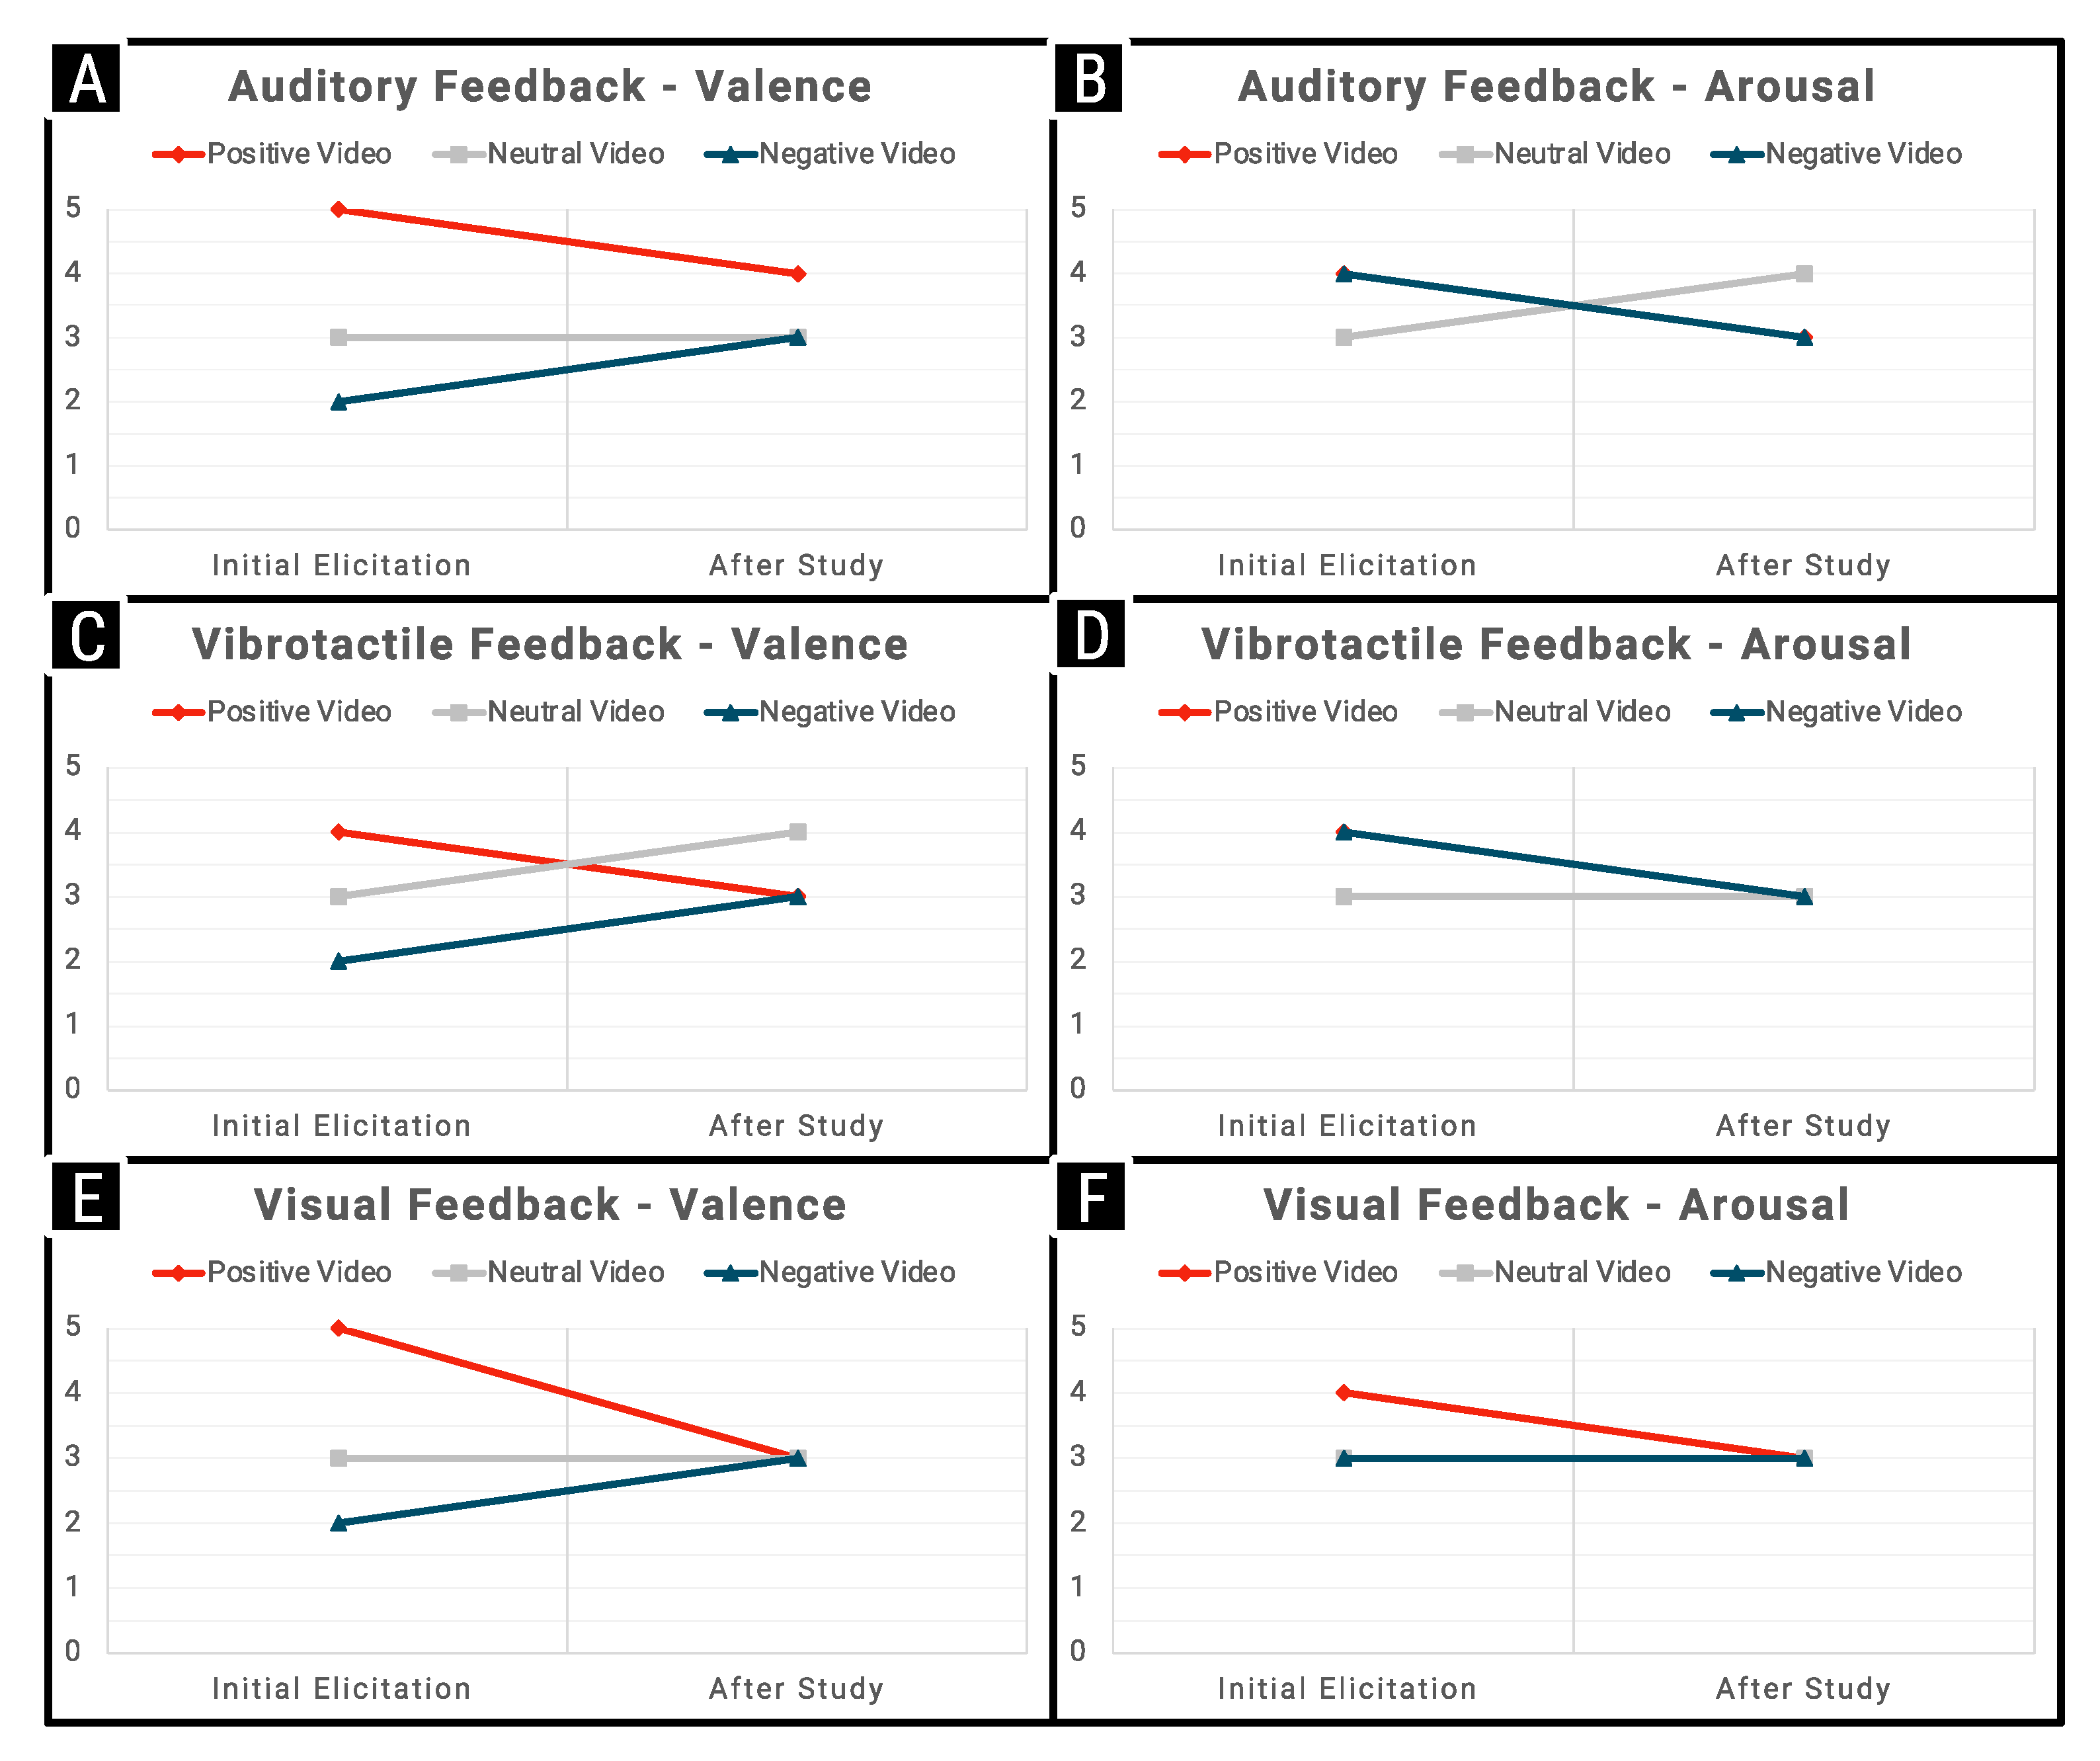
Following the Negative Video, stimulating a negative emotion, approximately 86% of participants felt sad or angry (ME = 2, where 1 is very negative and 5 very positive), while only 14% reported different emotions. Around 52% also indicated they had a highly intense emotional experience. After the driving task and receiving corresponding feedback (whether through music, visual cues, or vibration), the mood shifted, and 33% of participants felt happy (ME = 3), while only 29% still expressed sadness. The emotional intensity was very high following the video (ME = 4, with 1 being very low and 5 very high), and at an average level after the driving task (ME = 3). Each of the three feedback modes—Audio, Vibrotactile, and Visual—resulted in an increase in the median valence score (ME = 3 from ME = 2) indicating a positive shift in the nature of emotions during driving tasks after being negatively elicited, cf. Figure 5A,C,E. The Auditory and the Vibrotactile Feedback were also beneficial in lowering the participant’s arousal levels (from ME = 4 to ME = 3), whereas the Visual Feedback had no effect on the median arousal value, which remained constant (ME = 3), cf. Figure 5B,D,F.
After watching the Neutral Video, 71% of participants indicated they were in a neutral mood. Additionally, 76% reported feeling neither positive nor negative emotions (ME = 3), while 5% expressed feeling stressed. The intensity of these emotions (ME = 3) was generally rated as average by 67%. This changed after the driving task, when participants again received the positive feedback—57% reported feeling happy and 33% indicated they felt either stressed or surprised. The Auditory and the Visual Feedback had no effect on the valence levels, but the Vibrotactile Feedback exhibited an increase in the median valence score (ME = 4 from ME = 3), cf. Figure 5A,C,E. On the other hand, only the Audio Feedback led to an increase in arousal levels (ME = 4 from ME = 3), while the other feedback modes showed no effect on the median arousal scores, cf. Figure 5B,D,F. Some participants, e.g., P10 and P18, apparently preferred the mild Vibration Feedback during driving, while some others, e.g., P9, reported liking relaxing music, which was the feedback provided after the Neutral Video. Notably, such participant preferences explain the shift in the median values of valence and arousal by the Vibrotactile and Auditory Feedback, respectively.
After watching the Positive Video featuring Mr. Bean, 86% of participants felt happy, 5% were surprised, and only two reported not experiencing any of the mentioned emotions. It was encouraging to note that even after the driving task, most participants remained happy (71%), while 10% expressed surprise. This could potentially be due to the driving task they performed during the study. While the emotional intensity was very high for most participants (76%) after watching the video, this changed after the driving task, where most participants (62%) reported feeling neutral. Each feedback mode yielded a decline in the median valence scores, with Visual Feedback showing a sharp decrease in valence (ME = 3 from ME = 5), while both Audio Feedback and Vibrotactile Feedback led to reductions (ME = 4 from ME = 5 and ME = 3 from ME = 4, respectively), cf. Figure 5A,C,E. Similarly, each of the three feedback modes equally resulted in a decline of median arousal values (ME = 3 from ME = 4), indicating that the feedback modes were particularly effective in moderating high states of emotional intensity in participants Figure 5B,D,F.
The Friedman test revealed significant variations in emotional responses across different affect categories (Positive Emotion, Neutral Emotion, Negative Emotion) and feedback modalities (Auditory, Vibrotactile, Visual). However, this was not the case for Neutral Emotion in the Visual group (χ2(2) = 11.76, p = 0.108). All other comparisons showed significance (p < 0.005). Post-hoc Wilcoxon signed-rank tests, adjusted with Bonferroni corrections, were conducted for the significant categories, but none of the pairwise comparisons between feedback modalities and question types reached statistical significance. The small Wilcoxon statistic values suggest that the lack of significant differences might be due to the limited sample size.
Participants also felt more in control during positive video sessions when music was the feedback mechanism, scoring 3.71 on average. Many participants, e.g., P6, P11, and P13 among others, explicitly expressed their liking for the upbeat music post positive video sessions, since it positively affected their emotion states irrespective of their driving actions. Moreover, a considerable section also expressed their preference for the subtle Vibrotactile Feedback alongside a green-coloured Visual Feedback, which neither distracted nor caused disturbance for the given driving task but provided sufficient comfort to reduce the emotional intensity to a neutral level.

5.2. Spotting the Right Feedback and Distraction

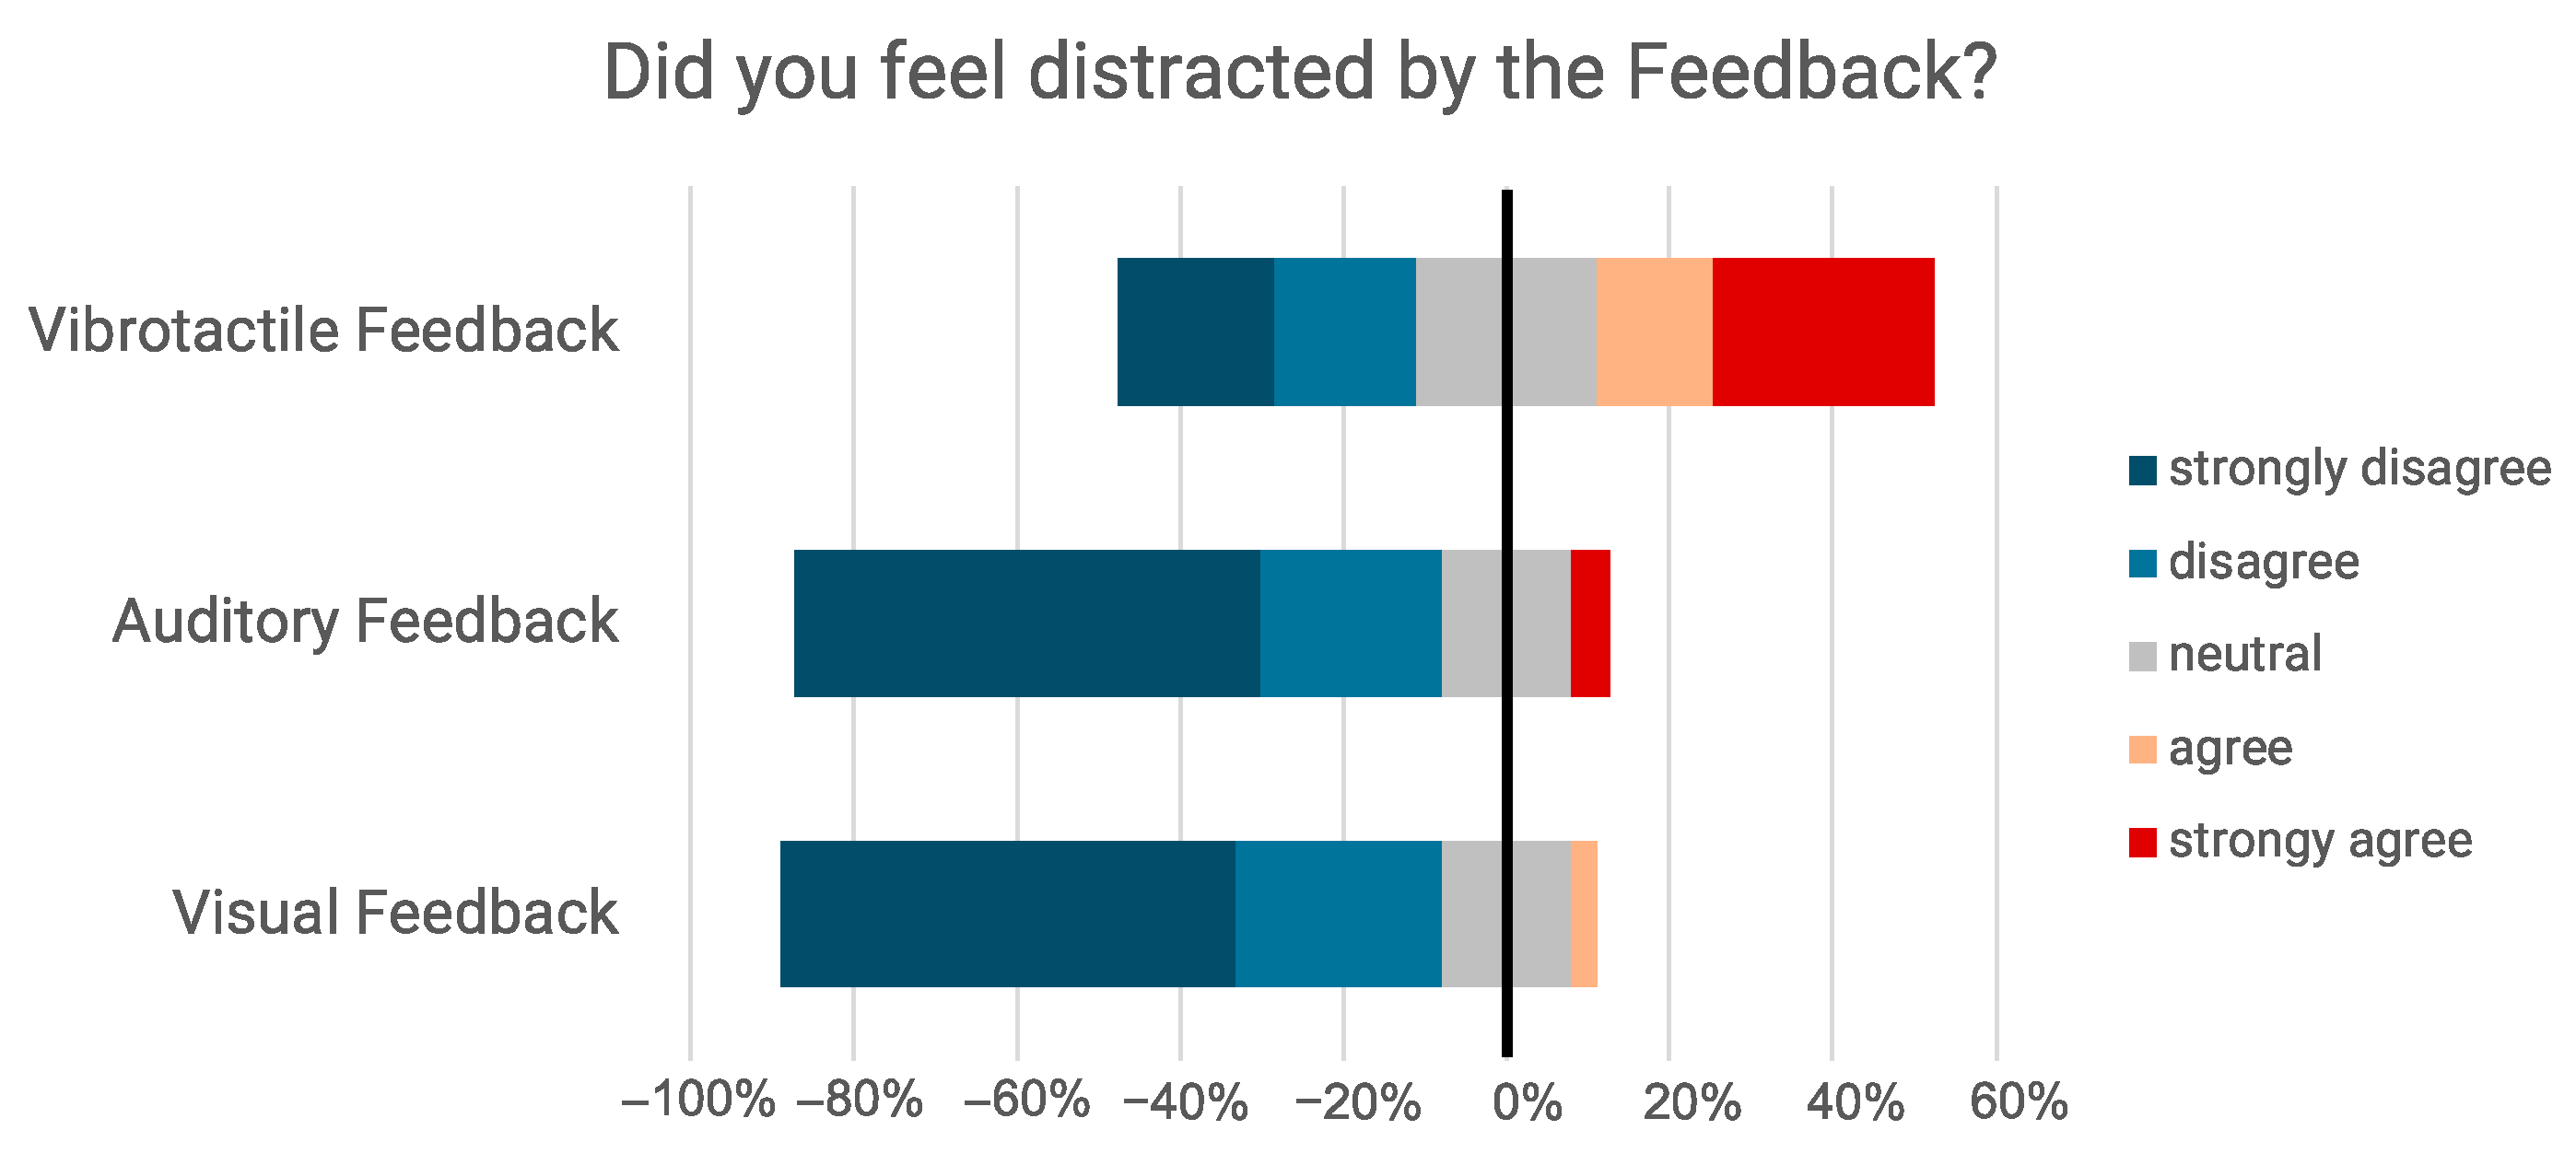
Figure 6 shows the overall distraction across the different feedback modalities. Only 30% of respondents correctly identified the ambient color, while 24% gave a wrong answer, and 46% did not notice any color.
This suggests that the visual feedback might not have been particularly noticeable or effective. The majority of all participants (56%) were not distracted at all by the visual feedback and only a small percentage (5%) reported being very much distracted, indicating that visual feedback did not serve as a major distraction. This is very interesting, especially since the study was not in a very bright room, with no direct light pointing to the apparatus. Regarding the audio feedback, 75% of respondents correctly identified the music genre, while only 2% did not notice any genre. This indicates that the audio feedback was more noticeable and potentially more engaging. Similarly, 57% of respondents were not distracted by the audio feedback, and only 5% felt very much distracted. This suggests that the audio feedback was also not a major distraction. In addition, 63% of all participants correctly identified the vibration’s location, while 37% gave a wrong answer. This indicates that the vibration feedback was moderately noticeable. Only 19% of all participants were not at all distracted by the vibration feedback, while 27% were very much distracted. This feedback modality appears to have been more distracting compared to the visual and audio feedback.
In summary, the Auditory Feedback seemed the most noticeable and least distracting, while the vibration feedback, though noticeable, was the most distracting. The visual feedback was the least noticeable and also minimally distracting.

5.3. Qualitative Results

Qualitative data revealed that the majority of participants (94.44%) were not distracted during the driving task. An equal percentage (94.44%) also reported finding the feedback provided comfortable. After viewing a video that induced negative emotions, approximately 77.78% of participants rated vibrotactile feedback as the clearest, with music preferred by 33.33%. A similar preference pattern was observed when participants were in a neutral emotional state. Conversely, during positive emotional states, Auditory Feedback was the favored choice.
When participants were asked which combination of feedback modalities they believed would most effectively enhance their driving engagement, over half (55.56%) ranked “Visual + Auditory” as the top choice. This was followed by “Auditory + Vibrotactile” at 27.78%, and “Visual + Auditory + Vibrotactile” at 16.67%. Additionally, 11.11% of participants did not find any of these feedback options useful.
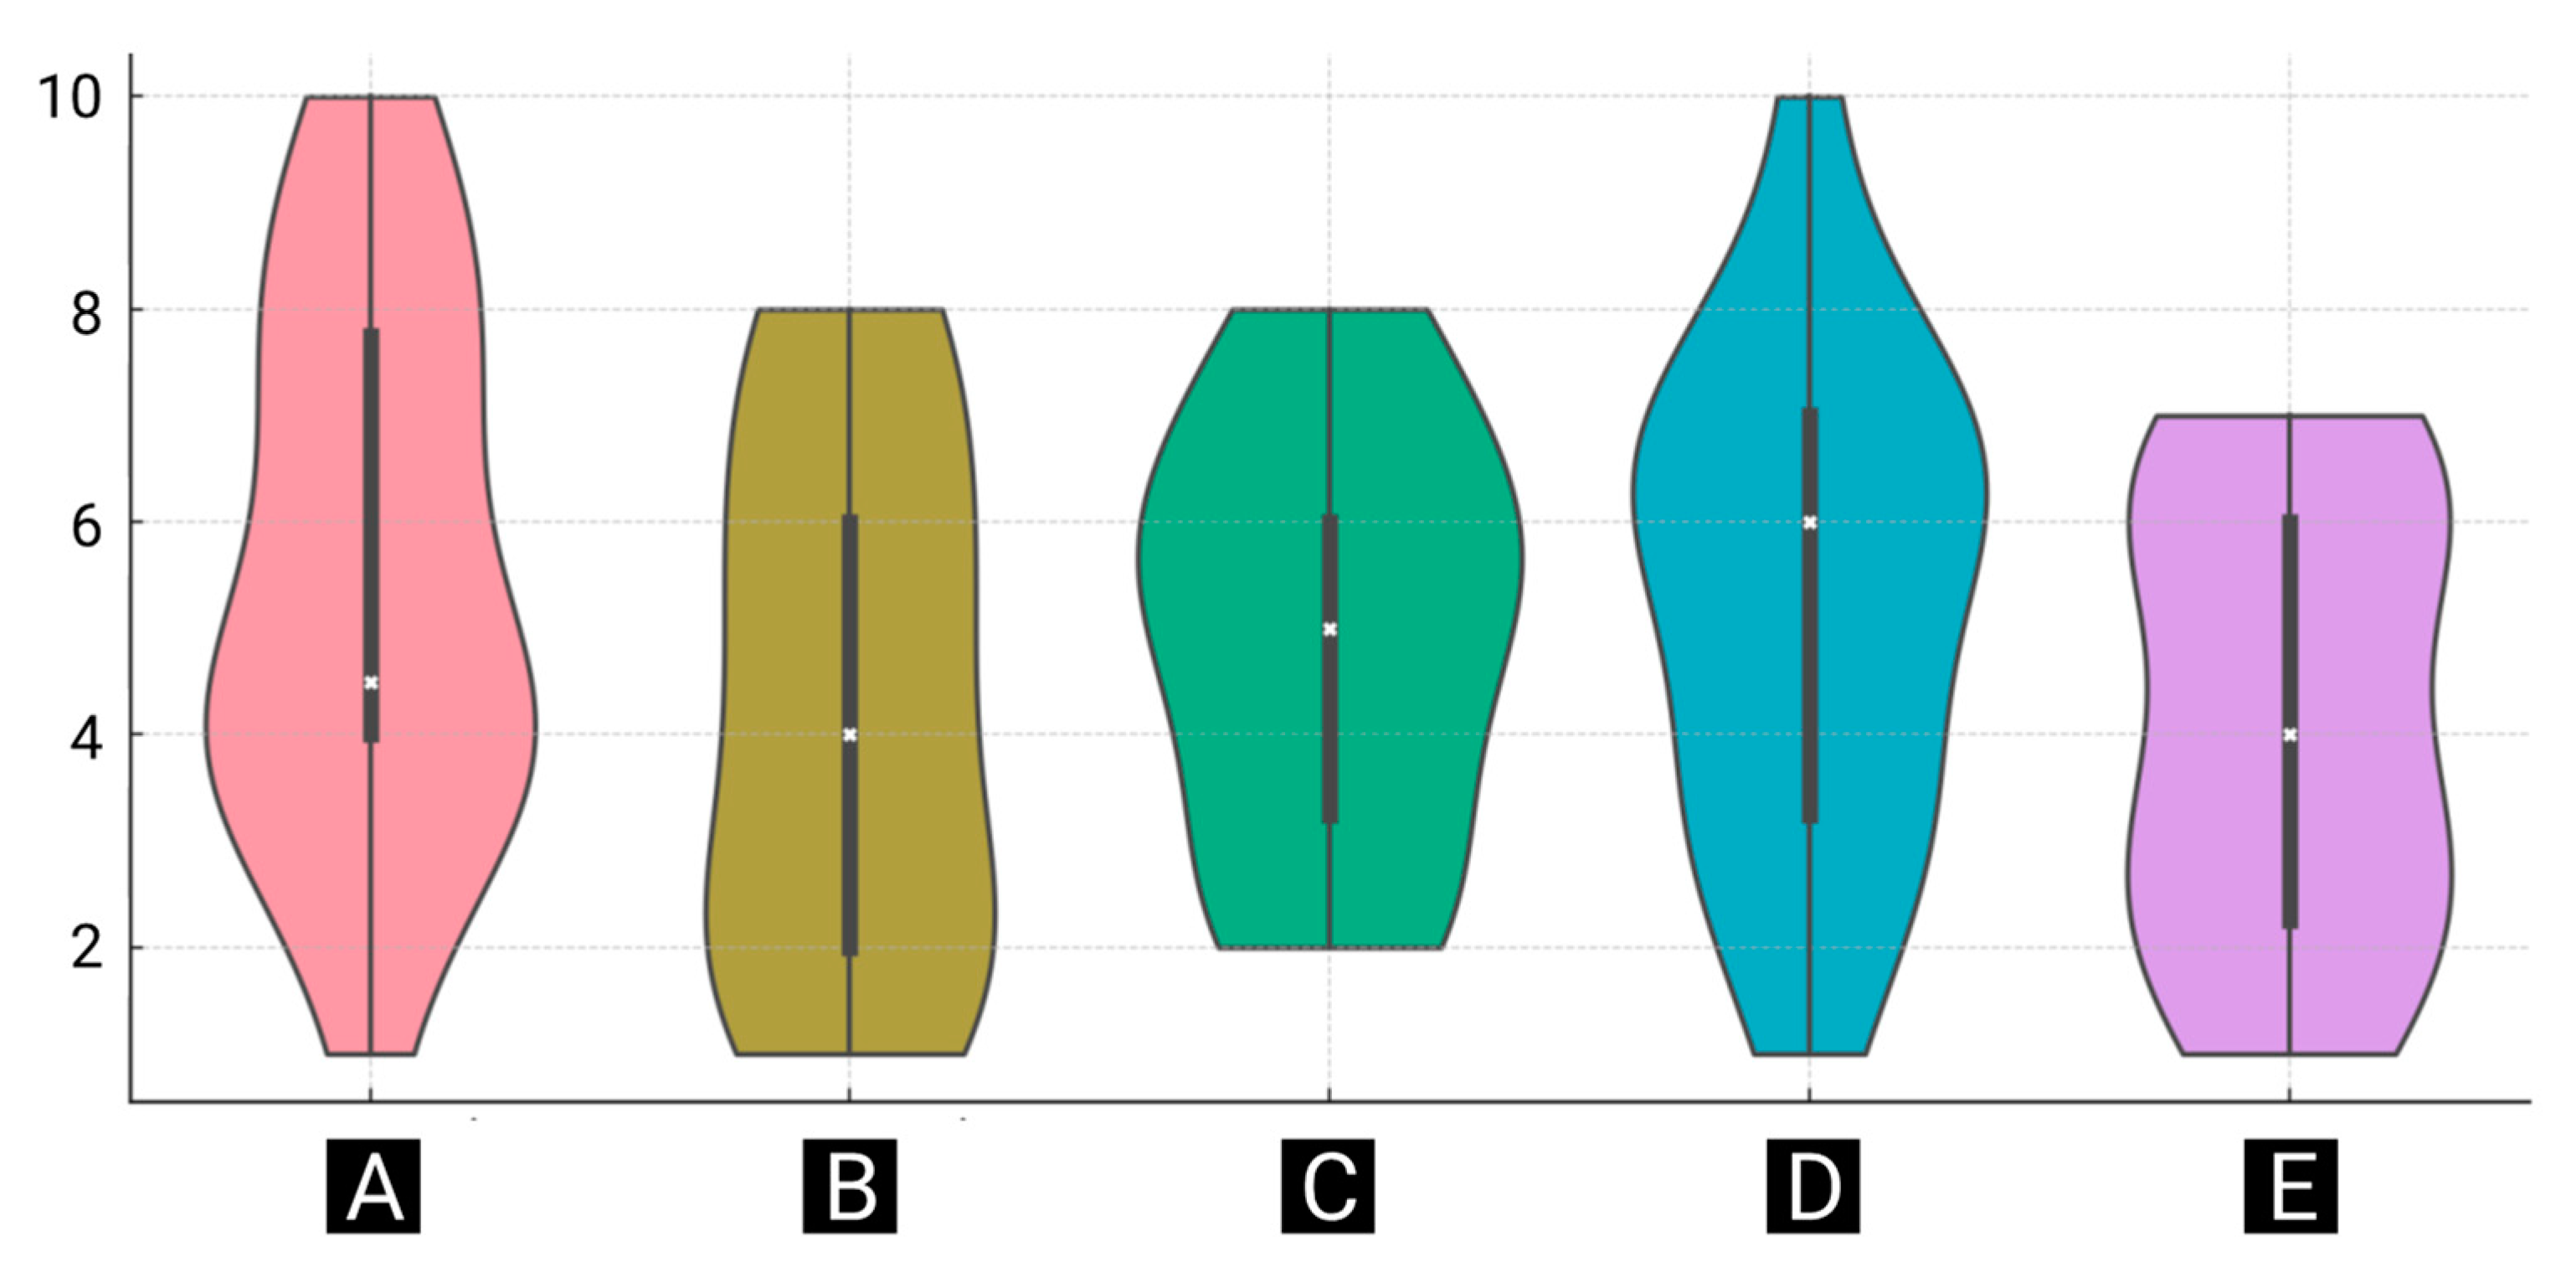
Figure 7 depicts the task load ratings (1 = very low; 10 = very high) for all the feedback, focusing on Mental Demand, Physical Demand, Performance, Effort, and Frustration. Regarding the Mental Demand, the majority of responses occur at level 4, which aligns with the violin plot of Figure 7A. The responses ranged from a low of 1 to a high of 10, with few entries at the extreme levels, suggesting that while the task was mentally demanding, it was not excessively so for most participants. Figure 7B shows a clustering of responses at the lower end of the scale for the Physical Demand, particularly with multiple entries at levels 2–6. This suggests that the study tasks were less physically demanding, with most ratings concentrated below the mid-point of the scale. Concerning Performance, the violin plot of Figure 7C depicts a median of 5, with a balanced distribution suggesting that participants felt moderately successful in completing the task. This is also reflected in a spread of responses with a peak at level 6. Regarding Effort, the violin pot shows a median of 6, and indicates a high variability in how much effort participants experienced, cf. Figure 7D. The plot highlights variability, with a significant number of responses at higher effort levels. Finally, the violin plot of Figure 7E indicates a median at 4, with a more concentrated distribution around this median and less spread at the upper end. This also supports the moderate median frustration observed in the violin plot. The distribution is somewhat concentrated at lower scores, which indicates that most participants reported lower levels of negative emotional states. Summarising, it can be concluded that the majority of participants did not feel highly frustrated, and they experienced relatively lower levels of frustration during the task.
The self-reported data from all the participants during initial elicitation and after the driving tasks revealed the effectiveness of the study in influencing the valence and arousal dimensions of their emotions in the desired way. This is evident from the change in median scores of both valence and arousal after watching the video clips and after each round of the driving task. For instance, after watching the negative video, the median score for valence was 2, which increased to 3 after the study. The median valence score after the driving tasks remained at 3 for the neutral video and decreased to 4 from 5 for the positive video. This suggests that the feedback modes during the driving were particularly beneficial for the negatively aroused participants, as they experienced an increase in their perceived valence scores post-study compared to the participants who were neutrally or positively elicited. On the other hand, the median scores for arousal dropped from 4 to 3 for both positive and negative videos, whereas the score remained constant at 3 for the neutral video. This is indicative of the fact that the feedback modes helped bring down the arousal states in participants to a neutral level post-driving, which aligns with the objective of the study.
The thematic analysis revealed two key themes: emotional regulation and feedback preferences. Many participants reported that the emotion-based feedback helped them regulate their emotions and maintain a calmer state while performing the driving task. For example, one participant, P11, mentioned, “The driving with upbeat music is what I liked the most”, while P9 indicated, “It felt good to drive with the relaxing music”. On the other hand, P10 mentioned “Vibration is what I like most”. This finding supports the quantitative results, demonstrating the effectiveness of the feedback system in promoting emotional well-being.
Participants also expressed varying preferences for the different feedback modalities. For example, P16 stated, “Auditory and Vibrotactile were the most effective for me”. While P7 indicated, “I liked the music and mild vibrations while driving after watching the positive video”. Conversely, few participants expressed a certain degree of displeasure upon the introduction of Vibrotactile Feedback while driving, with one participant, P20, indicating, “I felt a bit bothered by the vibrotactile as it made it hard for me to focus while I was driving”. P7 and P15 explicitly expressed their concern over intense Vibrotactile Feedback during driving and preferred subtle Vibrotactile Feedback since it was more comfortable and less distracting while driving. Certain participants also suggested specific alterations in the feedback modes when negatively aroused after initial elicitation. For instance, P6 expressed, “After the sad video I would expect the music feedback to be a bit upbeat as to relieve the sadness”. These diverse preferences highlight the importance of providing feedback options to cater to individual needs and preferences.
In summary, the qualitative results revealed that the majority of participants were not distracted during the driving task and found the provided feedback comfortable. Participants expressed varying preferences for the different feedback modalities depending on their emotional state, with Vibrotactile Feedback being preferred during negative and neutral states, while Auditory Feedback was recommended during positive states. The combination of “Visual + Auditory” was ranked as the most effective in enhancing driving engagement and promoting positive emotions. The NASA-TLX ratings indicated that the driving task was moderately demanding mentally and physically, with participants reporting moderate levels of performance, effort, and frustration. The thematic analysis highlighted the effectiveness of emotion-based feedback in helping participants regulate their emotions and maintain a calmer state while driving. However, participants expressed diverse preferences for the feedback modalities, emphasising the importance of providing personalised feedback options to cater to individual needs and preferences.

6. Emotion Classification via Machine Learning

In this section, we aimed to construct a 3-class affect recognition system that classifies the driver’s emotional state into positive, neutral, or negative states. We achieved this without instrumenting the user. We perform evaluations for two phases of the data collection process: elicitation and feedback.
During the elicitation phase, participants watched videos designed to elicit specific emotional responses. The facial landmark data collected during this phase were used to train machine learning models to recognise drivers’ emotional states. In the feedback phase, participants filled out self-reporting forms detailing their emotional states. These data was used as the ground truth labels representing three emotional states.

6.1. Input Features

The raw data include 1486 features, comprising 478 facial landmark coordinates (each a 3D point with x, y, z values) that track individual points on the face, and 52 face blend shape scores that represent different facial expressions or shapes. The facial landmark and blend shape data were captured at a fixed interval of 1 s during both the elicitation and feedback phases. Each data point represented a snapshot of the facial landmarks and blend shapes at a specific timestamp. After merging the data from all participants, the dataset consisted of 10,319 rows and 1486 columns, with 6132 negative, 2731 positive, and 1456 neutral data points from all participants. This variation was due to the different video lengths used in the elicitation phase.
To reduce the input feature set, which contained a substantial number of features that can lead to increased computational cost and complexity, we trained a Random Forest classifier. After evaluating models with 20, 50, 80, 100, and 1000 features, we found that they all achieved similar F1-scores of around 0.89. Therefore, we selected the top 50 most useful features as our baseline based on their importance scores for further evaluation. This process resulted in a reduced feature set, making the model training more efficient while evaluating performance with multiple classifiers.

6.2. Model Training and Testing: Elicitation Phase

We employed various modeling approaches, including individual classifiers (Random Forest, Gradient Boosting, SVM, and MLP) and an ensemble classifier. The ensemble classifier is created using the Voting Classifier from scikit-learn. The base classifiers (Random Forest, Gradient Boosting, SVM, and MLP) are specified as estimators, and the voting method is set to ‘hard’, meaning the final prediction is based on the majority vote of the base classifiers. We employed two evaluation approaches: User Dependent and User-Independent models.
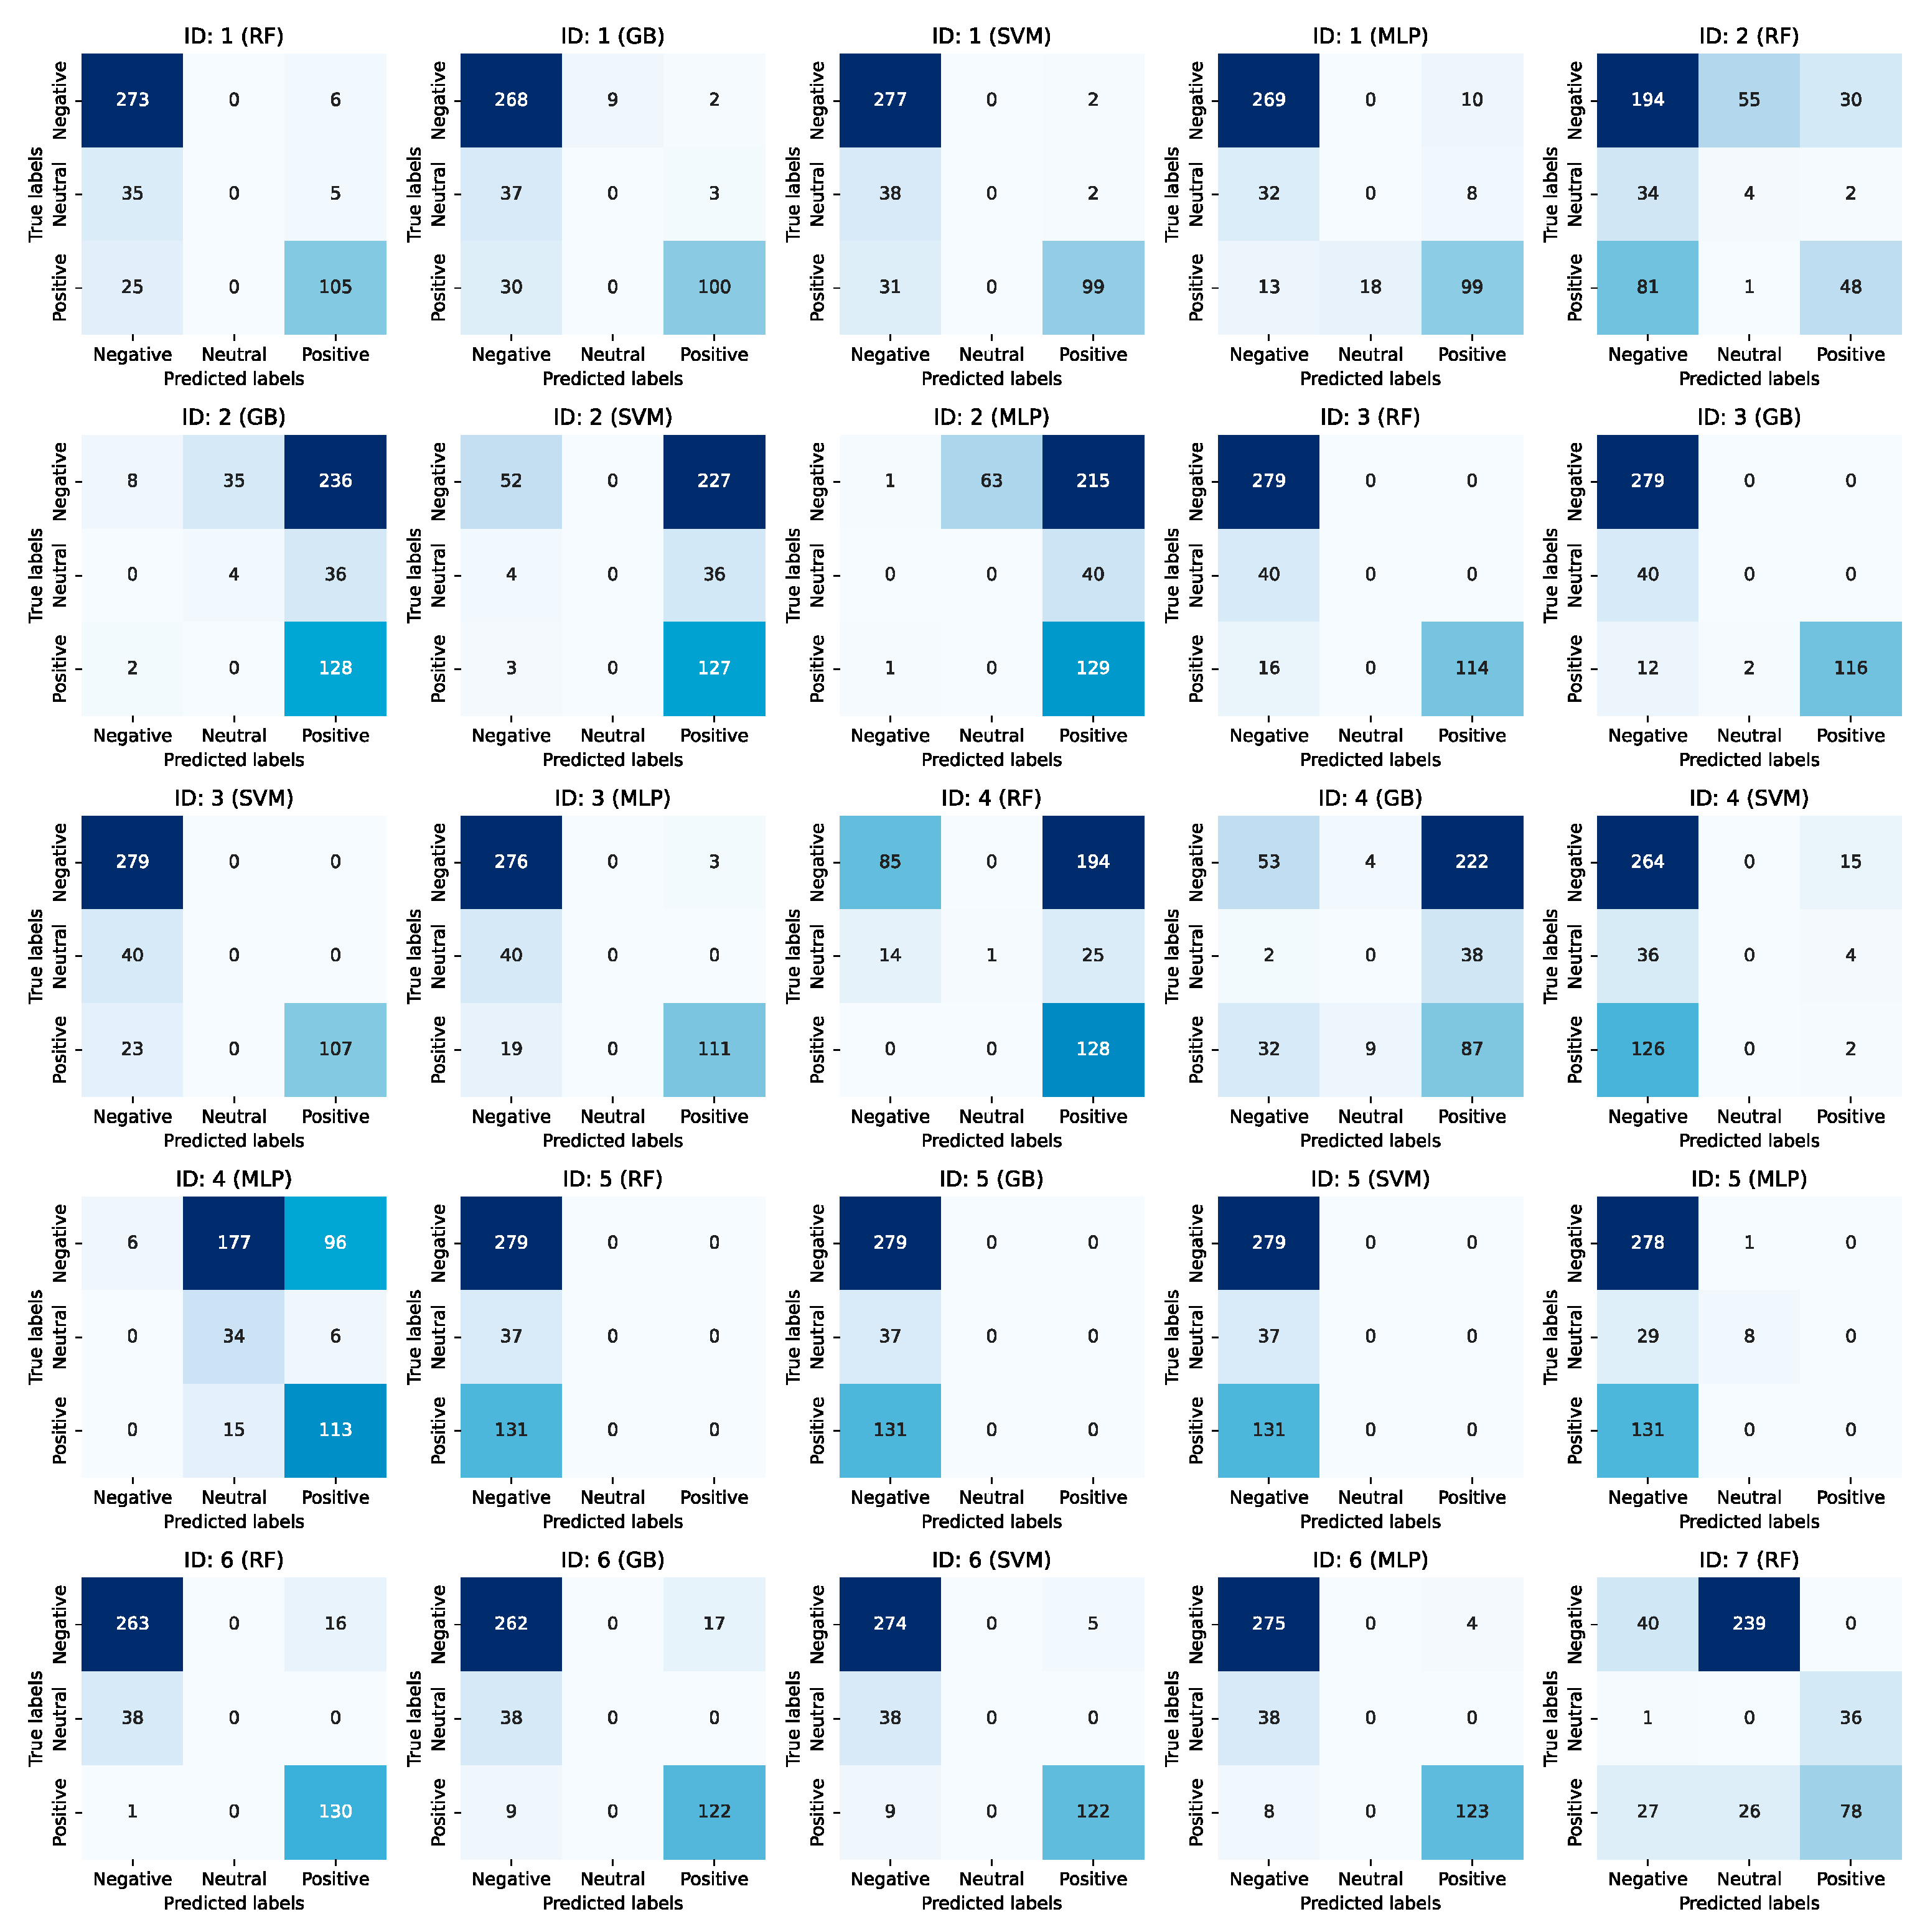
For the user-dependent models, we trained the above five classifier models on data from individual participants and evaluated them on the same participant’s data using an 80-20 train-test split. The results, as shown in Table 2, demonstrate the performance of the user-dependent models for the elicitation phase. For the user-dependent models, the MLP model achieved an F1-score of 0.9202 from k-fold (k = 5) cross-validation during the elicitation phase, followed closely by the Random Forest and Gradient Boosting models. The confusion matrix for the user-dependent models is presented in Figure A1 (Random Forest, Gradient Boosting, Support Vector Machine, and Multi Layer Perceptron and Ensemble).
For the user-independent models, we employed Leave-One-Participant-Out Cross-Validation (LOOCV) to assess the models’ performance. In this approach, the models were trained on data from all 21 participants except one and then evaluated on the left-out participant. This process was repeated for each participant, and the average performance across all iterations was reported. The results, as shown in Table 3, showcase the average F1-score of the user-independent models for the elicitation phase.
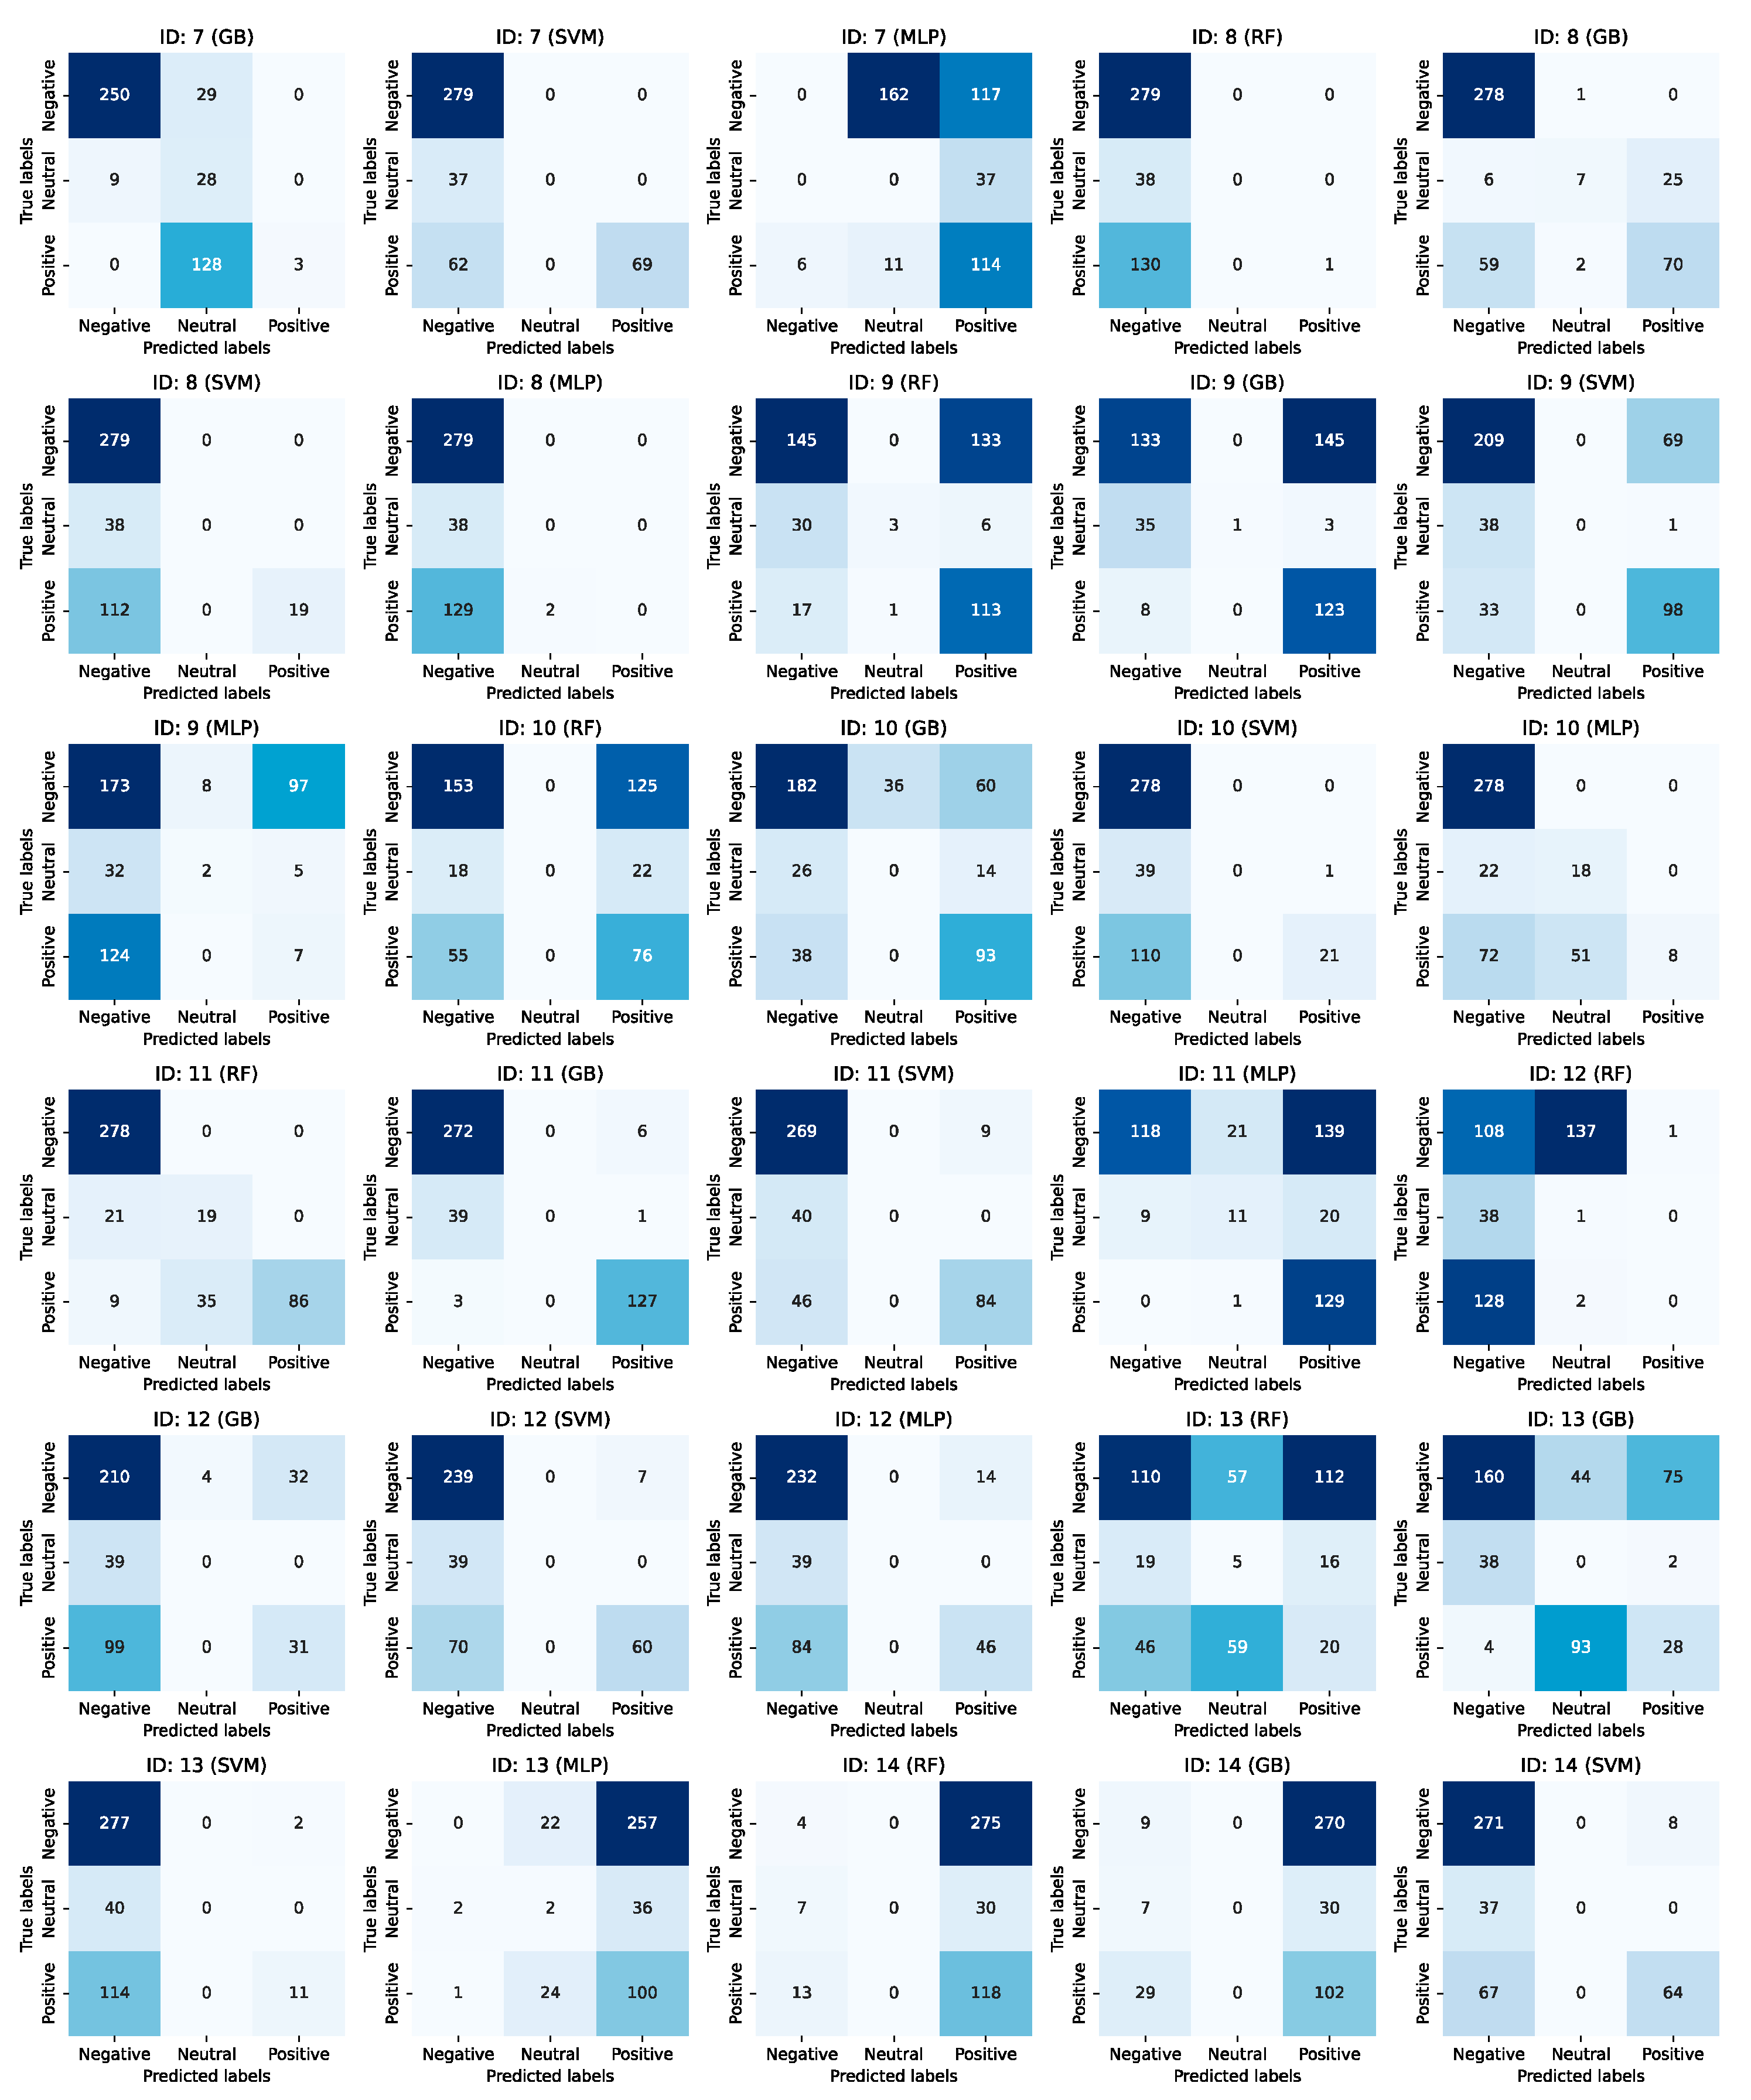
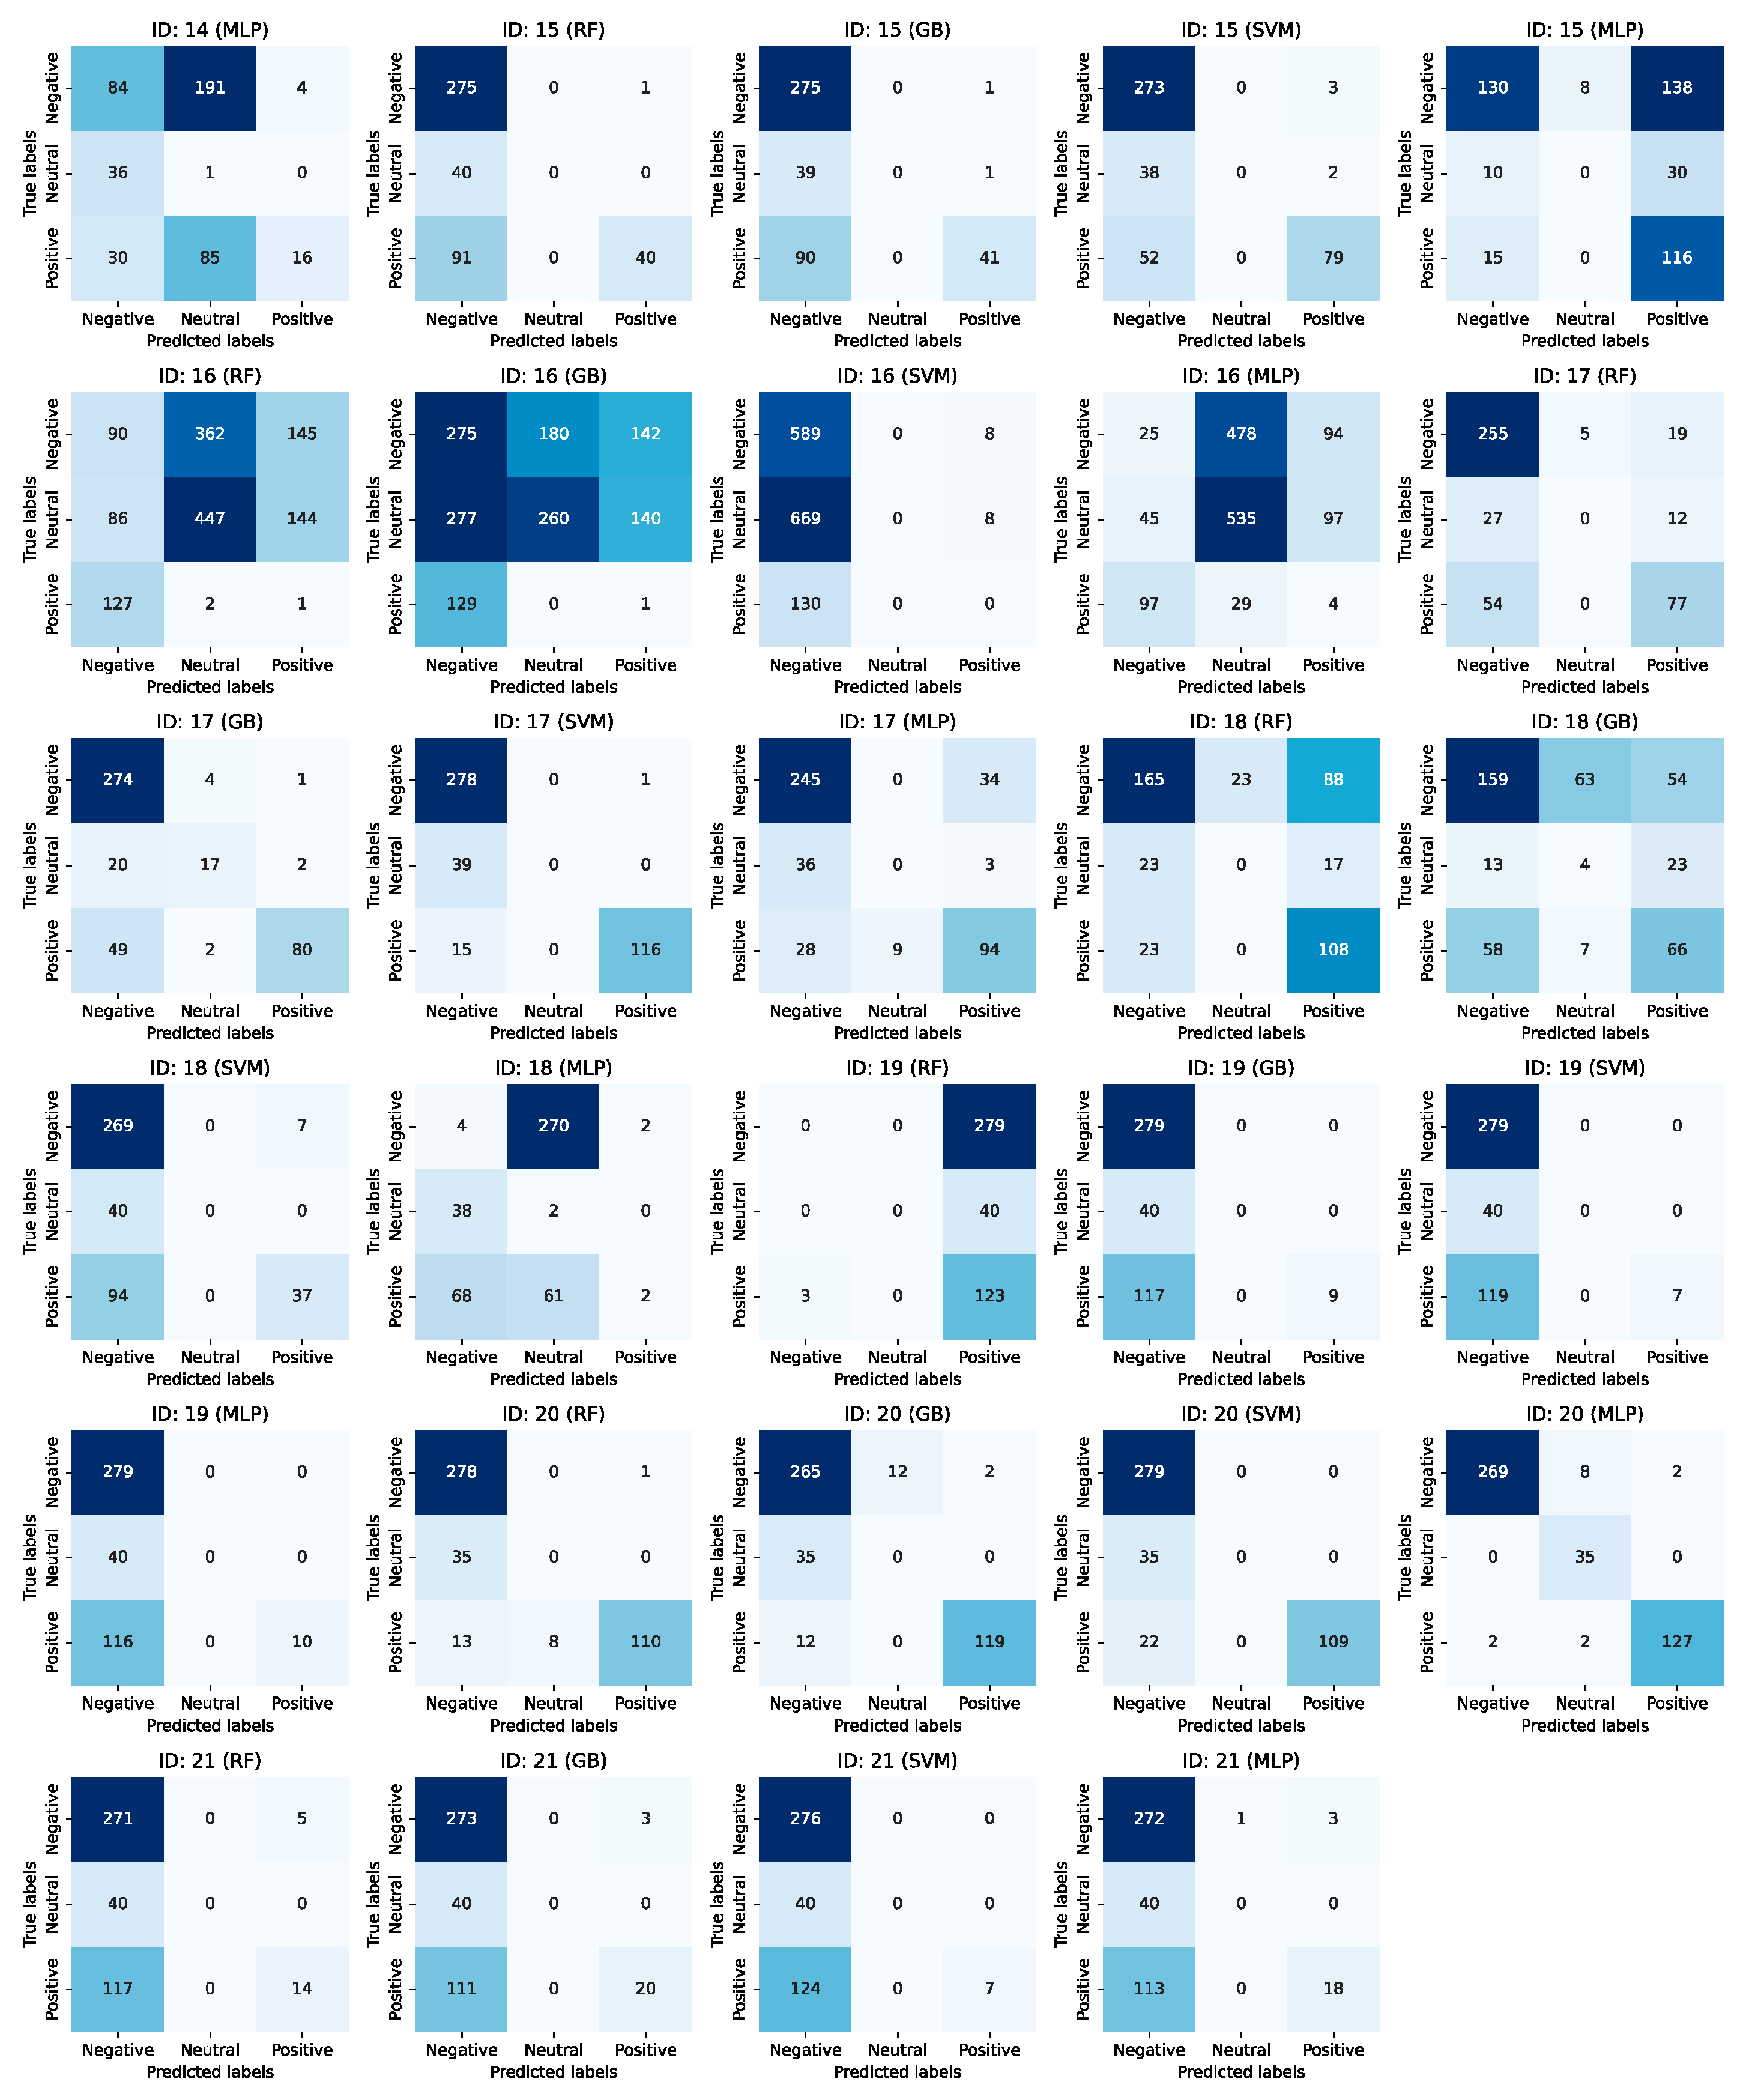
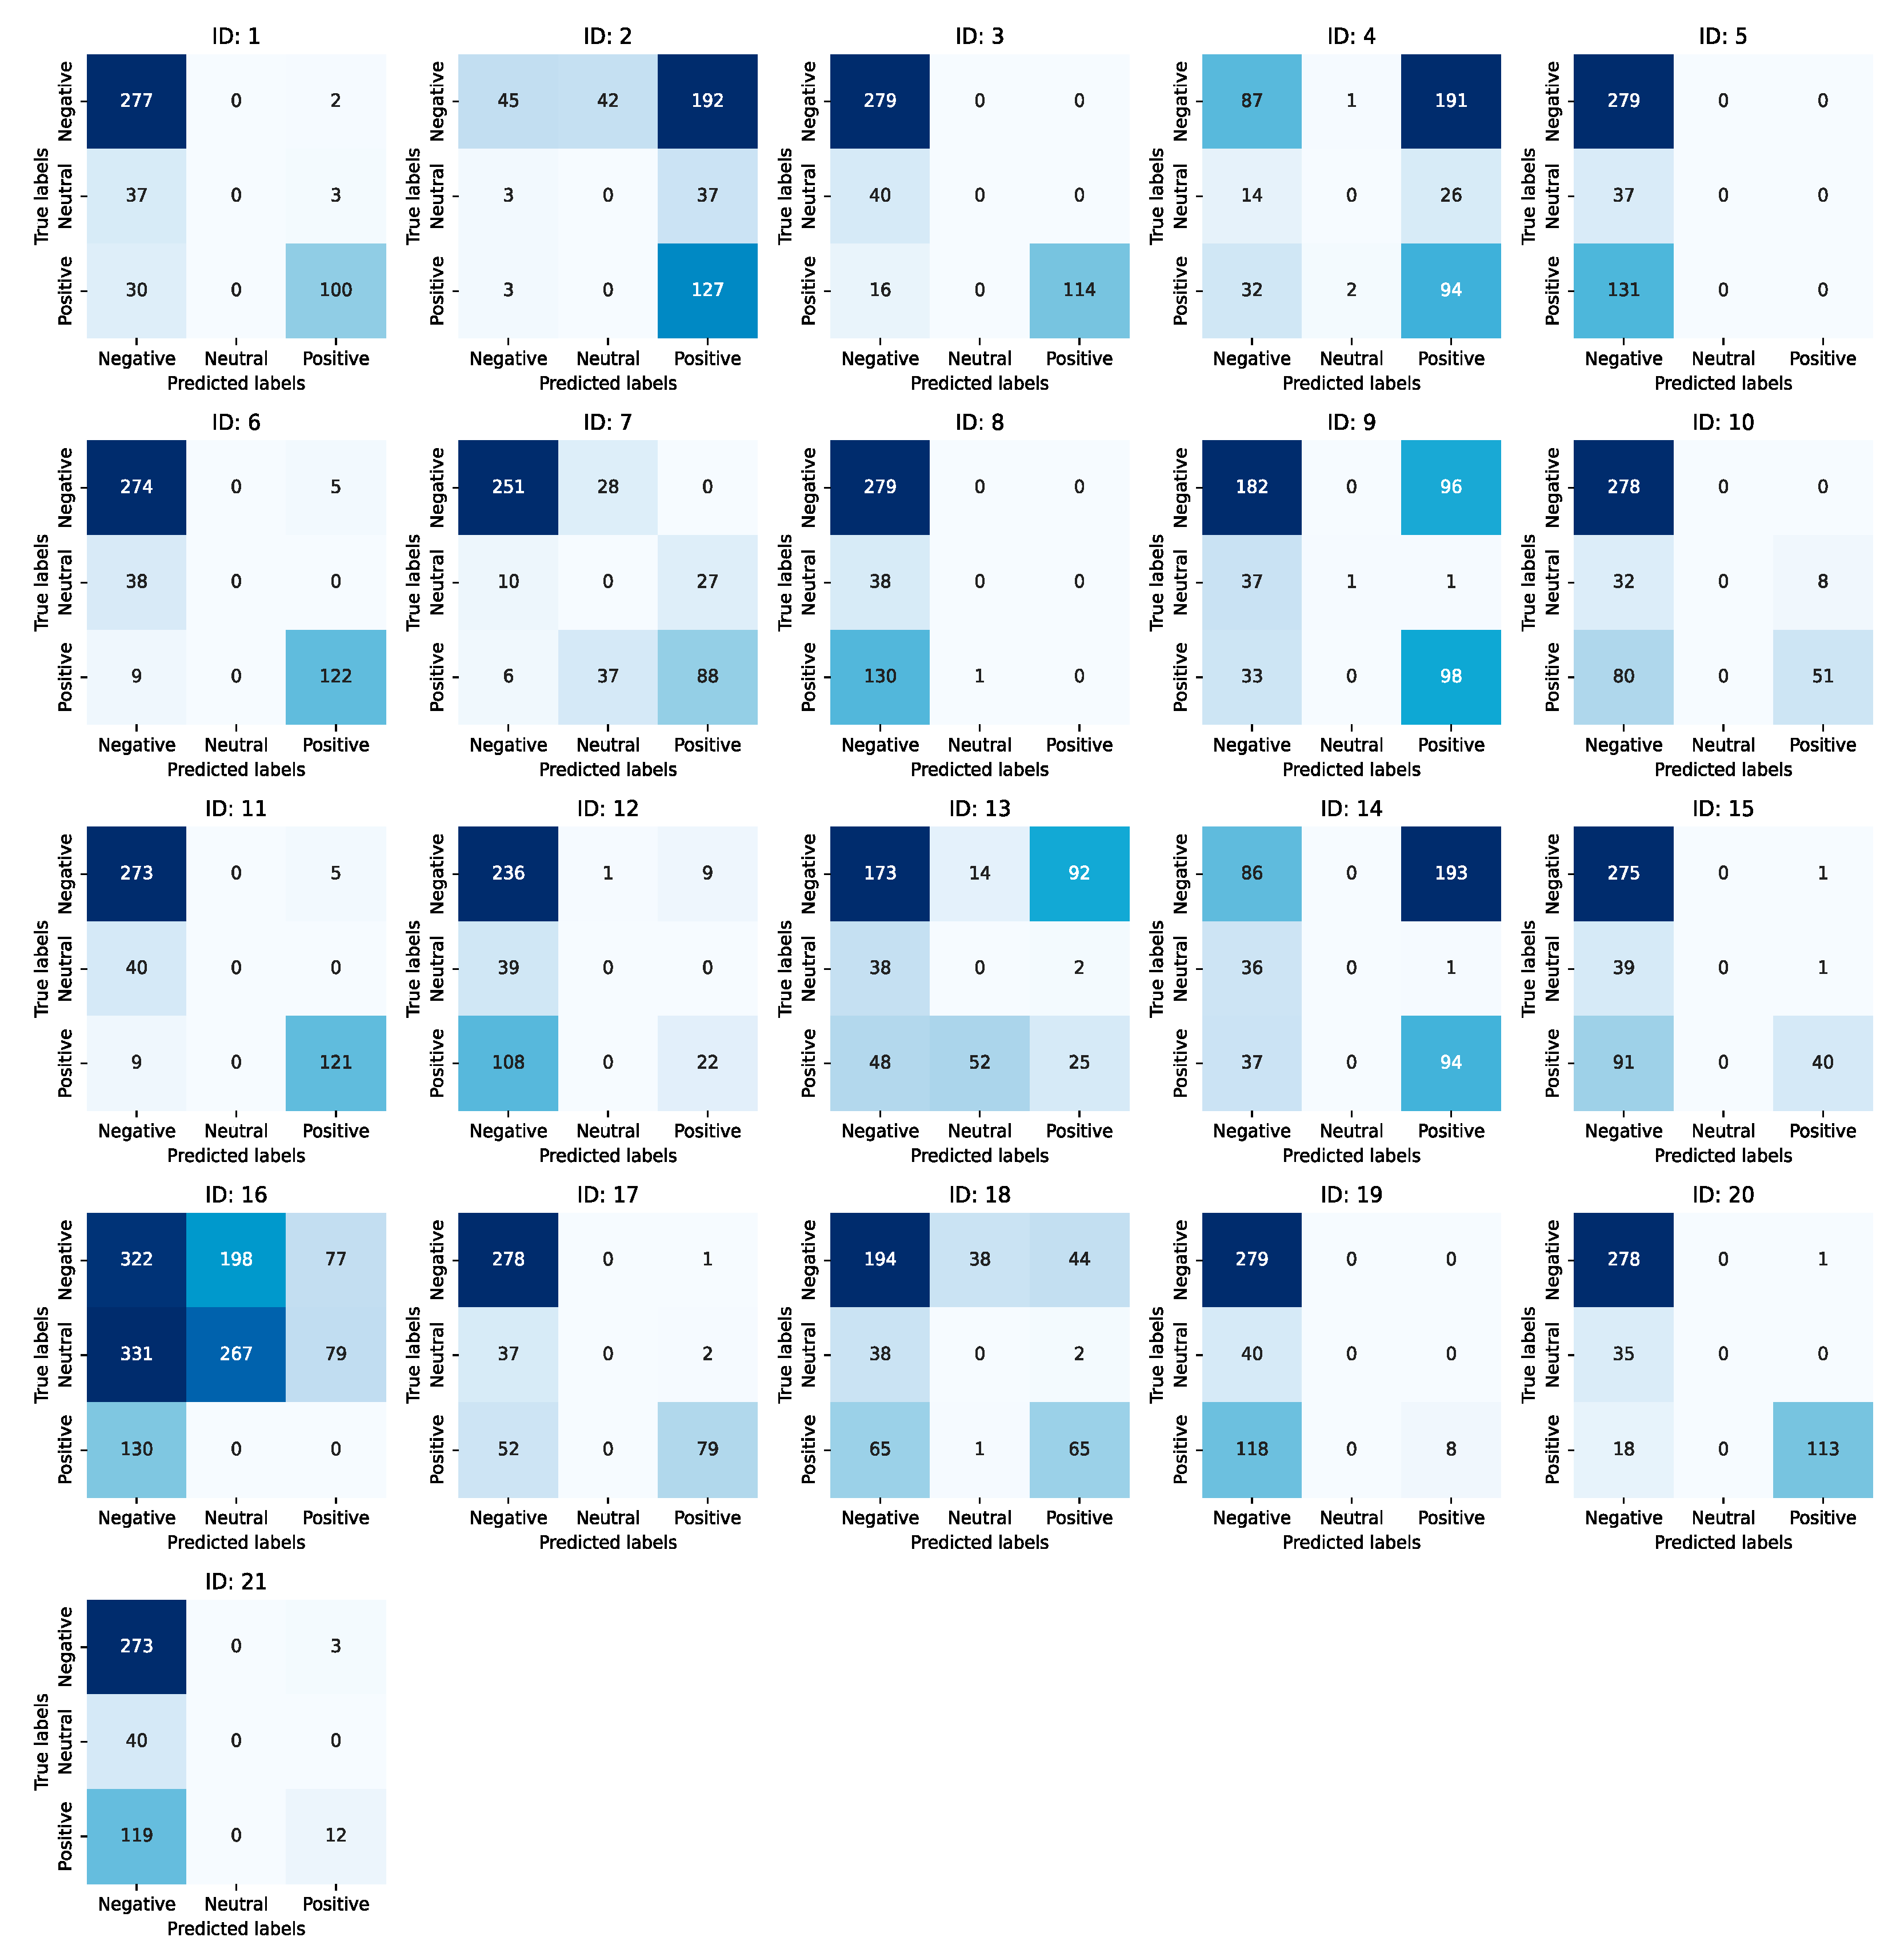
In the context of user-independent models, the SVM model outperformed the others, achieving the highest F1-score of 0.6300 during the elicitation phase. In contrast, the Ensemble model had the lowest F1-score. The confusion matrices for the user-independent models are shown in Figure A2, Figure A3 and Figure A4 (Random Forest, Gradient Boosting, Support Vector Machine, and Multi-Layer Perceptron) and Figure A5 (Ensemble model). These results underscore the importance of developing user-dependent models for improved performance. Our dataset and the findings from this study will serve as valuable resources for future research aiming to improve user-independent model approaches. For our subsequent analysis in the Feedback phase, we saved these trained models.

6.3. Model Testing: Feedback Phase

During the feedback phase, we evaluated the performance of our previously trained top-performing emotion recognition model, specifically the Multi-layer Perceptron (MLP). This assessment was conducted using unseen data that had been collected during the feedback phase of the driving task. The goal was to determine how well the MLP model could generalise and accurately recognise emotions in real-time while the user is driving in order to initiate the optimal feedback modality automatically.
We first merged the feedback landmark data for all participants. We then combined this data with the feedback modality data, which contained information about the order and timestamp of the activated feedback, and trimmed it only to focus on moments of feedback exposure. The merged feedback contained 4124 rows and 1486 columns with 1337 negative data points, 1311 positive ones, and 1440 neutral cases. To set thresholds for positive, negative, and neutral emotions, we analysed the valence distribution of self-reported data. Furthermore, the valence analysis provided a framework for evaluating the model’s performance against self-reported emotion.
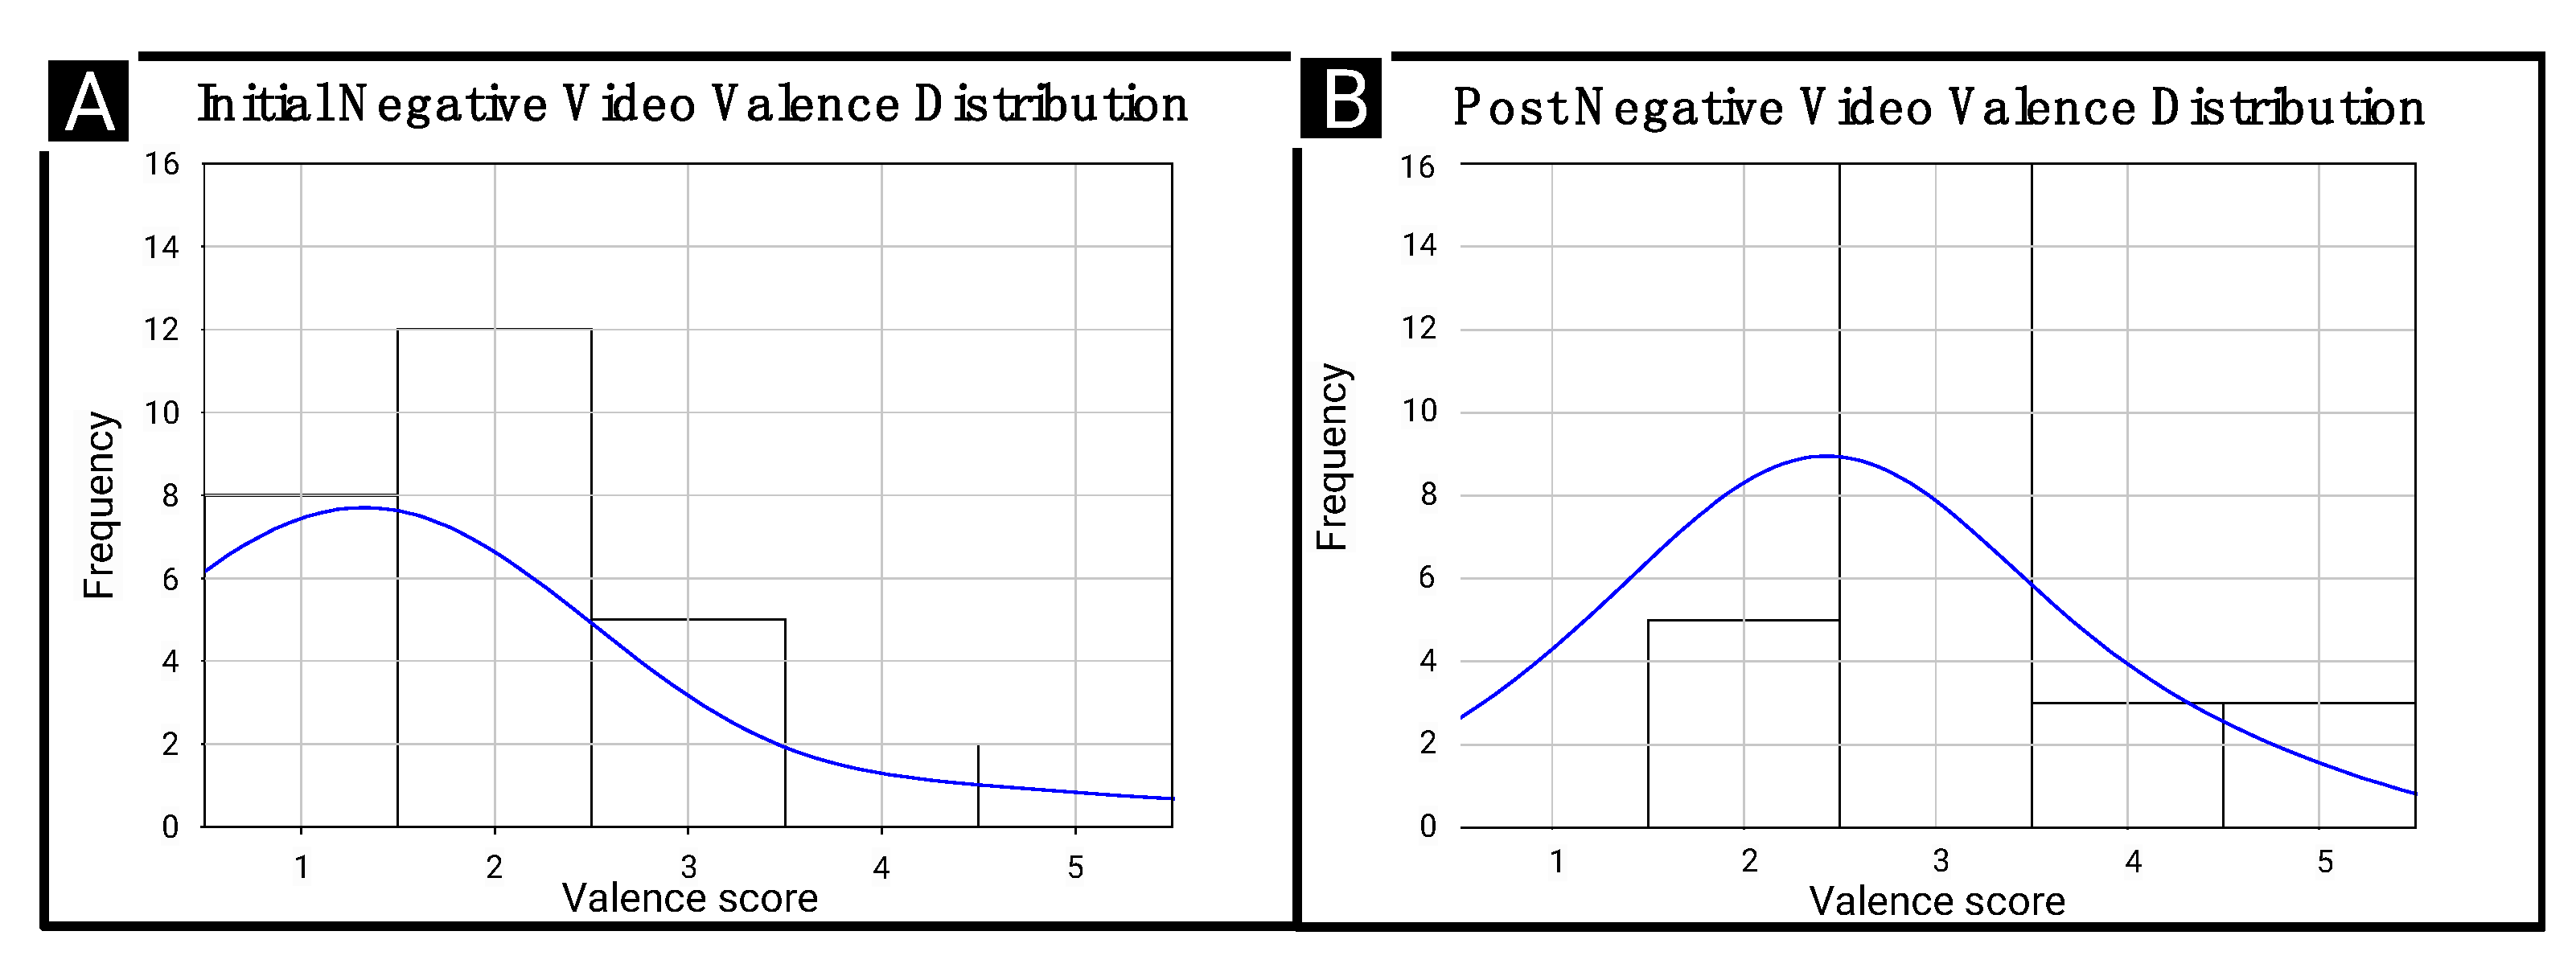
The Initial and Post Negative Video Valence Distributions (cf. Figure 8A,B) showed that the majority of responses for negative videos clustered significantly below a valence score of 2.0, suggesting a natural cutoff point for negative emotions. Consequently, we set the threshold for negative emotions below 2.0.
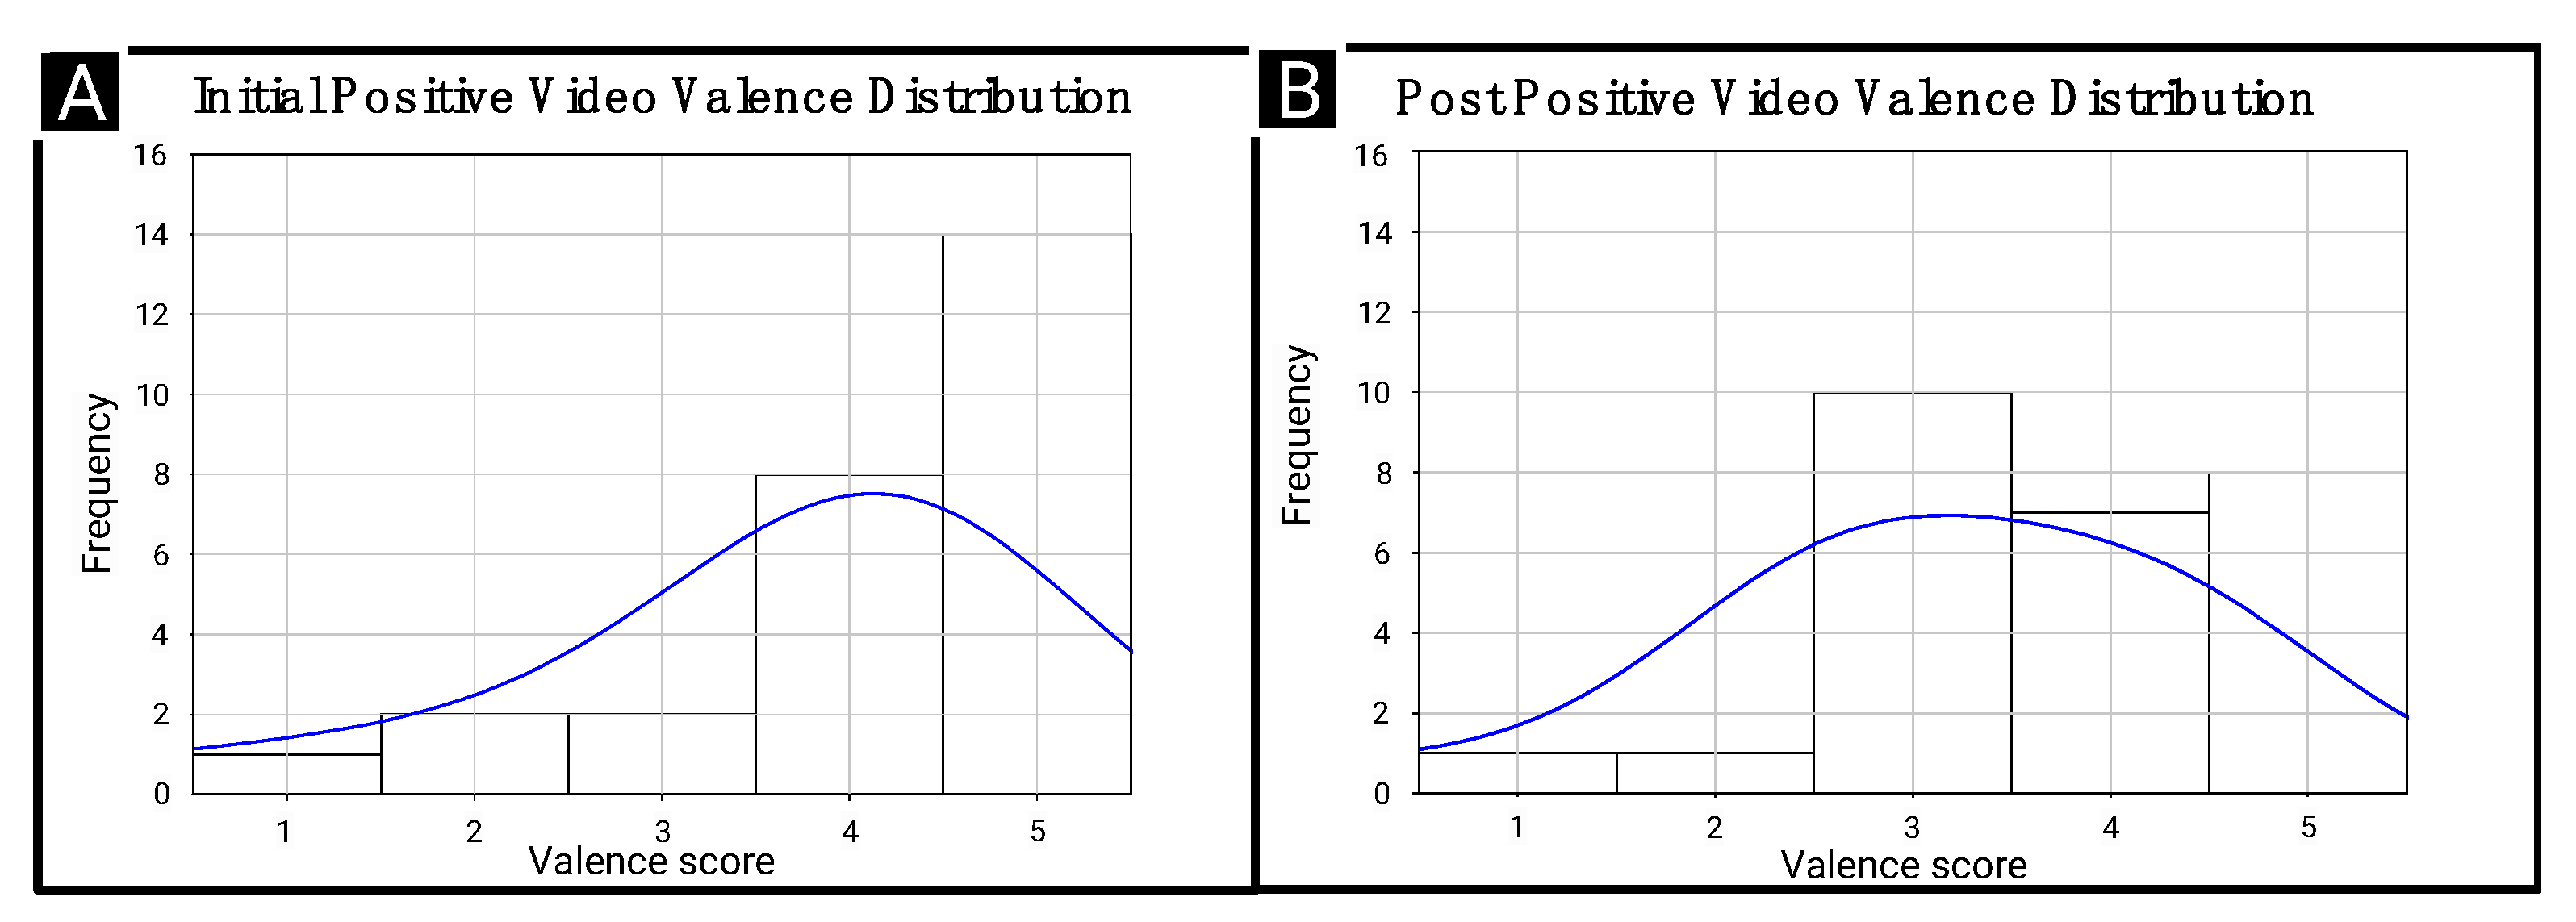
Similarly, the Initial and Post Positive Video Valence Distributions (Figure 9A,B) revealed that responses predominantly clustered above a score of 2.7, indicating a distinct increase in frequency for positive emotions. We set the threshold for positive emotions above 2.7, allowing for the classification of scores distinctly recognised as positive by participants.
The neutral threshold was set between the clearly defined negative and positive ranges, i.e., from 2.0 to 2.7, to align with the observed data patterns and minimise the misclassification of borderline neutral emotions.
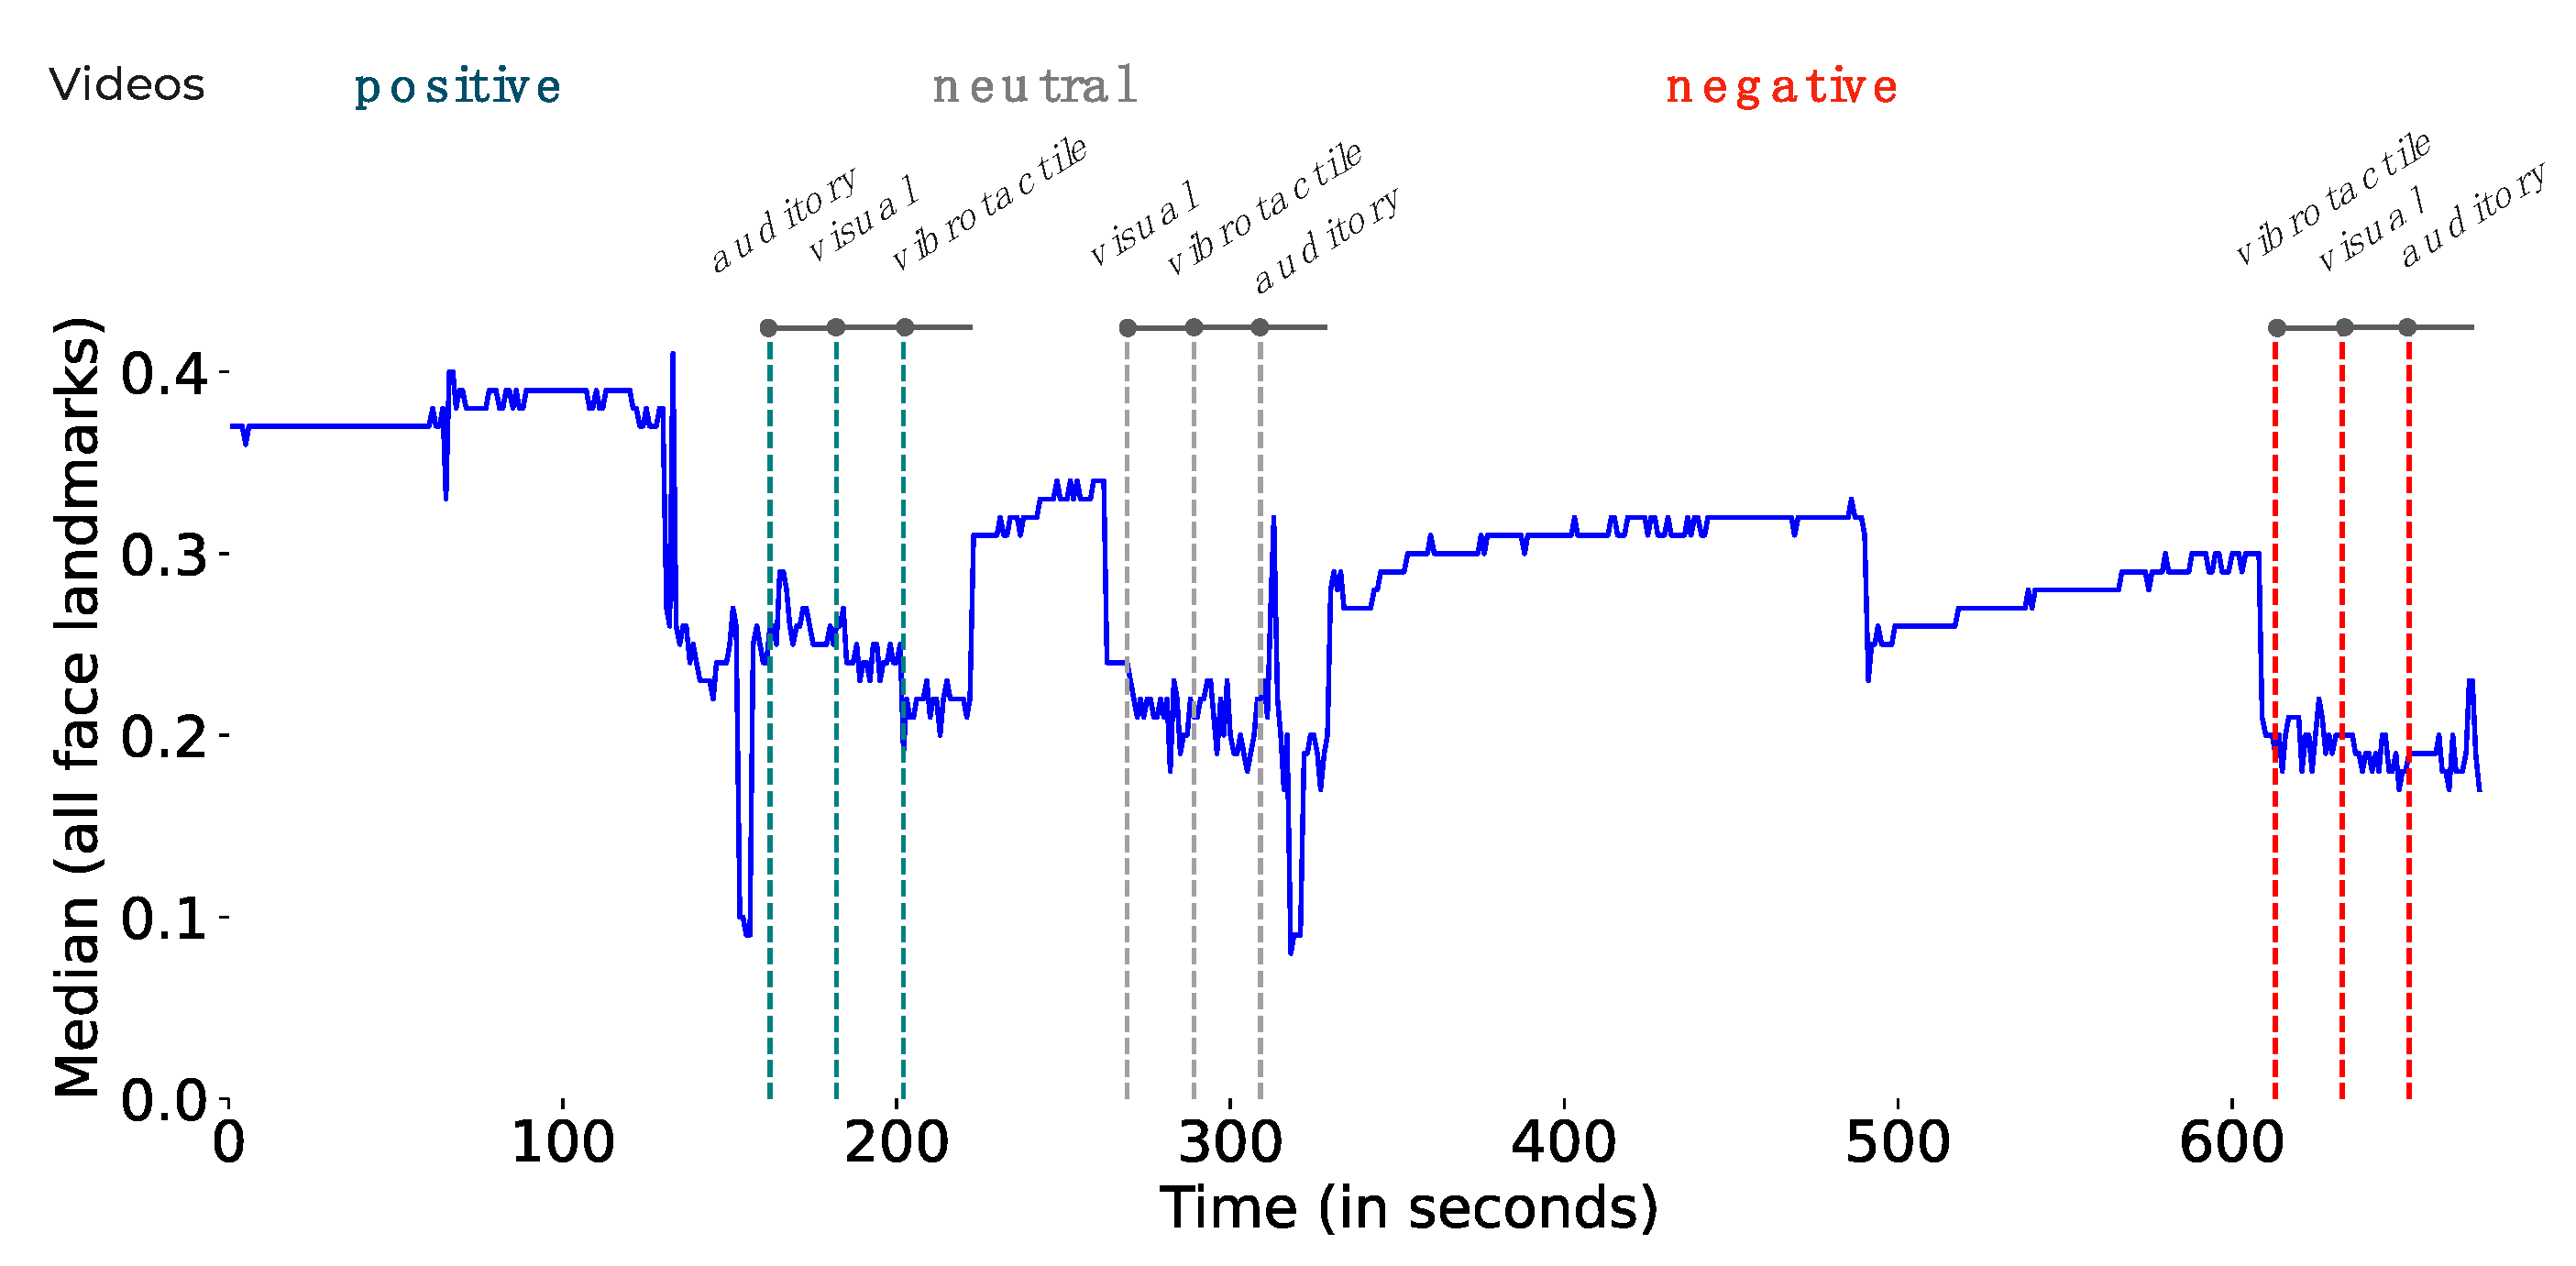
Using these refined thresholds, we tested the saved MLP model to predict the emotion at each feedback cycle, which lasted for 20 s for each feedback. As part of our visual analysis, we calculated the median of all 1486 features at each time point. The median provided a stable reference point for overall facial expressions, reducing the impact of outliers and offering a more stable perspective on the entire set of features and their varying correlations. This broader perspective revealed a significant shift in the overall facial expressions when transitioning from different emotion and feedback phases, as shown in Figure 10. Additionally, this variation in landmarks has strengthened our confidence in classifying emotions using a limited set of 50 selected features during model training.
Our model predicted the emotional state (positive, neutral, or negative) for each data point based on the facial landmark features. We then determined each participant’s overall emotion during the feedback sessions by calculating the mode of the predicted emotions within each group (participant ID and actual video type). To evaluate the MLP model with unseen data, we compared the predicted emotions with the self-reported emotions collected from the participants after each feedback session. The evaluation results revealed that the MLP model achieved an average F1-score of 0.7706.

7. Design Recommendations

Based on insights from the user study, we developed the following design recommendations:
  • D1 (Multimodal Feedback): for the feedback, we propose a combination of visual, auditory, and vibrotactile feedback to cater to individual preferences and enhance the overall effectiveness of the system. The study results indicated that participants had varying preferences for feedback modalities, so a multimodal approach ensures a more inclusive and personalized experience.
  • D2 (Adaptive Feedback According to Emotional State): we also should make sure that we design the feedback system to adapt to the driver’s emotional state in real-time. We should also provide calming and soothing feedback for negative emotions using cool colors and relaxed music. For neutral emotions, we recommend using soft, neutral colors and ambient music to maintain balance. In contrast, we enhance positive emotions with warm, vibrant colors and upbeat music. The study clearly showed that adaptive feedback can significantly enhance the driver’s emotional well-being.
  • D3 (Personalization Options): We should allow drivers to customize the feedback based on their preferences. The study showed that adaptive feedback can significantly enhance the driver’s emotional well-being. Options could include adjusting the intensity of vibrotactile feedback or selecting from various music genres.
  • D4 (Unobtrusive and Non-distracting Feedback): We should also ensure that the feedback is subtle and does not distract or overwhelm the driver—which might be very critical. Some participants in the study found, for instance, strong vibrotactile feedback to be distracting. The feedback should be designed to be unobtrusive and not interfere with the primary task of driving. Therefore, it is crucial to ensure that the feedback does not interfere with driving tasks, as highlighted by the study results.
  • D5 (Context-aware Feedback): We should also consider the driving context when providing feedback. The study indicated that the effectiveness of feedback modalities can vary depending on factors like road conditions, traffic, and time of day. In scenarios such as heavy traffic or challenging conditions, prioritize less distracting feedback like gentle vibrotactile cues or “soft ambient” lighting.
  • D6 (Continuous Improvement through Machine Learning): Finally, we should use machine learning techniques to continuously enhance the emotion recognition model and feedback system as the study demonstrated the potential of using facial landmark data and machine learning algorithms to classify emotional states. By collecting diverse training data and exploring advanced feature engineering, the system can become more robust and accurate in recognizing emotions and providing appropriate feedback.

8. Discussion

This study aimed to investigate the impact of multimodal feedback mechanisms on driver emotions and establish a systematic feedback approach based on real-time emotion detection using facial landmark data. The findings provide valuable insights into the potential of emotion-based feedback systems in enhancing driver well-being and overall driving experience.

8.1. Establishing a Systematic Feedback Approach

The study aimed to establish a systematic feedback approach based on driver emotions and to identify driver-preferred feedback mechanisms through a comparative analysis of the different feedback modalities. The findings demonstrate the effectiveness of emotion-based feedback in enhancing emotional well-being and driving performance within a simulated driving environment. This approach provides a foundation for developing more responsive and adaptive in-car systems that prioritise driver safety, comfort, and emotional well-being.

8.2. Alignment with Previous Research

The results demonstrated that the multimodal feedback interventions significantly influenced drivers’ emotional states. In particular, the Visual Feedback (light) and Auditory Feedback (music) were found to be effective in promoting a calm and positive emotional state, even when negative emotions were initially detected. These findings align with previous research, which highlights the importance of considering driver emotions in the development of adaptive and empathetic in-car systems [2,9]. The comparative analysis of different feedback modalities revealed that participants had varying preferences for the type of feedback they received. Some participants preferred the subtlety of vibrotactile feedback, while others appreciated the effectiveness of Vibrotactile Feedback in grabbing their attention. These diverse preferences underscore the significance of personalisation in emotion-based feedback systems, as individual differences in emotional responses and feedback preferences can greatly influence the acceptance and effectiveness of such systems [47].

8.3. Addressing Research Questions

Our study addressed the research questions by assessing the extent to which in-car feedback systems can impact drivers’ emotional states (Q1), identifying the differences in the effectiveness and user preferences of various feedback modalities (Q2), and exploring the safety measures for conducting road testing of in-car interventions (Q3).
Regarding research Q1, the comparative analysis demonstrated that in-car feedback systems can significantly influence drivers’ emotional states. The multimodal feedback interventions, particularly Visual Feedback (light) and Auditory Feedback (music), were found to be effective in promoting a calm and positive emotional state, even when negative emotions were initially detected. These findings highlight the potential of emotion-based feedback systems in regulating driver emotions and enhancing emotional well-being.
For research Q2, the comparative analysis of different feedback modalities revealed varying levels of effectiveness and user preferences. Visual feedback was perceived as less distracting compared to auditory and vibrotactile feedback, indicating that drivers may find visual cues less disruptive to their primary task of driving. This could be due to the shorter decay time of visual stimuli compared to auditory feedback, but it might also be attributed to the fact that certain animation effects can enhance perception. Furthermore, due to the peripheral positioning of the visual feedback on the simulator windshield, participants perceived its intensity to a lesser extent as their central vision remained absorbed in the imagery of the driving task, which was captivating for most participants. This perception can be enhanced by increasing the light intensity of the visual feedback and augmenting its contrast with the surrounding environment, while also limiting its spread on the windshield surface so that it does not overpower the driver’s view of the road and traffic.
Additionally, participants expressed diverse preferences for the type of feedback they received, emphasising the importance of personalisation in emotion-based feedback systems.
For research Q3, our machine learning pipeline for emotion classification relies on facial landmark data that do not require any additional instruments from the user. This approach allows for safer road testing of in-car interventions since the proposed modalities are already integrated into existing car systems. By using familiar and non-invasive technology, we can minimize distractions and potential risks associated with testing, ensuring a more reliable evaluation of our system in real-world driving scenarios.
The multimodal feedback system, which included visual (light), auditory (music), and vibrotactile feedback, enabled a more comprehensive assessment of driver emotions and the identification of the most effective feedback mechanisms for specific emotional states. The key observations made in this study suggest that the driver’s arousal level was lower after the intervention and that the perceived level of distraction varied depending on the feedback modality.

8.4. Limitations of the Study

Despite the promising findings, the study has several limitations that should be acknowledged and addressed in future research. First, the sample size was medium, which may limit the generalizability of the findings to the broader population of drivers. Future research should aim to recruit a larger and more diverse sample to ensure the robustness and representativeness of the results.
Second, the study was conducted in a simulated driving environment, which may not fully capture the complexities and dynamics of real-world driving situations. While driving simulators provide a controlled and safe setting for experimental research, they may not elicit the same level of emotional responses and behaviours as real-world driving. In real-life conditions, factors such as time of day and weather heavily affect illumination conditions, which can significantly impact the accuracy of the emotion recognition model. For instance, the low sun angle during dawn can create strong shadows and glare, while overcast or rainy weather can lead to diffused and low-contrast lighting. These variations in illumination can significantly impact the efficacy of emotion recognition, as the algorithms may struggle to detect and interpret facial features under challenging lighting conditions accurately. Validating the findings of this study in real-world driving conditions is essential to assess the effectiveness of emotion-based feedback in more naturalistic settings. We strongly believe that a first-person view video from a driver’s perspective, where participants could hold the steering wheel without any interaction, might have been much more beneficial. In other words, higher graphical realism but lower interaction. We observed that some participants simply enjoyed the game-like driving simulator, and we were unsure how this might have negatively influenced the study results.
Third, we believe that a between-subjects design would be far superior, and we encourage researchers facing similar challenges to use this approach instead of a within-subjects design, which requires maintaining an emotional state for a longer period.
Next, while the machine learning approach demonstrated promising results, it is important to acknowledge its limitations. One limitation is the reliance on facial landmark data alone for emotion recognition. Facial expressions are just one aspect of emotional communication, and incorporating additional modalities, such as speech or physiological signals, could provide a more comprehensive understanding of emotional states. Additionally, the potential for biases in the training data should be considered. If the training data are not representative of the diverse range of individuals and emotional expressions, the models may exhibit biases in their predictions. Efforts should be made to collect diverse and balanced training data to mitigate potential biases. We employed Random Forest for feature selection. Future work may explore other advanced feature engineering and dimensionality reduction techniques for potential performance gains.
Furthermore, the study focused on the short-term effects of emotion-based feedback on driver emotions and performance. The long-term impact of such feedback mechanisms on driver behavior, emotional well-being, and overall driving experience remains unclear. Longitudinal studies are needed to investigate the sustainability and potential adaptations of drivers to emotion-based feedback over extended periods.
Additionally, the study did not explicitly address the potential impact of cultural differences on the effectiveness of emotion-based feedback. Cultural background may influence emotional expression, perception, and preferences, and it is essential to consider these factors when designing and implementing emotion-based systems in different cultural contexts [48]. Future research should explore the role of cultural differences in the acceptance and effectiveness of emotion-based feedback to ensure the generalizability of the findings across diverse populations.
Furthermore, the study relied on a specific set of emotion-eliciting video clips and a limited range of feedback modalities. These feedbacks may not capture the full spectrum of emotions [11,49] and preferences experienced by drivers in real-world situations. Future studies should incorporate a wider variety of emotion-eliciting stimuli and feedback modalities to gain a more comprehensive understanding of driver emotions and preferences.
Lastly, based on the evaluation results and insights gained during the post-evaluation process, we will consider refinements to the models and the overall emotion recognition system. These refinements could include hyperparameter adjustments while training the models, adjusting the classification thresholds, incorporating additional features or modalities, or exploring alternative machine-learning algorithms to enhance performance.
Future studies will consider incorporating these and a wider variety of emotion-eliciting stimuli and feedback modalities to gain a more comprehensive understanding of driver emotions and preferences. By addressing these limitations, future research can build upon the findings of the present study and contribute to the development of more robust and adaptive emotion-based systems in the automotive industry.

9. Conclusions and Future Work

This study examined the potential of in-car feedback systems to enhance driver emotional states and road safety. We investigated various feedback modalities and their impact on user emotions in a simulated driving environment (n = 21). The results demonstrate that in-car feedback can effectively influence driver emotions, with participants reporting positive experiences and preferences for specific feedback types based on their emotional state. Moreover, the machine learning-based emotion recognition system using facial expressions indicates the technical feasibility for a personalised feedback system.
The study’s findings emphasise the potential of personalised feedback systems to enhance driver well-being and the overall driving experience. These findings can be used to guide designers and car manufacturers to develop more responsive and adaptive in-car systems. These systems should prioritise driver safety, comfort, and emotional well-being to create more personalised and context-aware feedback systems that enhance driver well-being and safety.

Author Contributions

Conceptualization, K.F.M., R.B., A.A., A.D.A., A.S. and M.H.; methodology, A.S. and M.H.; software, K.F.M.; investigation, M.H., A.A. and R.B.; resources, M.H.; writing—original draft preparation, K.F.M. and A.S.; writing—review and editing, K.F.M. and M.H.; review and editing, R.B., A.S., A.D.A. and R.B.; supervision, M.H.; funding acquisition, M.H. and A.D.A.; Project administration, M.H. All authors have read and agreed to the published version of the manuscript.

Funding

This work was funded by the BMW Group and the European Union Next-Generation EU (Piano Nazionale di Ripresa e Resilienza (PNRR)—Missione 4 Componente 2, Investimento 3.3—Decreto del Ministero dell’Universita e della Ricerca n.352 del 9 April 2022). This manuscript reflects only the authors’ views and opinions, neither the BMW Group nor the European Union or the European Commission can be considered responsible for them.

Institutional Review Board Statement

The study was conducted in accordance with the Declaration of Helsinki and approved by the Ethics Committee of the Free University of Bozen-Bolzano (protocol code UNIBZ_ENG_EIETMS_2024_18).

Informed Consent Statement

Informed consent was obtained from all subjects involved in the study.

Data Availability Statement

The data presented in this study are available on request from the corresponding author.

Conflicts of Interest

The authors declare no conflicts of interest.

Appendix A

Figure A1. User dependent confusion matrix for the four models (Random Forest, Gradient Boosting, Support Vector Machine, Multi-Layer Perceptron, Ensembler).
Mti 08 00054 g0a1
Figure A2. User-independent confusion matrix for the four models (Random Forest, Gradient Boosting, Support Vector Machine, Multi Layer Perceptron) for participant one to seven.
Mti 08 00054 g0a2
Figure A3. User-independent confusion matrix for the four models (Random Forest, Gradient Boosting, Support Vector Machine, Multi Layer Perceptron) for participants seven to fourteen.
Mti 08 00054 g0a3
Figure A4. User independent confusion matrix for the four models (Random Forest, Gradient Boosting, Support Vector Machine, Multi Layer Perceptron) for participant fourteen to twenty-one.
Mti 08 00054 g0a4
Figure A5. User independent confusion matrix for the ensemble model for all the participants.
Mti 08 00054 g0a5

References

  1. Staiano, J.; Menéndez, M.; Battocchi, A.; De Angeli, A.; Sebe, N. UX_Mate: From Facial Expressions to UX Evaluation. In Proceedings of the Designing Interactive Systems Conference, Newcastle Upon Tyne, UK, 11–15 June 2012; ACM: New York, NY, USA, 2012; pp. 741–750. [Google Scholar]
  2. Xiao, H.; Li, W.; Zeng, G.; Wu, Y.; Xue, J.; Zhang, J.; Li, C.; Guo, G. On-Road Driver Emotion Recognition Using Facial Expression. Appl. Sci. 2022, 12, 807. [Google Scholar] [CrossRef]
  3. Kosch, T.; Hassib, M.; Reutter, R.; Alt, F. Emotions on the Go: Mobile Emotion Assessment in Real-Time Using Facial Expressions. In Proceedings of the International Conference on Advanced Visual Interfaces, Salerno, Italy, 28 September–2 October 2020; ACM: New York, NY, USA, 2020; pp. 1–9. [Google Scholar]
  4. Antoniou, N.; Katsamanis, A.; Giannakopoulos, T.; Narayanan, S. Designing and Evaluating Speech Emotion Recognition Systems: A Reality Check Case Study with IEMOCAP. In Proceedings of the ICASSP 2023—2023 IEEE International Conference on Acoustics, Speech and Signal Processing (ICASSP), Rhodes Island, Greece, 4–10 June 2023; pp. 1–5. [Google Scholar]
  5. Hashem, A.; Arif, M.; Alghamdi, M. Speech Emotion Recognition Approaches: A Systematic Review. Speech Commun. 2023, 154, 102974. [Google Scholar] [CrossRef]
  6. Tscharn, R.; Latoschik, M.E.; Löffler, D.; Hurtienne, J. “Stop over There”: Natural Gesture and Speech Interaction for Non-Critical Spontaneous Intervention in Autonomous Driving. In Proceedings of the 19th ACM International Conference on Multimodal Interaction, Glasgow, UK, 13–17 November 2017; pp. 91–100. [Google Scholar] [CrossRef]
  7. Dobbins, C.; Fairclough, S. Detecting Negative Emotions during Real-Life Driving via Dynamically Labelled Physiological Data. In Proceedings of the 2018 IEEE International Conference on Pervasive Computing and Communications Workshops (PerCom Workshops), Athens, Greece, 19–23 March 2018; IEEE: Piscataway, NJ, USA, 2018; pp. 830–835. [Google Scholar]
  8. Healey, J.A.; Picard, R.W. Detecting Stress during Real-World Driving Tasks Using Physiological Sensors. IEEE Trans. Intell. Transp. Syst. 2005, 6, 156–166. [Google Scholar] [CrossRef]
  9. Zepf, S.; Dittrich, M.; Hernandez, J.; Schmitt, A. Towards Empathetic Car Interfaces: Emotional Triggers While Driving. In Proceedings of the Extended Abstracts of the 2019 CHI Conference on Human Factors in Computing Systems, Glasgow, UK, 4–9 May 2019; ACM: New York, NY, USA, 2019; pp. 1–6. [Google Scholar]
  10. Damasio, A.R. Emotions and Feelings; Cambridge University Press: Cambridge, UK, 2004; Volume 5, pp. 49–57. [Google Scholar]
  11. Wagener, N.; Niess, J.; Rogers, Y.; Schöning, J. Mood Worlds: A Virtual Environment for Autonomous Emotional Expression. In Proceedings of the CHI Conference on Human Factors in Computing Systems, New Orleans, LA, USA, 29 April–5 May 2022; ACM: New York, NY, USA, 2022; pp. 1–16. [Google Scholar]
  12. Russell, J.A. A Circumplex Model of Affect. J. Pers. Soc. Psychol. 1980, 39, 1161–1178. [Google Scholar] [CrossRef]
  13. Ekkekakis, P.; Russell, J.A. The Measurement of Affect, Mood, and Emotion: A Guide for Health-Behavioral Research, 1st ed.; Cambridge University Press: Cambridge, UK, 2013; ISBN 978-1-107-64820-3. [Google Scholar]
  14. Ayoub, J.; Zhou, F.; Bao, S.; Yang, X.J. From Manual Driving to Automated Driving: A Review of 10 Years of AutoUI. In Proceedings of the 11th International Conference on Automotive User Interfaces and Interactive Vehicular Applications, Utrecht, The Netherlands, 21–25 September 2019; ACM: New York, NY, USA, 2019; pp. 70–90. [Google Scholar]
  15. Mehrabian, A.; Russell, J.A. An Approach to Environmental Psychology; MIT Press: Cambridge, MA, USA, 1974; ISBN 0-262-13090-4. [Google Scholar]
  16. Plutchik, R. The Nature of Emotions: Human Emotions Have Deep Evolutionary Roots, a Fact That May Explain Their Complexity and Provide Tools for Clinical Practice. Am. Sci. 2001, 89, 344–350. [Google Scholar] [CrossRef]
  17. Bradley, M.M.; Greenwald, M.K.; Petry, M.C.; Lang, P.J. Remembering Pictures: Pleasure and Arousal in Memory. J. Exp. Psychol. Learn. Mem. Cogn. 1992, 18, 379–390. [Google Scholar] [CrossRef] [PubMed]
  18. Watson, D.; Clark, L.A.; Tellegen, A. Development and Validation of Brief Measures of Positive and Negative Affect: The PANAS Scales. J. Pers. Soc. Psychol. 1988, 54, 1063–1070. [Google Scholar] [CrossRef] [PubMed]
  19. Bradley, M.M.; Lang, P.J. Measuring Emotion: The Self-Assessment Manikin and the Semantic Differential. J. Behav. Ther. Exp. Psychiatry 1994, 25, 49–59. [Google Scholar] [CrossRef] [PubMed]
  20. Dillen, N.; Ilievski, M.; Law, E.; Nacke, L.E.; Czarnecki, K.; Schneider, O. Keep Calm and Ride Along: Passenger Comfort and Anxiety as Physiological Responses to Autonomous Driving Styles. In Proceedings of the 2020 CHI Conference on Human Factors in Computing Systems, Honolulu, HI, USA, 25–30 April 2020; ACM: New York, NY, USA, 2020; pp. 1–13. [Google Scholar]
  21. Hayashi, E.C.S.; Posada, J.E.G.; Maike, V.R.M.L.; Baranauskas, M.C.C. Exploring New Formats of the Self-Assessment Manikin in the Design with Children. In Proceedings of the 15th Brazilian Symposium on Human Factors in Computing Systems, São Paulo, Brazil, 4–7 October 2016; ACM: New York, NY, USA, 2016; pp. 1–10. [Google Scholar]
  22. Wampfler, R.; Klingler, S.; Solenthaler, B.; Schinazi, V.R.; Gross, M.; Holz, C. Affective State Prediction from Smartphone Touch and Sensor Data in the Wild. In Proceedings of the CHI Conference on Human Factors in Computing Systems, New Orleans, LA, USA, 29 April–5 May 2022; ACM: New York, NY, USA, 2022; pp. 1–14. [Google Scholar]
  23. Ma, Z.; Mahmoud, M.; Robinson, P.; Dias, E.; Skrypchuk, L. Automatic Detection of a Driver’s Complex Mental States. In Computational Science and Its Applications—ICCSA 2017, Proceedings of the 17th International Conference, Trieste, Italy, 3–6 July 2017; Gervasi, O., Murgante, B., Misra, S., Borruso, G., Torre, C.M., Rocha, A.M.A.C., Taniar, D., Apduhan, B.O., Stankova, E., Cuzzocrea, A., Eds.; Lecture Notes in Computer Science; Springer International Publishing: Cham, Switzeralnd, 2017; Volume 10406, pp. 678–691. ISBN 978-3-319-62397-9. [Google Scholar]
  24. Paschero, M.; Del Vescovo, G.; Benucci, L.; Rizzi, A.; Santello, M.; Fabbri, G.; Mascioli, F.M.F. A Real Time Classifier for Emotion and Stress Recognition in a Vehicle Driver. In Proceedings of the 2012 IEEE International Symposium on Industrial Electronics, Hangzhou, China, 28–31 May 2012; IEEE: Piscataway, NJ, USA, 2012; pp. 1690–1695. [Google Scholar]
  25. Tawari, A.; Trivedi, M.M. Speech Emotion Analysis: Exploring the Role of Context. IEEE Trans. Multimed. 2010, 12, 502–509. [Google Scholar] [CrossRef]
  26. Grimm, M.; Kroschel, K.; Harris, H.; Nass, C.; Schuller, B.; Rigoll, G.; Moosmayr, T. On the Necessity and Feasibility of Detecting a Driver’s Emotional State While Driving. In Affective Computing and Intelligent Interaction; Paiva, A.C.R., Prada, R., Picard, R.W., Eds.; Lecture Notes in Computer Science; Springer: Berlin/Heidelberg, Germany, 2007; Volume 4738, pp. 126–138. ISBN 978-3-540-74888-5. [Google Scholar]
  27. Hoch, S.; Althoff, F.; McGlaun, G.; Rigoll, G. Bimodal Fusion of Emotional Data in an Automotive Environment. In Proceedings of the Proceedings. (ICASSP ’05). IEEE International Conference on Acoustics, Speech, and Signal Processing, Philadelphia, PA, USA, 23 March 2005; IEEE: Piscataway, NJ, USA, 2005; Volume 2, pp. 1085–1088. [Google Scholar]
  28. Rigas, G.; Goletsis, Y.; Fotiadis, D.I. Real-Time Driver’s Stress Event Detection. IEEE Trans. Intell. Transp. Syst. 2012, 13, 221–234. [Google Scholar] [CrossRef]
  29. Paredes, P.E.; Ordonez, F.; Ju, W.; Landay, J.A. Fast & Furious: Detecting Stress with a Car Steering Wheel. In Proceedings of the 2018 CHI Conference on Human Factors in Computing Systems, Montreal, QC, Canada, 21–26 April 2018; ACM: New York, NY, USA, 2018; pp. 1–12. [Google Scholar]
  30. Taib, R.; Tederry, J.; Itzstein, B. Quantifying Driver Frustration to Improve Road Safety. In Proceedings of the CHI’14 Extended Abstracts on Human Factors in Computing Systems, Toronto, ON, Canada, 26 April 2014; ACM: New York, NY, USA, 2014; pp. 1777–1782. [Google Scholar]
  31. Zepf, S.; Hernandez, J.; Schmitt, A.; Minker, W.; Picard, R.W. Driver Emotion Recognition for Intelligent Vehicles: A Survey. ACM Comput. Surv. 2020, 53, 64. [Google Scholar] [CrossRef]
  32. Fakhrhosseini, S.M.; Landry, S.; Tan, Y.Y.; Bhattarai, S.; Jeon, M. If You’re Angry, Turn the Music on: Music Can Mitigate Anger Effects on Driving Performance. In Proceedings of the 6th International Conference on Automotive User Interfaces and Interactive Vehicular Applications, Seattle, WA, USA, 17–19 September 2014; ACM: New York, NY, USA, 2014; pp. 1–7. [Google Scholar]
  33. Lee, J.; Elhaouij, N.; Picard, R.W. AmbientBreath: Unobtrusive Just-in-Time Breathing Intervention Using Multi-Sensory Stimulation and Its Evaluation in a Car Simulator. Proc. ACM Interact. Mob. Wearable Ubiquitous Technol. 2021, 5, 71. [Google Scholar] [CrossRef]
  34. Balters, S.; Gowda, N.; Ordonez, F.; Paredes, P. Individualized Stress Detection Using an Unmodified Car Steering Wheel. Sci. Rep. 2021, 11, 20646. [Google Scholar] [CrossRef] [PubMed]
  35. Paredes, P.E.; Zhou, Y.; Hamdan, N.A.-H.; Balters, S.; Murnane, E.; Ju, W.; Landay, J.A. Just Breathe: In-Car Interventions for Guided Slow Breathing. Proc. ACM Interact. Mob. Wearable Ubiquitous Technol. 2018, 2, 28. [Google Scholar] [CrossRef]
  36. Choi, K.Y.; Lee, J.; ElHaouij, N.; Picard, R.; Ishii, H. aSpire: Clippable, Mobile Pneumatic-Haptic Device for Breathing Rate Regulation via Personalizable Tactile Feedback. In Proceedings of the Extended Abstracts of the 2021 CHI Conference on Human Factors in Computing Systems, Yokohama, Japan, 8–13 May 2021; ACM: New York, NY, USA, 2021; pp. 1–8. [Google Scholar]
  37. Lee, J.-H.; Spence, C. Assessing the Benefits of Multimodal Feedback on Dual-Task Performance under Demanding Conditions. In Proceedings of the People and Computers XXII Culture, Creativity, Interaction (HCI), Liverpool, UK, 1–5 September 2008. [Google Scholar]
  38. Roumen, T.; Perrault, S.T.; Zhao, S. NotiRing: A Comparative Study of Notification Channels for Wearable Interactive Rings. In Proceedings of the 33rd Annual ACM Conference on Human Factors in Computing Systems, Seoul, Republic of Korea, 18–23 April 2015; ACM: New York, NY, USA, 2015; pp. 2497–2500. [Google Scholar]
  39. Schaefer, A.; Nils, F.; Sanchez, X.; Philippot, P. Assessing the effectiveness of a large database of emotion-eliciting films: A new tool for emotion researchers. Cognit. Emot. 2010, 24, 1153–1172. [Google Scholar] [CrossRef]
  40. Juckel, G.; Mergl, R.; Brüne, M.; Villeneuve, I.; Frodl, T.; Schmitt, G.; Zetzsche, T.; Leicht, G.; Karch, S.; Mulert, C.; et al. Is evaluation of humorous stimuli associated with frontal cortex morphology? A pilot study using facial micro-movement analysis and MRI. Cortex 2011, 47, 569–574. [Google Scholar] [CrossRef] [PubMed]
  41. Wilson, G.; Davidson, G.; Brewster, S.A. In the Heat of the Moment: Subjective Interpretations of Thermal Feedback During Interaction. In Proceedings of the Proceedings of the 33rd Annual ACM Conference on Human Factors in Computing Systems, Seoul, Republic of Korea, 18 April 2015; ACM: New York, NY, USA, 2015; pp. 2063–2072. [Google Scholar] [CrossRef]
  42. Ju, Y.; Zheng, D.; Hynds, D.; Chernyshov, G.; Kunze, K.; Minamizawa, K. Haptic Empathy: Conveying Emotional Meaning through Vibrotactile Feedback. In Proceedings of the Extended Abstracts of the 2021 CHI Conference on Human Factors in Computing Systems, Yokohama, Japan, 8 May 2021; ACM: New York, NY, USA, 2021; pp. 1–7. [Google Scholar] [CrossRef]
  43. Wilson, G.; Dobrev, D.; Brewster, S.A. Hot Under the Collar: Mapping Thermal Feedback to Dimensional Models of Emotion. In Proceedings of the Proceedings of the 2016 CHI Conference on Human Factors in Computing Systems, San Jose, CA, USA, 7 May 2016; ACM: New York, NY, USA, 2016; pp. 4838–4849. [Google Scholar] [CrossRef]
  44. Elliot, A.J.; Maier, M.A. Color and Psychological Functioning. Curr. Dir. Psychol. Sci. 2007, 16, 250–254. [Google Scholar] [CrossRef]
  45. Juslin, P.N. Handbook of Music and Emotion: Theory, Research, Applications; Oxford University Press: Oxford, UK, 1993; ISBN 978-0-19-923014-3. [Google Scholar]
  46. Thoma, M.V.; La Marca, R.; Brönnimann, R.; Finkel, L.; Ehlert, U.; Nater, U.M. The Effect of Music on the Human Stress Response. PLoS ONE 2013, 8, e70156. [Google Scholar] [CrossRef] [PubMed]
  47. Thürmel, V. I Know How You Feel: An Investigation of Users’ Trust in Emotion-Based Personalization Systems. In AMCIS 2021 Proceedings; Association for Information Systems: Atlanta, GA, USA, 2021; p. 9. [Google Scholar]
  48. Pugh, Z.H.; Choo, S.; Leshin, J.C.; Lindquist, K.A.; Nam, C.S. Emotion depends on context, culture, and their interaction: Evidence from effective connectivity. Soc. Cogn. Affect. Neurosci. 2022, 17, 206–217. [Google Scholar] [CrossRef] [PubMed]
  49. Cowen, A.S.; Keltner, D. Self-report captures 27 distinct categories of emotion bridged by continuous gradients. Proc. Natl. Acad. Sci. USA 2017, 114, E7900–E7909. [Google Scholar] [CrossRef]
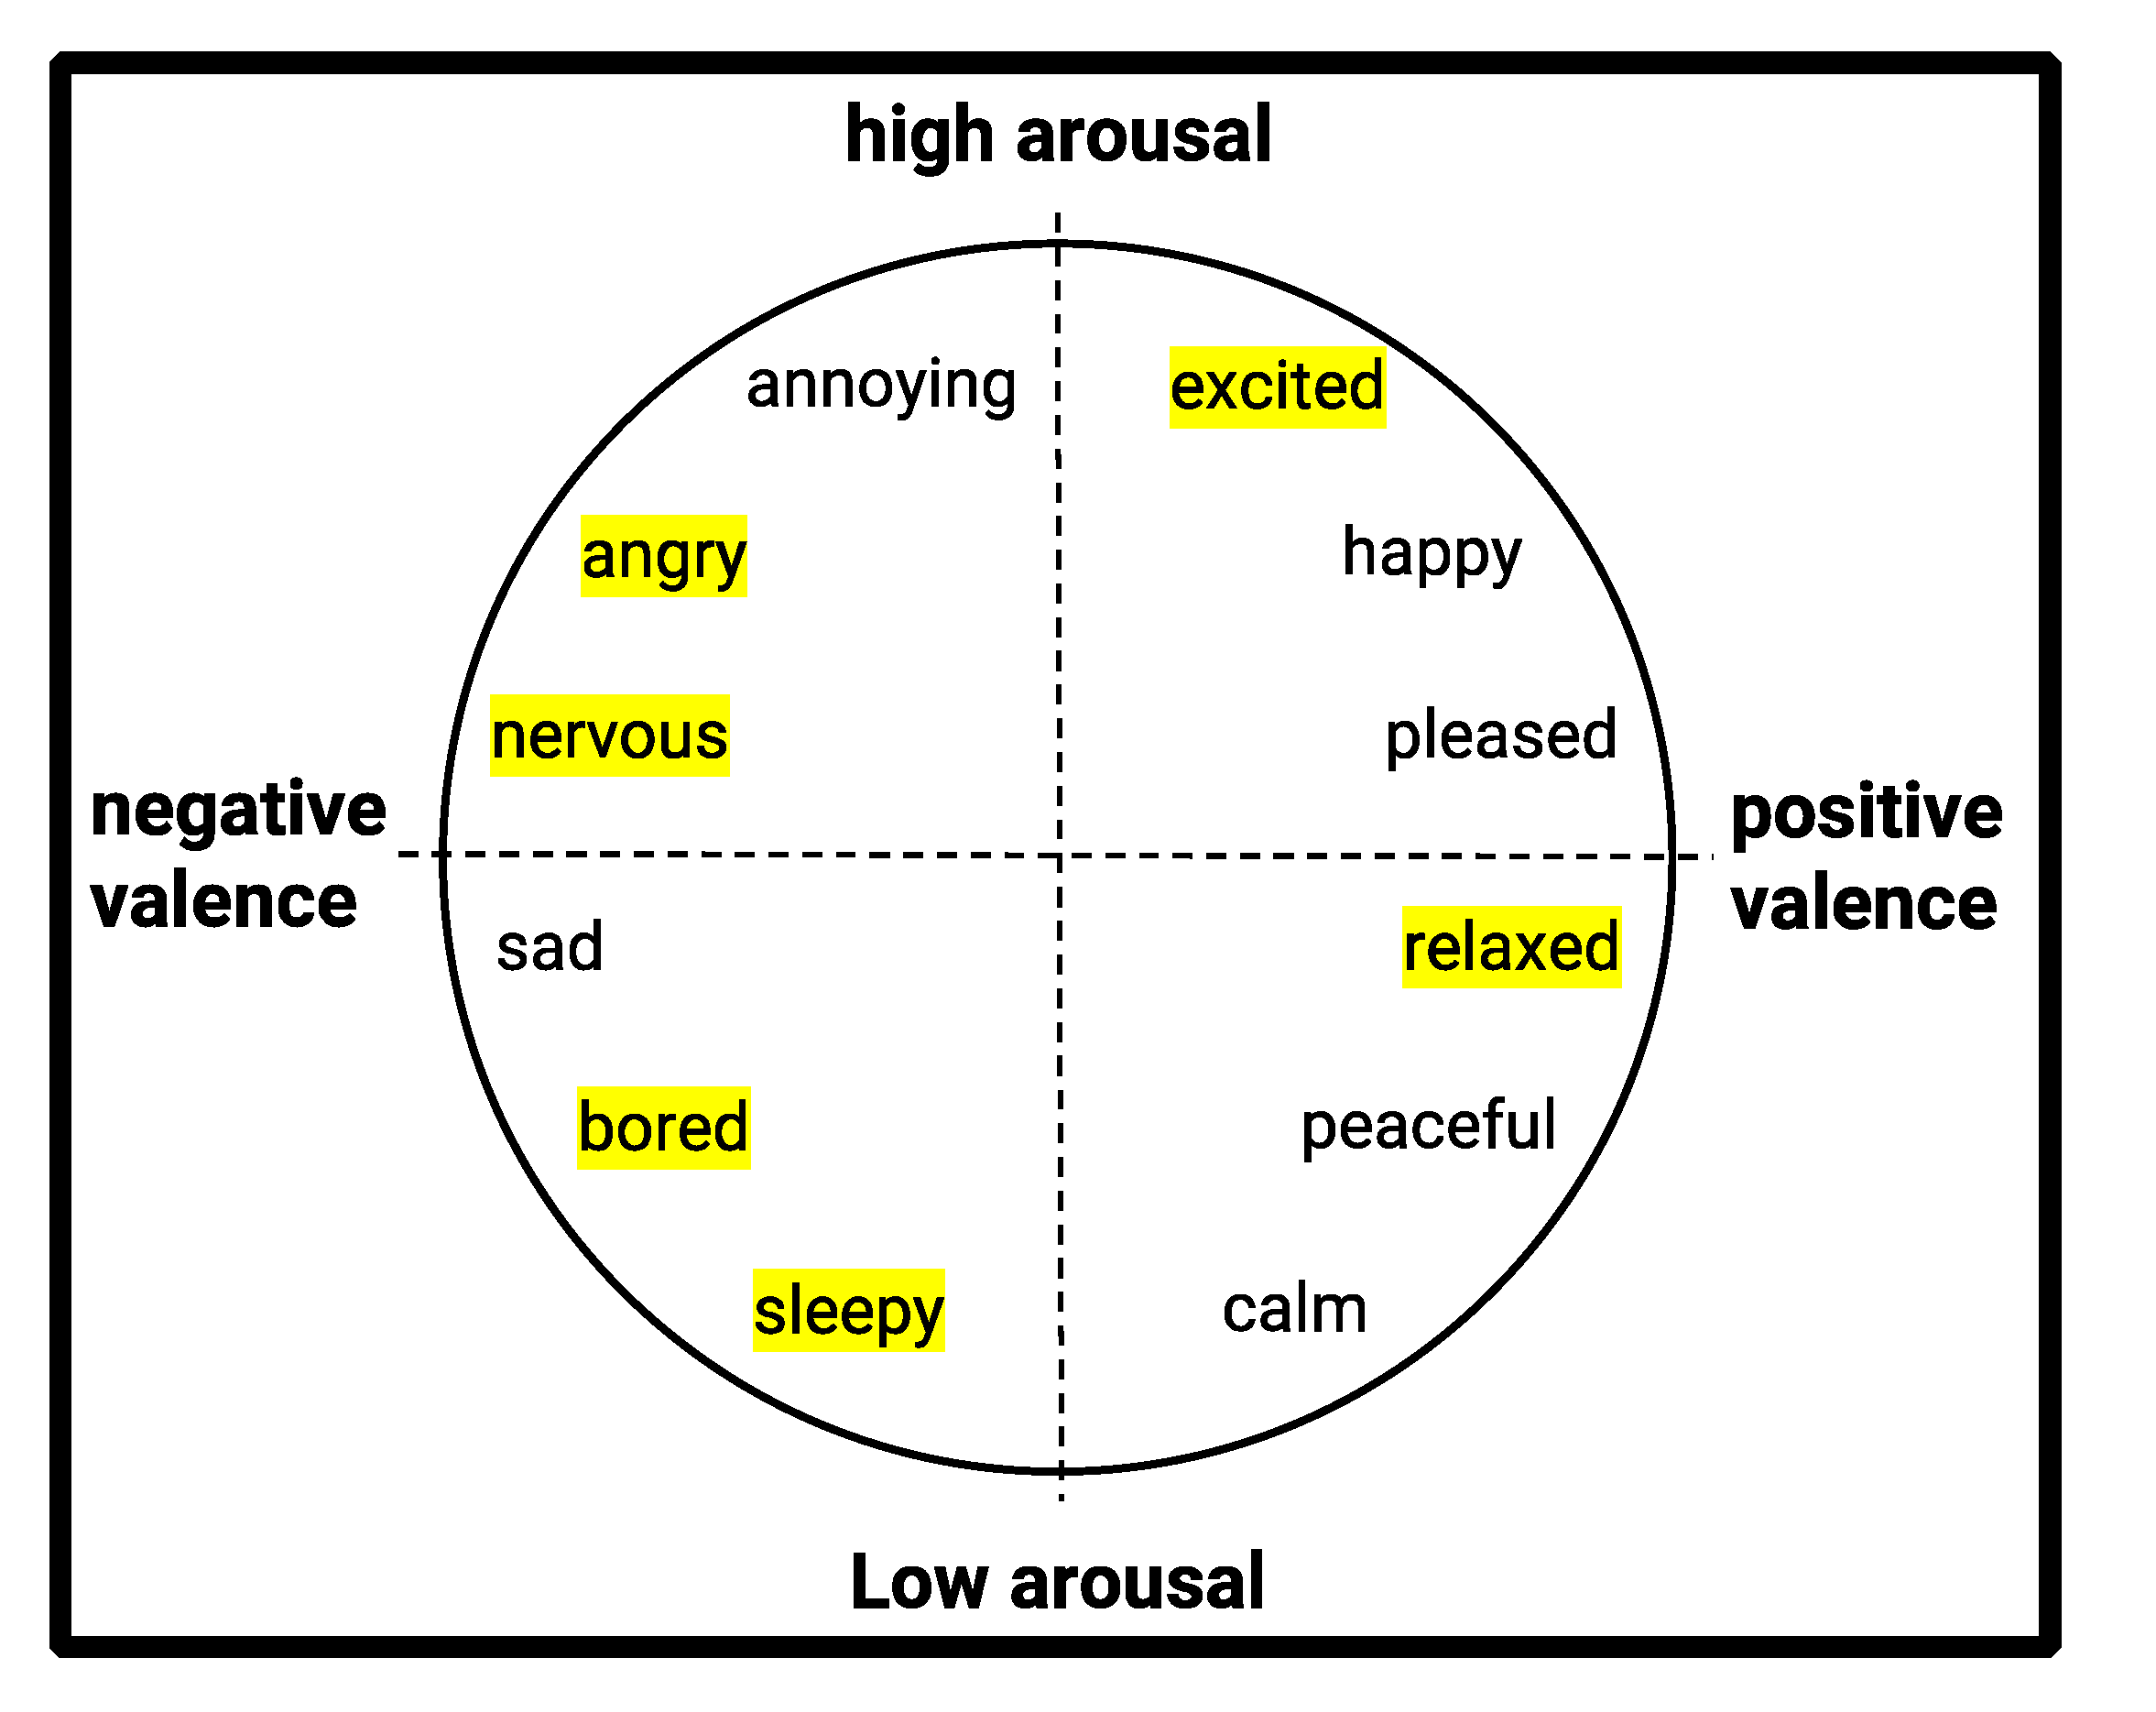
Figure 1. The circumplex model of affect. The horizontal axis indicates valence, ranging from negative to positive, while the vertical axis measures arousal, from low to high. The highlighted emotions are relevant to the automotive domain.
Mti 08 00054 g001
Figure 2. The driving simulator setup (A) showing a participants had to watch a video to trigger one of the three emotions (positive, neutral, negative) followed by a driving task which is projected on the main screen (B).
Mti 08 00054 g002
Figure 3. Self-reported results of the six different types of emotion while driving the car in the field.
Mti 08 00054 g003
Figure 4. Represents Facial Landmarks on different faces and the Expression Intensities based on the landmarks. In these six examples, we used FaceLandmarker to analyse the facial expressions.
Mti 08 00054 g004
Figure 5. Effect of the Auditory, Vibrotactile, and Visual Feedback modes on the median scores of valence and arousal reported by the participants.
Mti 08 00054 g005
Figure 6. Participants were highly distracted by the vibrotactile feedback, less distracted by the music, and only a few of the participants were distracted by the visual feedback.
Mti 08 00054 g006
Figure 7. Violin plots of the NASA-TLX results for Mental Demand (A), Physical Demand (B), Performance (C), Effort (D), and Frustration (E). The white dots within each plot represent the median values of the data.
Mti 08 00054 g007
Figure 8. Histograms display the frequency distributions of valence scores for initial (A) and post-exposure (B) responses to negative videos. The y-axis represents the frequency, which indicates the number of occurrences for each valence score. The x-axis shows the valence scores, ranging from 1 to 5.
Mti 08 00054 g008
Figure 9. Histograms present the frequency distributions of valence scores for initial (A) and post-exposure (B) responses to positive videos. The y-axis represents the frequency, which indicates the number of occurrences for each valence score. The x-axis shows the valence scores, ranging from 1 to 5.
Mti 08 00054 g009
Figure 10. To visualize the change in facial expressions during the elicitation and feedback phases, we calculate the median of 1486 face landmark points for each data point from a randomly selected participant.
Mti 08 00054 g010
Table 1. Summary of the different conditions associated with emotions and their corresponding visual, audio, and vibrotactile stimuli.
EmotionVisual
Feedback
Auditory
Feedback
Vibrotactile
Feedback
PositiveOrangeUpbeatSubtle Vibration
(lowest speed)
NeutralBlueCalm &
Relaxed
Moderate Vibration
(medium speed)
NegativeGreenSlowIntense Vibration
(high speed)
Table 2. User-dependent model performance for elicitation phase.
ModelF1-Score
(User-Dependent)
Random Forest0.8969 (SD = 0.0094)
Gradient Boosting0.8882 (SD = 0.0060)
SVM0.8502 (SD = 0.0092)
MLP
Ensemble
0.9202 (SD = 0.0083)
0.8200 (SD = 0.0199)
Table 3. User-independent model performance for elicitation and feedback phases with the mean and standard deviation for every participant.
ModelF1-Score
(User-Independent)
Random Forest0.5349 (SD = 0.2259)
Gradient Boosting0.5836 (SD = 0.2113)
SVM0.6300 (SD = 0.1678)
MLP
Ensemble
0.4880 (SD = 0.2621)
0.4163 (SD = 0.1360)
Disclaimer/Publisher’s Note: The statements, opinions and data contained in all publications are solely those of the individual author(s) and contributor(s) and not of MDPI and/or the editor(s). MDPI and/or the editor(s) disclaim responsibility for any injury to people or property resulting from any ideas, methods, instructions or products referred to in the content.