Article

Uncovering the Root Causes of Stall Flutter in a Wide Chord Fan Blisk

1
Yangtze River Delta Research Institute of NPU, Taicang 215400, China
2
School of Power and Energy, Northwestern Polytechnical University, Xi’an 710072, China
*
Author to whom correspondence should be addressed.
Int. J. Turbomach. Propuls. Power 2022, 7(4), 30; https://doi.org/10.3390/ijtpp7040030
Submission received: 31 May 2022 / Revised: 21 August 2022 / Accepted: 26 October 2022 / Published: 2 November 2022

Abstract

:
Flutter was encountered at part speeds in a scaled wide chord fan blisk designed for a civil aeroengine during a rig test when the fan bypass flow was throttled toward its stall boundary. Analysis of the blade tip timing measurement data revealed that the fan blades vibrated at the first flap (1F) mode with nodal diameters of two and three. To facilitate a further rig test and ultimately eliminate the flutter problem, a numerical campaign was launched to help understand the root causes of the flutter. Both the influence coefficient method (ICM) and the traveling wave method (TWM) were employed in the numerical investigation to analyze unsteady flows due to blade vibration, with the intention to corroborate different numerical results and take advantage of each method. To eliminate nonphysical reflections, a sponge layer with an inflated mesh size was used for the extended inlet and outlet regions. Steady flow field and unsteady flow field were examined to relate them to the blade flutter. The influences of vibration frequency, mass flow rate, shock, boundary layer separation and acoustic mode propagation behaviors on the fan flutter stability were also investigated. Particular attention was paid to the acoustic mode propagation behaviors.

1. Introduction

Fan blade flutter is a self-excited aeroelastic instability phenomenon, in which an initial slight amplitude vibration is amplified through a positive feedback mechanism between the fluid and structure. Flutter could result in high cycle fatigues or even blade failures within a short time. To alleviate fan blade flutter risk, modern fans for civil aircraft engines adopt the wide chord design to lower the aspect ratio. Nevertheless, with the increased aerodynamic loading and three-dimensional geometric features of compound sweep and lean, the fan blade flutter risk persists and has been a major factor in limiting the fan’s operating range.
To mitigate the fan blade flutter risk, many research endeavors have been made to uncover fan flutter mechanisms in the past few decades. Some factors have been identified to have an important influence on blade flutter, e.g., mode coupling [1,2], inter blade phase angle (IBPA) [3], tip clearance flow [4], mistuning [5], interaction between stages [6,7], and acoustic reflections [8]. In particular, Vahdati et al. [9] concluded that wide chord fan blade flutter usually occurs in the 1F mode when the inlet relative Mach number at the fan tip is close to the unit. They classified civil wide chord fan blade flutter into two types: classical stall flutter and acoustic flutter. The former is driven by separated flows, and is considerably influenced by the twist component in the 1F mode shape. The latter is caused by the acoustic reflection from the intake. They also speculate that flutter could only occur when the upstream acoustic mode is cut-on, and the downstream acoustic mode is cut-off. However, there are still some controversies about the understanding of flutter mechanisms. For example, Isomura and Giles [10] believe that the boundary layer separation has a stabilization effect and the shock has a destabilization effect, while Vahdati et al. [11] concluded that the shock has a stabilizing effect and the separated flow plays a destabilizing role.
Flutter measurement data are often scarce, as is for the case under investigation. In the rig test, there was one blade tip timing probe. The measurement data can be used to extract blade vibration frequency and nodal diameter. However, the information is insufficient for uncovering the root causes of the fan blade stall flutter. To fully understand the flutter mechanisms, there is a need to resort to numerical analysis.
Turbomachinery industries commonly rely on the decoupled energy method [12] to analyze flutter for its high computational efficiency. The energy method is based on two major assumptions. First, the aeroelastic vibration mode is identical to one of the blade structural modes only (i.e., mode coupling does not occur). Second, the aeroelastic frequency is close to the blade natural frequency. Because of the combined features of large mass ratio, high solidity, and significant natural frequency separation, these assumptions are valid for turbomachinery blades of traditional design. Chahine et al. [13] demonstrated the high accuracy of the energy method in predicting flutter for a wide range of mass ratio and stiffness by comparing it with coupled fluid–structure interaction (FSI) solutions.
In the energy method, the structural dynamic equation and the unsteady flow governing equation are solved sequentially. The first step is to solve the structural dynamic equation, which is also called modal analysis. The second step is to solve the unsteady flow governing equation to obtain the unsteady flow due to a prescribed harmonic vibration at a small amplitude.
There are two approaches to solve the unsteady flow governing equation: one is the traveling wave method (TWM), and the other is the influence coefficient method (ICM) [14].
The TWM assumes that all blades in a row vibrate at the same mode shape and frequency but with a fixed phase difference between two adjacent blades (inter blade phase angle). With a phase shift boundary condition, often, one blade passage can be used in a computational domain to reduce the domain size. The method requires separate analyses for all possible inter blade phase angles. It is particularly useful to use the method to examine unsteady flow for the flutter mechanism, as it provides the pertinent unsteady flow directly.
The ICM assumes that the unsteady aerodynamic force on a blade can be obtained by superimposing the time-dependent aerodynamic force excited by each vibrating blade. In practice, a computational domain with multiple blade passages is used for an ICM computation, in which the middle blade undergoes a prescribed harmonic motion and the rest remain stationary. The time-dependent aerodynamic response (influence coefficients) on all the blades in the blade row can be computed from a single computation, and then the aerodynamic work for all IBPAs can be obtained by superimposing and phase-shifting operations. The ICM could save computational time in that influence coefficients decay rapidly along the lateral passages. Thus, a truncated domain with a reduced number of passages can be used to reduce computational cost. A prerequisite for its application is that the vibration mode shape and natural frequency do not strongly depend on the nodal diameters.
Phan and He [15] compared TWM and ICM solutions for an oscillating linear compressor cascade using ANSYS CFX. Their results show an evident discrepancy in the aerodynamic damping curves, particularly for low nodal diameters. They ascribed the discrepancy to the inherent difference in far-field acoustic behaviors.
A new type of aeroelastic instability arising from aerodynamic instabilities, known as non-synchronous vibration (NSV) [16], has been recognized in turbomachinery during past decades. For example, Moller et al. [17] investigated a transonic compressor blade vibration experimentally and numerically at a near stall operating condition with an enlarged tip gap. Prior to the onset of vibration, the rotor tip flow fluctuations propagate circumferentially with a broadband frequency. Once the vibration is initiated, the aerodynamic disturbances lock into the second torsional mode frequency of the rotor with an amplified vibration amplitude. Brandstette and Stapelfeldt [18] proposed a semi-analytical model to predict the lock-in mechanism and NSV phenomenon. As both flutter and NSV occur at a non-integer multiple of the shaft frequency, it is essential to differentiate the two phenomena. Typically, flutter occurs at a low reduced frequency with small nodal diameters. On the contrary, NSV occurs at a high reduced frequency with large nodal diameters.
In this paper, both TWM and ICM are employed to compute the aerodynamic damping curve for a scaled civil wide chord fan blade for a comparison purpose. TWM solutions for the 2ND are analyzed in detail to investigate flutter mechanisms with an emphasis on the acoustic mode propagation. The influence of the vibration frequency, mass flow rate, shock and boundary layer separation on flutter stability are also investigated.

2. AECC CAE Wide Chord Fan Rig

The case studied in the paper is a wide chord fan blisk designed by the AECC Commercial Aircraft Engine Corporation for a wide-body civil aircraft engine. The fan has 18 blades with advanced compound sweep and lean design features. The inlet relative Mach number is 1.3, and the tip speed is 370 m/s at the design speed. The rig consists of three main parts: fan, bypass OGV and core IGV. It is scaled by a factor of 0.3 to meet the test bed requirements. The fan is made of titanium and manufactured as a blisk. Thus, the mechanical damping is negligible, and aerodynamic damping is crucial in determining the aeroelastic stability [9].
Flutter occurred when the bypass flow was throttled toward the stall boundary at several part speeds. Figure 1a shows the time history of the blade tip vibration displacement monitored by a single blade tip timing probe at 85% rotational speed. The vibration amplitude was nearly constant and well below the safety limit before 32.2 s. However, after the flutter onset, the vibration amplitude started to grow exponentially and reached up to 13.61 mm, nearly 8.5% of the blade tip chord, within 3.5 s. The fan blade tip rubbed the casing, and the throttling valve was opened immediately. Figure 1b shows the power spectral density of the vibration signal. The abscissa is the engine order (EO), which is defined as the frequency normalized by the shaft frequency. The power spectral density exhibits two peaks at 3.7 EO and 4.7 EO, respectively. The natural frequency of the 1F mode frequency is 1.7 EO, according to the finite element analysis. The difference in the frequency between the tip timing data and the blade natural frequency gives the blade vibration nodal diameter based on the Doppler frequency shift Equation (1):
E O S = E O R + m ,
where E O S is the frequency measured in the stationary frame of reference, E O R is the frequency in the rotational frame of reference, and m is the nodal diameter. Therefore, the dominant vibration mode has a nodal diameter of 2, and the other vibration mode has a nodal diameter of 3.
It was found through a series of numerical analyses that the fan has the least flutter margin at 80% speed ( Ω = 112.5 Hz) and a further rig test is planned for this speed. To facilitate the further rig test, extensive numerical analyses are carried out to understand the flutter mechanism at this operating speed.

3. Numerical Simulations and Discussions

3.1. CFD Mesh with Inflation Treatment

It is well known that numerical reflections from the inlet and outlet boundaries could ruin an aerodynamic damping solution. However, a high-dimensional non-reflecting boundary condition for aeromechanics is not available in CFX [17,19]. Thus, it is critical to place a sponge layer at the inlet and outlet sections. The sponge layer is an extended and inflated mesh zone. When a wave with a wavelength smaller than the local mesh size enters the inflated mesh, its amplitude is dissipated to reduce and even eliminate numerical reflections [20]. The axial mesh size in the sponge layer should have the same order of magnitude as the wavelength of the acoustic wave, which can be estimated by the 1D freestream plane wavelength as
O ( l ) = O ( c u f ) ,
where c is the speed of sound, u is the axial velocity, and f is the vibration frequency. Although the spinning mode wavelength can be calculated using a more sophisticated method (e.g., Equation (8)), this simple 1D formula is adequate to guide the generation of a sponge layer mesh. To demonstrate the effectiveness of the sponge layer strategy, we generate three sets of meshes with different lengths of inlet extension (named grid a, grid b and grid c, as shown in Figure 2) by using the commercial grid generator AutoGrid 5. The inlet boundaries are extended up to 9.7, 11.3 and 14.2 times the blade tip chord, respectively. The outlet is inflated and extended as well. The mesh around the fan blade has a 4 H-O topology and is identical for the three cases. There are nine nodes in the tip clearance. The distance from the first inner node to the wall is 1.0 × 10 5 m , and the yplus is around 40. The three sets of meshes have 0.83 M nodes approximately.

3.2. Steady-State Solutions
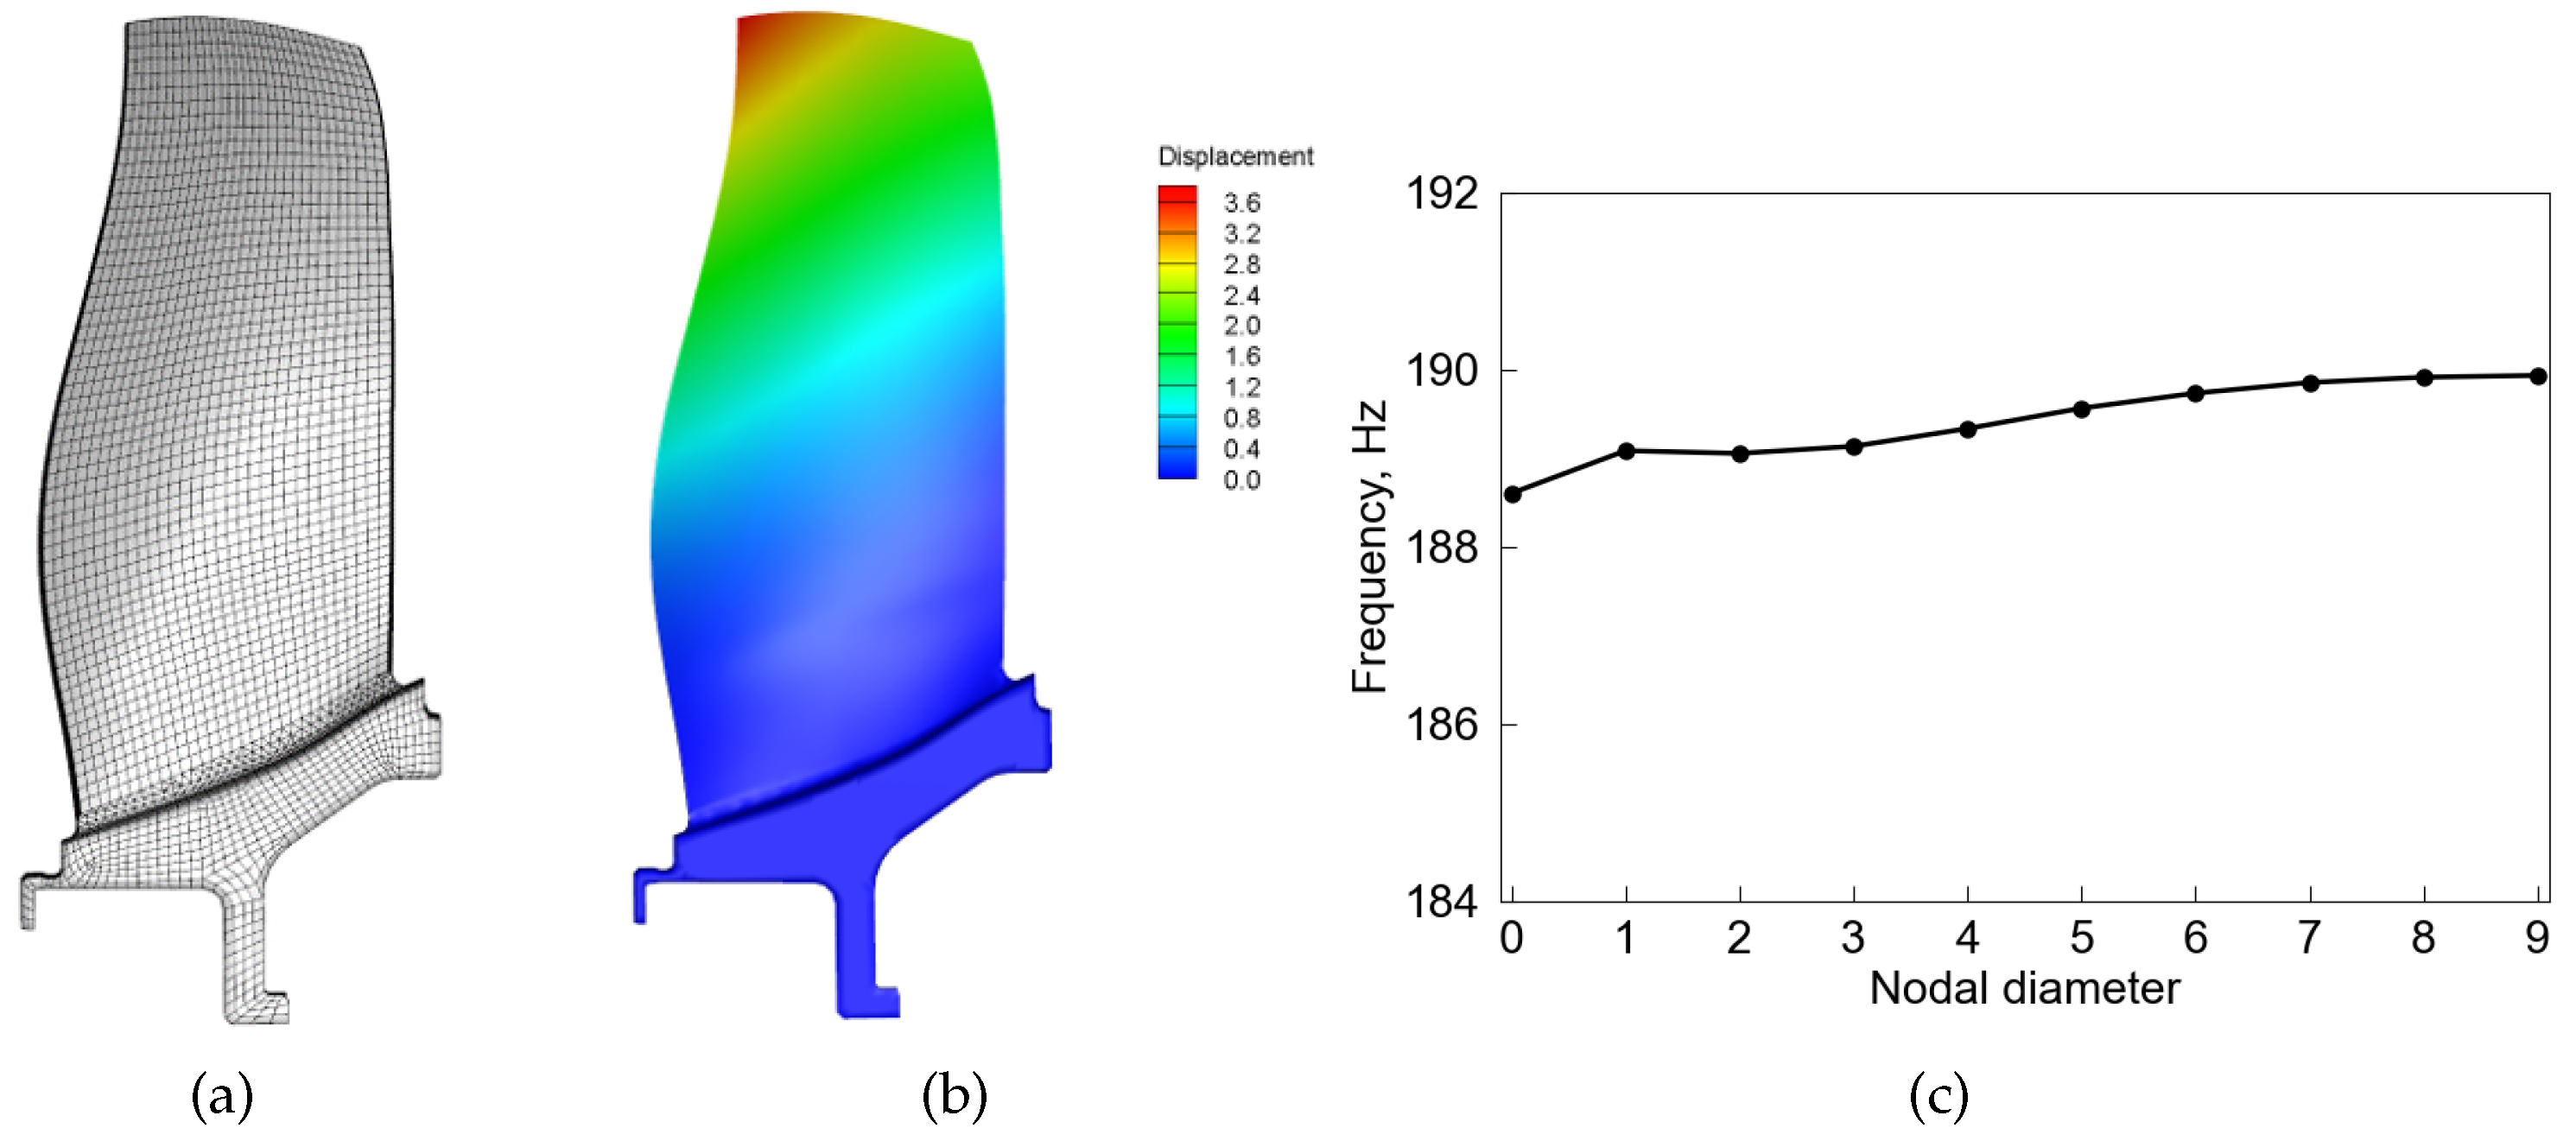
Total pressure and total temperature at the standard sea level conditions together with an axial inflow direction are specified at the inlet. A radial equilibrium equation is applied for the exit boundary. The end walls of the sponge layer zones are set to be inviscid. This minimizes growths of the boundary layer and ensures identical steady-state solutions on the three sets of meshes. The k ϵ turbulence model, which is the default turbulence model in CFX, is used throughout this work, as it is less sensitive to mesh density in comparison with other models. The advection term is discretized by a high-resolution scheme and the turbulence equations are discretized by a first-order upwind scheme in CFX.
Figure 3 shows the predicted speedlines for the bypass flow at 80%, 85%, 90% and 95% speeds using grid b as well as the predicted flutter boundary. Note that the design speed running geometry is used for all speedline computations. The abscissa is the mass flow rate normalized by the design speed design point value. There are measurement data for the three higher speeds for which the numerical analysis consistently over-predicts the pressure ratio. It is speculated that the discrepancy is due to the uncertainty in the blade running geometry. Furthermore, the test bed is very old. The rig data are also expected to have high uncertainty. Nevertheless, the overall trend and stall mass flow rates are predicted with reasonable accuracy for all three speeds. Note that both the rig and numerical characteristics include stall or flutter operating points but not choke ones. The other two grids, gird a and grid c, yield identical overall performance and detailed flow fields. For example, at OP3 of 80% speed, the static pressure distributions at the 90% span overlap as shown in Figure 4.
As 80% speed is identified to have the least flutter margin among the four speeds, particular attention is paid to the steady flow fields at this speed. As marked at the 80% speedline, OP1 denotes the near peak efficiency operating point, OP2 denotes an operating point with a higher pressure ratio, and OP3 denotes the flutter onset point. Note that OP3 is still on the negative slope part of the speedline, and the fan bypass can be throttled further toward the stall boundary without causing aerodynamic instabilities. The relative Mach number contours at 90% span and 60% span for OP1 and OP3 are presented in Figure 5. At 90% span, the shock is detached from the blade leading edge, and impinges on the adjacent blade suction side at the two operating points of OP1 and OP3. Compared with OP1, the shock at OP3 moves upstream further and becomes stronger. This is attributed to the flow separation downstream of the shock on the blade suction side. At the 60% span, there exists a small supersonic flow region at the blade leading edge, also known as the spike due to flow over-acceleration at the leading edge. The flow separates near the trailing edge at OP3. Figure 6 compares the total pressure ratio radial profiles at the fan bypass exit. With the throttled mass flow, the total pressure in the upper span gets elevated substantially. However, there is a noticeable drop near the 60% span for the OP3 profile, which results from flow separation on the suction side around the blade trailing edge. The flow separation can also be identified in the entropy contours (Figure 7) at the bypass exit. A high entropy region can be observed in the upper span region and near the casing when the flow is throttled. The flow field difference between OP1 and OP3 can also be seen from the suction surface limiting streamlines (Figure 8). Surface limiting streamlines move smoothly from the leading edge to the trailing edge at OP1. In contrast, surface-limiting streamlines show a substantial radial flow migration at OP3.

3.3. Modal Analysis

Modal analysis for the fan blisk is conducted by using the finite element analysis (FEA) software ANSYS mechanical. Figure 9a shows the FEA mesh for one sector of the fan blisk. The cyclic symmetric boundary is applied at the periodic boundaries. The displacement constraint in the axial and circumferential directions is applied at the disk and shaft interface. This analysis takes into account the pre-stress effects of centrifugal and aerodynamic forces. Figure 9b shows the first flap (1F) mode shape with the zero nodal diameter. Figure 9c shows the natural frequencies of the 1F mode versus the nodal diameters. The variation is less than 0.7%. Therefore, the ICM can be used for the aerodynamic damping analysis.

3.4. Aerodynamic Damping Computation

In the ICM, the one-blade-passage mesh is expanded circumferentially to form a seven-blade-passage domain. A direct periodic boundary condition is applied at the artificial boundaries in the circumferential direction. The middle blade (blade 0) is prescribed to vibrate in the 1F mode with an amplitude of 0.6% of the tip chord approximately. The dual time stepping method is used to perform unsteady aerodynamic computation for eight vibration cycles with 100 physical time steps for each cycle. Although not shown here, a sensitivity study was conducted to confirm that 100 physical time steps per cycle is a good compromise between accuracy and time cost. The time step is also corroborated by the time step dependence study of Dong et al. [3], which demonstrates that the aerodynamic damping differs by 0.23% only when the number of physical time steps per cycle increases from 108 to 180.
The instantaneous aerodynamic modal force on each blade is monitored so that it can be used to calculate the aerodynamic damping later. The modal force for the i t h blade is defined as
M F i ( t ) = s i p ( t ) ( Φ x n ^ x + Φ y n ^ y + Φ z n ^ z ) d s ,
where i is the blade index (ranging from −3 to +3 for this case), p ( t ) represents the instantaneous static pressure, Φ denotes the mode shape vector, s denotes a blade surface, and n ^ denotes the blade surface unit normal. Shown in Figure 10 are the convergence histories of the modal forces. The modal forces on the seven blades show good periodicity after four vibration cycles. It can also be seen that the amplitudes of M F ± 3 are much smaller than those of M F 0 . After 800 physical time steps, the enforced blade vibration is removed. The modal forces of all blades decay rapidly and eventually fluctuate at a negligible amplitude. Moreover, numerical probes are placed at each blade tip leading edge to monitor the unsteady pressure. Figure 11a shows the time history of instantaneous pressure from the probe located at blade 0. The pressure amplitude decays rapidly once blade 0 stops vibrating. Figure 11b presents the spectral analysis result of the pressure fluctuations over the last 800 cycles. On one hand, the fluctuation amplitudes are very small; on the other hand, the frequency of the dominant mode is 1409 Hz, which is far above the 1F natural frequency. Therefore, the fan aeroelastic instability studied here is not driven by the aerodynamic instability.
Next, we compute the first harmonic of the modal force by discrete Fourier transform:
M F ^ i = 2 N n = 0 N 1 M F i ( t n ) e j 2 π n N ,
where N is the number of the time steps ( N = 100 for this case) over a vibration cycle, t n = n N T . This is the modal force on blade i due to the vibration of blade 0. According to the cyclic symmetry of the blade arrangement in a row, the modal force of blade 0 due to the vibration of blade i is given by M F i .
If an IBPA( σ ) is defined as the phase difference between blade 1 and blade 0, then the phase difference between blade i and blade 0 is i σ . The corresponding modal force of blade 0 due to the vibration of blade i is given by M F ^ i e j i σ . We assume that blade 0 vibrates with the modal displacement of q ( t ) = q s i n ( ω t ) . The work performed on blade 0 by the modal force due to the vibration of blade i over one vibration cycle is given by
W i = q π ( M F ^ i e j i σ )
Summing the work from all blades, we obtain the worksum for a traveling wave vibration with the IBPA of σ :
W T W M ( σ ) = q π ( i = 3 3 M F ^ i e j σ i ) .
The aerodynamic damping is defined as
ζ ( σ ) = W T W M ( σ ) 2 π ω 2 q 2 .
Figure 12 compares aerodynamic damping curves from the three sets of meshes. Solutions from grid a have a minor difference, compared with grids b and c, for nodal diameters of −1, 0 and +1. Grids b and c yield identical solutions. It is implied that a further extension of the inflated mesh would not change the aerodynamic damping. Accordingly, grid b is chosen for the subsequent investigation. The influence coefficients, shown in Figure 13, on blade ± 3 are negligible compared to those on blade 0, and it is implied that the seven-blade-passage computational domain is adequate.
In addition to the ICM analysis, aerodynamic damping is also obtained using TWM with the harmonic balance method [21]. In ANSYS-CFX, the traveling wave analysis employs a two-passage mesh and a phase-shift boundary condition. The predicted damping curve by TWM shows good agreement with the ICM solutions except for ±9ND and ±8ND. The discrepancy could result from the dual time-stepping method and the harmonic balance method and the different far-field acoustic behaviors [15]. Nevertheless, the agreement between the two methods is considered reasonable, as it is better than the results reported in Refs. [15,22].
It is also worthy to mention that the CFL number in the TWM solutions for 0ND and 1ND has to be lowered substantially to ensure aerodynamic damping convergence. However, attempts to obtain a converged TWM solution for −1ND never succeeded by reducing the CFL number on grids a, b and c. As a trial, we generated three sets of non-inflated meshes with shorter inlet and outlet extensions. The inlet and outlet planes were set at 1.5, 1.0 and 0.5 times the blade tip chord away for the blade leading edge and trailing edge, respectively. The TWM solution for −1ND can converge successfully without reducing the CFL number on the three shorter meshes. However, the solutions are mesh-dependent, as numerical reflections are significant. The traveling wave mode of −1ND is in the vicinity of acoustic resonance for this case. It is speculated that the shorter inlet and outlet boundaries stabilize the solution, while the extended boundaries do not, as also reported by Hall et al. [21]. Therefore, the robustness of ICM is another advantage compared with TWM.
In the end, the ICM is employed to analyze the aerodynamic damping at a few operating points near the flutter onset OP3. The aerodynamic damping for the critical nodal diameters, 1ND, 2ND, and 3ND, declines with reduced mass flow, as shown in Figure 14. Note that aerodynamic damping for 2ND and 3ND drops dramatically near the flutter onset point, which is known as the transonic flutter dip and is commonly seen for aircraft wings. Also note that when throttling the mass flow, 2ND becomes negative first, but 3ND dips more rapidly than 2ND. However, the rig test cannot verify these numerical findings because the throttling valve is opened immediately after detecting the flutter onset for safety reasons.

3.5. Flutter Mechanisms

This section focuses on the TWM solutions to investigate the flutter mechanisms. First, the aerodynamic work density contours of 2ND at the flutter onset point OP3 are shown in Figure 15. The black line is the contour level of zero. The majority of the pressure side produces low amplitude positive aerodynamic work, except for a narrow strip near the tip leading edge. The worksum from the pressure side is 0.00154 J. On the suction side, the region near the leading edge from 50% span to the tip, associated with the impinged shock foot, produces substantial positive aerodynamic work. However, a large zone downstream of the shock (in deep blue), which coincides with the separated flows as analyzed in Section 3.2, produces negative aerodynamic work. The worksum from the suction side is 0.00079 J. Thus, it can be concluded that the shock destabilizes the fan, whereas the flow separation plays a stabilizing role.
As mentioned earlier, there are controversies over the roles of flow separation and shock on the flutter stability [10,11]. To clarify this, the imaginary part of the non-dimensional first harmonic unsteady pressure (normalized by the inlet dynamic head) and aerodynamic work density on the suction side for OP1, OP2 and OP3 are shown in Figure 16. At the near peak efficiency point OP1, the shock foot on the suction side produces negative work, and the after-shock region produces positive work. At the operating point OP2 with a higher pressure ratio, the effects of the shock and after-shock regions are reversed. The shock excites the vibration, and the after-shock region stabilizes the vibration. Furthermore, at the flutter onset point OP3, shock produces more prominent positive work. Therefore, the effects of shock on the flutter stability are reversed as the operating point moves from the peak efficiency point to the stall boundary.
Next, we turn our attention to the acoustic mode propagation behaviors when flutter occurs. As mentioned before, it was reported by Vahdati et al. [9] that acoustic modes induced by the blade vibration must be cut-on upstream and cut-off downstream as a pre-condition for flutter. It is because the acoustic energy would be trapped around the fan blade to trigger flutter instability in that scenario. Whether an acoustic mode can propagate without attenuation depends on the axial wave number k x . A real k x implies a cut-on mode, which can propagate without attenuation. In contrast, a complex k x implies a cut-off mode of which the amplitude decays exponentially along the traveling direction. With a uniform axial flow and a rigid body swirl flow assumption, i.e., M θ r = const , an analytical expression for k x can be derived as
k x = M x ( k m M θ r ) ± ( k m M θ r ) 2 k r θ 2 ( 1 M x 2 ) 1 M x 2 ,
where M x and M θ are the axial and tangential Mach number, respectively, m is the nodal diameter, k = ω c is the free stream wave number, and k r θ is the radial–circumferential wave number, which can be determined by Bessel functions [23,24]. Thus, the cut-on frequency can be determined as
f c u t o n = c 2 π m M θ r + k r θ 2 ( 1 M x 2 ) .
Alternatively, one can compute the cut-on frequency by solving an eigenvalue problem for the linearized Euler/N-S equation [25,26], in which the tangential flow can be in an arbitrary form. It is important to note that Equations (8) and (9) are derived in the absolute frame of reference. For example, the free stream angular frequency, ω , should be 2 π ( f + 2 Ω ) for a 2ND mode.
Table 1 summarizes the upstream and downstream cut-on frequencies, and the free stream frequencies for 2ND and 3ND. Note that a downstream cut-on frequency is higher than the upstream cut-on frequency. This is due to the swirling flow behind the fan and the change of the hub/tip ratio. Based on the above analysis, it is speculated that the acoustic mode induced by the 1F/2ND flutter is cut-on for both upstream and downstream. To consolidate this speculation, the instantaneous unsteady pressure (with the steady pressure component subtracted) contours for 2ND and 3ND at 95% span are shown in Figure 17. It is apparent that acoustic waves propagate without attenuation for both the upstream and downstream of 2ND and upstream of 3ND, but decay for the downstream of 3ND. Note that the weakening of the pressure amplitude at the inlet arises from the inflated mesh.
Note that the free stream frequency (415 Hz) is very close to the downstream cut-on frequency (409 Hz), thus making it difficult to conclude whether this finding is universal or just a marginally unstable condition. Thus, it is necessary to compute the aerodynamic damping at a higher vibration frequency to check whether it will still flutter at a higher vibration frequency.
A series of TWM computations for 2ND and 3ND are conducted for various vibration frequencies to systematically investigate the effects of acoustic mode propagation behaviors, cut-on or cut-off, on the aerodynamic damping. In contrast to the well-known conclusion that increasing the frequency enhances the flutter stability, it is clearly demonstrated that the aerodynamic damping does not increase monotonously with the frequency (Figure 18). According to the sign of the slope, the damping curves can be divided into three zones. The first zone corresponds to the upstream acoustic modes being cut-off, where the aerodynamic damping is considerably high and gradually increases with the frequency. The second zone (marked as blue bar and red bar for 2ND and 3ND, respectively) is in the vicinity of the upstream cut-on frequency, in which the aerodynamic damping dips with the increase of frequency. The third zone corresponds to the upstream acoustic modes being fully cut-on, where the sign of the slope becomes positive again. The aerodynamic damping for 2ND remains negative when the vibration frequency is lower than 200 Hz at OP3. We expect a much higher critical frequency for operating points beyond OP3. The twist component in the first flap (1F) mode is detrimental to the fan flutter. If the 1F mode has a higher twist component, the fan flutter critical frequency would be higher so that the downstream acoustic mode could be cut-on. The twist-to-plunge ratio of the 1F mode of this fan is 0.45, whereas the twist-to-plunge ratio of the fan studied by Vahdati [24] is 0.3. Later on, they numerically studied the 1F mode twist-to-plunge ratio in the range from 0.2 to 0.4 [27]. Thus, the conclusion that the downstream acoustic mode is cut-off is valid for a low to medium twist-to-plunge ratio. This critical frequency for flutter can surpass the downstream cut-on frequency if the 1F mode shape has a large twist-to-plunge ratio. Interested readers can refer to our thorough analyses through a mode shape decomposition procedure [28].

4. Conclusions

The stall flutter of a wide chord fan blisk designed for a civil aeroengine was investigated by analyzing the unsteady flow due to blade vibration using both ICM and TWM. A mesh with a sponge layer was used to damp nonphysical reflected waves. The mesh was inflated to be on the order of acoustic wavelength and extended to be more than 10 times the blade tip chord. The two methods predicted similar aerodynamic damping curves, and both successfully captured 1F/2ND negative damping. However, the TWM for the nodal diameter of acoustic resonance failed to converge on the extended and inflated mesh. Therefore, the ICM is more robust and recommended for real industrial applications. A transonic flutter dip for 2ND and 3ND near the flutter onset operating point was observed in the numerical analysis. The shock on the suction side produces negative aerodynamic work and stabilizes the fan in the near-peak-efficiency point. However, as the operating point moved toward the stall boundary, the shock produces positive work and destabilizes the fan. By analyzing steady flow fields and aerodynamic work density, the flutter is triggered by the shock while the after-shock boundary separation stabilizes the blade. The aerodynamic damping does not increase monotonously with the frequency. Instead, there is a narrow frequency range in which the aerodynamic damping dips with the increase of frequency, and the upstream acoustic modes are in the transition from being cut-off to cut-on. The acoustic waves produced by the 1F/2ND mode flutter propagate without attenuation both upstream and downstream.

Author Contributions

Conceptualization, H.H. and D.W.; methodology, H.H. and D.W.; software, M.Y.; formal analysis, M.Y.; investigation, H.H.; resources, D.W.; data curation, H.H.; writing—original draft preparation, H.H. and M.Y.; writing—review and editing, D.W.; visualization, M.Y.; supervision, D.W.; project administration, D.W.; funding acquisition, D.W. and H.H. All authors have read and agreed to the published version of the manuscript.

Funding

This work is supported by the National Science and Technology Major Project No. 2017-II-0009-0023, Aeronautical Science Foundation of China No. 2020Z039053004, and the Fundamental Research Funds for the Central Universities No. 3102019OQD701.

Institutional Review Board Statement

Not applicable.

Informed Consent Statement

Not applicable.

Data Availability Statement

Not applicable.

Acknowledgments

The authors appreciate Xu Dong from Chinese Academy of Science for his help with the usage of ANSYS CFX. The authors also appreciate the AECC Commercial Aircraft Engine Corporation for allowing publishing this paper.

Conflicts of Interest

The authors declare no conflict of interest.

Nomenclature

The following nomenclature are used in this manuscript:
cspeed of sound
fblade vibration frequency
iblade index
j imaginary unit
kfree stream wave number
k x axial wave number
k r θ radial–circumferential wave number
laxial mesh size
mnodal diameter
MFmodal force
M x absolute axial Mach number
M θ absolute tangential Mach number
n ^ blade surface unit normal
pstatic pressure
qgeneralized displacement
rradial coordinate
R rotational frame of reference
the real part of a complex number
S stationary frame of reference
ttime
Tvibration period
uaxial velocity
Waerodynamic work
x , y , z Cartesian coordinates
1Ffirst flap mode
EOengine order
FFTfast Fourier transform
FSIfluid–structure interaction
ICMinfluence coefficient method
IBPAinter blade phase angle
NSVnon-synchronous vibration
TWMtraveling wave method
ζ aerodynamic damping
θ circumferential coordinate
σ inter blade phase angle
Φ mode shape vector
ω blade vibration angular frequency
Ω shaft frequency

References

  1. Ren, J.; Huang, H.; Wang, D.; Dong, X.; Cao, B. An efficient coupled-mode flutter analysis method for turbomachinery. Aerosp. Sci. Technol. 2020, 106, 106215. [Google Scholar] [CrossRef]
  2. Huang, H.; Liu, W.; Petrie-Repar, P.; Wang, D. An efficient aeroelastic eigenvalue method for analyzing coupled-mode flutter in turbomachinery. J. Turbomach. 2021, 143, 021010. [Google Scholar] [CrossRef]
  3. Dong, X.; Zhang, Y.; Zhang, Y.; Zhang, Z.; Lu, X. Numerical simulations of flutter mechanism for high-speed wide-chord transonic fan. Aerosp. Sci. Technol. 2020, 105, 106009. [Google Scholar] [CrossRef]
  4. Dong, X.; Zhang, Z.; Zhang, Y.; Zhang, Y.; Lu, X. High-frequency unsteady flow near the tip in a transonic fan rotor with a small clearance. Aerosp. Sci. Technol. 2020, 106, 106211. [Google Scholar] [CrossRef]
  5. Corral, R.; Beloki, J.; Calza, P.; Elliott, R. Flutter generation and control using mistuning in a turbine rotating rig. AIAA J. 2019, 57, 782–795. [Google Scholar] [CrossRef]
  6. Rzadkowski, R.; Gnesin, V.; Kolodyazhnaya, L.; Kubitz, L. Aeroelastic behaviour of a 3.5-stage aircraft compressor rotor blades following a bird strike. J. Vib. Eng. Technol. 2018, 6, 281–287. [Google Scholar] [CrossRef]
  7. Zhao, F.; Nipkau, J.; Vahdati, M. Influence of acoustic reflections on flutter stability of an embedded blade row. Proc. Inst. Mech. Eng. Part A J. Power Energy 2016, 230, 29–43. [Google Scholar] [CrossRef]
  8. Huang, H.; Mingming, Y.; Dingxi, W. Efficient fan acoustic flutter analysis using the influence coefficient method and a sliding plane. J. Aerosp. Eng. 2023, 36, 06022005. [Google Scholar] [CrossRef]
  9. Vahdati, M.; Lee, K.B.; Sureshkumar, P. A review of computational aeroelasticity of civil fan blades. Int. J. Gas Turbine Propuls. Power Syst. 2020, 11, 22–35. [Google Scholar] [CrossRef]
  10. Isomura, K.; Giles, M. A numerical study of flutter in a transonic fan. J. Turbomach. 1998, 120, 500–507. [Google Scholar] [CrossRef]
  11. Vahdati, M.; Sayma, A.; Marshall, J.; Imregun, M. Mechanisms and prediction methods for fan blade stall flutter. J. Propuls. Power 2001, 17, 1100–1108. [Google Scholar] [CrossRef]
  12. Carta, F.O. Coupled blade-disk-shroud flutter instabilities in turbojet engine rotors. J. Eng. Power 1967, 89, 419–426. [Google Scholar] [CrossRef]
  13. Chahine, C.; Verstraete, T.; He, L. A Comparative study of coupled and decoupled fan flutter prediction methods under variation of mass ratio and blade stiffness. J. Fluids Struct. 2019, 85, 110–125. [Google Scholar] [CrossRef]
  14. Hanamura, Y.; Tanaka, H.; Yamaguchi, K. A simplified method to measure unsteady forces acting on the vibrating blades in cascade. Bull. JSME 1980, 23, 880–887. [Google Scholar] [CrossRef] [Green Version]
  15. Phan, H.; He, L. Validation studies of linear oscillating compressor cascade and use of influence coefficient method. J. Turbomach. 2020, 142, 051005. [Google Scholar] [CrossRef]
  16. Kielb, R.E.; Barter, J.W.; Thomas, J.P.; Hall, K.C. Blade excitation by aerodynamic instabilities: A compressor blade study. In Proceedings of the Turbo Expo: Power for Land, Sea, and Air, Atlanta, GA, USA, 16–19 June 2003; Volume 36878, pp. 399–406. [Google Scholar]
  17. Mao, Z.; Hegde, S.; Pan, T.; Kielb, R.E.; Zori, L.; Campregher, R. Influence of Rotor-Stator Interaction and Reflecting Boundary Conditions on Compressor Forced Response. In Proceedings of the Turbo Expo: Power for Land, Sea, and Air. American Society of Mechanical Engineers, Oslo, Norway, 11–15 June 2018; Volume 50992, p. V02AT45A004. [Google Scholar]
  18. Brandstetter, C.; Stapelfeldt, S. Analysis of a linear model for non-synchronous vibrations near stall. Int. J. Turbomach. Propuls. Power 2021, 6, 26. [Google Scholar] [CrossRef]
  19. Mueller, T.R.; Vogt, D.M.; Fischer, M.; Phillipsen, B.A. On the far-field boundary condition treatment in the framework of aeromechanical computations using ANSYS CFX. Proc. Inst. Mech. Eng. Part A J. Power Energy 2018, 235, 0957650920962698. [Google Scholar] [CrossRef]
  20. Colonius, T.; Lele, S.K.; Moin, P. Boundary conditions for direct computation of aerodynamic sound generation. AIAA J. 1993, 31, 1574–1582. [Google Scholar] [CrossRef] [Green Version]
  21. Hall, K.C.; Thomas, J.P.; Clark, W.S. Computation of unsteady nonlinear flows in cascades using a harmonic balance technique. AIAA J. 2002, 40, 879–886. [Google Scholar] [CrossRef] [Green Version]
  22. Vogel, K.; Naidu, A.; Fischer, M. Comparison of the influence coefficient method and travelling wave mode approach for the calculation of aerodynamic damping of centrifugal compressors and axial turbines. In Proceedings of the Turbo Expo: Power for Land, Sea, and Air, Charlotte, NC, USA, 26–30 June 2017; American Society of Mechanical Engineers: New York, NY, USA, 2017; Volume 50930, p. V07BT36A022. [Google Scholar]
  23. Tyler, J.M.; Sofrin, T.G. Axial Flow Compressor Noise Studies. SAE Trans. 1962, 70, 309–332. [Google Scholar]
  24. Vahdati, M.; Cumpsty, N. Aeroelastic instability in transonic fans. J. Eng. Gas Turbines Power 2016, 138, 022604. [Google Scholar] [CrossRef]
  25. Moinier, P.; Giles, M.B. Eigenmode analysis for turbomachinery applications. J. Propuls. Power 2005, 21, 973–978. [Google Scholar] [CrossRef] [Green Version]
  26. Huang, H. Acoustic eigenmode analysis for swirling flows in ducts. In Proceedings of the Global Power and Propulsion Society, GPPS-TC-2017-0032, Shanghai, China, 30 October–1 November 2017. [Google Scholar]
  27. Lee, K.B.; Wilson, M.; Vahdati, M. Numerical study on aeroelastic instability for a low-speed fan. J. Turbomach. 2017, 139, 071004. [Google Scholar] [CrossRef]
  28. Jia, X.; Huang, H.; Wang, D. The effects of blade vibration mode on flutter stability. In Proceedings of the Global Power and Propulsion Society, GPPS-TC-2021-0182, Xi’an, China, 18–20 October 2021. [Google Scholar]
Figure 1. Time history and power spectral density of the fan blade tip vibration displacement when the bypass was throttled. (a) Time history. (b) Power spectral density.
Ijtpp 07 00030 g001
Figure 2. Computational mesh for the fan.
Ijtpp 07 00030 g002
Figure 3. Fan speedlines at 80%, 85%, 90% and 95% rotational speeds.
Ijtpp 07 00030 g003
Figure 4. Comparison of aerodynamic loading at 90% span.
Ijtpp 07 00030 g004
Figure 5. Comparison of relative Mach number contours. (a) OP1, 90% span. (b) OP3, 90% span. (c) OP1, 60% span. (d) OP3, 60% span.
Ijtpp 07 00030 g005
Figure 6. Comparison of radial profiles of bypass flow total pressure ratio.
Ijtpp 07 00030 g006
Figure 7. Comparison of entropy contours at the bypass exit. (a) OP1. (b) OP3.
Ijtpp 07 00030 g007
Figure 8. Comparison of surface streamline on the suction surface. (a) OP1. (b) OP3.
Ijtpp 07 00030 g008
Figure 9. FEA mode analysis. (a) FEA mesh. (b) 1F mode shape. (c) Natural frequencies of the 1F mode versus nodal diameter.
Ijtpp 07 00030 g009
Figure 10. Modal force convergence histories.
Ijtpp 07 00030 g010
Figure 11. Unsteady pressure at the middle blade tip gap near the leading edge. (a) Time history. (b) Spectrum results.
Ijtpp 07 00030 g011
Figure 12. Comparison of aerodynamic damping curves.
Ijtpp 07 00030 g012
Figure 13. The real and imaginary parts of influence coefficients based on grid b.
Ijtpp 07 00030 g013
Figure 14. Aerodynamic damping versus mass flow.
Ijtpp 07 00030 g014
Figure 15. Aerodynamic work density contours on the blade surface. (a) Pressure side. (b) Suction side.
Ijtpp 07 00030 g015
Figure 16. Comparison of the imaginary part of the non-dimensional first harmonic unsteady pressure (top) and the aerodynamic work density (bottom) at three different operating points. (a) OP1. (b) OP2. (c) OP3. (d) OP1. (e) OP2. (f) OP3.
Ijtpp 07 00030 g016
Figure 17. Instantaneous unsteady pressure contours at 95% span for a whole annulus (reconstructed from two-passages TWM solutions). (a) 2ND. (b) 3ND.
Ijtpp 07 00030 g017
Figure 18. Aerodynamic damping versus vibration frequency.
Ijtpp 07 00030 g018
Table 1. Free stream frequency and cut-on frequency at 80% rotational speed (in the absolute frame of reference).
Type2ND3ND
free stream frequency415 Hz527.5 Hz
upstream cut-on frequency338 Hz473.5 Hz
downstream cut-on frequency409 Hz608 Hz
Publisher’s Note: MDPI stays neutral with regard to jurisdictional claims in published maps and institutional affiliations.

