Abstract
Anti-vaccine sentiments have been well-known and reported throughout the history of viral outbreaks and vaccination programmes. The COVID-19 pandemic caused fear and uncertainty about vaccines, which has been well expressed on social media platforms such as Twitter (X). We analyse sentiments from the beginning of the COVID-19 pandemic and study the public behaviour on X during the planning, development, and deployment of vaccines expressed in tweets worldwide using a sentiment analysis framework via deep learning models. We provide visualisation and analysis of anti-vaccine sentiments throughout the COVID-19 pandemic. We review the nature of the sentiments expressed with the number of tweets and monthly COVID-19 infections. Our results show a link between the number of tweets, the number of cases, and the change in sentiment polarity scores during major waves of COVID-19. We also find that the first half of the pandemic had drastic changes in the sentiment polarity scores that later stabilised, implying that the vaccine rollout impacted the nature of discussions on social media.
1. Introduction
The coronavirus disease 2019 (COVID-19) is an infectious disease caused by severe acute respiratory syndrome coronavirus 2 (SARS-CoV-2) [1,2,3], which became a global pandemic in 2020 [4] with major disruption to social and economic activities worldwide. The influence of social media on pandemic-related public attitudes and behavioural developments is profound [5]. During the ongoing COVID-19 pandemic, social media platforms such as Twitter (X) and Facebook have been heavily used for timely information sharing and communication [6,7]. Such user-generated contents contribute to a spectrum of opinions ranging from official announcements to the expression of individual beliefs, from credible health updates to the dissemination of rumours and misinformation [8,9,10,11]. This has facilitated diverse public sentiments towards COVID-19 and its control strategies given a wide range of topics such as racism, deaths, and economic losses [12]. Some regional studies identified overall positive sentiments initially [13], despite the polarity of sentiments demonstrated on certain pandemic-related topics such as quarantine measures [14], mask-wearing [15], and anti-vaccination [16,17].
In the history of viral infections, anti-vaccine activities have been well known and reported during outbreaks and vaccination programmes [18,19,20,21], such as the refusal of parents to vaccinate children in the USA [22] and during an outbreak of measles in 2019 in the USA [23]. In a related study, Figueiredo et al. [24] mapped global trends in vaccine confidence across 149 countries between 2015 and 2019 and estimated that confidence in vaccines fell in several Asian countries and improved in some of the European Union member states. The study found a link between religious beliefs and vaccine updates and reported a link between religious beliefs and vaccine uptake. Social media has served as a tool for the dissemination of official information and connectivity during lockdowns [6,7]; however, it has been a tool for anti-vaccine activities and movements also known as “anti-vaxxers” [25]. Fear and uncertainty due to abrupt changes in lockdowns during COVID-19 had a huge effect on mental health, which includes patients [26] and the general population [27,28,29] along with children [30]; it was highlighted that mental health disorders can increase the risk of infections and barriers in accessing timely health services. Anti-vaxxer movements are also based on notions that are built from conspiracy theories and pseudo-scientific viewpoints [21]; however, at times, they come from the adverse nature of the official vaccine itself, such as the March 2020 AstraZeneca vaccine ban in 18 countries.
Recent progress in deep learning models has improved language models [31]. Recurrent neural networks (RNNs) have been prominent for language translation [32,33] and sentiment analysis tasks [34,35]. The long-short term memory (LSTM) network [36] is a prominent RNN that has been a backbone of several prominent language models [31]. There has been some progress in improving LSTM models further with attention mechanism [37] and Transformer models [38] that combine attention and other novel innovations in LSTM models. The Transformer model has been prominent in developing pre-trained language models, such as bidirectional encoder representations from transformers (BERT) [39] for masked language modelling.
Topic modelling [40] and sentiment analysis [41] are key areas of study for natural language processing (NLP) [42] that have been implemented using deep learning and large language models (LLMs) [43]. These methods have been used to review social media during COVID-19, and some of the major studies are discussed as follows. Xue et al. [44] used topic modelling and sentiment analysis for 1.9 million tweets related to COVID-19 during the early stages and categorised them into ten themes. The sentiment analysis showed that fear of the unknown nature of the coronavirus was dominant in the respective themes. Hung et al. [45] presented a social network analysis of COVID-19 sentiments based on tweets from the United States to determine the social network of dominant topics and types of sentiments with geographic analysis and found five prevalent themes which could clarify public response and help officials. Wang et al. [46] presented sentiment and trend analysis of social media in China via a Bidirectional Encoder Representation from Transformer (BERT) [39] language model. Chakraborty et al. [47] presented sentiment analysis of COVID-19 tweets via deep learning with handles related to COVID-19 and the World Health Organisation and found that the tweets have been unsuccessful in guiding people. Abd-Alrazaq et al. [12] presented a study to find the key concerns of tweets during the COVID-19 pandemic and identified 12 topics with themes such as “origin of the virus”, “its impact on people”, and “the economy”. Other related work on sentiment analysis during COVID-19 focused on managing diabetes [48], where a change in sentiment was reported when compared to that pre-COVID-19. Furthermore, region-specific X (Twitter) studies included local community sentiment analysis in New South Wales (Australia) [49], and nationwide sentiment analysis in Nepal [50] during the early months, where a majority of positive sentiments were expressed with elements of fear. Furthermore, Barkur et al. [13] used sentiment analysis to study the effect of nationwide lockdown due to the COVID-19 outbreak in India, using 24,000 tweets to generate a word cloud that depicted the majority of positive responses for early lockdowns. Note that the study focused on only two hashtags (#IndiaLockdown and #IndiafightsCorona) in a short span of time (from 25 March to 28 March 2020); hence, major conclusions could not be drawn. Chandra and Krishna [51] presented a study that focused on a larger time frame (March to July 2020)in India and reported major changes in sentiments given changes in infection and death rates. A study of European cross-language sentiment analysis in the early COVID-19 pandemic separated the results by country of origin, with 4.6 million geotagged tweets collected during the months of December 2019 through April 2020 [52]. Ng et al. [53] examined the prevalence of negative sentiments with tweets over a 16-month period using topic modelling and reported themes that included emotional reactions to policies, safety and effectiveness of COVID-19 vaccines. These studies motivate our study to apply sentiment analysis with LLMs for anti-vaccine-related tweets.
The effect of misinformation is becoming severe, and hence there have been discussions about criminalising misinformation on social media. Mills and Sivela [54] highlighted that the opposing notion to criminalising anti-vaccine (anti-vax) activities was the right to freedom of expression with a restriction for certain cases, such as inciting lawless activities and violence, where anti-vaccination misinformation was not seen such a case. Johnson et al. [55] reported an online competition with and against vaccination by studying 100 million individuals, partitioned into highly dynamic and interconnected clusters, across different languages around the globe. The study reported that anti-vaccination clusters were highly entangled with undecided clusters and predicted that anti-vaccination views would dominate in a decade. In the age of artificial intelligence and social media analysis [44,45,46], sentiment analysis could be seen as a way to understand public behaviour towards vaccines, which can lay out a framework for policy development. Social media has been used as a tool for studying pandemics [56] in the past, which covered viral outbreaks such as measles [57,58] and the management of the H1NI viral outbreak [59]. Nu et al. [60,60] presented studies using sentiment analysis and topic modelling for measles and influenza vaccination from tweets from 2017 to 2022. However, there have not been studies that reviewed public sentiments concerning how they have expressed their views regarding COVID-19 vaccinations. Sentiment analysis can provide an indication of how a person is reacting towards the vaccination process, e.g., if a tweet featured the terms “COVID-19” and “vaccination” and a model classified the tweet as “fear” and “pessimistic”, then it would lean towards anti-vaccination. Hence, this way, sentiment detection models can guide an understanding of misinformation regarding vaccination.
In this study, we analyse the sentiments from the beginning of the COVID-19 pandemic and study the behaviour during the planning, development and deployment of vaccines expressed in tweets worldwide using a sentiment analysis framework that employs a refined BERT-based language model. We present sentiment analysis and compare selected countries including Australia, Japan, India, Brazil and Indonesia. Our framework defines a set of sentiments to detect anti-vaccine sentiments and provide longitudinal data analysis. We predict sentiments associated with the term vaccine from tweets worldwide for about two years since the beginning of COVID-19. In this way, we provide an analysis of monthly anti-vaccine sentiments throughout the major waves of the earlier phase of the COVID-19 pandemic, where vaccination was a major focus, i.e., from March 2020 to January 2022. We review the nature of the sentiments expressed in relation to the number of tweets and monthly COVID-19 infections.
We note that the pandemic has ended; it is important to understand the different aspects of the pandemic, such as vaccine sentiments. This will enable us to be better prepared regarding the dissemination of information in future endemic and pandemics. Our contribution is about how fine-tuned BERT-based sentiment analysis models can be used to provide a longitudinal study of vaccination response in social media during the pandemic.
The rest of the paper is organised as follows. Section 2 presents the proposed methodology with Twitter (X) data extraction details along with framework for sentiment analysis. Section 3 presents the experiments and results. Section 4 provides a discussion, and Section 5 concludes the paper with a discussion of future work.
2. Methodology
2.1. Data
We include two major sources of data, and we first present the SenWave dataset to refine the BERT model for multi-label sentiment analysis. We train the model using the SenWave sentiment analysis dataset, which features 10 sentiments labelled by 50 experts [61]. The SenWave dataset features 10,000 COVID-19-related tweets in the English language that were manually assigned one or more emotional labels including “optimistic”, “surprise”, “thankful”, “empathetic”, “pessimistic”, “anxious”, “sad”, “annoyed”, “denial”, “official”, and “joking” which forms the basis for language model training. The SenWave dataset is different from most traditional sentiment analysis datasets since they mostly have sentiment scores associated with “positive”, “negative” and “neutral” sentiments. Furthermore, it is more applicable to our study since the dataset is from COVID-19 tweets.
We note that the original SenWave dataset included the ’surprise’ sentiment label, which was used for our study, and hence we have 11 sentiments. In the latest version of the SenWave dataset, surprise has been dropped.
Next, we present the data that are used to study anti-vaccine tweets during the beginning of the vaccination phase of COVID-19 (from March 2020 to January 2022). We separate the tweets from the global dataset obtained via Kaggle [62] for the selected countries, which include Australia, Japan, India, Brazil, and Indonesia. We note that it is up to users to decide if their geographical location is known while tweeting, and hence we have a limited number of tweets with geolocation. This dataset has also been used for COVID-19 topic modelling in previous studies [63]. Furthermore, we implement standard tweet processing as performed in previous work [51] for removing URLs, mentions, and hashtags.
The special phrases, emotion symbols (emoji’s), and abbreviations that were used in tweets need to be processed and translated into known English words as shown in Table 1. The original dataset is restricted to tweets in English only.

Table 1.
Transformation of tweet language usage and emojis to standardised language. Note that “smiley” and “frownie” refer to symbols used for these expressions.
2.2. Bert-Based Model
RNNs are distinguished from feedforward neural networks due to feedback (recurrent) connections [64,65,66] implemented via a context memory layer to compute future state outputs. The earlier architectures are also known as simple RNNs, which have been prominent for modelling temporal sequences [67] and dynamical systems [68,69]. A major limitation in simple RNNs is the difficulty of model training using the backpropagation through time algorithm [66]. The major issue is difficulty in learning long-term dependencies given vanishing and exploding gradients [70]. LSTM networks [36] address the limitations of using memory cells and gates for better capabilities in remembering long-term dependencies. Bidirectional LSTM networks [71] make use of only the previous context state for determining the next states, which enables them to process information in two directions and build on the ideas from bidirectional RNNs [72]. Bidirectional LSTM networks have been extensively used in NLP problems [71,73,74] and also utilised in the Transformer and BERT models. BERT-based models have been used for a wide range of sentiment analysis-related tasks such as modelling US 2020 Presidential elections [75], translation analysis of the Bhagavad Gita [76], and COVID-19 sentimental analysis in India [51]. BERT has also been used for topic modelling in Hindu texts, which feature a study of common topics present in the Bhagavad Gita and the Upanishads [77], and COVID-19 Twitter (X)-based topic modelling for three different waves in India [63].
2.3. Framework
Our goal is to obtain a visualisation and provide analysis of tweets relating to vaccination during the planning, developing, and deployment of vaccines in the COVID-19 pandemic. Therefore, we implement sentiment analysis using a BERT-based model to understand the nature of the tweets, in terms of overall negative or positive sentiments. We note that anti-vaccine tweets on their own do not explicitly state that they are anti-vaxxers. Such tweets promote fear and uncertainty associated with vaccination, and at times, the vocabulary would be professional while being subtle in the message against vaccination. Hence, it is not straightforward to determine anti-vaccine tweets. We hence present a framework where sentiment analysis is used as a methodology to detect anti-vaccine tweets.
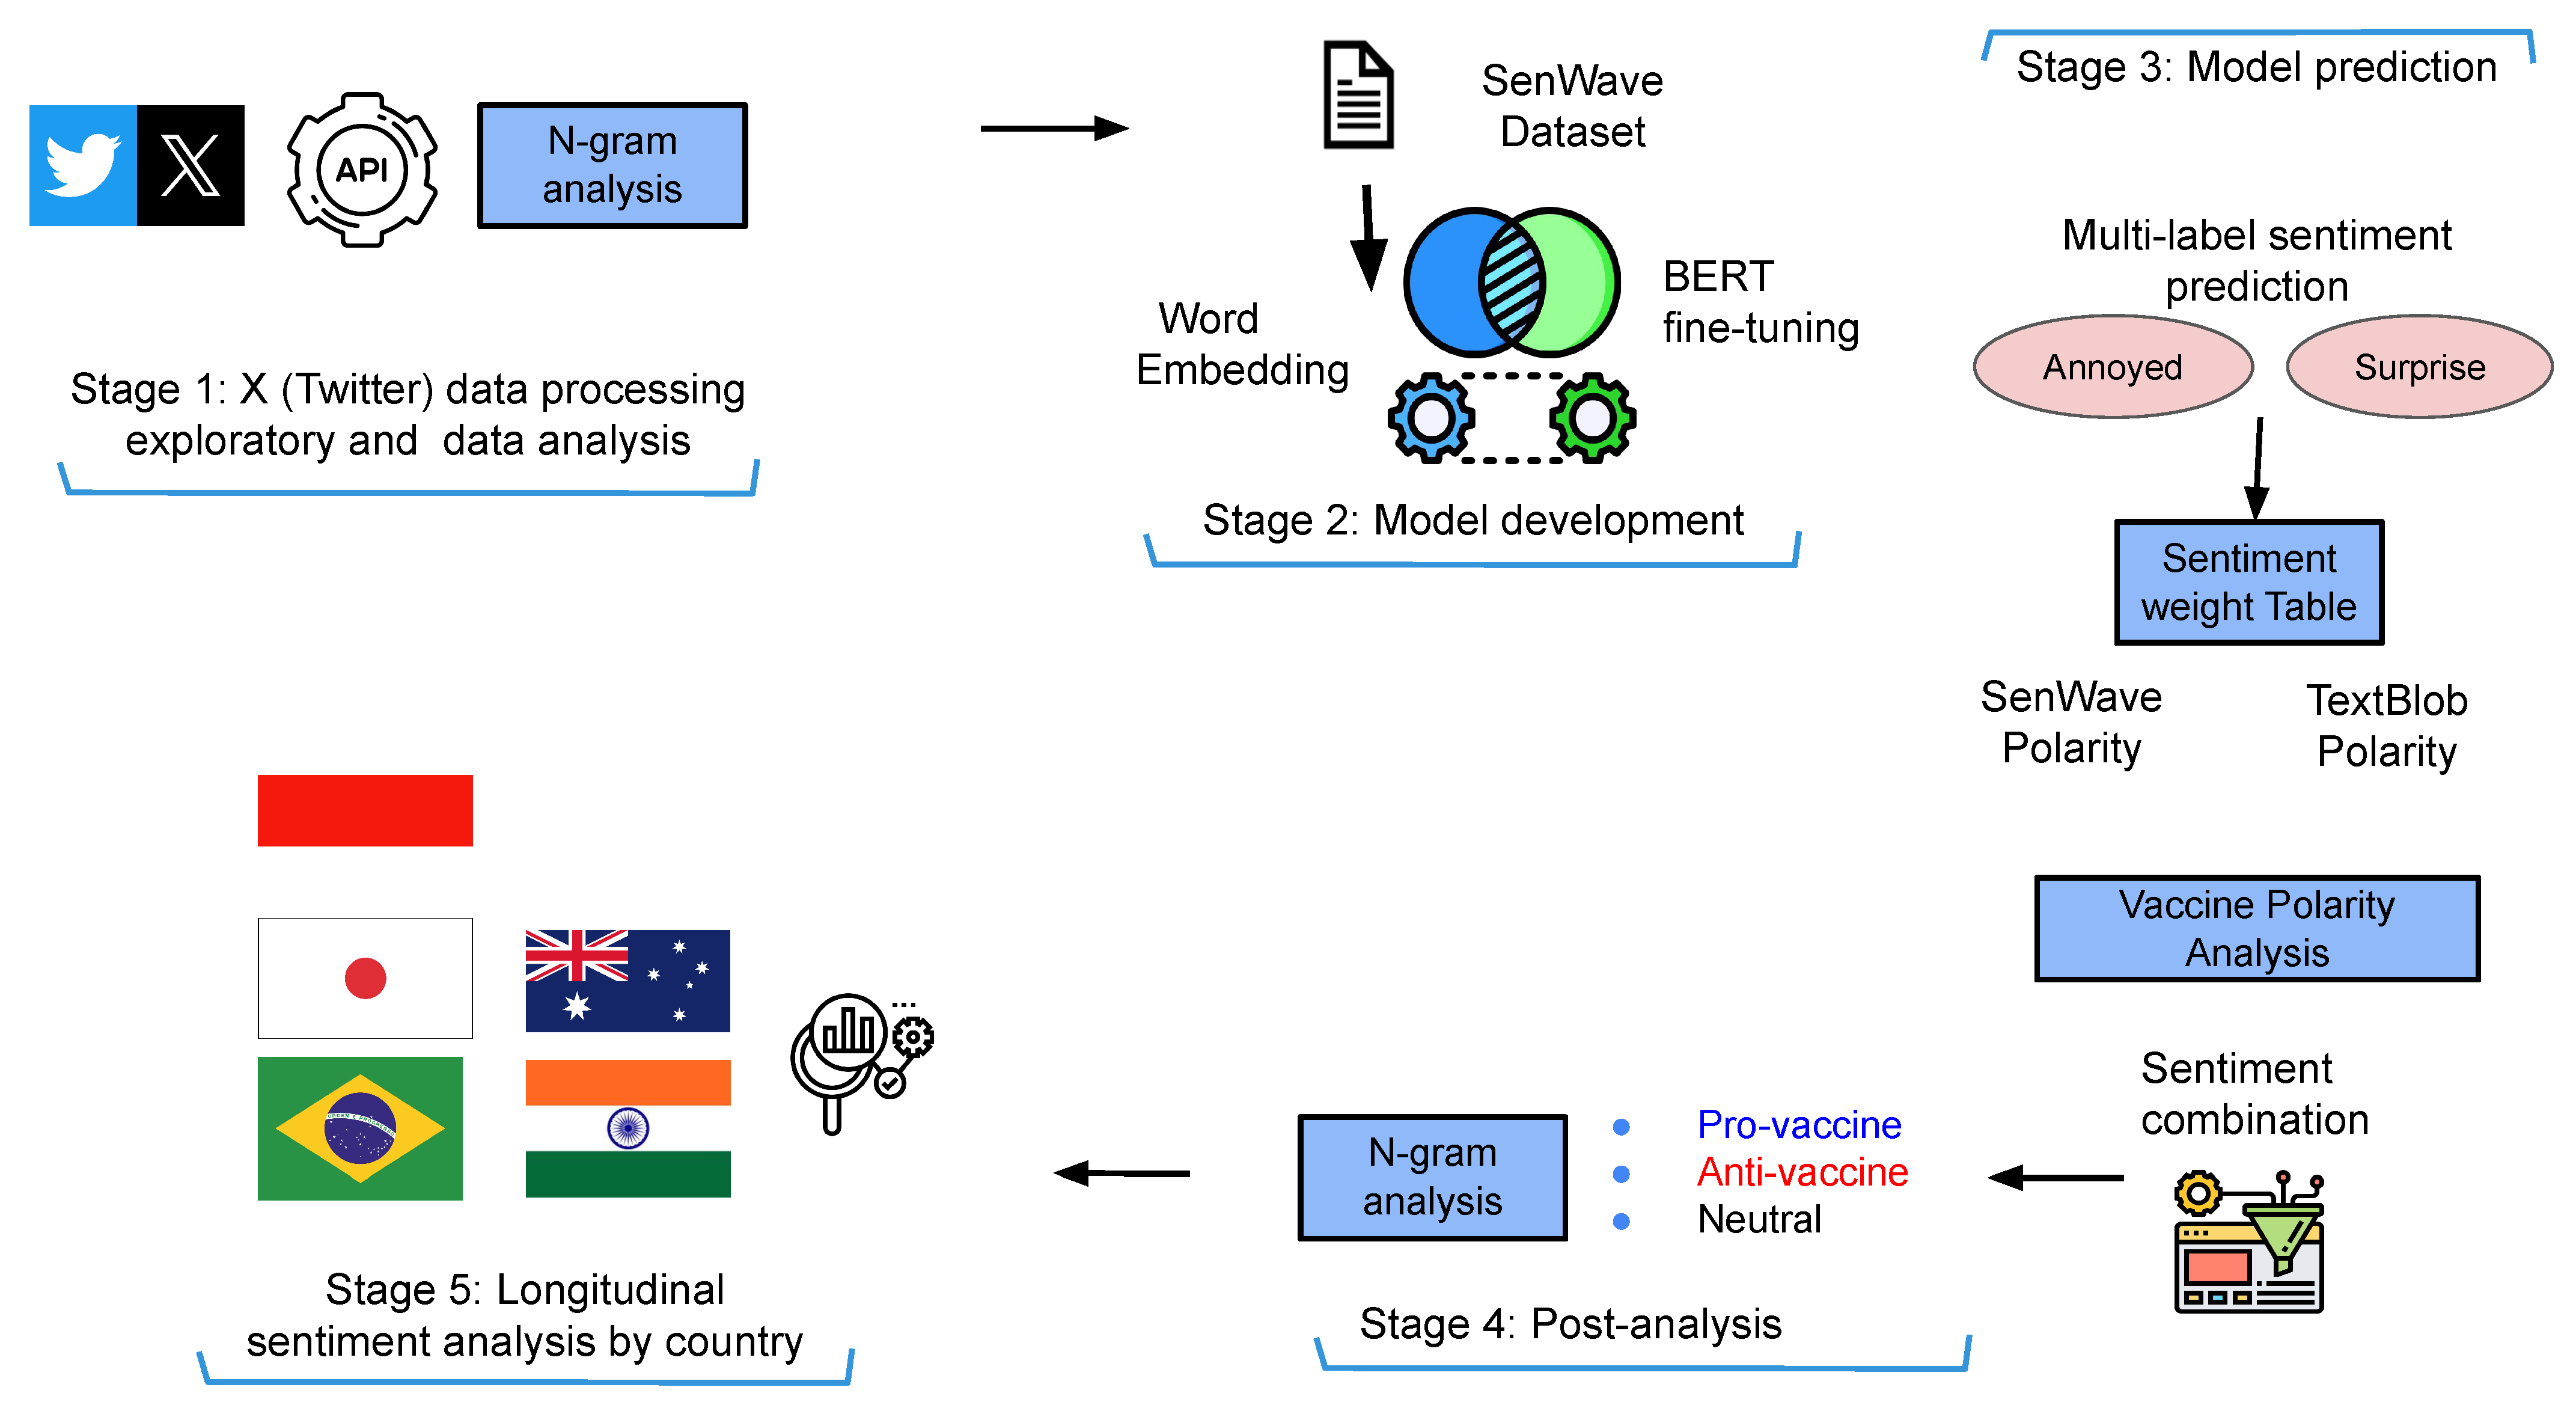
We present a sentiment analysis framework to support our investigation of anti-vaccine sentiment movements during the planning, development and distribution phases of COVID-19 vaccinations (Figure 1).
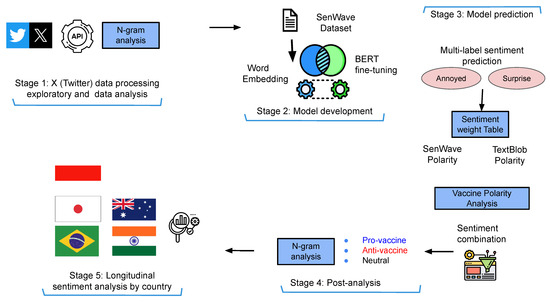
Figure 1.
Framework for using sentiment analysis for detecting anti-vaccine tweets for COVID-19 via deep learning models.
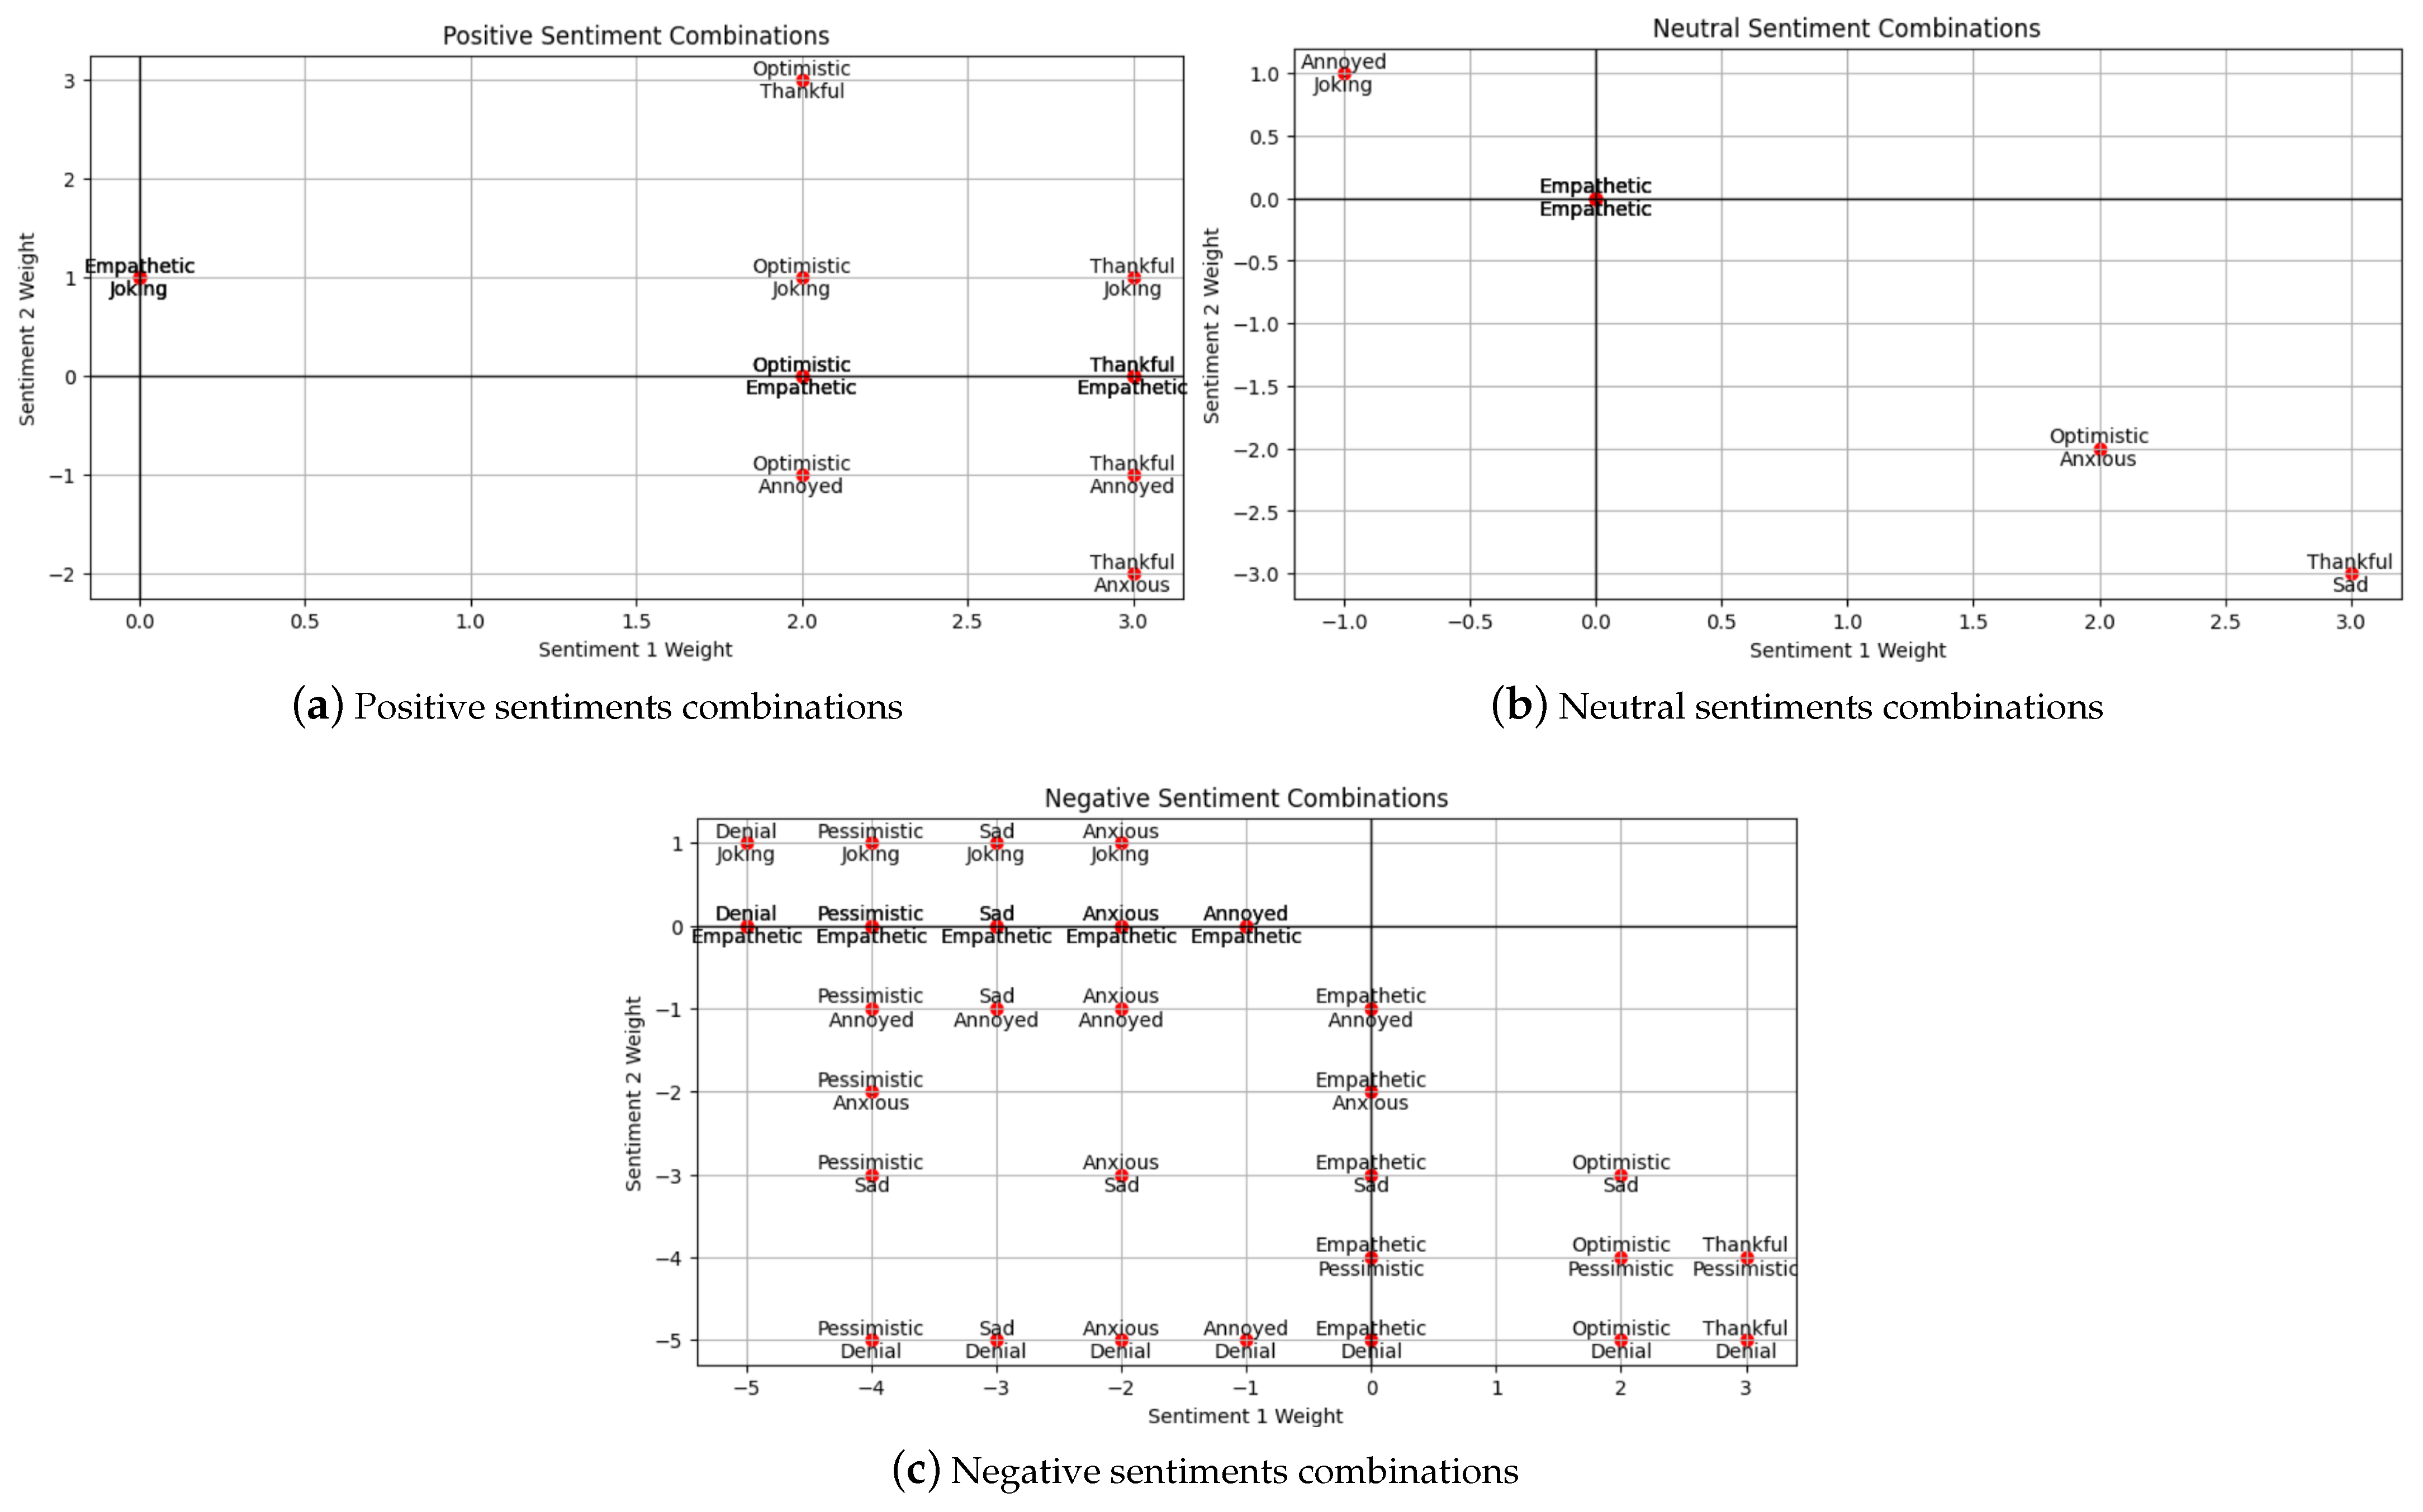
Figure 1 presents the framework for detecting anti-vaccine tweets using sentiment analysis, showing the major stages. In Stage 1, we first implement tweet extraction and the pre-processing of tweets based on keywords related to vaccination. We then provide exploratory data analysis such as finding vaccine-related tweets in COVID-19-related tweets over a selected time frame, along with bigram and trigram analysis. In Stage 2, we implement word embedding using the BERT model and apply refinement (fine-tuning) using the SenWave data for multi-label sentiment classification, i.e., a tweet can be labelled “optimistic” and “anxious”. In a multi-class classification task, all classes are mutually exclusive, and each instance can only be assigned one label, which is not the case for multi-label classification. Stage 3 features model prediction based on tweets from different countries. Once we obtain the tweet sentiment classified by the model, we make certain assumptions and devise a strategy to determine if the tweet is anti-vaccine, pro-vaccination, or neutral using a vaccine polarity score. We also compute the sentiment polarity score using a textual data processing library in Python known as TextBlob https://textblob.readthedocs.io/en/dev/ (last accessed on 8 December 2024). We assigned sentiment scores in Table 2, where a positive score indicates positive sentiment toward the statement, and a negative score indicates negative sentiment. We also provide a rescaled value in a range [−1,1] and then assign weights to each sentiment to calculate our vaccine polarity score given two sentiment labels. Figure 2 presents the combination of the sentiment labels to calculate the vaccine polarity score, where we use the sentiment score (Table 2) for each sentiment. In Stage 4, we implement post-analysis to categorise sentiments into pro-vaccine, anti-vaccine and neutral vaccine tweets during COVID-19. We provide n-gram analysis for tweets in the major categories. Finally, in Stage 5, we provide longitudinal sentiment analysis by country to review sentiment changes given the major events during COVID-19.
Table 2.
Sentiment weight assigned to each sentiment from sentiment score for calculating vaccine polarity score.
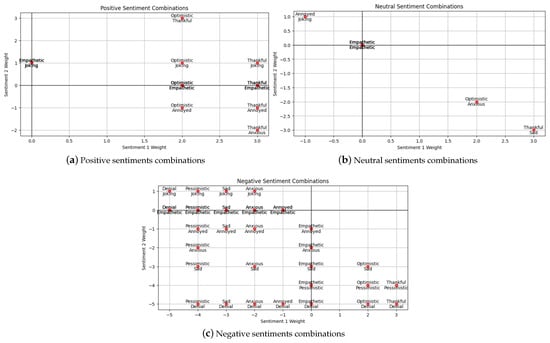
Figure 2.
Combination of two-sentiment labels for vaccine polarity score, where we add the weights (Table 2) of Sentiment 1 and Sentiment 2.
Note that the weights in Table 2 are based on the assumption that negative sentiments such as anxious and sad are slightly less negative when compared with “pessimistic” and “denial”. Plus, we consider “sad” to have a less negative polarity when considering the most negative ones. In the case of the positive sentiments, we take “optimistic” as fully positive and “thankful” and “joking” as partially positive. These weights can be altered in future work, which may impact the results.
2.4. Technical Setup
We adopt the technical setup of our framework from Chandra and Krishna [51], where the SenWave dataset and BERT-based model are used for sentiment analysis in India during the rise in COVID-19. We captured the interrelationships among those sentiment labels to better understand the overall semantic classification of tweets. After model training, we present country-wise tweets and record the sentiment prediction by the model for longitudinal analysis, visualisation, and post-analysis.
We use the default hyperparameters for the BERT-base (uncased) model BERT-base uncased from HuggingFace: https://huggingface.co/google-bert/bert-base-uncased (last accessed on 8 December 2024) obtained from HuggingFace, and the only major addition is a dropout layer at the end of the BERT architecture followed by a linear activation layer with 11 outputs for multi-label sentiment classification. We use a computer with 1 Intel Core i7- processor and 16 gigabytes of memory. In order to validate the refinement of the BERT model using SenWave, we implement a 90:10 ratio for training and test sets. We employ a relatively low learning rate of 1 × 10⁻⁵ for BERT, and the training (refinement) process spans 4 epochs.
3. Results
3.1. Data Analysis
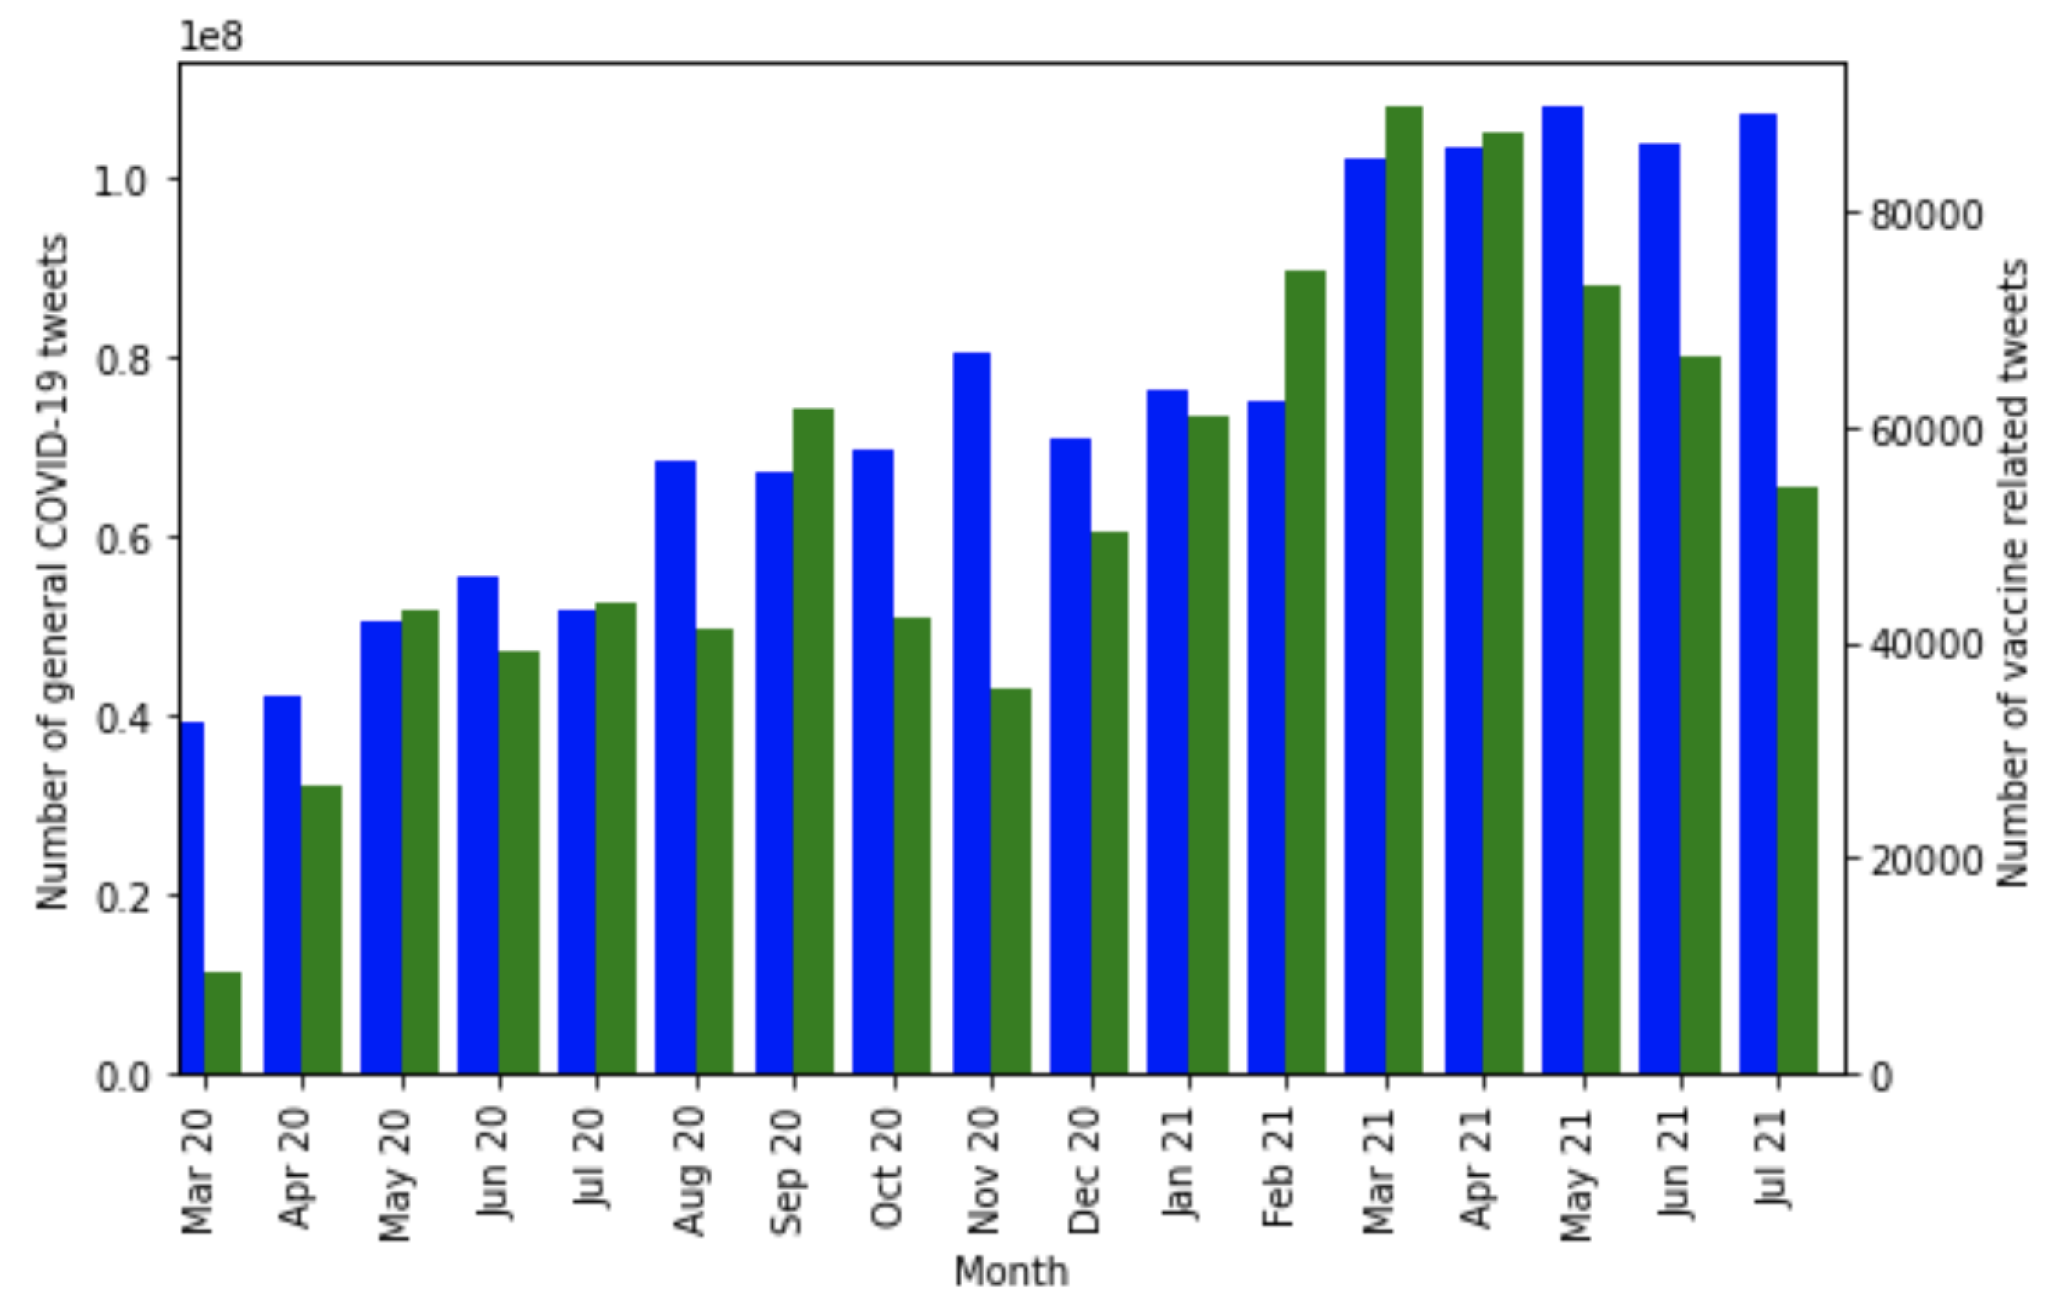
We first present data analysis for extracted tweets related to COVID-19. Figure 3 compares the volume of vaccine-related tweets and general COVID-19-related tweets at the beginning of the pandemic (March–July 2020). We notice fewer vaccine-related tweets during the beginning of the pandemic (March and April 2020), compared to the following months (May, June, and July 2020). Afterwards, there is a decline and then a rise in vaccine-related tweets. These trends align with the discussions by mainstream media, the vaccination rate, and related factors that give rise to such tweets.
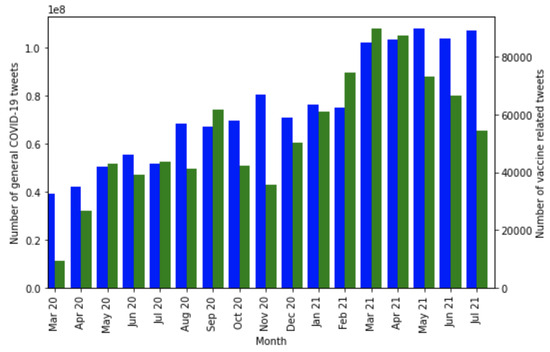
Figure 3.
Comparison between general COVID-19 tweet counts (blue) and COVID-19 vaccine-related tweets (green) worldwide from March 2020 to July 2021. Note that 1e8 denotes 1 × 10⁸ in the y-axis.
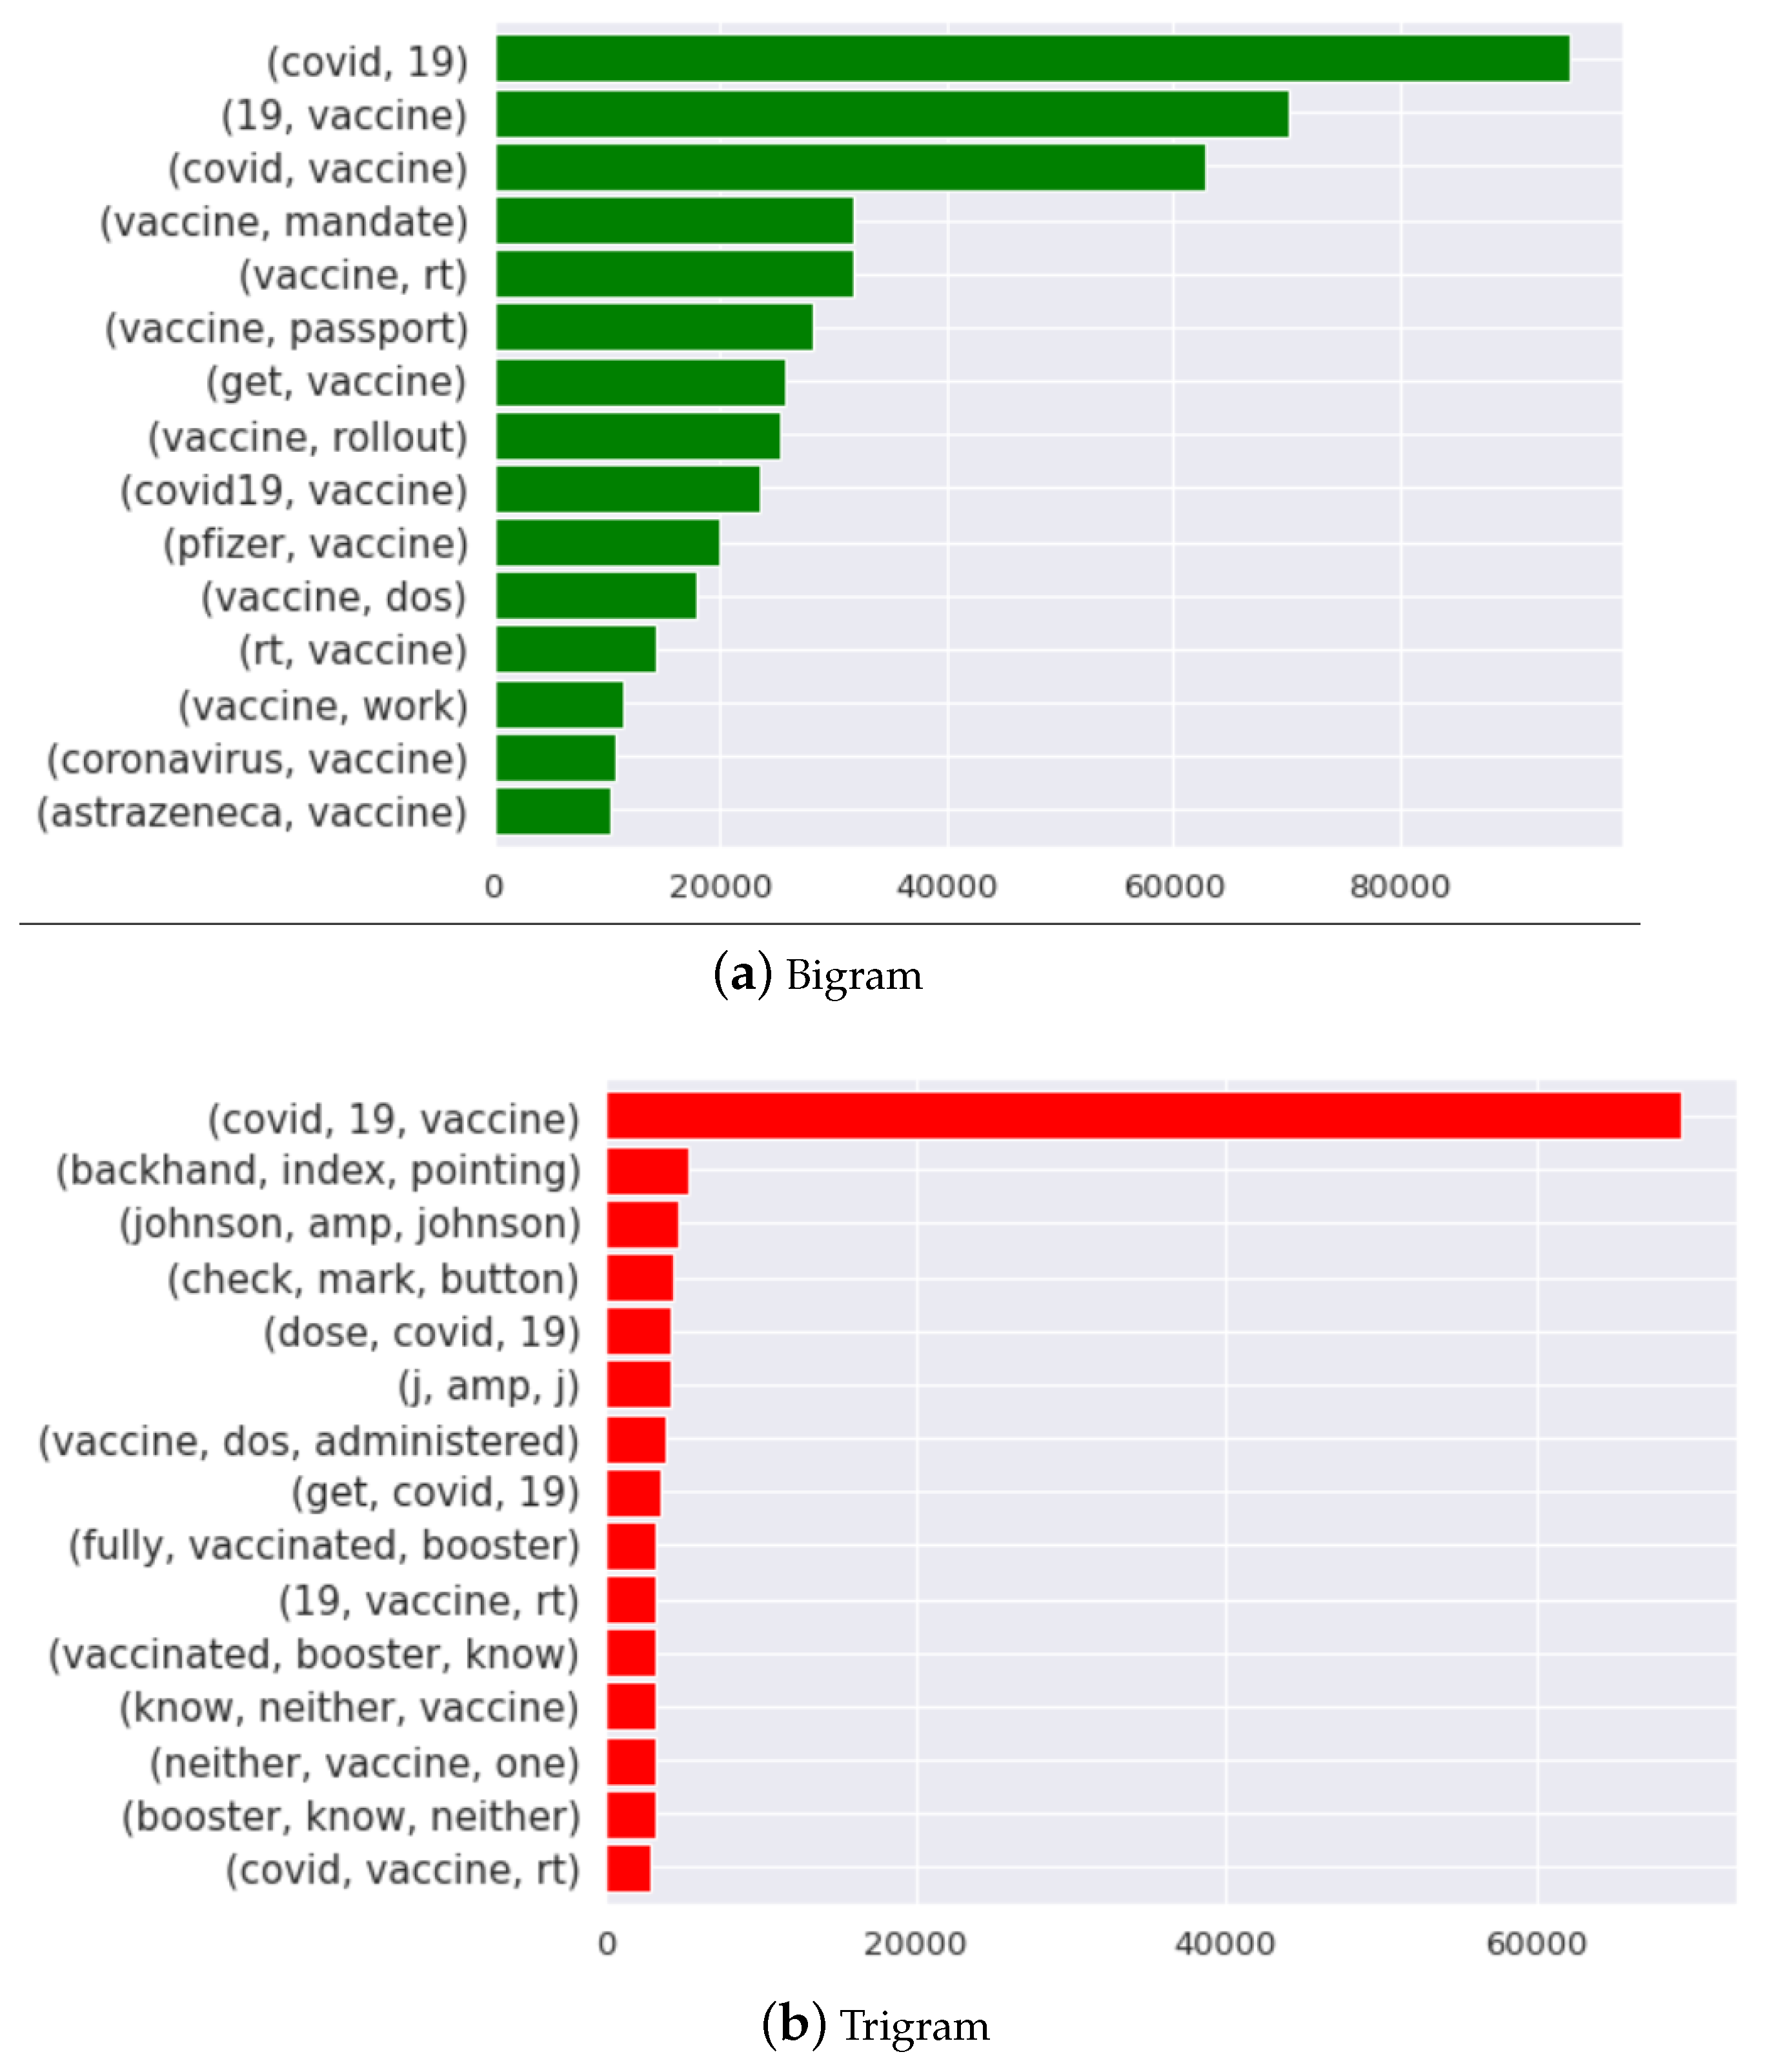
N-gram [78] analysis is a method frequently used in NLP to capture the interdependencies among sequences of words of length N in textual data. We conduct a word-level bigram and trigram analysis from March 2020 to July 2021 worldwide to find occurrences of consecutive words in the selected tweet dataset as shown in Figure 4. We observe that in the bi-grams, the phrase “covid19 vaccine” has the highest frequency of appearance, closely followed by “vaccine force” and “waning immunity”. In the trigrams, the three-worded phrase “fight covid19 smile” (the smiling emoji has been converted into the word “smile”) is most commonly used, followed by “covid19 positive test” and “positive antibody test”.

Figure 4.
Bigram and trigram analysis of vaccine-related tweets posted between March 2020 and July 2021 for all the selected countries.
3.2. Model Prediction
Table 3 shows the model training results (mean) for the test data (10 percent) for 10 experiments obtained from previous work [51]. The results report the F1-scores, where we compute the F1-macro using the F1-score per class/label, whereas F1-micro computes the F1-score for the entire data. We further use the Binary Cross-Entropy (BCE) loss [79] which is a softmax activation combined with a cross-entropy loss, and Hamming loss that considers the loss generated in the bit string of class labels. The Label Ranking Average Precision (LRAP) score reports the percentage of the higher-ranked labels that resemble true labels. We find that BERT is better than LSTM and Bidirectional LSTM (BD-LSTM) models; hence, we proceed with the BERT model.
Table 3.
Results taken from previous work [51] using the Senwave COVID-19 training dataset, where the higher scores show better performance except for the BCE and Hamming loss.
3.3. Sentiment Analysis by Country
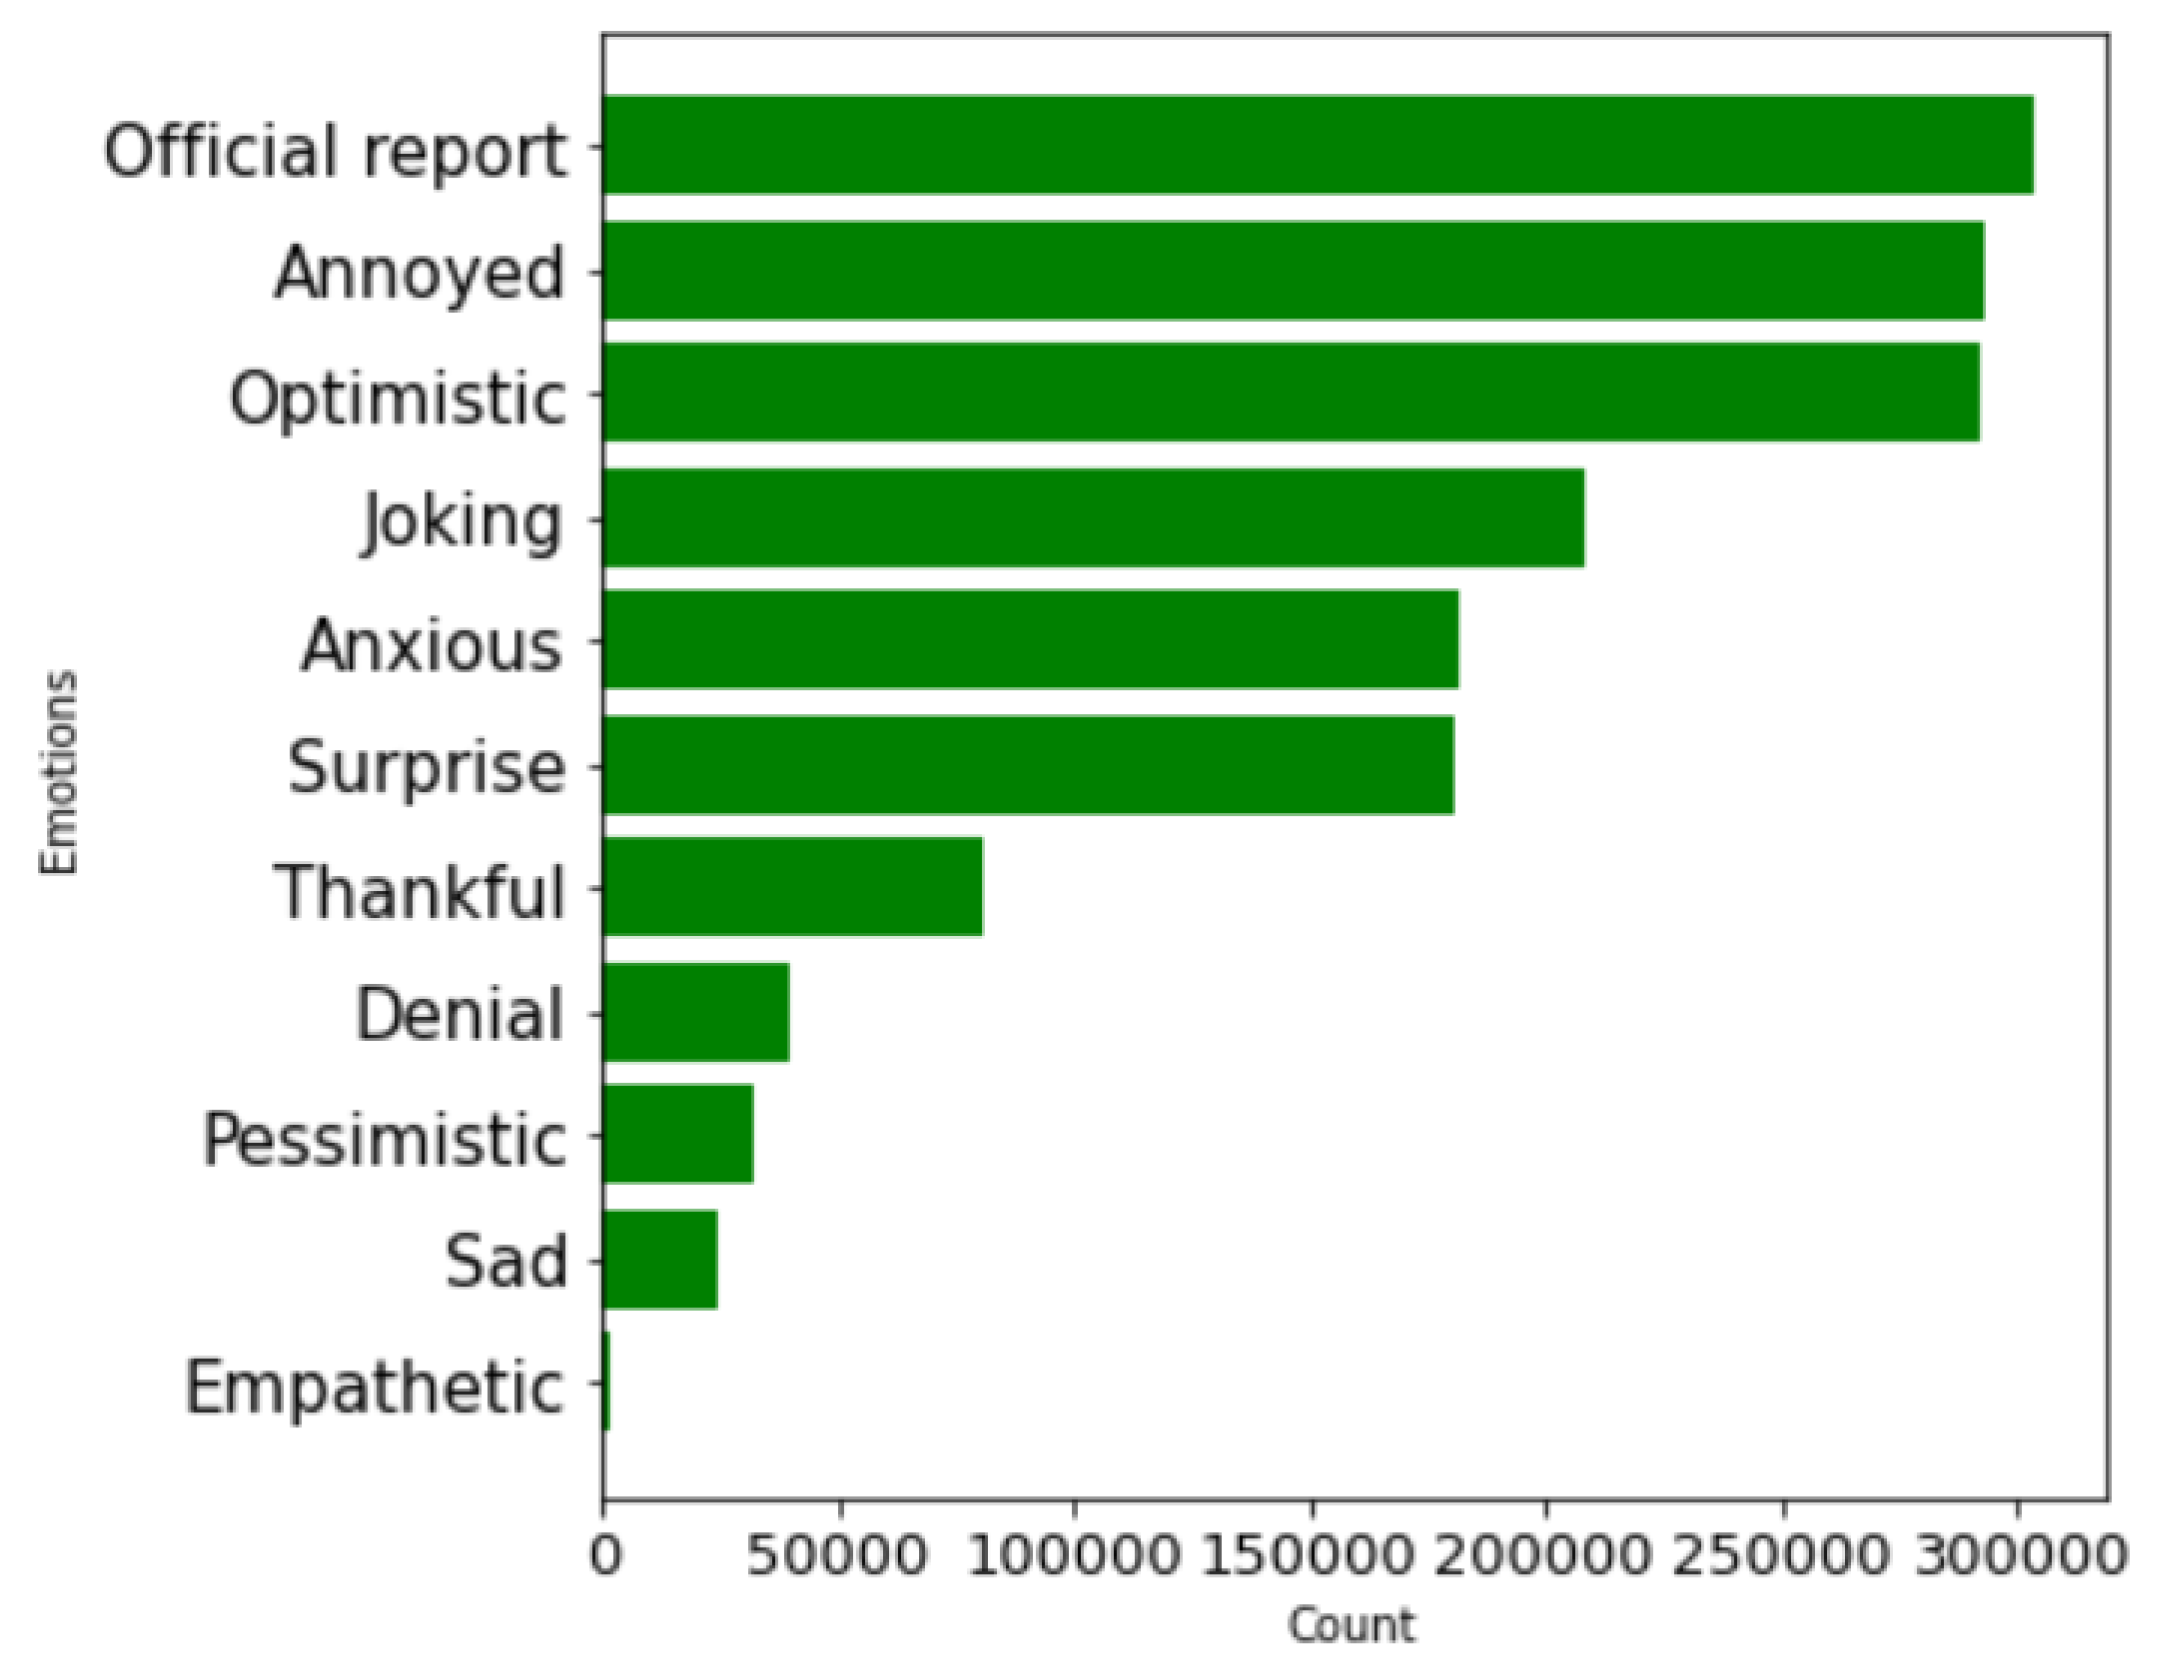
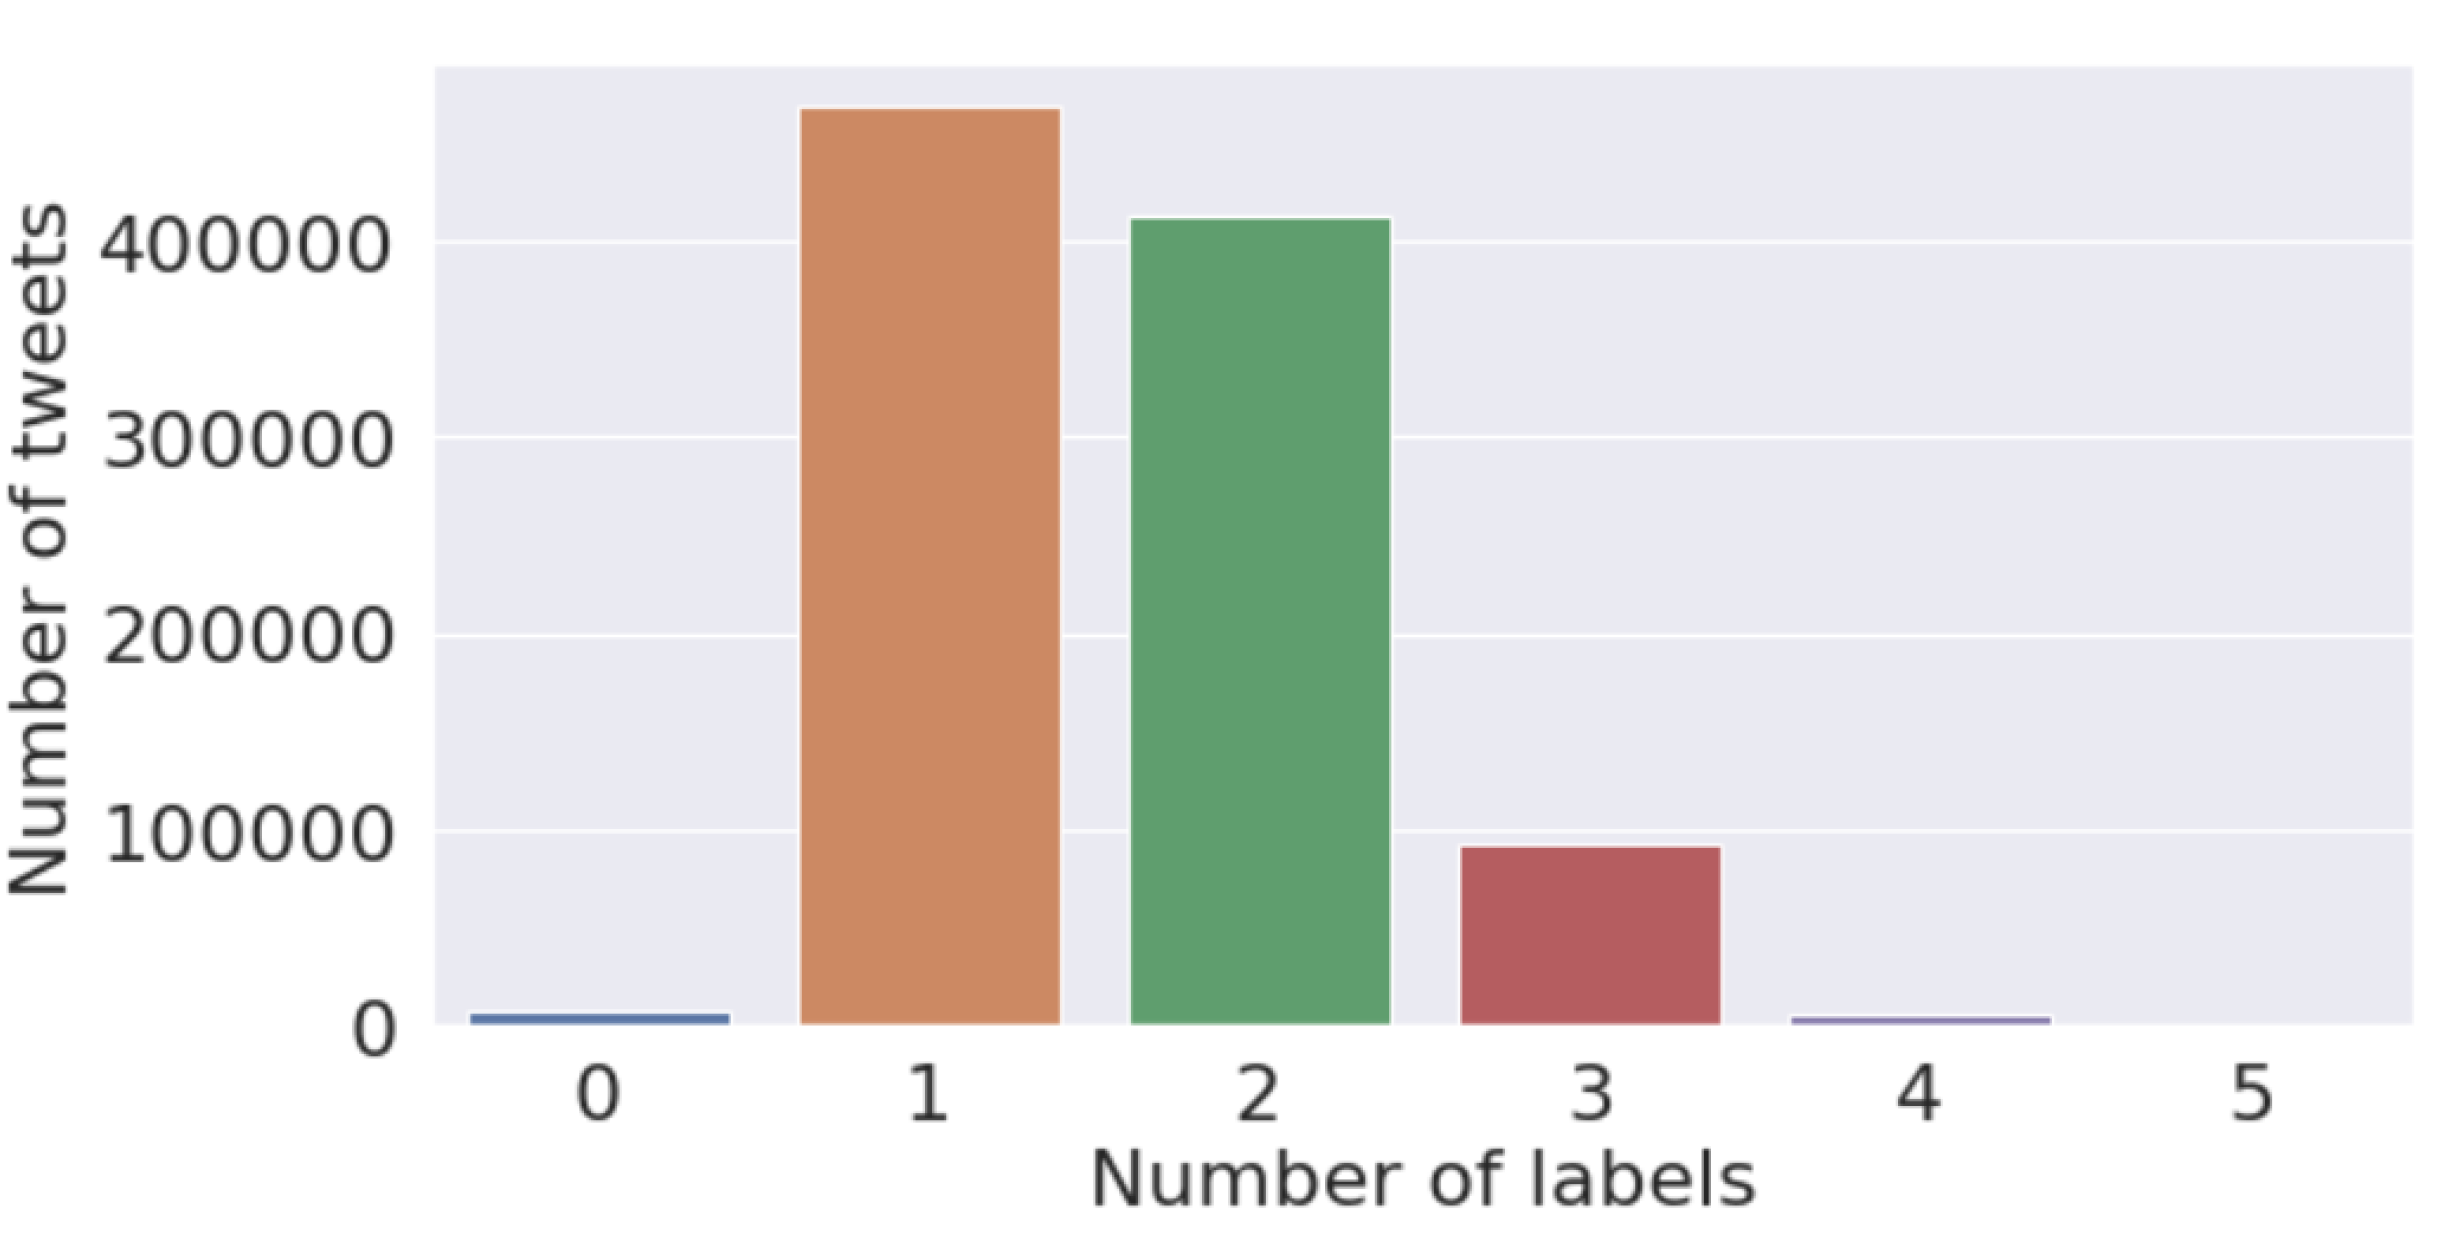
Finally, we present the longitudinal analysis of sentiments in COVID-19-related tweets over the period from March 2020 to February 2022 based on the 11 sentiment labels. Figure 5 gives an idea about how tweets are distributed according to their sentiments. From this plot, we can observe that 300,000 tweets correspond to the sentiment “official report”, followed by “annoyed” and “optimistic”. This shows the sentiments that have dominated among (x) Twitter (X) users during the COVID-19 pandemic. Figure 6 shows that more than 400,000 tweets correspond to only one sentiment, followed by only two sentiments.

Figure 5.
Number of vaccine-related tweets for each sentiment.

Figure 6.
Analysis plot of the number of tweets corresponding to the number of sentiments.
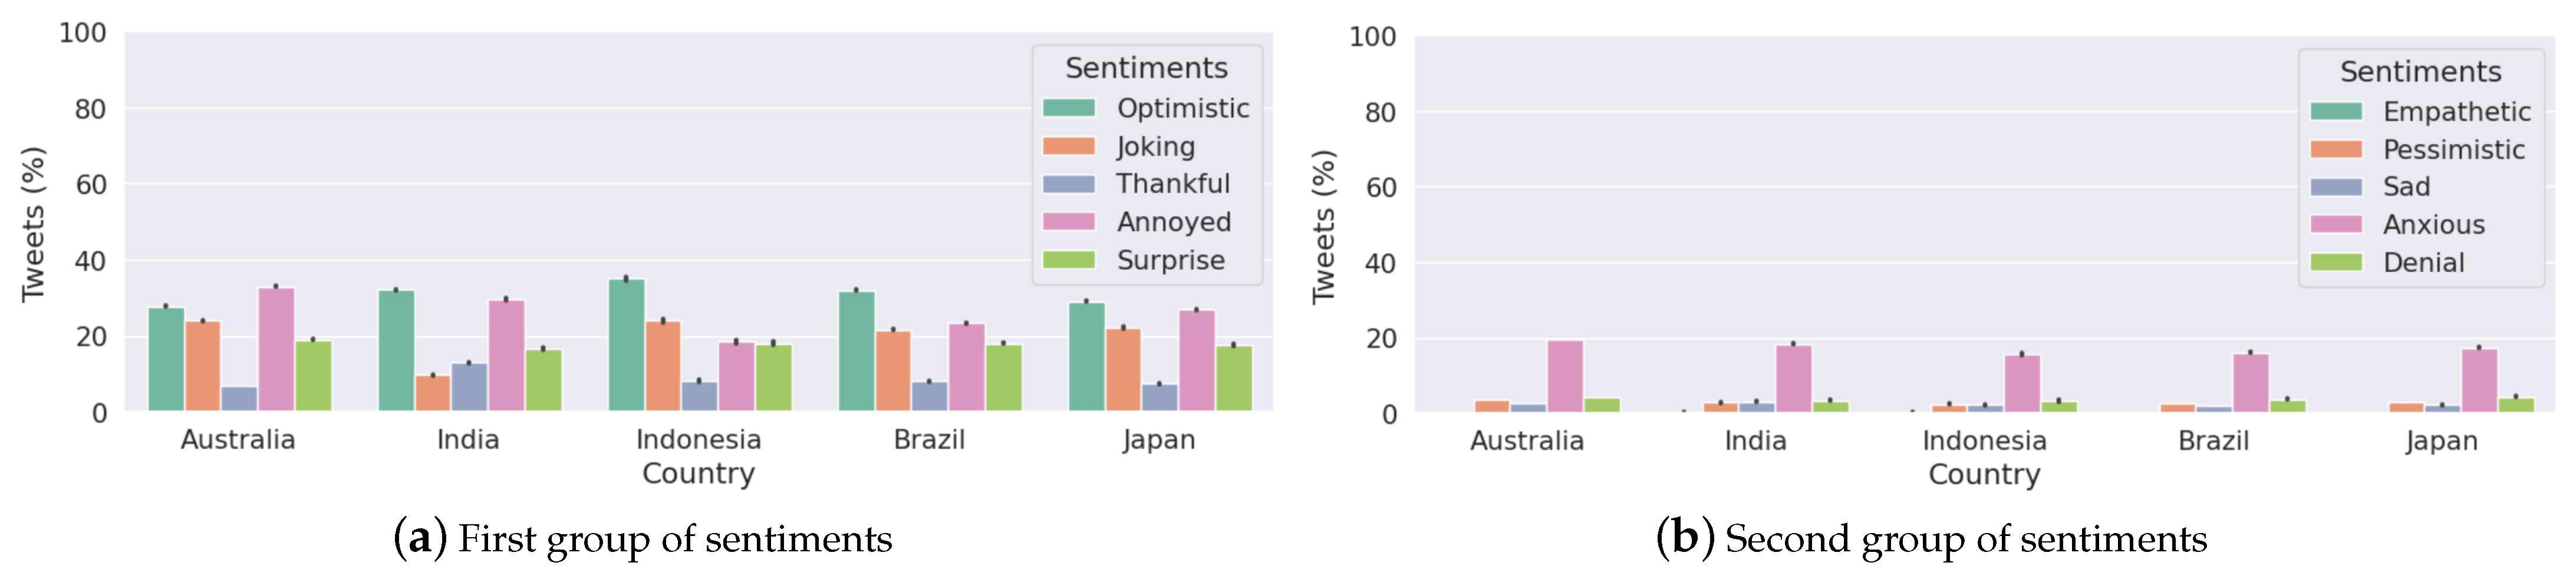
Figure 7 presents the box plot that shows that the median of polarity scores is very close to 0, or almost 0. By examining the interquartile ranges for each country, we can discuss any differences in the variability of polarity. A wider interquartile range suggests a greater variation in sentiment among Twitter users in that country, while a narrower range suggests a more consistent sentiment, as in the case of Australia. Figure A1 shows a violin plot of vaccine polarity scores for different countries that suggests the polarity density of tweets for different countries. Figure 8 presents the percentage of tweets belonging to sentiments for each country. We note that “optimistic”, “joking”, and “annoyed” are the most expressed sentiments (Panel (a)) along with anxiety (Panel (b)).
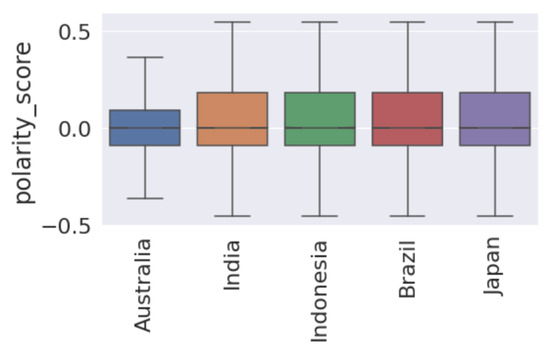
Figure 7.
Boxplot the analysis of the polarity score among different countries.

Figure 8.
This plot shows the percentage of tweets belonging to sentiments for each country.
Next, we present the longitudinal analysis of the polarity score, the number of tweets, and the number of cases in the five selected countries. Figure 9 presents the monthly polarity scores computed by our polarity score (Figure 2) methodology (Panel (a)) and TextBlob library https://textblob.readthedocs.io/en/dev/ ( last accessed on 8 December 2024) (Panel b) for each country which overlaps with the number of monthly tweets in Figure 10 and the number of novel monthly cases in Figure 11. Overall, we find that both methods in Figure 9 have a similar trend from February 2021. In the first half of the pandemic (March 2020 to January 2021), we notice that both methods have drastic changes in the polarity scores. In the case of Japan, Panel (a) shows that the polarity decreased from April to July 2020, whereas Panel (b) shows that the polarity increased during the same period. Afterwards, both methods show an increasing trend. In the case of other countries, we see that the majority of the time, there are similar trends given by both methods.
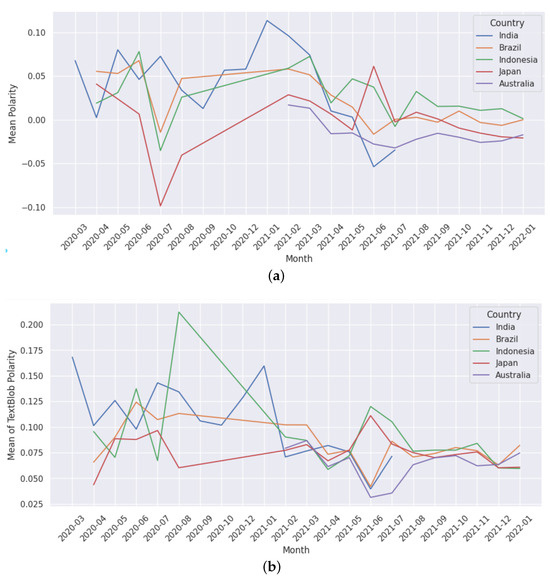
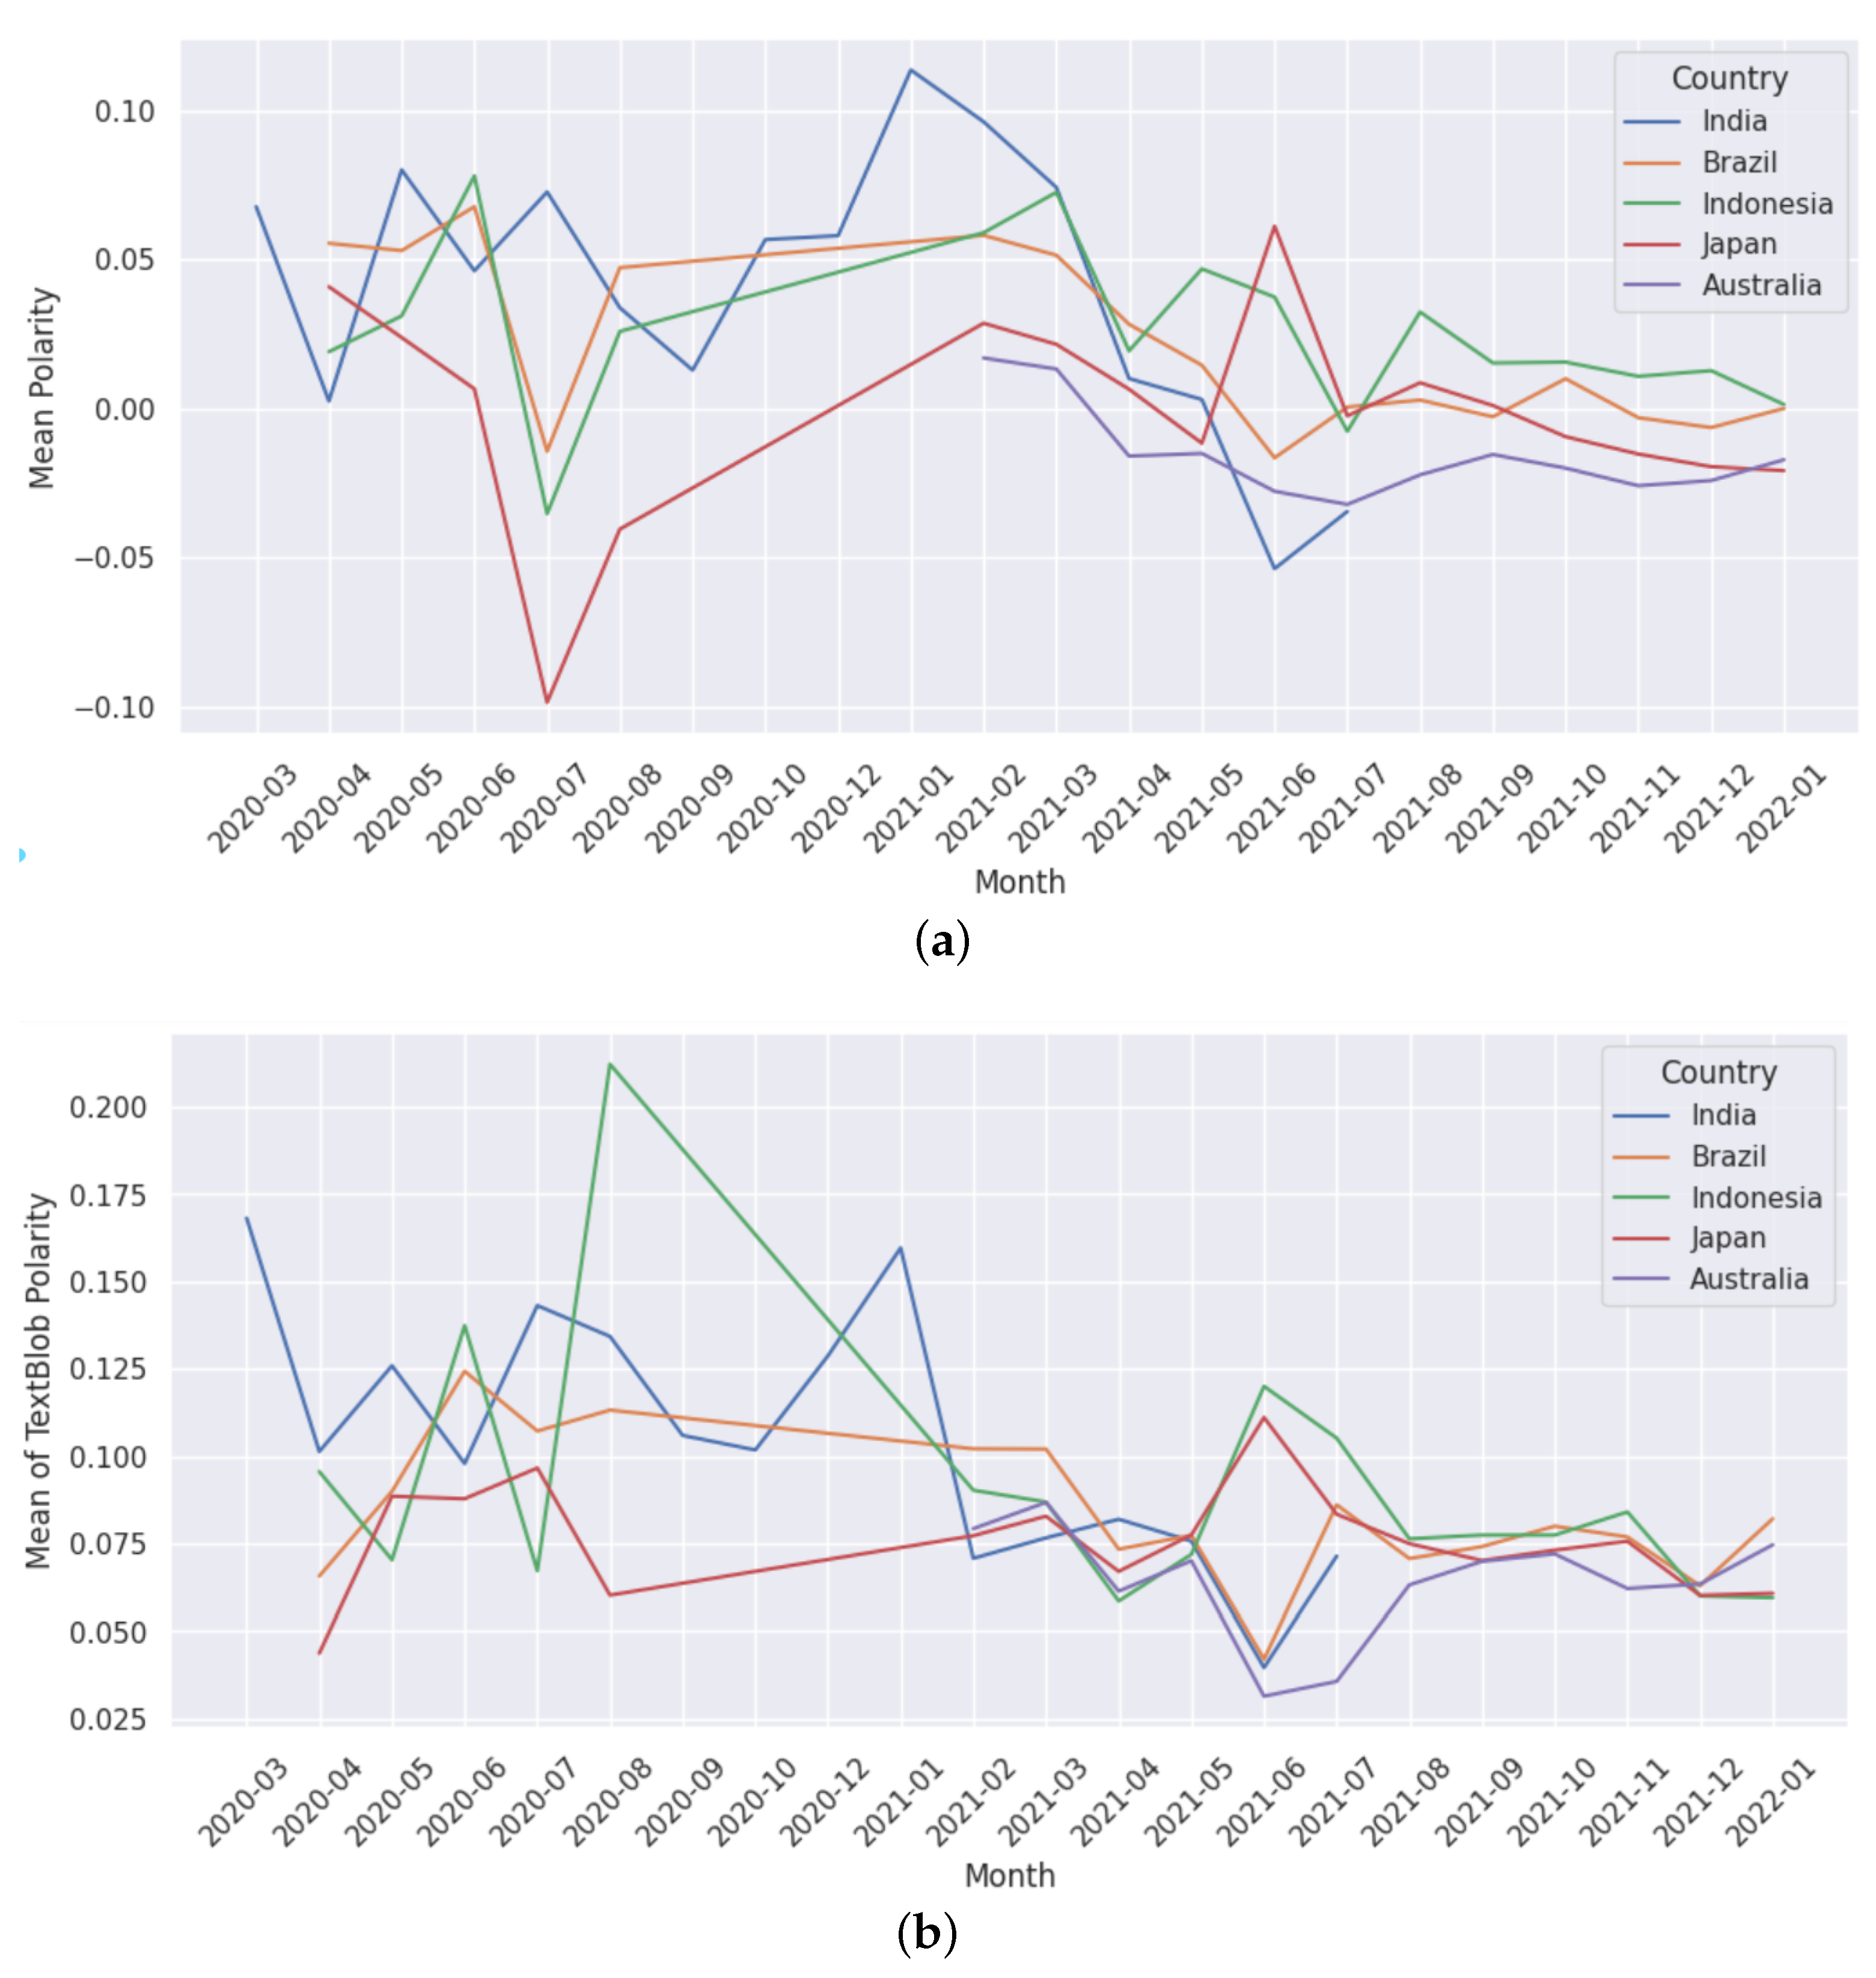
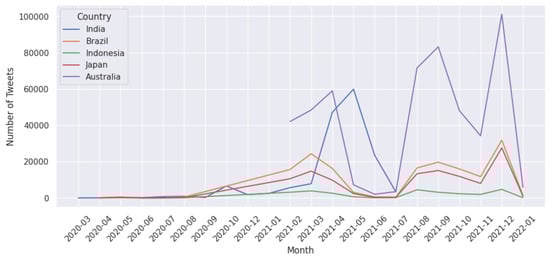
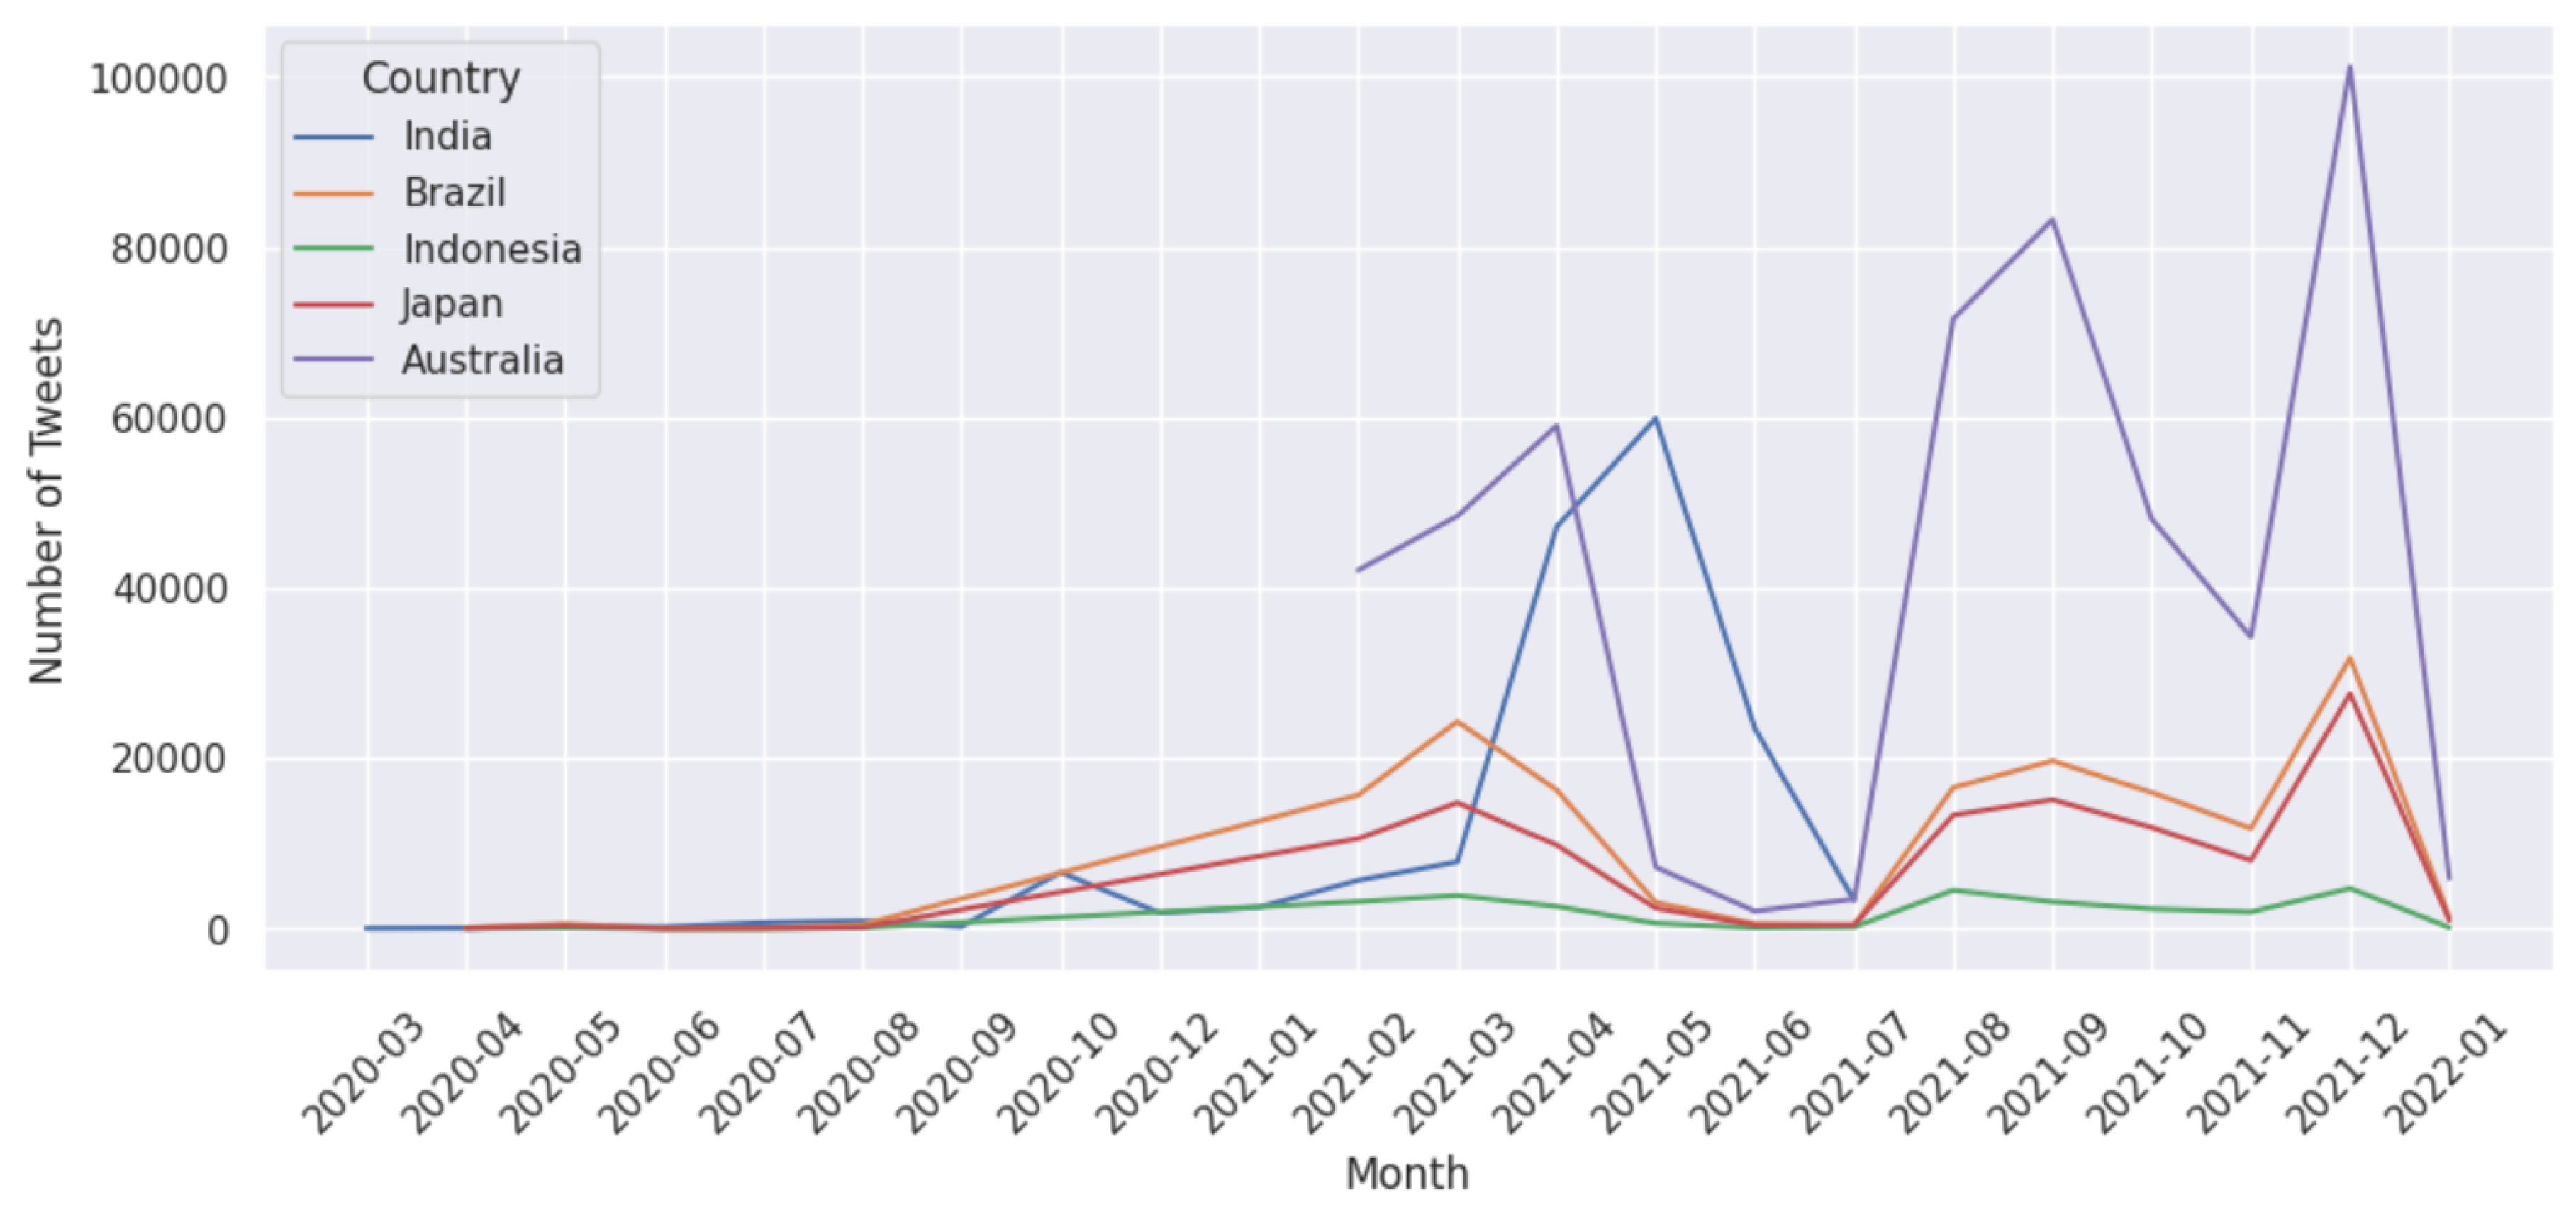
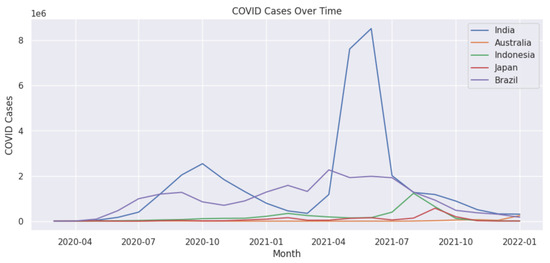
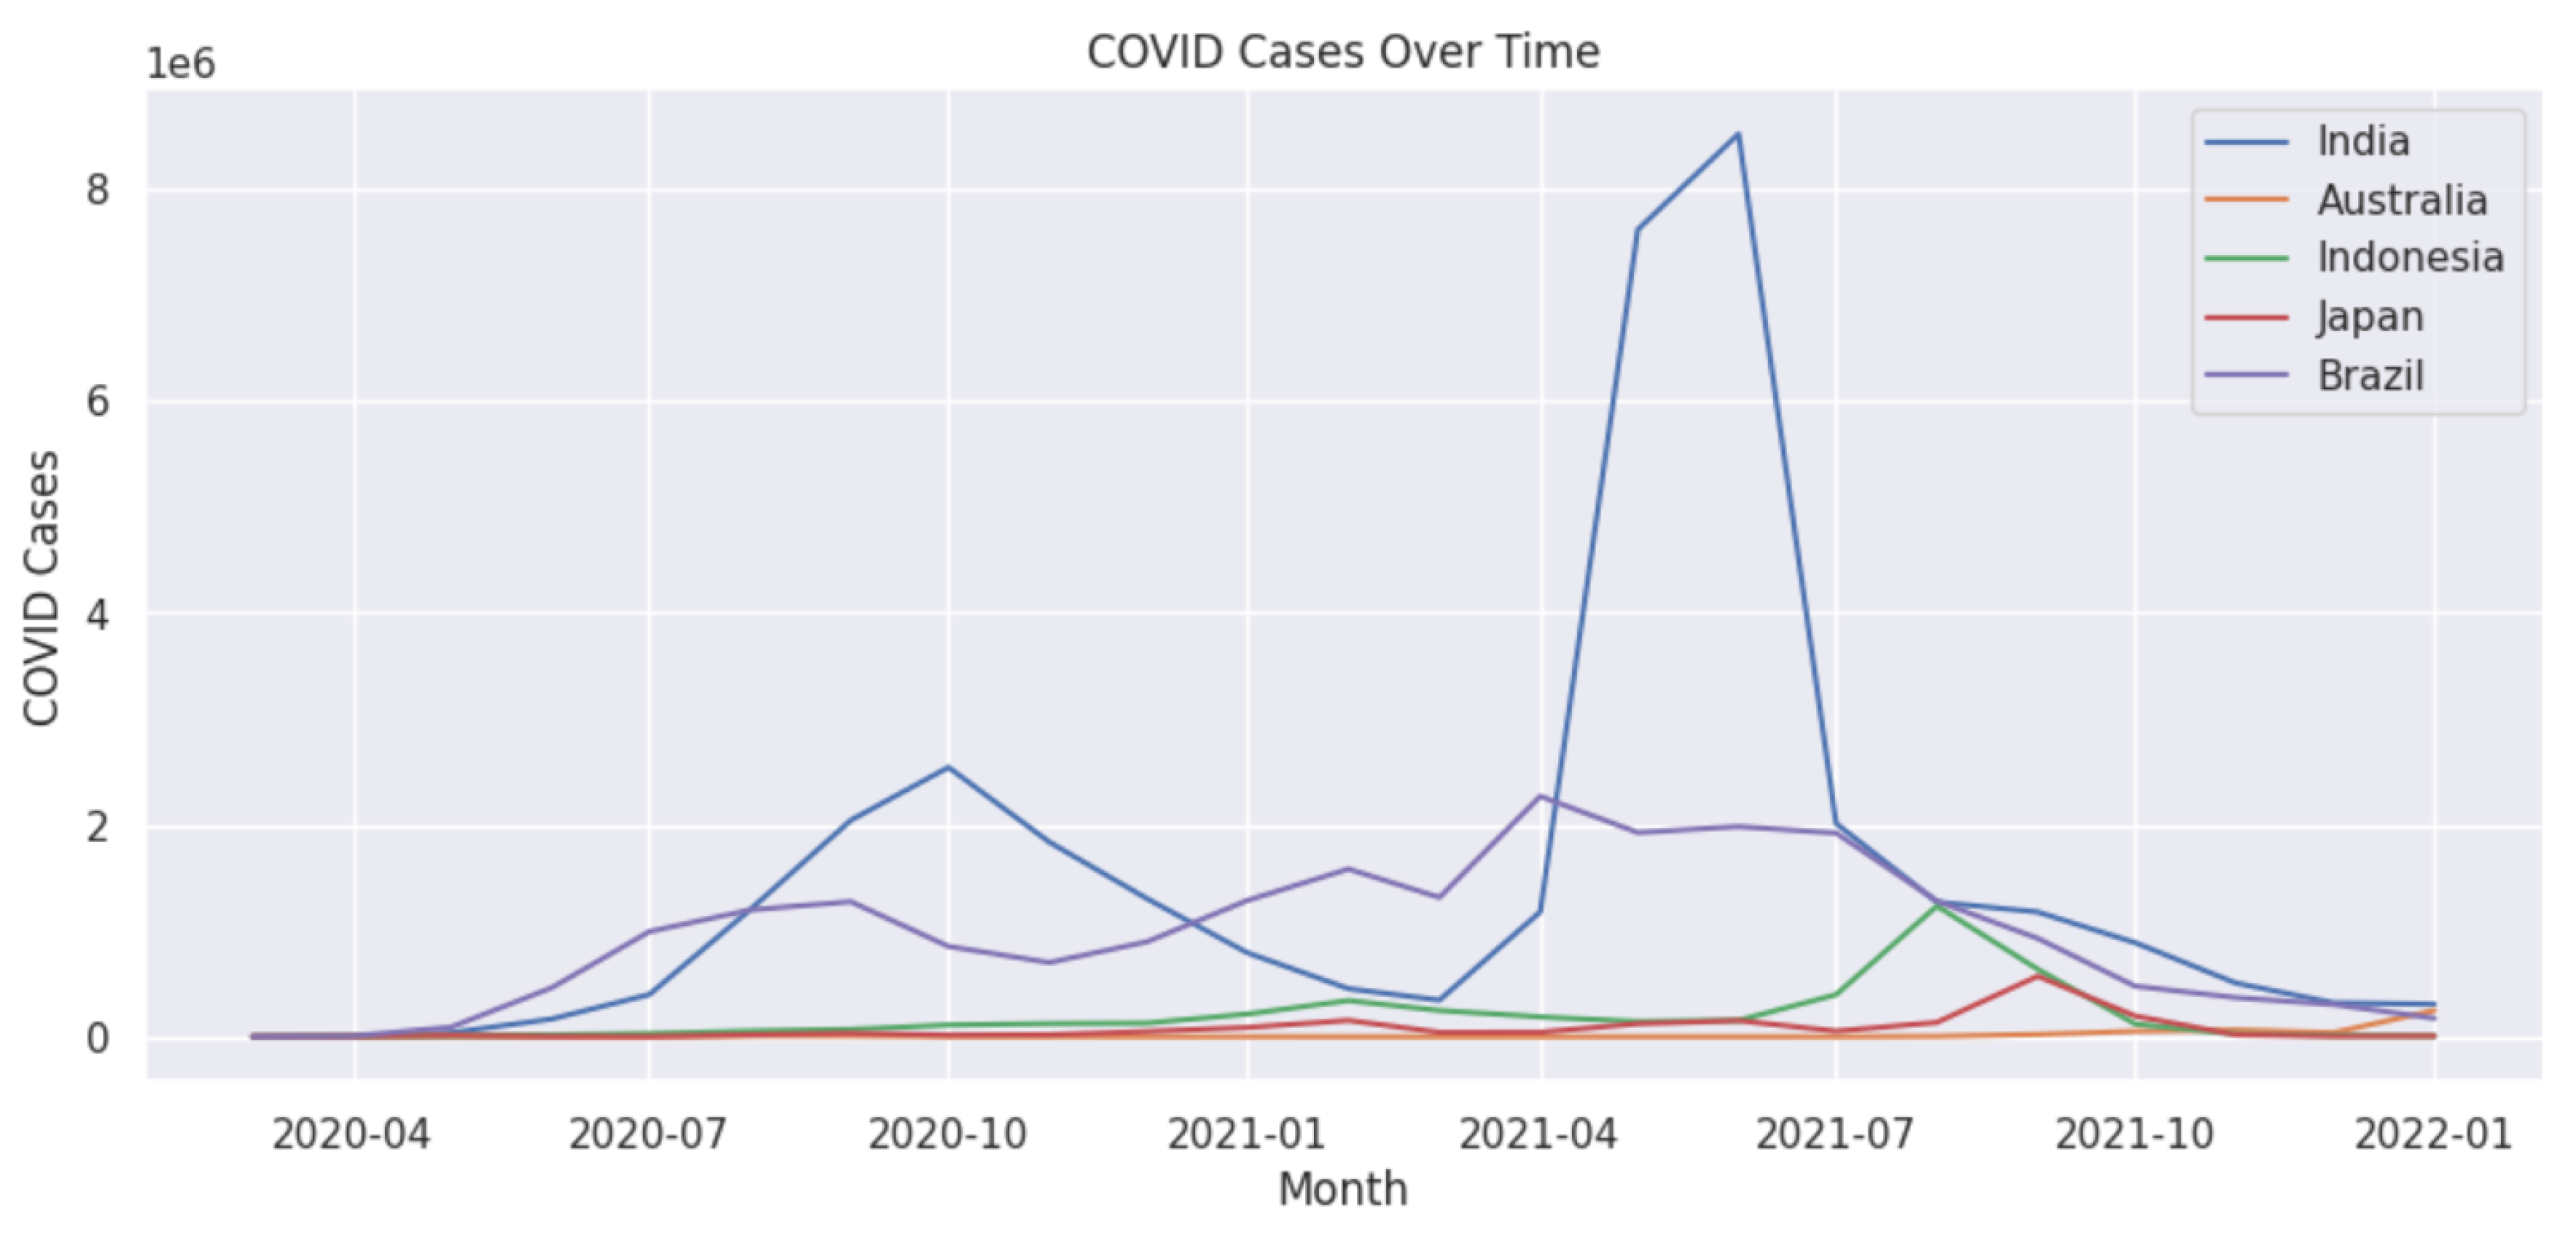
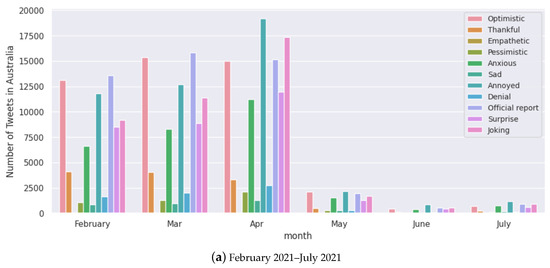
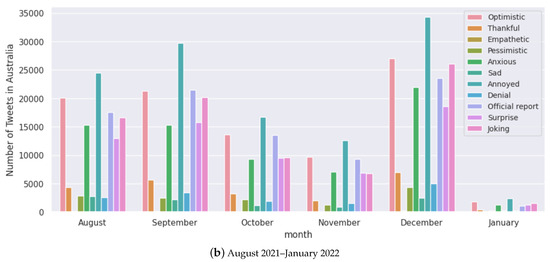
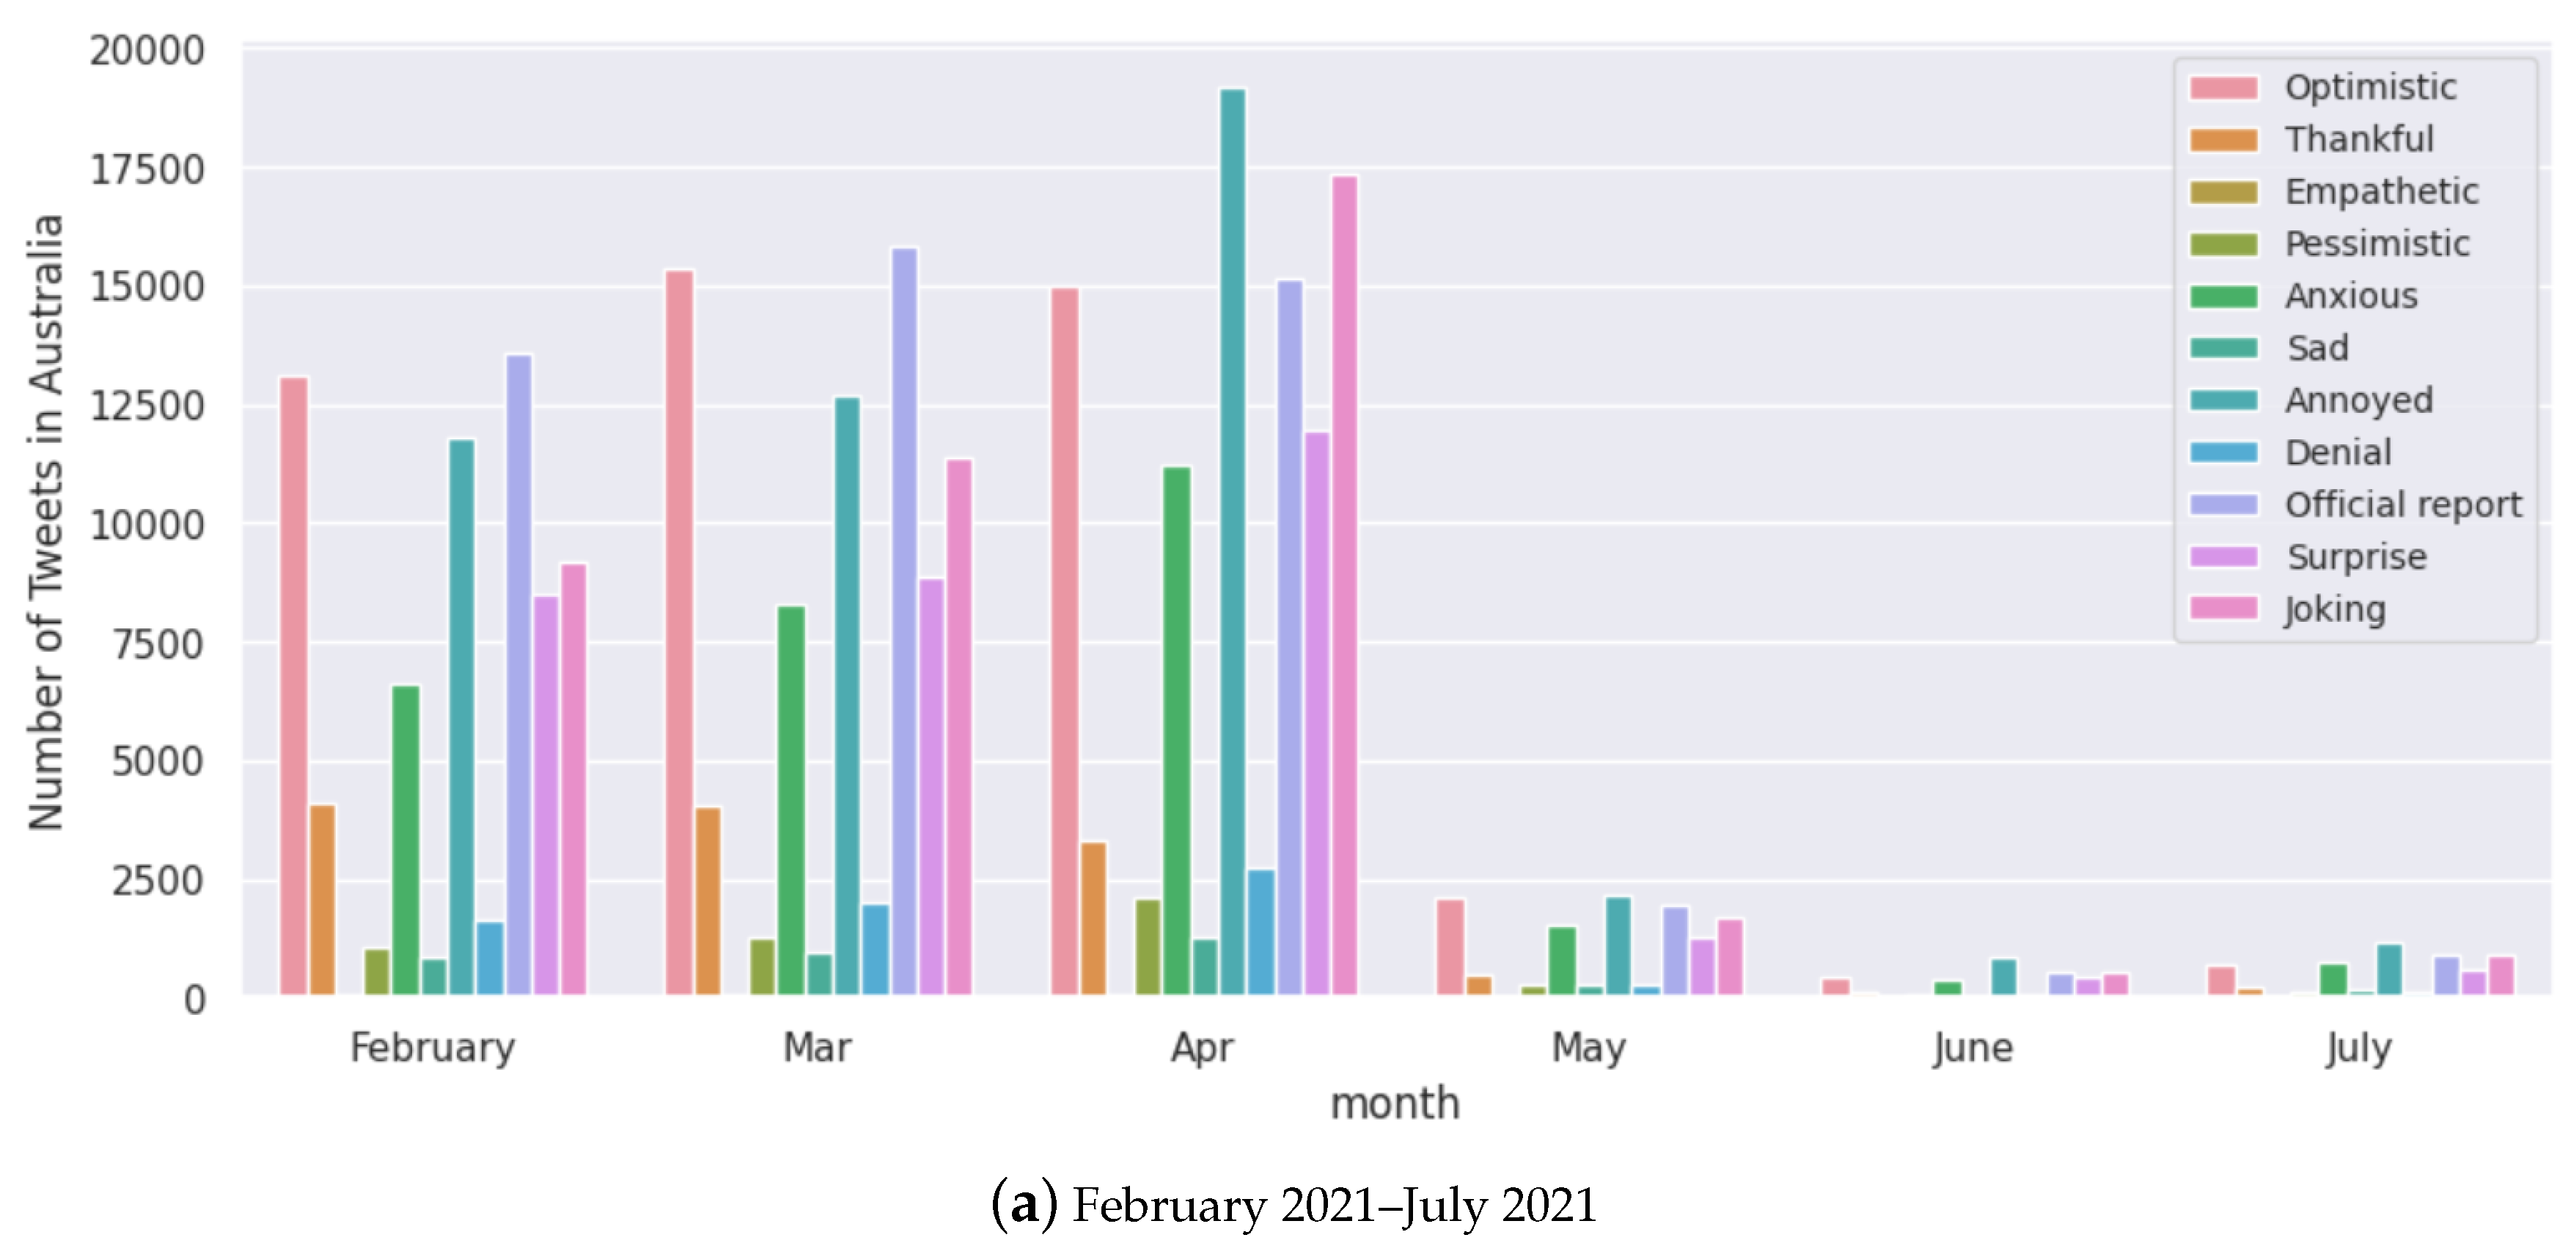
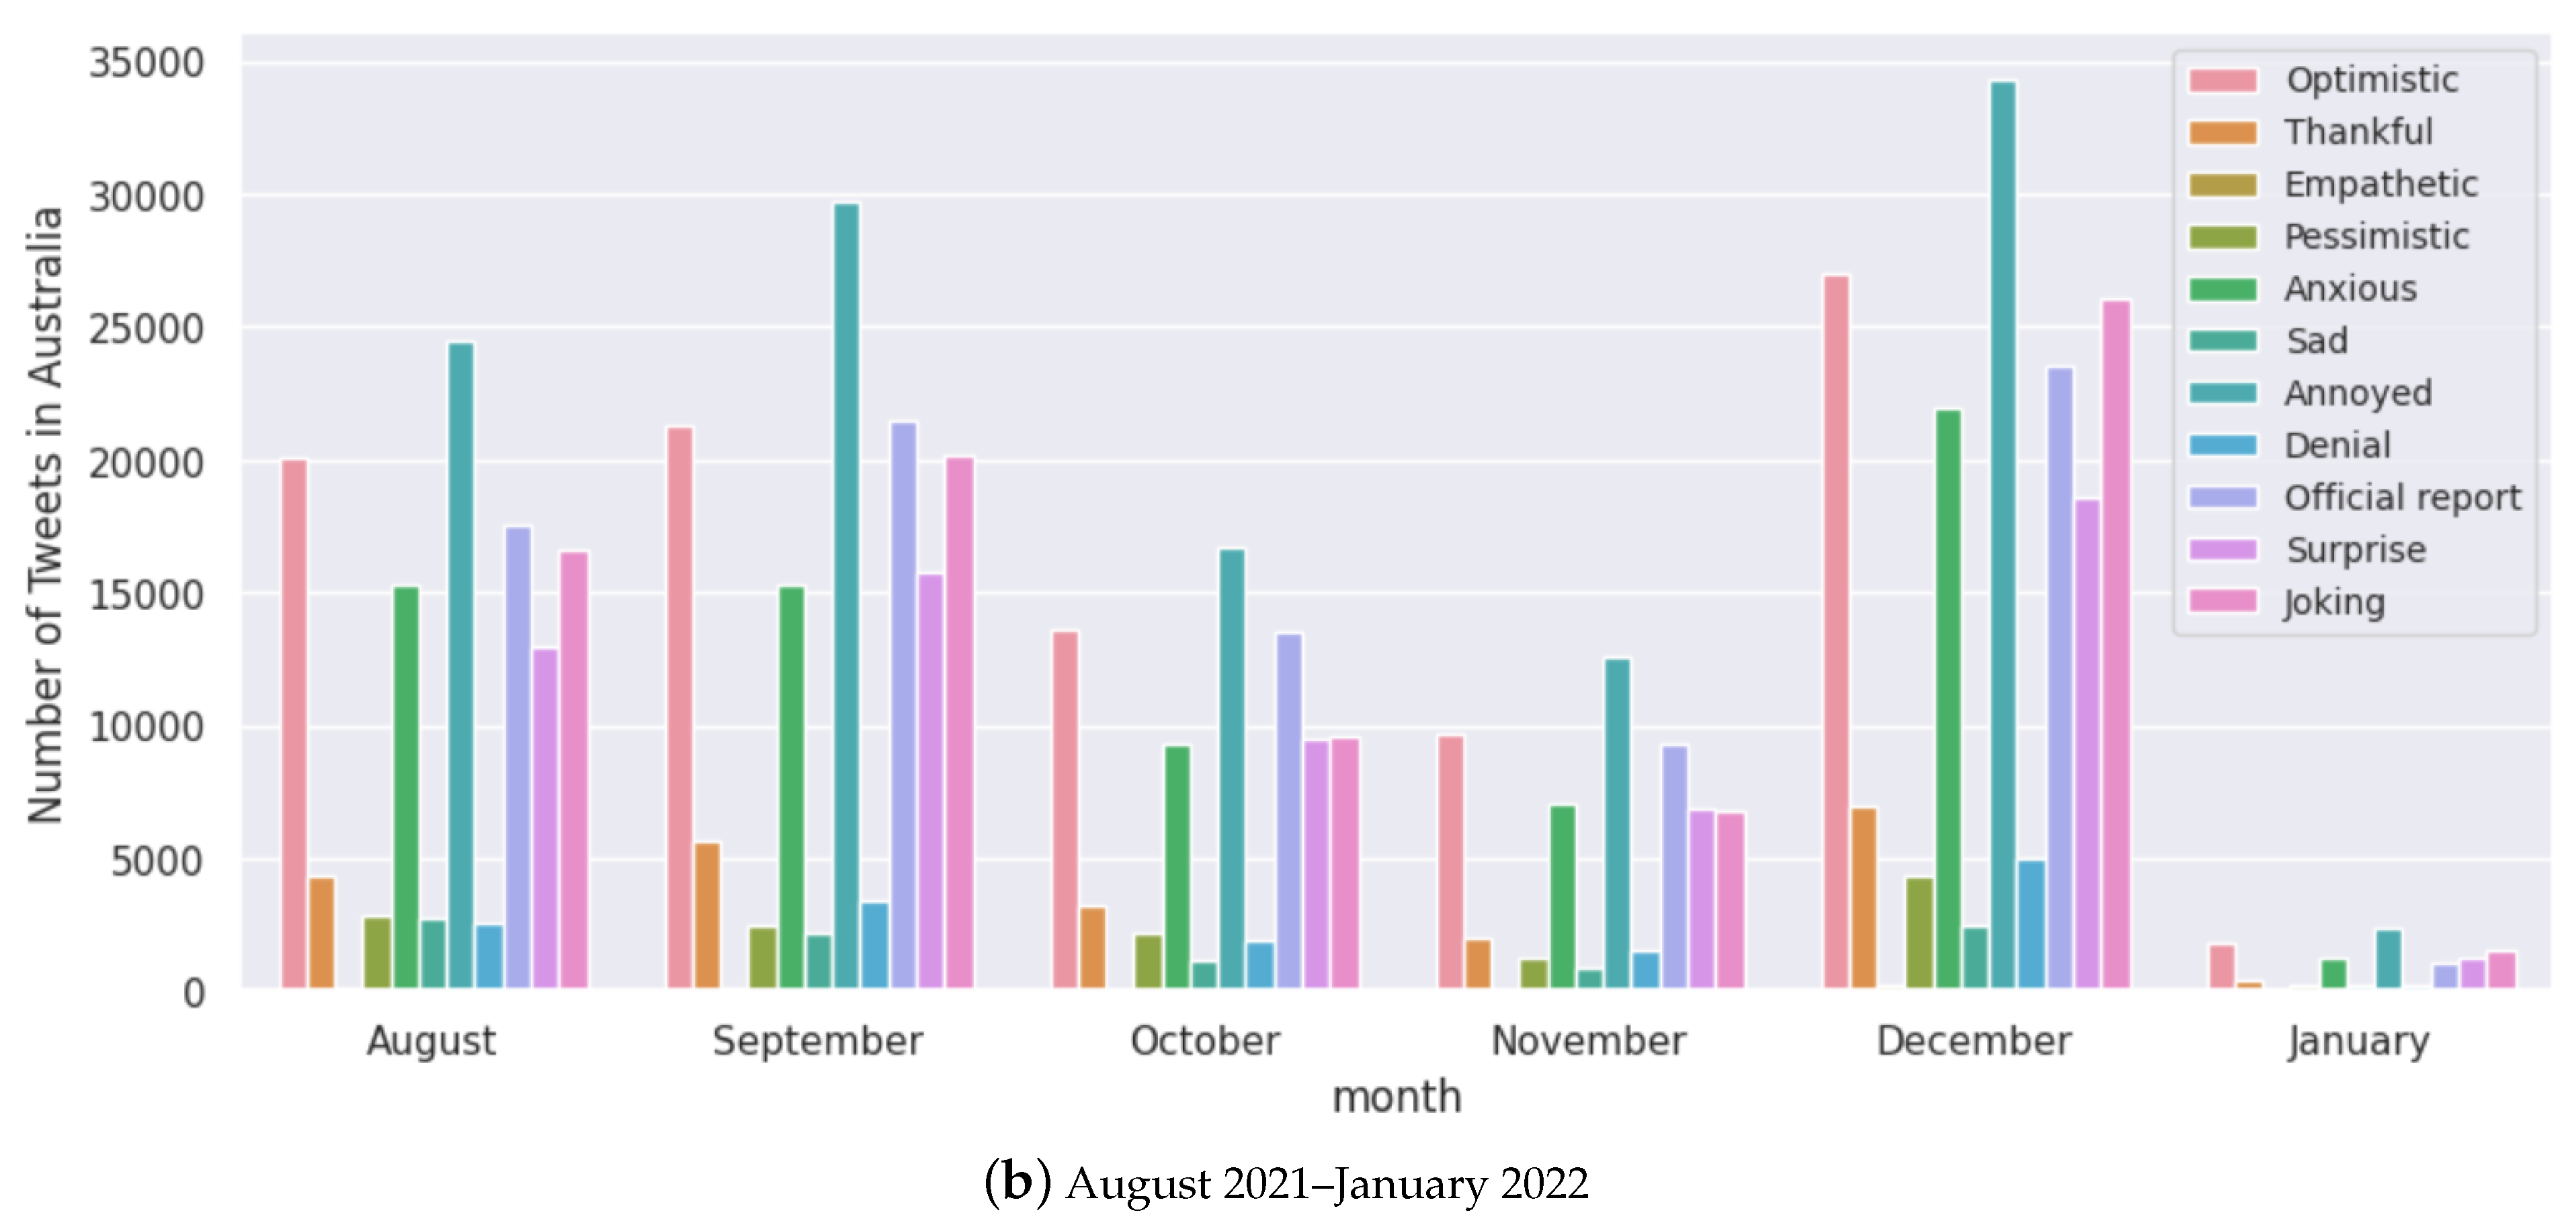
Figure 9.
Monthly polarity scores of selected countries obtained by TextBlob and our vaccine polarity score obtained from Figure 2. (a) Mean monthly polarity score obtained from our vaccine polarity score (Figure 2). (b) Mean monthly Textblob polarity score.
Figure 10.
Monthly analysis of the number of tweets related to vaccines for each country.
Figure 10.
Monthly analysis of the number of tweets related to vaccines for each country.
Figure 11.
Monthly analysis of the number of COVID-19 cases in each country. Note that 1e6 denotes 1 × 10⁶ in the y-axis.
Figure 11.
Monthly analysis of the number of COVID-19 cases in each country. Note that 1e6 denotes 1 × 10⁶ in the y-axis.
Figure 12.
Monthly analysis of tweets for each sentiment for Australia.
Figure 12.
Monthly analysis of tweets for each sentiment for Australia.
We notice that India has been one of the worst affected countries by the COVID-19 pandemic (Figure 11), with two major waves of infections hitting the country. Compared to the rest of the countries in this study, the population of India is much higher; hence, it is natural to have more cases during the peak. The second wave of COVID-19 in India was much more severe than the first wave in terms of the number of cases and deaths. We find that the rest of the countries had a much lower number of cases during their peaks. Looking at the number of tweets and polarity score, we note that we did not have complete data available for India, and hence the study is only until June 2021 (Figure 9 and Figure 10). Moreover, in the case of India, we notice that both the polarity scores from February 2021 to June 2021 (Figure 9) decreased drastically with increasing cases from February 2021 (Figure 11). During this timeline, the monthly tweets also increased drastically (Figure 10). These figures very well capture the situation during the second peak of COVID-19 cases in India, which has had a devastating effect in terms of deaths and hospitalisations and lack of resources. We also notice that the polarity score for Japan decreased drastically during the first few months of the pandemic, although there were not many cases. The rise of infections in other countries could have affected the social media activity in Japan. We also note that in the case of Australia, data were available from February 2021, and we find that the number of tweets drastically increased from July 2021 (Figure 10) which aligns well with an increase in the number of cases (Figure 11).
In the second half of 2021, most countries had already started their vaccination programmes, and some had even completed the vaccination of their most vulnerable populations. However, the pace of vaccination and the specific groups targeted for vaccination varied widely from country to country. So we can observe the effect of vaccination in the mean polarity of the majority of the selected countries (Figure 9), which after April 2021 moves towards the neutral state (mean polarity of 0). This is despite the rise in the number of monthly tweets and cases during this time frame, which demonstrates the effect of the vaccination drive.
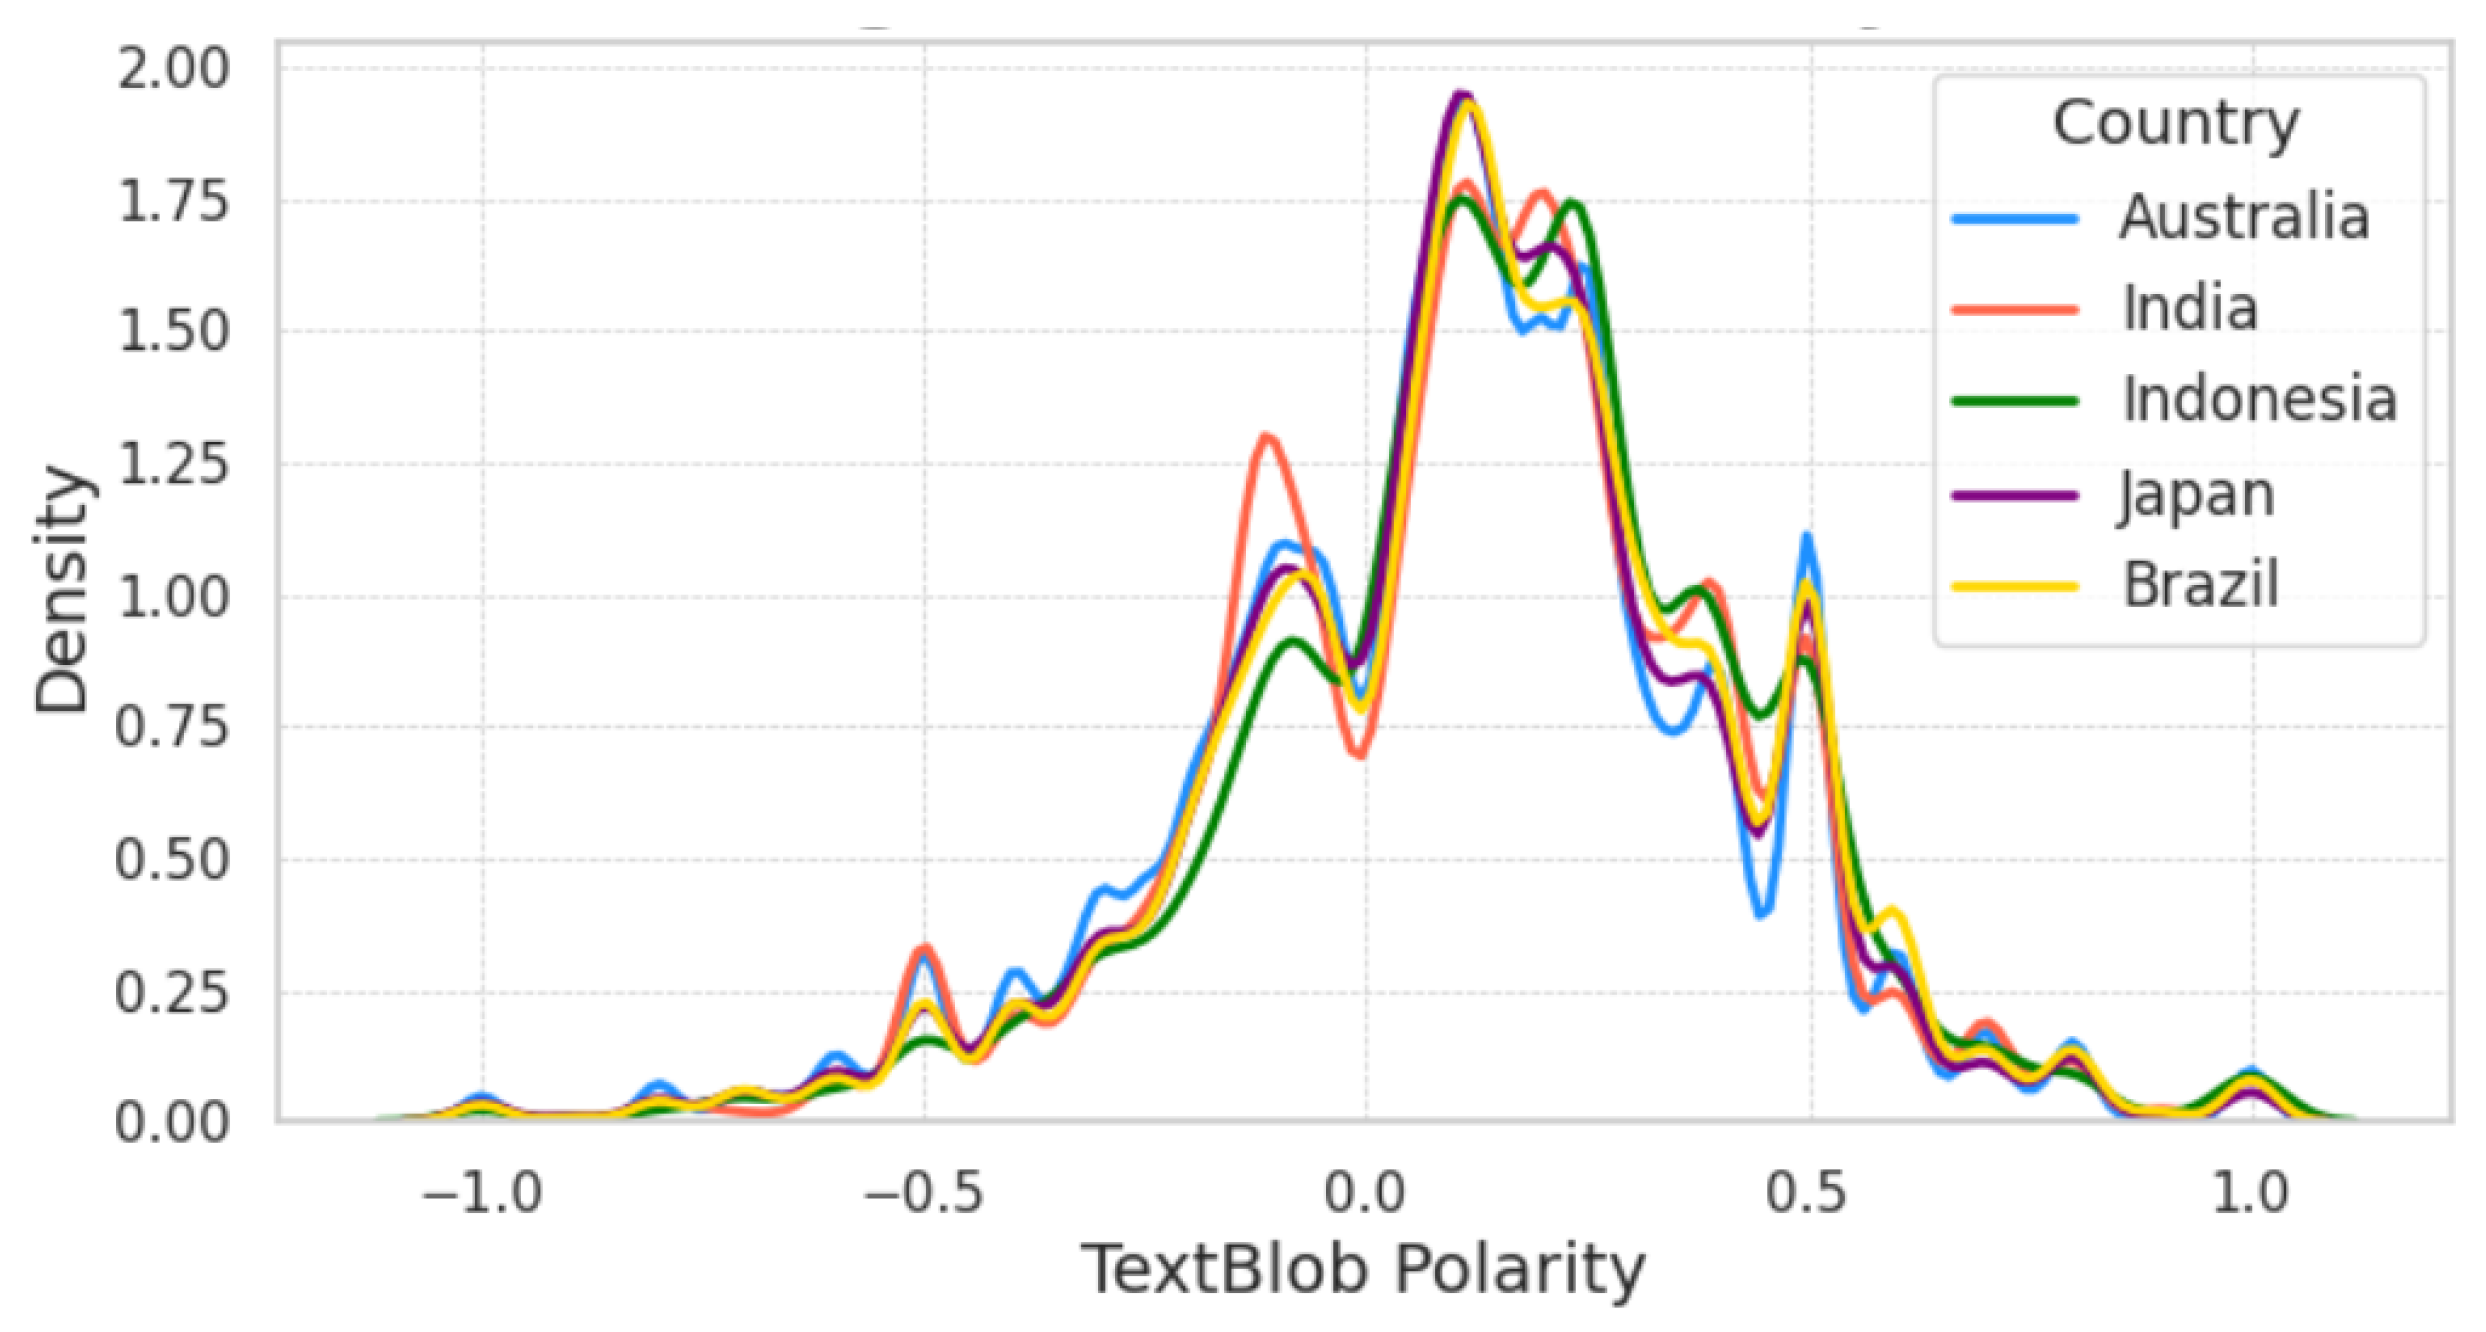
Figure 13 shows the Kernel Density Estimates (KDEs) [80] (distribution) of the TextBlob polarity score of different countries showing similar trends, with a noticeable difference for India in the polarity range between −0.2 and 0. Figure 6 presents the TextBlob polarity statistics, featuring mean and standard deviation (SD) over the entire span of the dataset (taken from Figure 9) including and excluding 0 polarity scores. We notice that the density plots show more positive than negative sentiment scores, and the variations across countries would be due to the changes in polarity across different periods as shown in Figure 9.

Figure 13.
KDE distribution of polarity scores (excluding 0 polarity) of each country obtained by TextBlob.
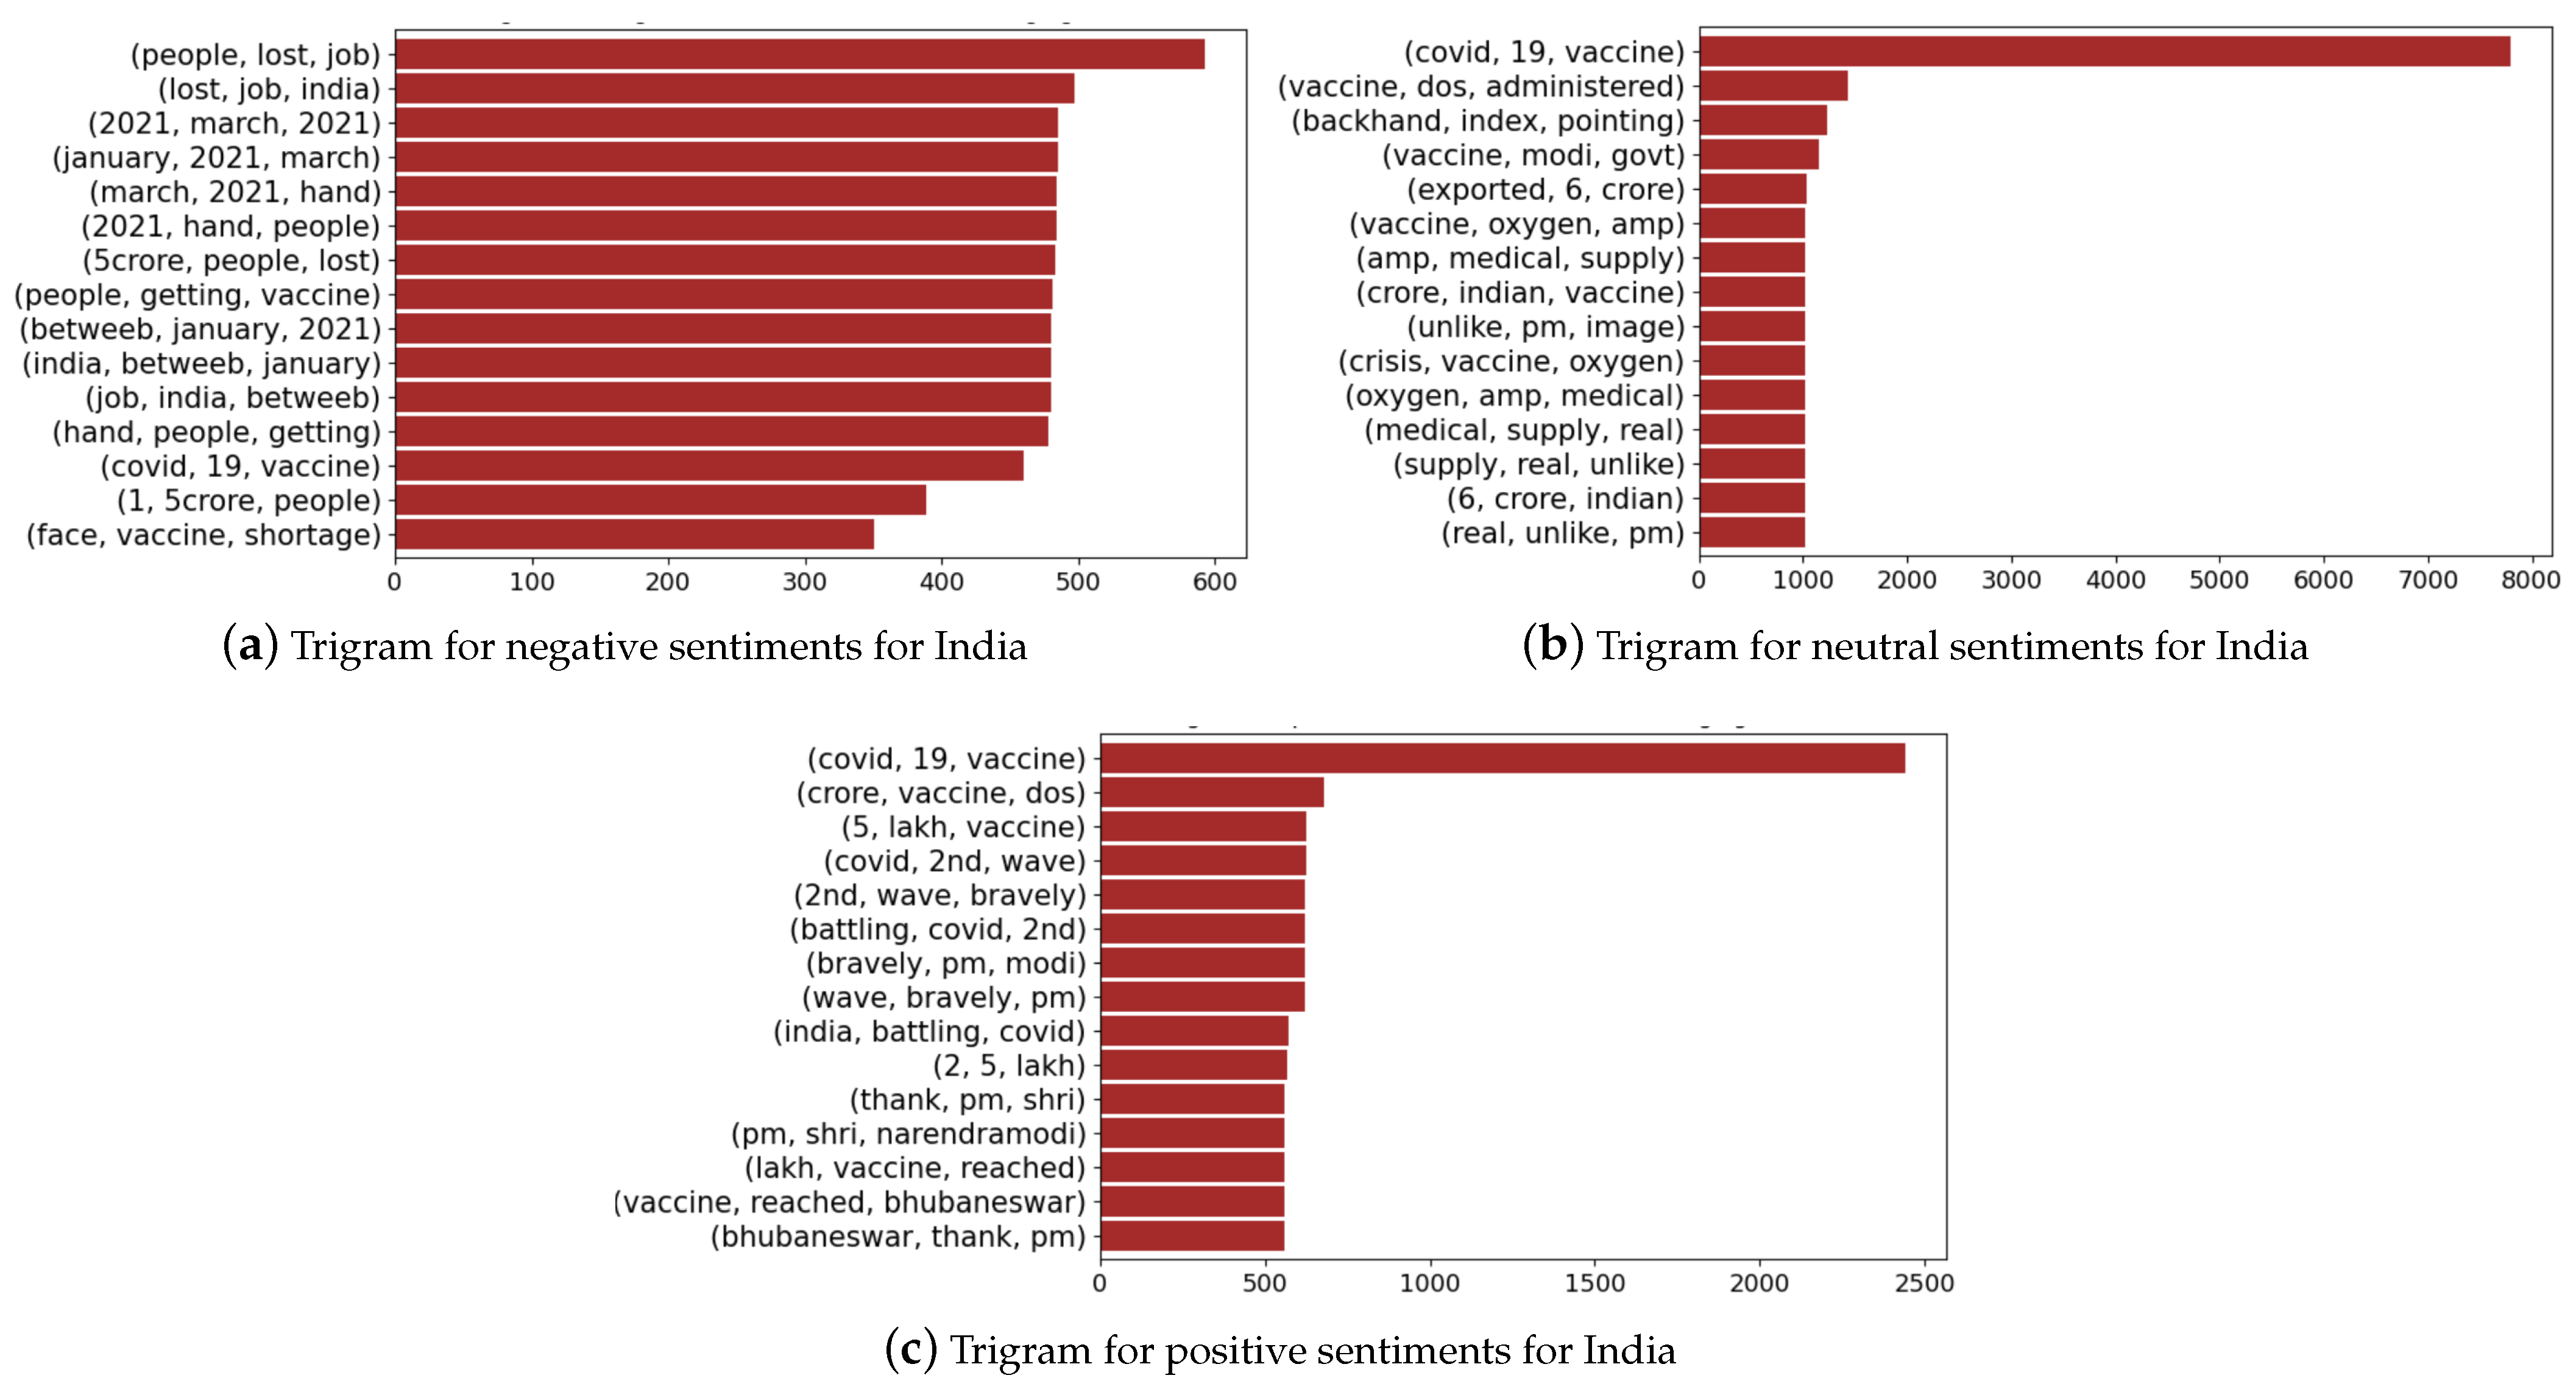
Next, we present the trigrams for sentiment polarity p based on TextBlob, where we group negative sentiments (), positive sentiments (), and neutral sentiments ( and ). Figure 14 and Figure 15 present the trigrams associated with the three groups of sentiments for the case of India and Australia, respectively. In the case of India (Figure 14), we find that negative sentiments are associated with “people, lost, job” and topics such as vaccine shortage, while the neural sentiments also relate to vaccines and other issues such as medical supply. The positive sentiments are associated with the COVID-19 vaccine, vaccine dosage, second wave, and Prime Minister Narendra Modi. There are certain topics (trigrams) that overlap negative and neutral sentiments and over the sentiments. The vaccine overlaps all three sentiment groups, which indicates that based on the context, groups of people expressed it as negative, positive and neutral. Table 4 presents the TextBlob polarity (mean and standard deviation) over the entire span of the dataset (taken from Figure 9) including and excluding 0 polarity scores. We note that 436,340 out of 1,187,390 tweets had 0 polarity for all five countries, which gives a high standard deviation and a skewed distribution.

Figure 14.
Trigrams associated with India for negative, positive and neutral sentiment scores.
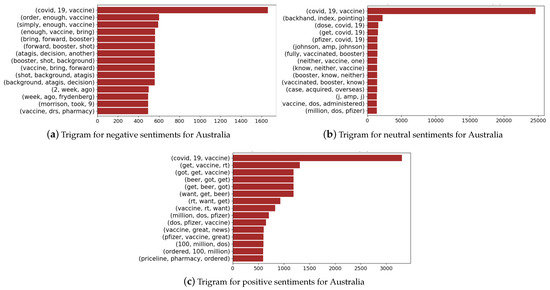
Figure 15.
Trigrams associated with Australia for negative, positive, and neutral sentiment scores.
Table 4.
TextBlob polarity statistics featuring mean and standard deviation (SD) over the entire span of the dataset (taken from Figure 9) including and excluding 0 polarity scores. Note that 436,340 out of 1,187,390 tweets had 0 polarity for all five countries.
Figure 15 presents the trigrams for the case of Australia, where we find the vaccine as the most expressed trigram across the three sentiment groups. This is similar to India, and we also find that Prime Minister Scott Morrison is amongst the trigrams of the negative sentiment group, indicating that most tweets expressed negative sentiments about how the government managed the pandemic. The names of vaccine manufacturers, such as Pfizer and Johnson and Johnson, are among the neutral sentiments. We find trigrams associated with vaccines and their manufacturers, order numbers, etc., in the group of positive trigrams.
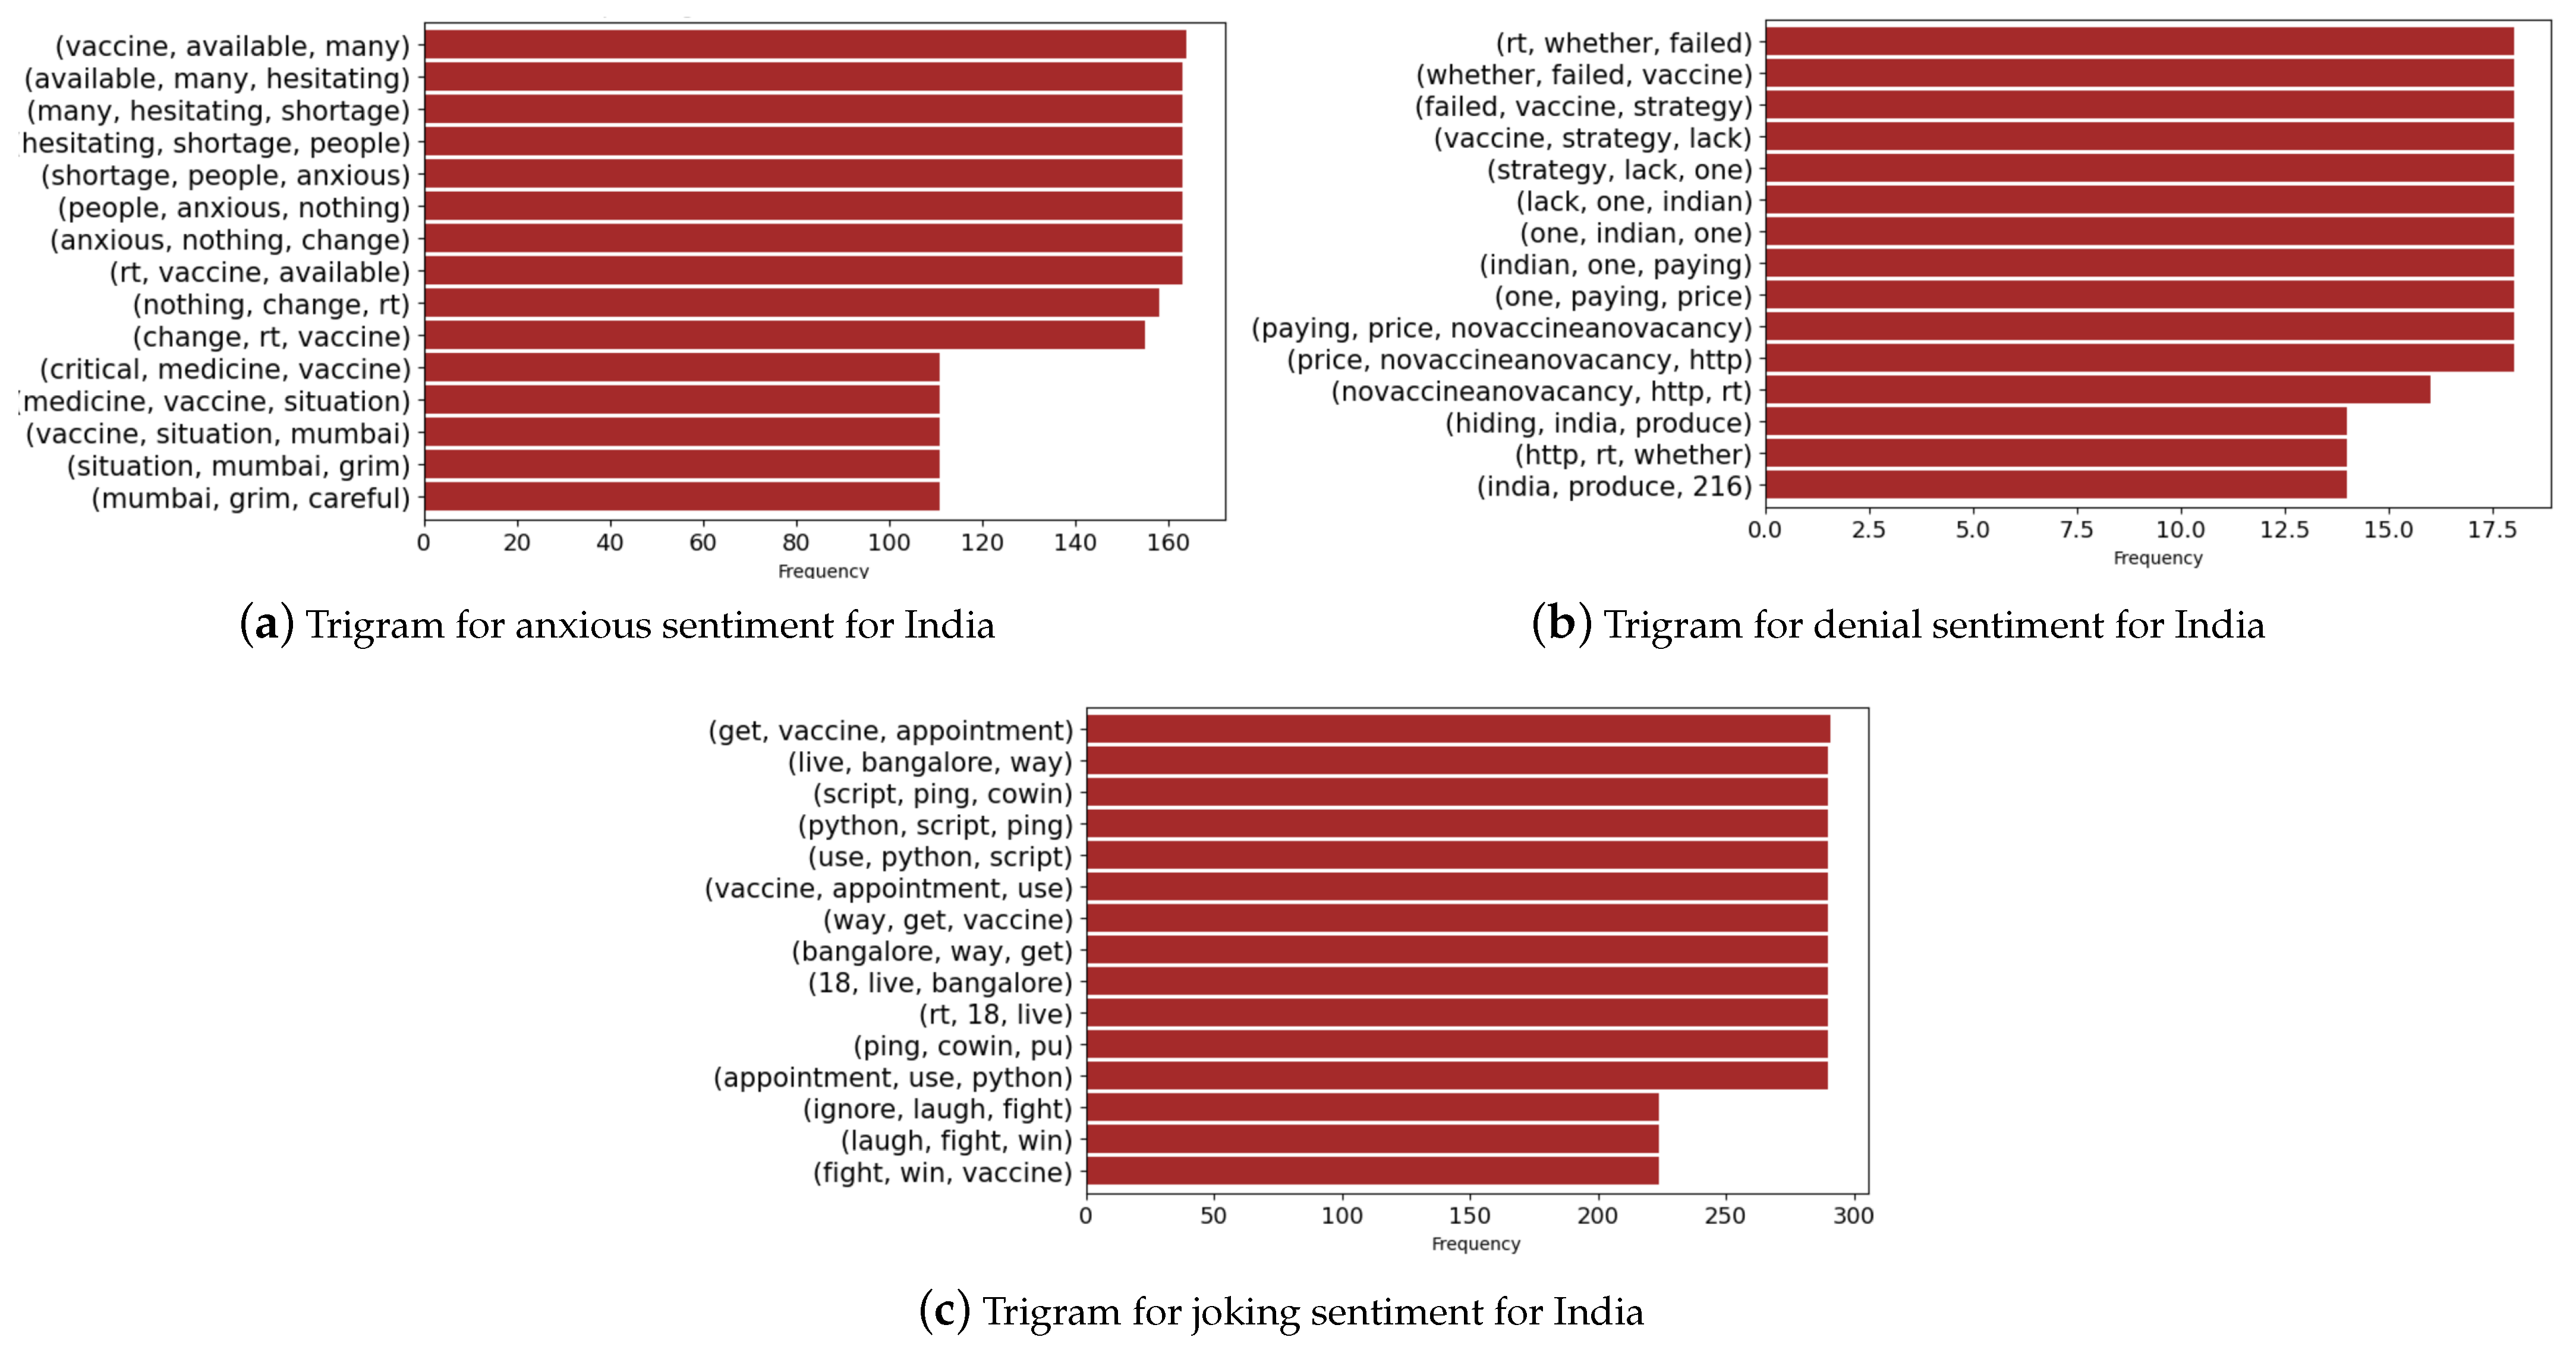
Finally, we present the trigrams for selected sentiments in the case of India and Australia in Figure 16 and Figure 17. We notice that the denial sentiments capture unique keywords that include “vaccines”, “security”, and “government” for the case of Australia. In the case of India, the keywords consist of “failed’, “strategy”, “price”, “whether”, and “produce”. These keywords capture the various topics in media during the vaccine rollout in both countries. In the anxious sentiment, we notice unique keywords that refer to “hepatitis”, “chickenpox”, “diphtheria”, “side effects”, and “vaccines” for Australia. In the case of India, we find unique keywords such as “shortage”, “anxious”, “medicine”, “grim”, and “vaccine” giving an overview of the discussion in media and events during the period.
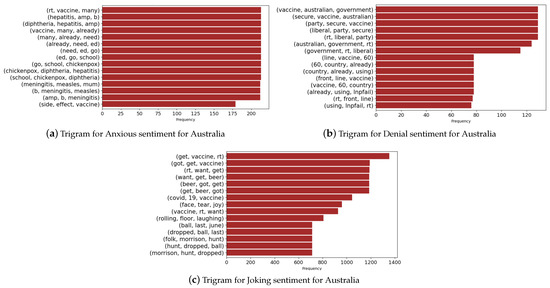
Figure 16.
Trigrams associated with Australia.

Figure 17.
Trigrams associated with India.
We select random samples of tweets with their sentiments and scores for Australia and India in Table 5 and Table 6, respectively. We note that even though certain sentiment labels such as “anxious”, “annoyed” and “pessimistic” are conventionally interpreted as negative emotions (which would imply anti-vaccine sentiments), we notice the problem with double negative statements that may convey the opposite meaning [81]. We present random samples for other selected countries in Table A1, Table A2 and Table A3 in the Appendix A. Figure 12 presents the sentiments expressed in Australia throughout the pandemic. We notice that “optimistic”, “joking”, “thankful”, and “anxious” are the major sentiments expressed with a change in volumes from May to July 2021, which was due to the rollout of vaccines and also a lower number of cases. We present this for the rest of the countries in Figure A2, Figure A3, Figure A4 and Figure A5 in the Appendix A.
Table 5.
Sentiment prediction outcomes for randomly selected tweet samples for Australia and their sentiment scores.
Table 6.
Sentiment prediction outcomes for randomly selected tweet samples for India and their sentiment scores.
4. Discussion
Our study about the COVID-19 vaccine sentiment analysis study has provided insights into the dynamic moment of sentiments towards vaccines during a global pandemic. Our results show that the volume and sentiment polarity of tweets is closely related to the phase of the pandemic, i.e., there, the selected countries experienced drastic changes in the polarity score at the beginning of the pandemic, which stabilised in the second half of the pandemic (Figure 9. Local and global peaks in COVID-19 vaccine-related tweets were identified from May to June 2020 and from March to May 2021, which correlates with the rollout of clinical trials [82] and major concerns for the safety and efficacy of the AstraZeneca vaccine [83]. There was massive fear in social media due to blood clots being developed by patients around the world from the AstraZeneca vaccine, which was then suspended by European countries [84].
Anti-vaccine sentiments have led to vaccine hesitancy, a major global public health threat, especially during COVID-19 [85,86]. We find more tweets being identified with negative polarity scores when vaccine development progress has been announced and when transmission has been reasonably contained in the case of Australia (Figure 12). Figure 8 shows that all the selected countries had “optimistic”, “joking”, annoyed”, “surprised” and “anxious” as the major sentiments expressed. This trend seems to be present throughout the pandemic, looking at the case of Australia (Figure 12).
Furthermore, in Figure 6, we notice that the majority of tweets were assigned with only one or two sentiment labels that are consistent with our prior studies about COVID-19 sentiment analysis for India [51]. Three or more sentiments are rarely expressed in everyday speech, and given that tweets have an upper limit in the number of words, the predictions by the model make sense. These tables provide useful insights for better understanding the vaccine sentiments and the driving forces behind those sentiments. Further work in psychology can be performed with a post-analysis of tweets and the sentiments expressed. Nevertheless, we note that Twitter (X)’s upper limit for a tweet length of fewer than 280 characters may hinder the ability of the model to discover complex interrelationships among multiple sentiment labels.
We revisit the sample tweets in Table 5 for Australia and draw attention to the second tweet entry “I think boosters at 3 months might be better for now with future testing to determine efficacy Much talk about the vaccines requiring a third shot to supply full immunity. This is not unusual amongst vaccines; however, it is being used by anti-vaxxers to undermine the vaccine rollout.” which was labelled as “annoyed” and “anxious” with a polarity score of −0.27. Double negative statements [81], irony, and sarcasm are examples of language constructs that pose challenges for NLP [87,88]. At times, it is difficult to understand the context of the actual tweet, and simply concluding from the sentiment labels and scores can result in misleading interpretations of anti-vaccine sentiments. In Table 6, “117 million+ Children risk missing out on measles vaccines, as COVID-19 surges: MeaslesRubella” is labelled as “official” and “anxious” with a negative polarity. The wording of official tweets needs to take the anti-vaccine viewpoints into account; during the pandemic, official statements were misinterpreted and twisted to suit anti-vaccine narratives. This sends out an important message to disease control bodies that they should increase transparency, exercise caution, and disseminate information promptly to minimise the spread of misinformation about vaccines. This needs to be performed to restore faith in scientific evidence and reduce ungrounded anti-vaccine sentiments on social media. The policy about masks and distancing [89] was also implemented in an ad hoc manner, which created further misinformation, along with the implementation of vaccination, risks, and efficacy [90].
There are certain limitations to our framework and study. Firstly, the BERT-based model was trained using the SenWave dataset, which contained 10,000 sentiment labels manually labelled by experts. This is perceived as a subjective activity due to individual differences in how each sentiment is perceived. Secondly, the current study is only concerned with user-generated data retrieved from one social media platform, Twitter (X), where the user demographic is significantly different from those on other social media platforms such as LinkedIn and Facebook [91]. The complexity and degree of formality of textual inputs can also vary significantly, and with COVID-19, Twitter (X) suspended many accounts along with Facebook to limit anti-vaccine activities [92].
Our study was designed to compare the trends of major countries in terms of population and access to Twitter (X). Therefore, countries such as China were naturally excluded since Twitter (X) is not accessible, and our focus was towards countries in the Asia-Pacific region. Although tweet geolocation has limitations [93], several user-defined studies exist that used this strategy to identify Twitter (X) users from different countries, such as [53,75]. We hope that more can be done so that Twitter (X) users have the option to share their data for research purposes.
Furthermore, we excluded retweets, which could have also shed further light on the analysis. Retweets are a significant part of how information spreads on social media, and their exclusion creates a gap in the analysis which can be considered in extension of this study in future work. Our multi-label classification model for the sentiments detects one or two sentiments at most, but it does not provide information about the influence of each sentiment in the case of two sentiments. For example, negative sentiments, such as sadness and anger, may diffuse and influence differently. Moreover, the expression of anger and sadness in online news can have varying effects on the believability and credibility of the news source and its content. These issues can be investigated only after creating a better manually annotated sentiment analysis dataset that provides the sentiment and information on how much they overlap and influence each other. This would need expert analysis and labelling, which could be performed in future work.
The period of the dataset can be seen as a limitation, as it only covers the pandemic up to January 2021 and much has changed about the pandemic (which became an endemic afterwards). However, this period covers the major vaccine-related phases that include the planning, development, and deployment of vaccines. Moreover, this period is also of interest to our study since there were major lockdowns and restrictions around the world which eased afterwards. Although it is perceived that one of the strengths of using Twitter (X) as a data source is the ability to collect data in real-time, downloading data from Twitter (X) requires a lot of resources since data for a specific month or year cannot be downloaded all at once. There is a Twitter (X) app known as the Hydrator that assists in downloading data; however, one needs to restart the app every day, as there are daily limits on how much data can be downloaded. It took our group about six months to obtain the data used in this study, and the data have also been published and publicly available [62]. In future work, our open-source code framework from this study can be extended, given the rapidly evolving nature of public sentiments around COVID-19 and vaccines. A major limitation is the qualitative evaluation of the predictions, which would be time-consuming, similar to creating the sentiment labels in the SenWave dataset. Qualitative evaluation poses a major limitation for language model applications.
Public discourse analysis such as our study can be reviewed from the perspective of communication theory [94], psychology theory [95,96], and public health theory [96]. These could help extend our study beyond a purely data-driven strategy, which can be performed in future work. For example, the tweet analysis can be further extended from the perspective of psychology theory including behavioural, cognitive, humanistic, psychodynamic, and biological theories. These can be performed by extending this study with topic modelling and sentiment analysis, and different countries can be compared.
We note that Twitter (X) was formally renamed as X, and certain policy changes were made to facilitate freedom of expression, which was one of the key reasons behind the procurement by Elon Musk. Vidra and Kantorowicz [97] reviewed Twitter (X) policies before and during the COVID-19 crisis and provided topic modelling for a limited period. Kruspe et al. [93] revised the Twitter (X) policy changes with geolocation that affects the research in the domain. We note that the Hydrator application software: https://github.com/DocNow/hydrator (last accessed 8 December 2024) has not been changed with the change in the name of the platform, and hence the dataset used in this study can be expanded further. We note that Twitter (X) has a significant number of bot-generated tweets [98], and there has been some attempt by Twitter (X) to remove them. There are also machine learning methods [99] to detect bot-generated tweets, which can be performed to extend this study further in future work. We did not implement this, as it is also important to provide an analysis of bot-generated tweets to see anti-vaccine sentiments, but it would be useful to distinguish them from human tweets. Furthermore, our dataset does not feature retweets, and our analysis was performed on original tweets.
5. Conclusions and Future Work
In this paper, we used novel language models for vaccine-related sentiment analysis during the COVID-19 pandemic. We covered major phases of the pandemic in our longitudinal analysis with and without vaccination and different levels of lockdowns and economic activity that shifted the topics of discussions on social media. Our analysis reported that there is a link between the number of tweets, the number of cases, and the change in sentiment polarity scores during major waves of COVID-19 cases, especially in the case of India and Australia. We also found that the first half of the pandemic (March 2020–June 2021) had drastic changes in the sentiment polarity scores, which later stabilised, although the number of cases and tweets was high afterwards. This implies that the vaccine rollout had an impact on the nature of discussions on social media—with a more positive outlook toward the pandemic.
Further work can be carried out to implement sentiment analysis for vaccinations, taking into account cultural and religious beliefs, and political, and economic landscapes. Furthermore, we can extend this framework and include topic modelling to have a better understanding of the range of topics that emerged with anti-vaccine and prop-vaccine tweets. Future work can also integrate the exploratory data-driven approach in this study to test specific hypotheses and integrate health theories or public health frameworks that could contextualise findings within the broader literature. This would motivate actionable public health strategies with links from our study.
6. Code and Data
We shared open-source Python code using the GitHub repository for this project: https://github.com/sydney-machine-learning/COVID19-antivaccine-sentimentanalysis (accessed on 26 September 2024).
Author Contributions
Conceptualization, R.C.; methodology, R.C. and J.S.; software, R.C., J.S. and J.L.; validation, R.C., J.S. and J.L.; investigation, R.C.; resources, R.C.; data curation, R.C., J.S. and J.L.; writing—original draft preparation, R.C., J.S. and J.L.; writing—review and editing, R.C.; visualization, J.S.; supervision, R.C.; project administration, R.C. All authors have read and agreed to the published version of the manuscript.
Funding
This research received no external funding.
Data Availability Statement
Code and data access has been shared via GitHub repository.
Conflicts of Interest
The authors declare no conflicts of interest.
Appendix A
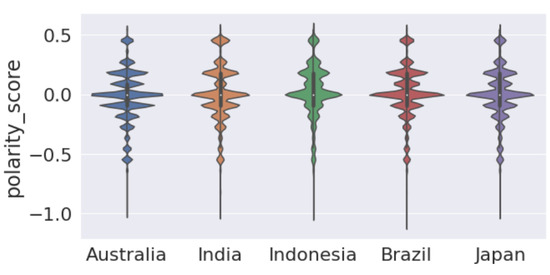
Figure A1.
Violin plot of vaccine polarity score for different countries.
Figure A1.
Violin plot of vaccine polarity score for different countries.
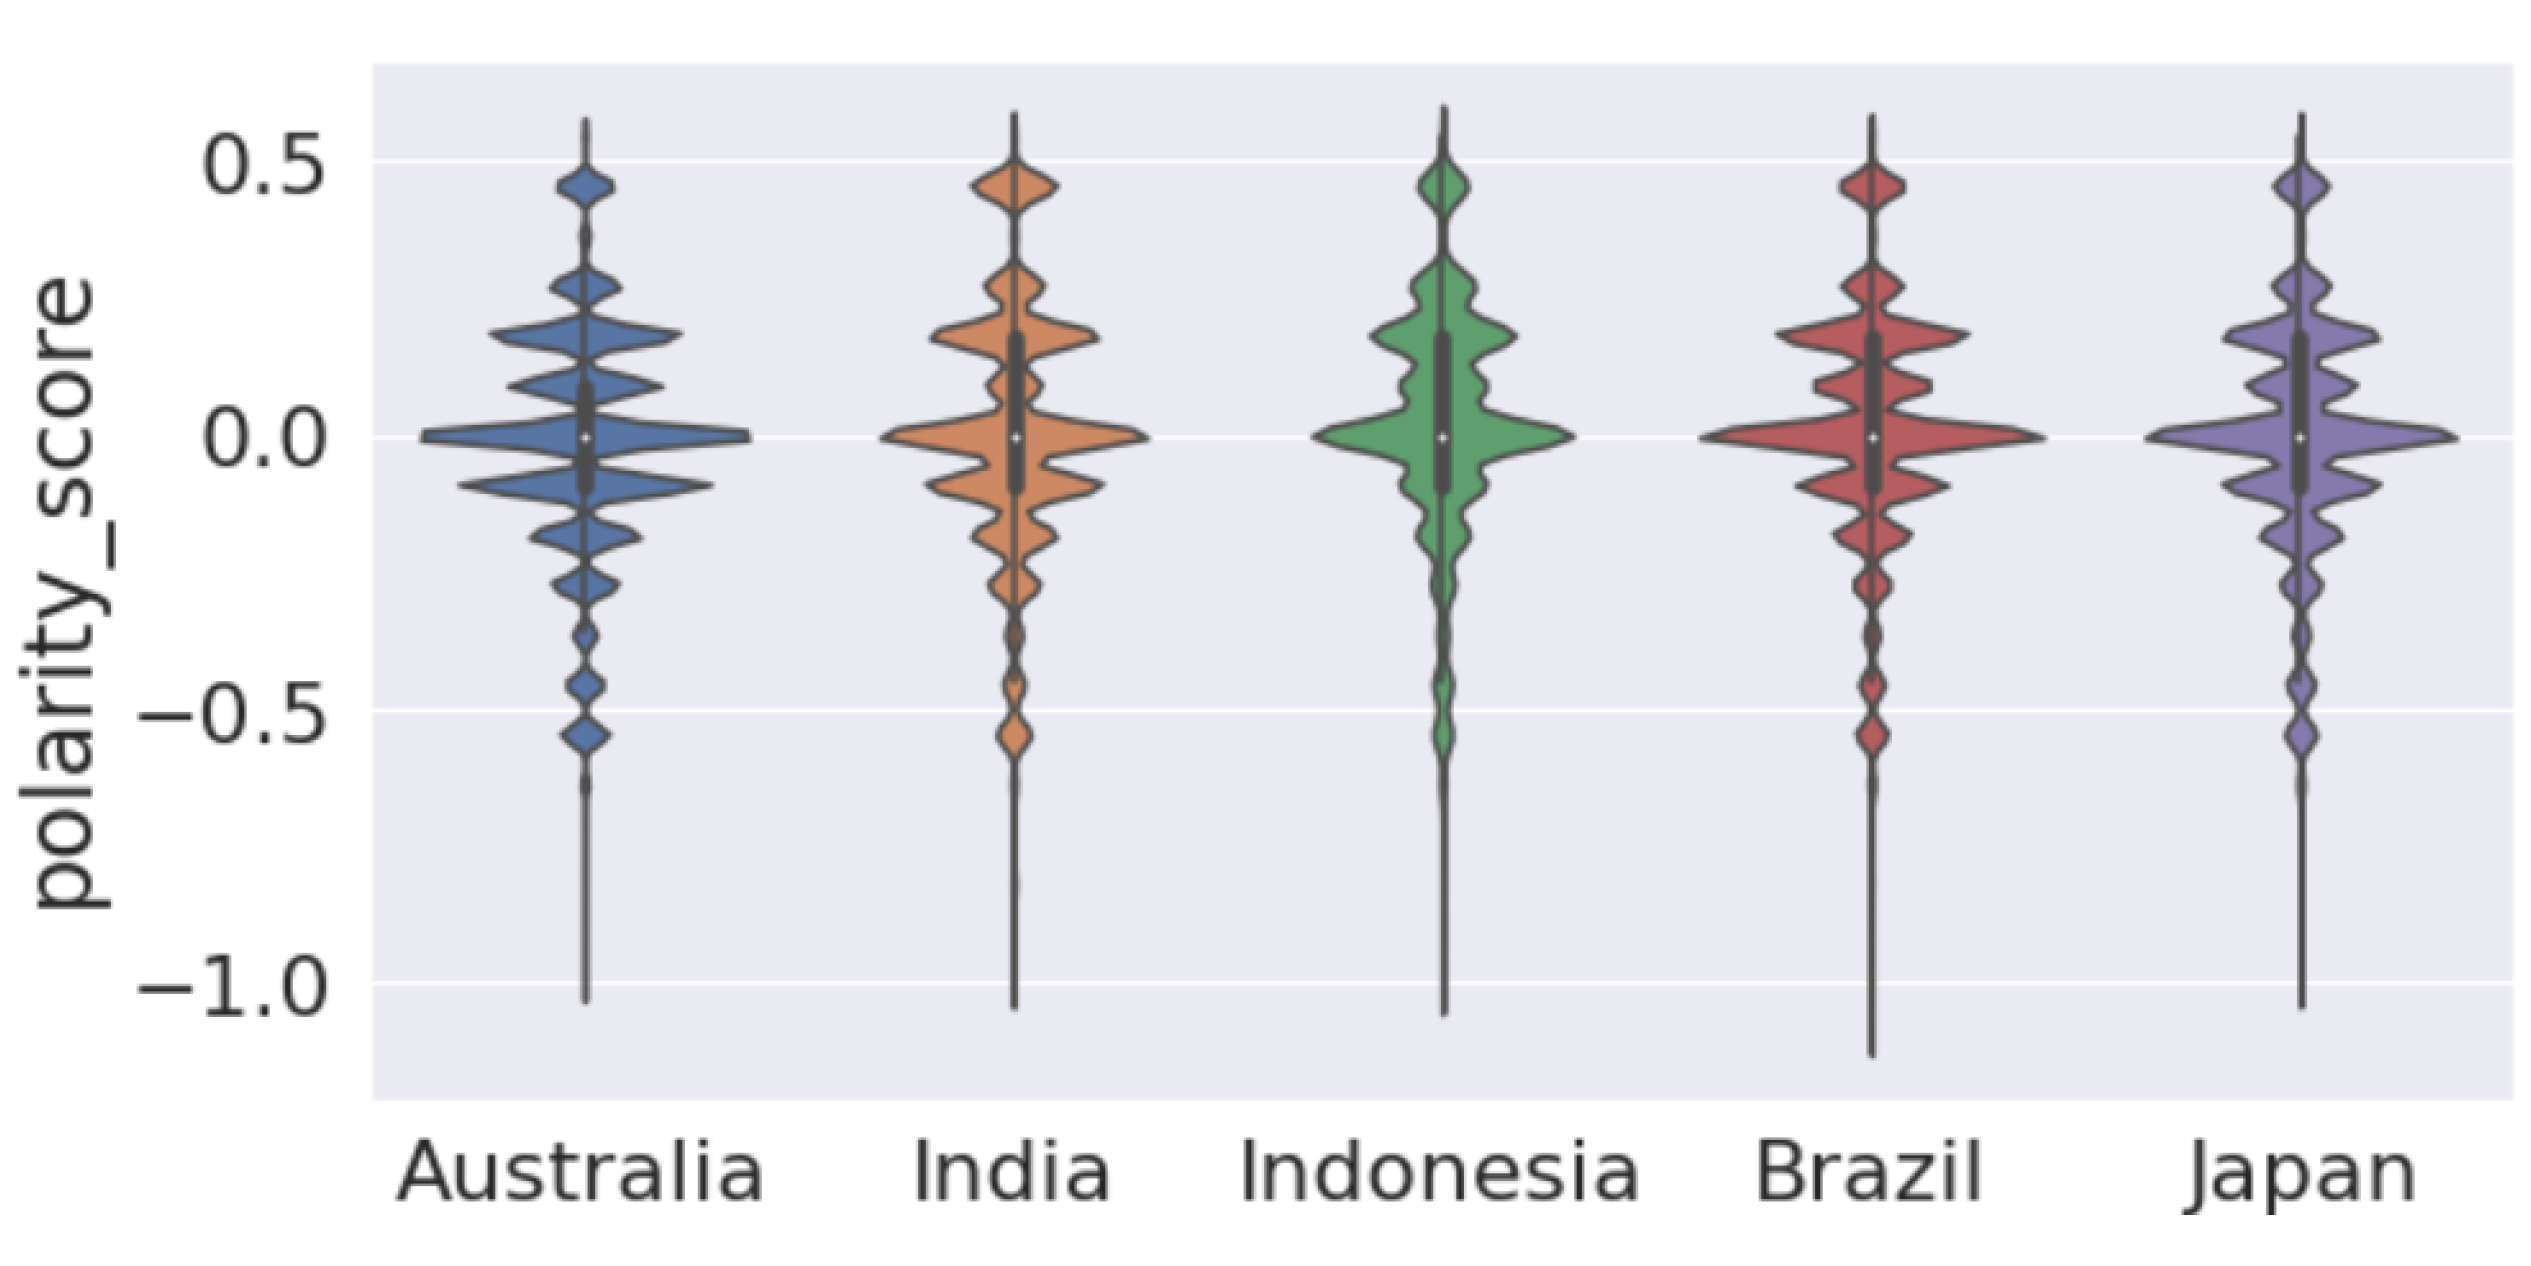
Table A1.
Sentiment prediction outcomes for randomly selected tweet samples for Japan and their sentiment scores.
Table A1.
Sentiment prediction outcomes for randomly selected tweet samples for Japan and their sentiment scores.
| Sentiments | Sample Tweet | Country | Score |
|---|---|---|---|
| Optimistic | "RT Thankfully, despite the antivaxxers, Reefton is at 85.5 percent first dose, with needing only 40 more people vaccinated to get…" | Japan | 0.18 |
| Joking | “RT wagatwe: Imagine letting your kids die to stay married to an antivaxxer” | Japan | 0.09 |
| Annoyed, Official | “ UPDATE: William Hartmann, the infamous Wayne Co. canvasser who caused a stir in Michigan by flip flopping on his vote…” | Japan | −0.09 |
| Joking, Sad | “So excited for you!!!! Sadly the combo of Omicron + bad news about the lt 5s pfizer vaccine today is for parents of babies who can’t yet wear masks or get jabbed” | Japan | −0.18 |
| Pessimistic, Surprise | “ The next 5-10 years online are going to be a period in which the surviving children of covid-antivaxxers get accounts for t…” | Japan | −0.36 |
Table A2.
Sentiment prediction outcomes for randomly selected tweet samples for Brazil and their sentiment scores.
Table A2.
Sentiment prediction outcomes for randomly selected tweet samples for Brazil and their sentiment scores.
| Sentiments | Sample Tweet | Country | Score |
|---|---|---|---|
| Optimistic, Thankful | “ Shout out amp; respect to all hospital amp; health workers who must treat every incoming sick antivaxxer with civility. You’re su…” | Brazil | 0.45 |
| Joking, Pessimistic, Anxious | “Everyone is talking about covid, but I’m honestly terrified that antivaxxers might move on from just covid scepticism and graduate to full vaccine antivaxxers. Measles and polio will return because of the incredible stupidity of the human race.” | Brazil | −0.45 |
| Surprise, Official | “UKHSA update ”Myocarditis and pericarditis after COVID-19 vaccination“ Original”myocarditis… has been described in a high percentage of children admitted to hospital”Is the update clearer? Will antivaxxers understand it.” | Brazil | 0.00 |
| Denial, Anxious | “I wonder if this man really died from ccp 19 even after taken his astrazeneca vaccine or maybe he was killed to keep the cover over that deadly vaccine and how unsafe it can be for people?” | Brazil | −0.63 |
| Official, Sad | “ UPDATE: Doug Ericksen has been found. He died from COVID.” | Brazil | −0.27 |
Table A3.
Sentiment prediction outcomes for randomly selected tweet samples for Indonesia and their sentiment scores.
Table A3.
Sentiment prediction outcomes for randomly selected tweet samples for Indonesia and their sentiment scores.
| Sentiments | Sample Tweet | Country | Score |
|---|---|---|---|
| Optimistic, Thankful | “ I don’t get tankie-type lefties who defend anti-vaxxers and bemoan vaccine mandates - the dramatic success of the early ” | Indonesia | 0.45 |
| Joking, Sad, Annoyed | “ Heartbreaking last text that anti-vaxxer bodybuilder sent before Covid killed him” | Indonesia | −0.27 |
| Surprise, Joking | “ Been chatting to country people who have not had vaccine jab. They are not antivaxxers. As they have had no Covid in…” | Indonesia | 0.09 |
| Empathetic, Optimistic | “RT its me your mom: antivaxxer: God, why won’t you heal me of Covid god: I gave you like 4 vaccines to choose from” | Indonesia | 0.18 |
| Official, Sad | “ Antivaxxer kickboxing champion Frederic Sinistra, known as ”The Undertaker,” died in his home in Ciney, Belgium, from…” | Indonesia | −0.27 |
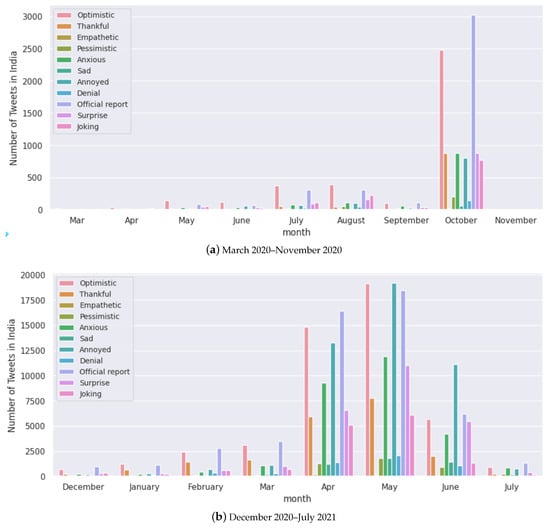
Figure A2.
Monthly analysis of the number of tweets for each sentiment for India.
Figure A2.
Monthly analysis of the number of tweets for each sentiment for India.
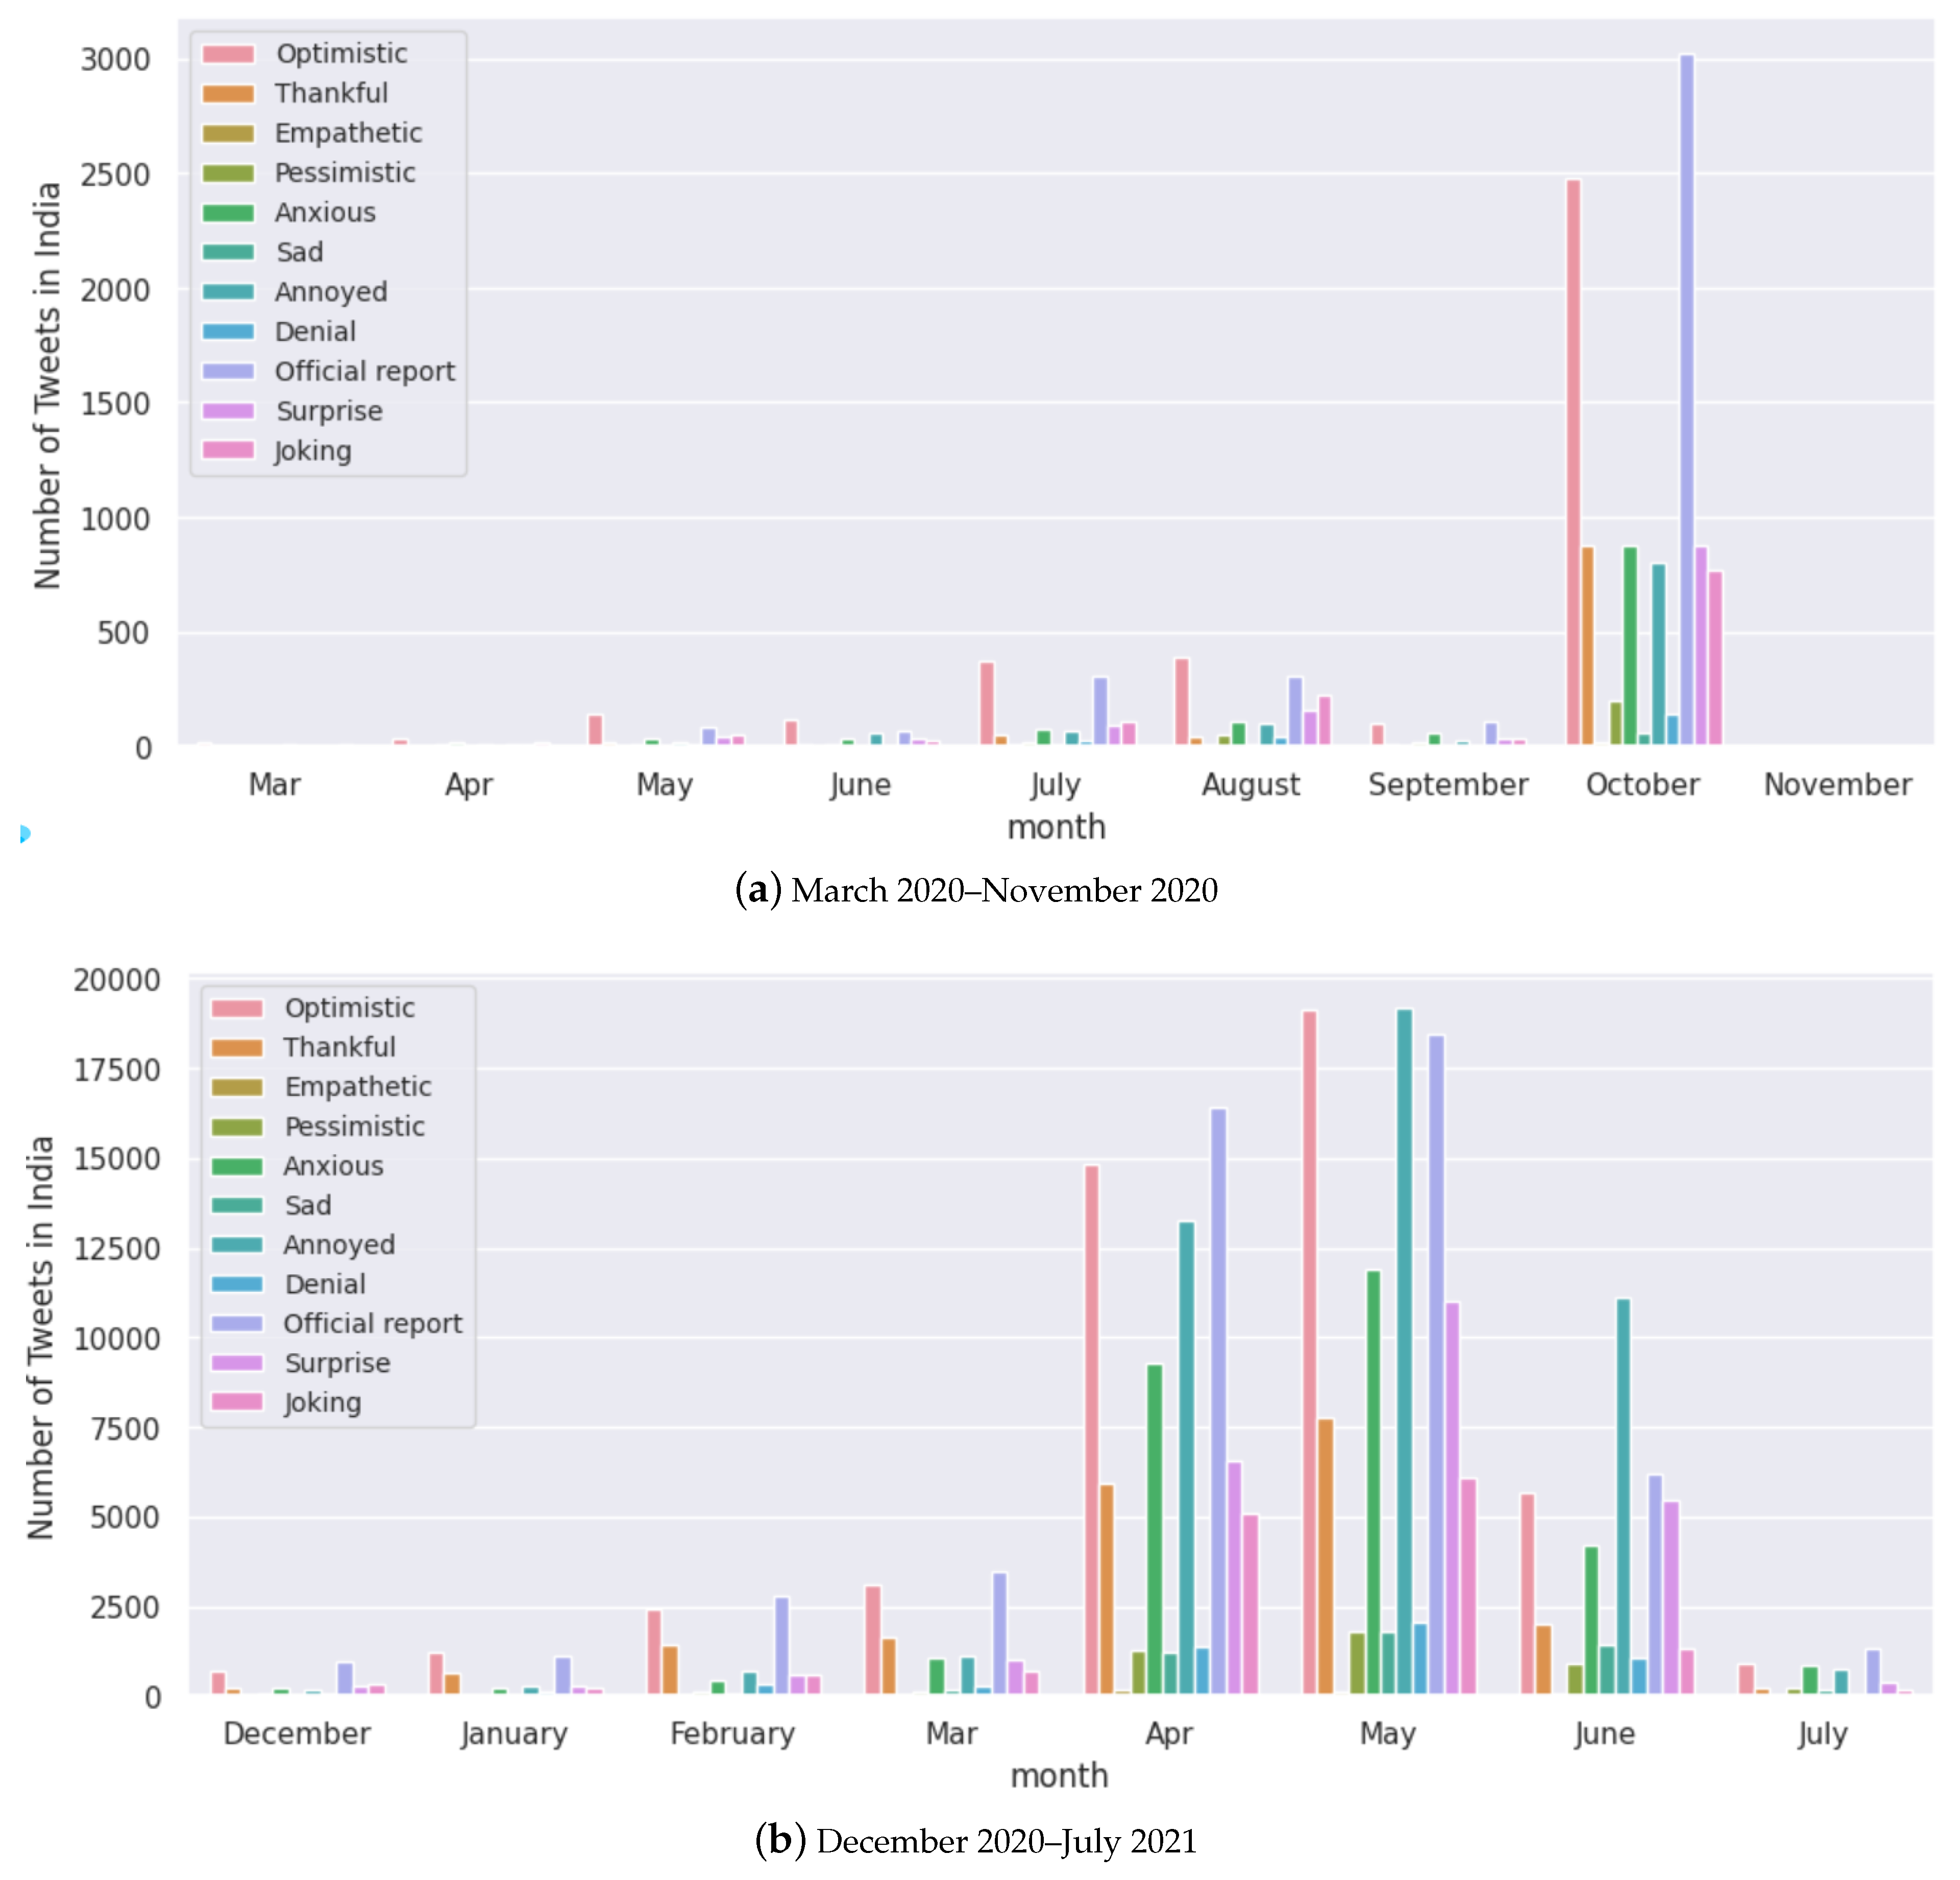
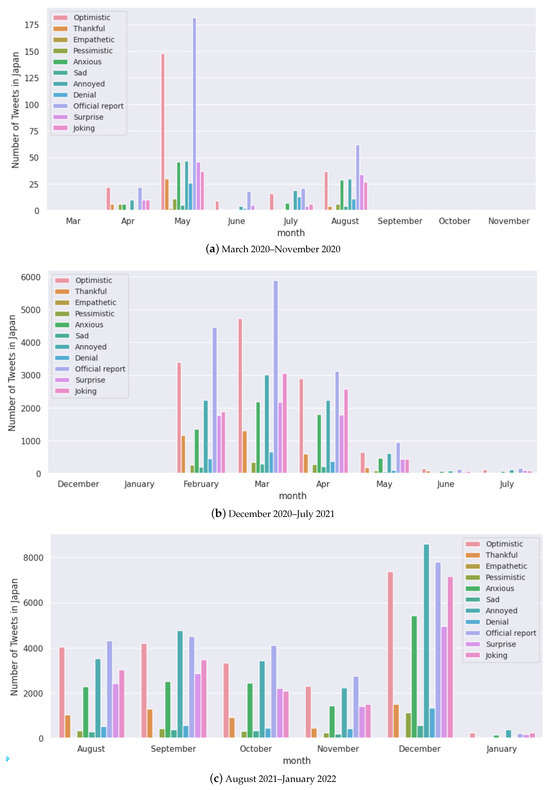
Figure A3.
Monthly analysis of the number of tweets for each sentiment for Japan.
Figure A3.
Monthly analysis of the number of tweets for each sentiment for Japan.
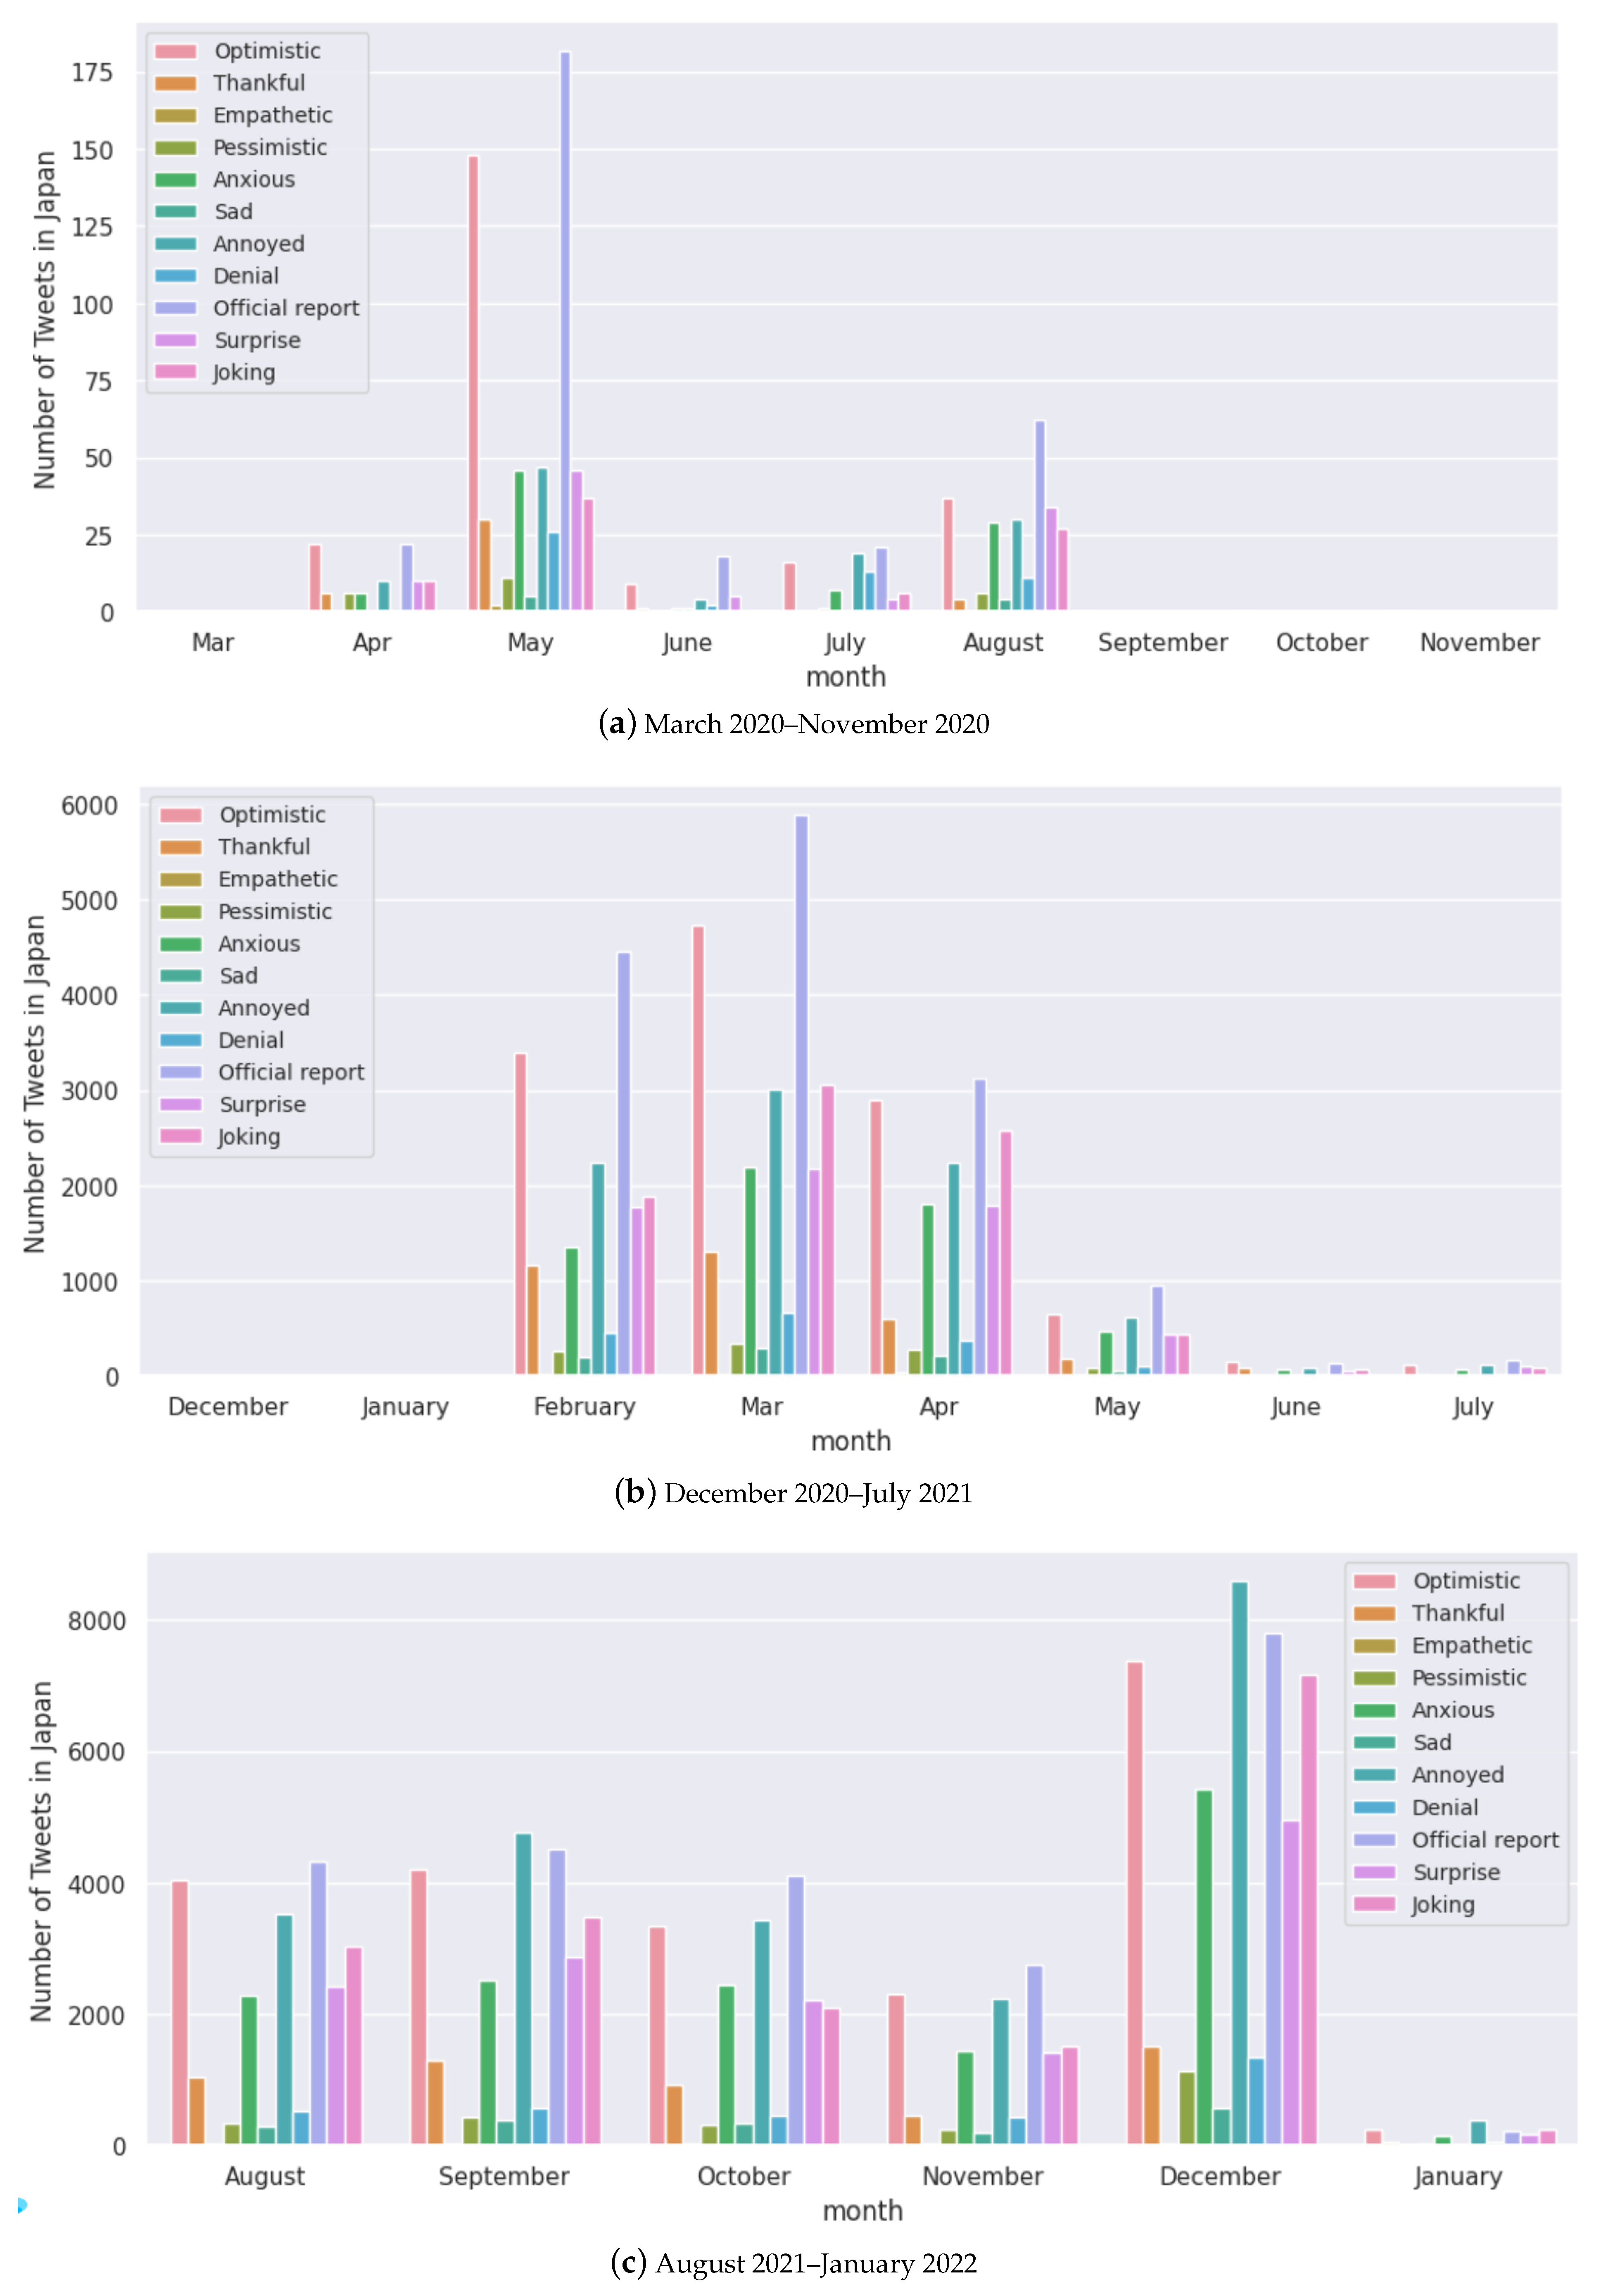
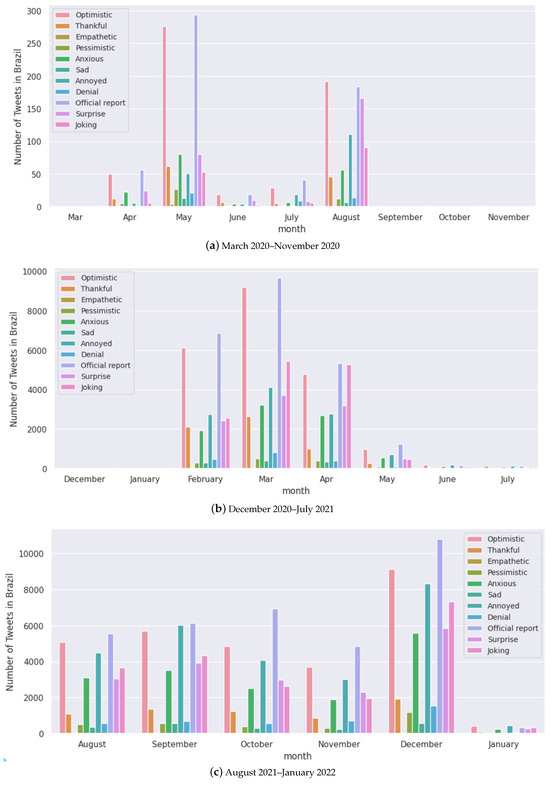
Figure A4.
Monthly analysis of the number of tweets for each sentiment for Brazil.
Figure A4.
Monthly analysis of the number of tweets for each sentiment for Brazil.
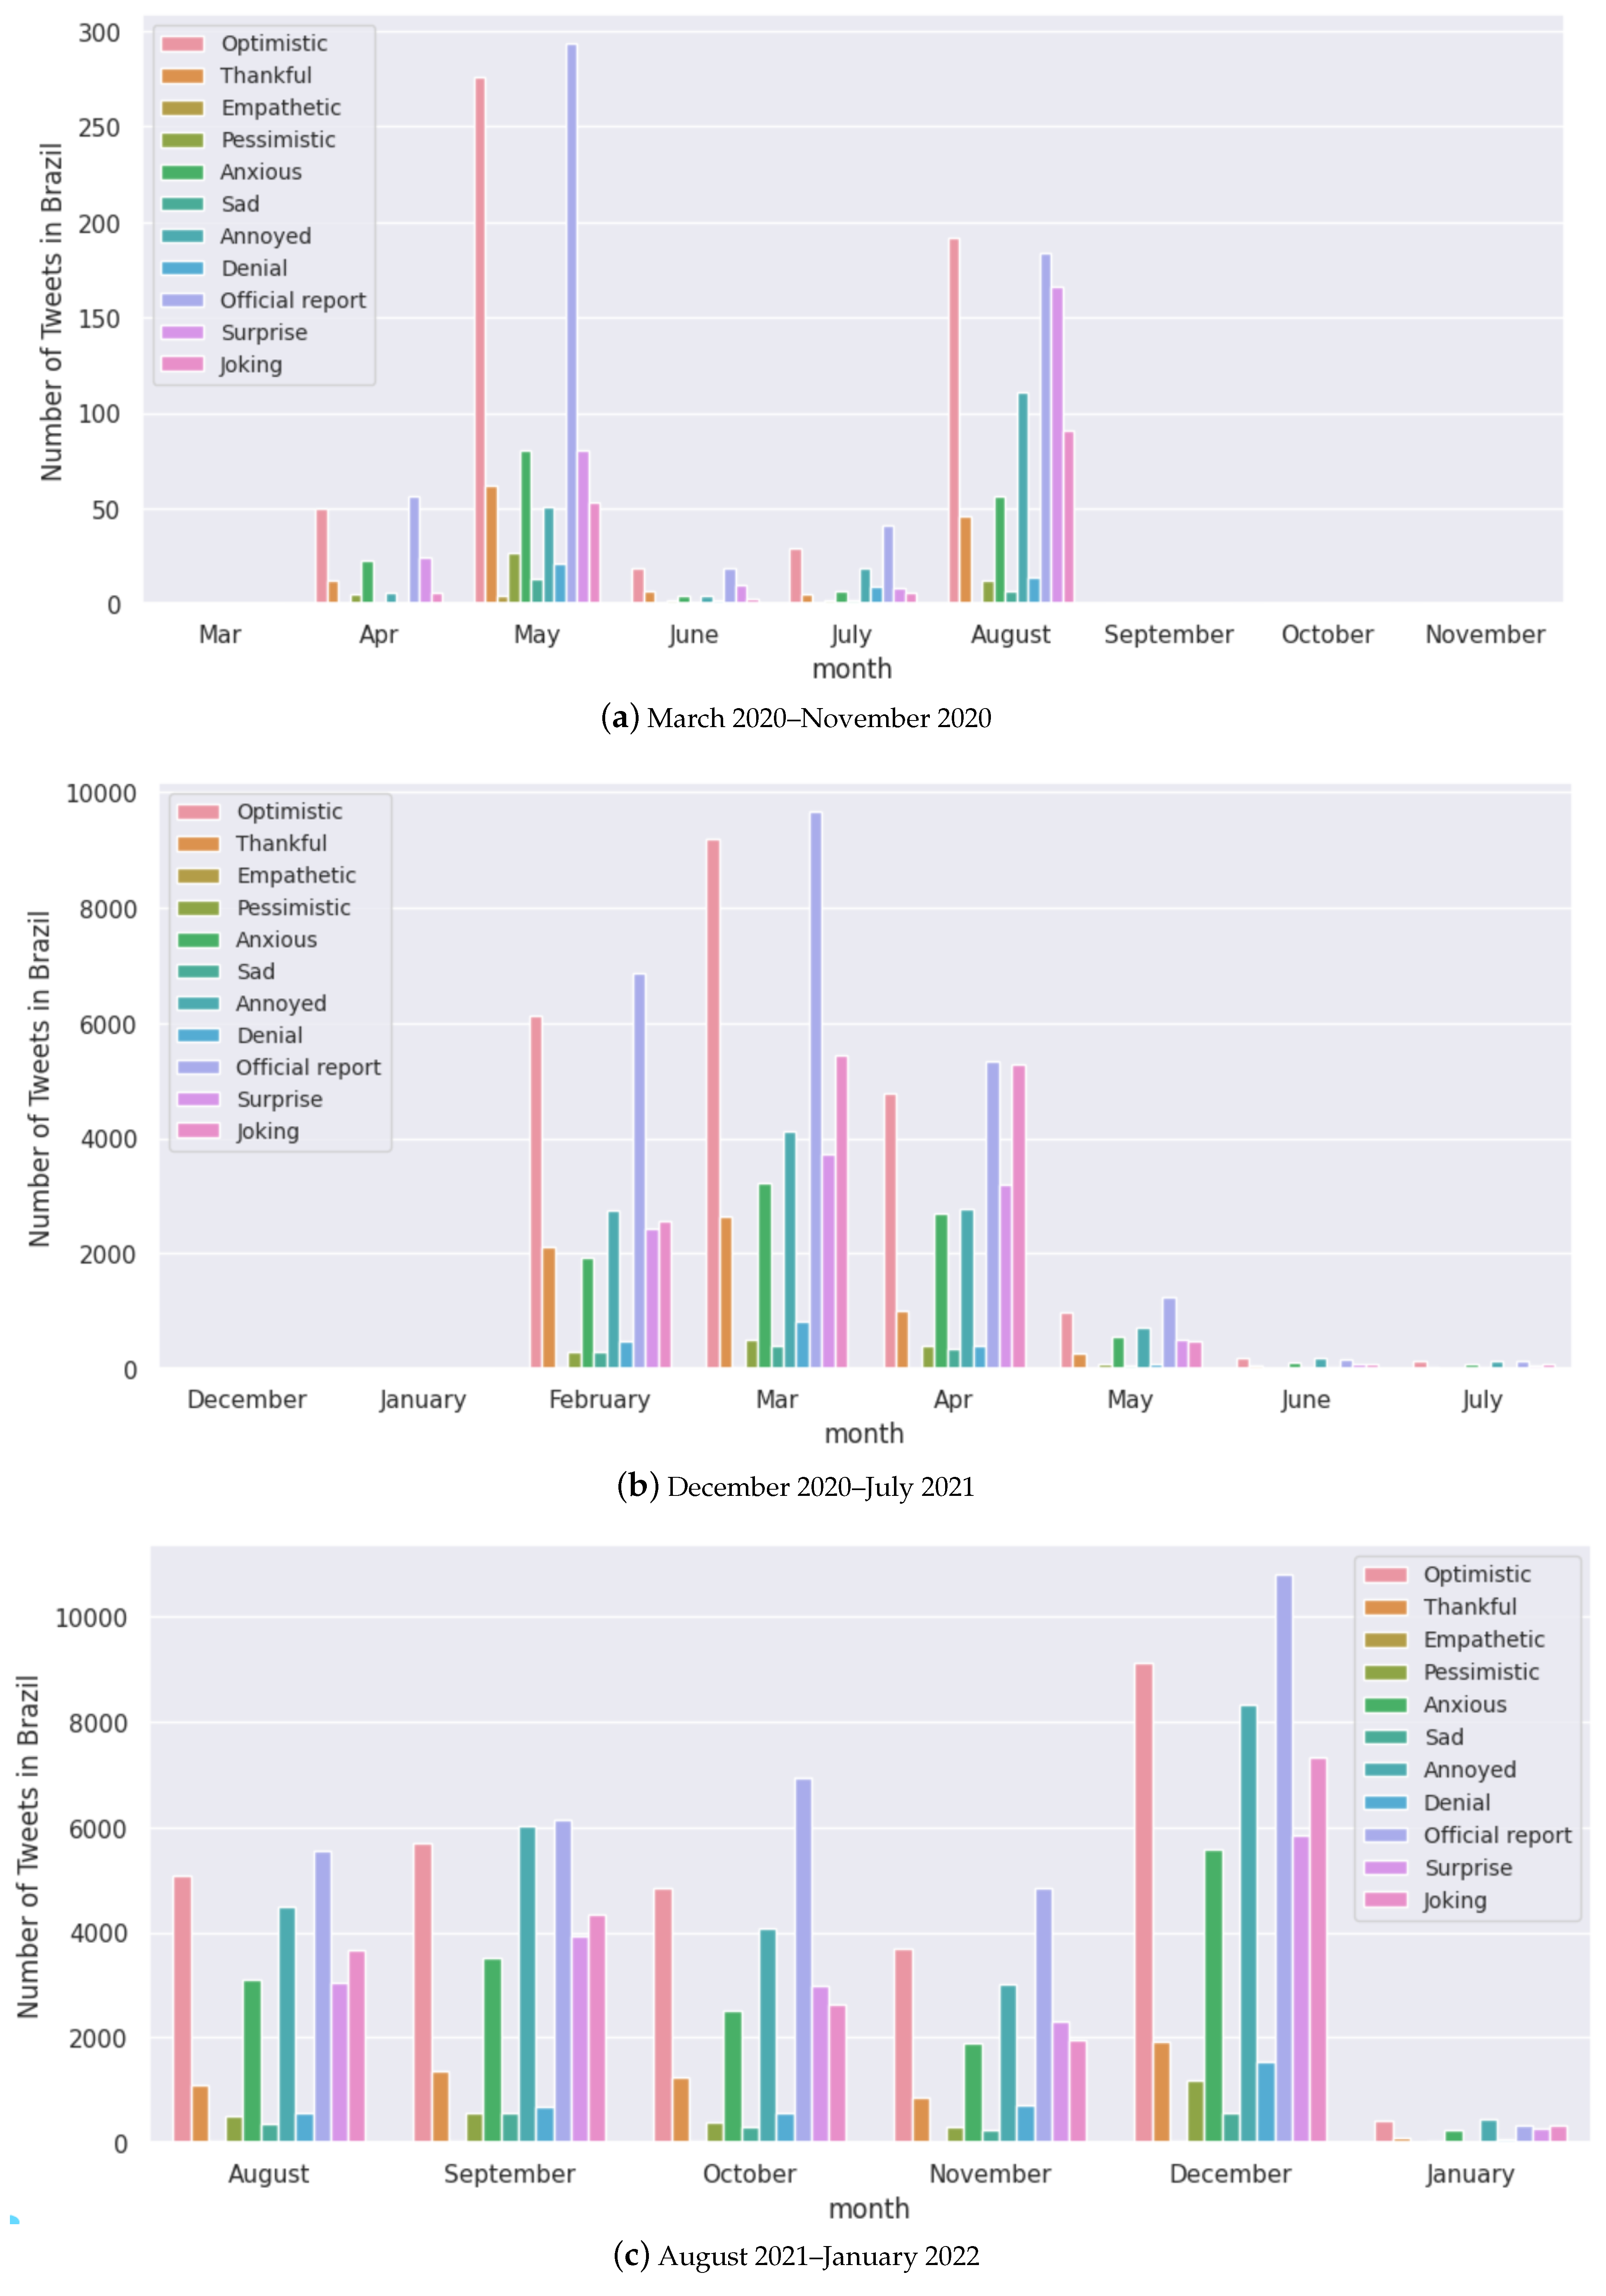
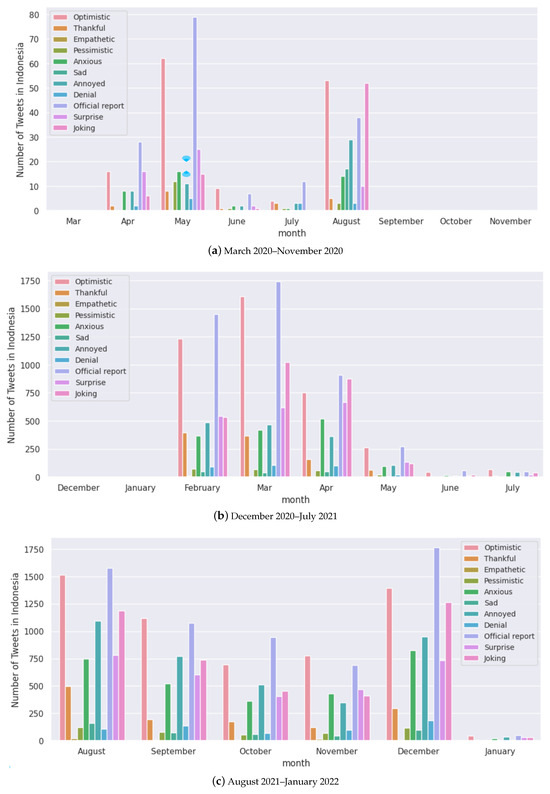
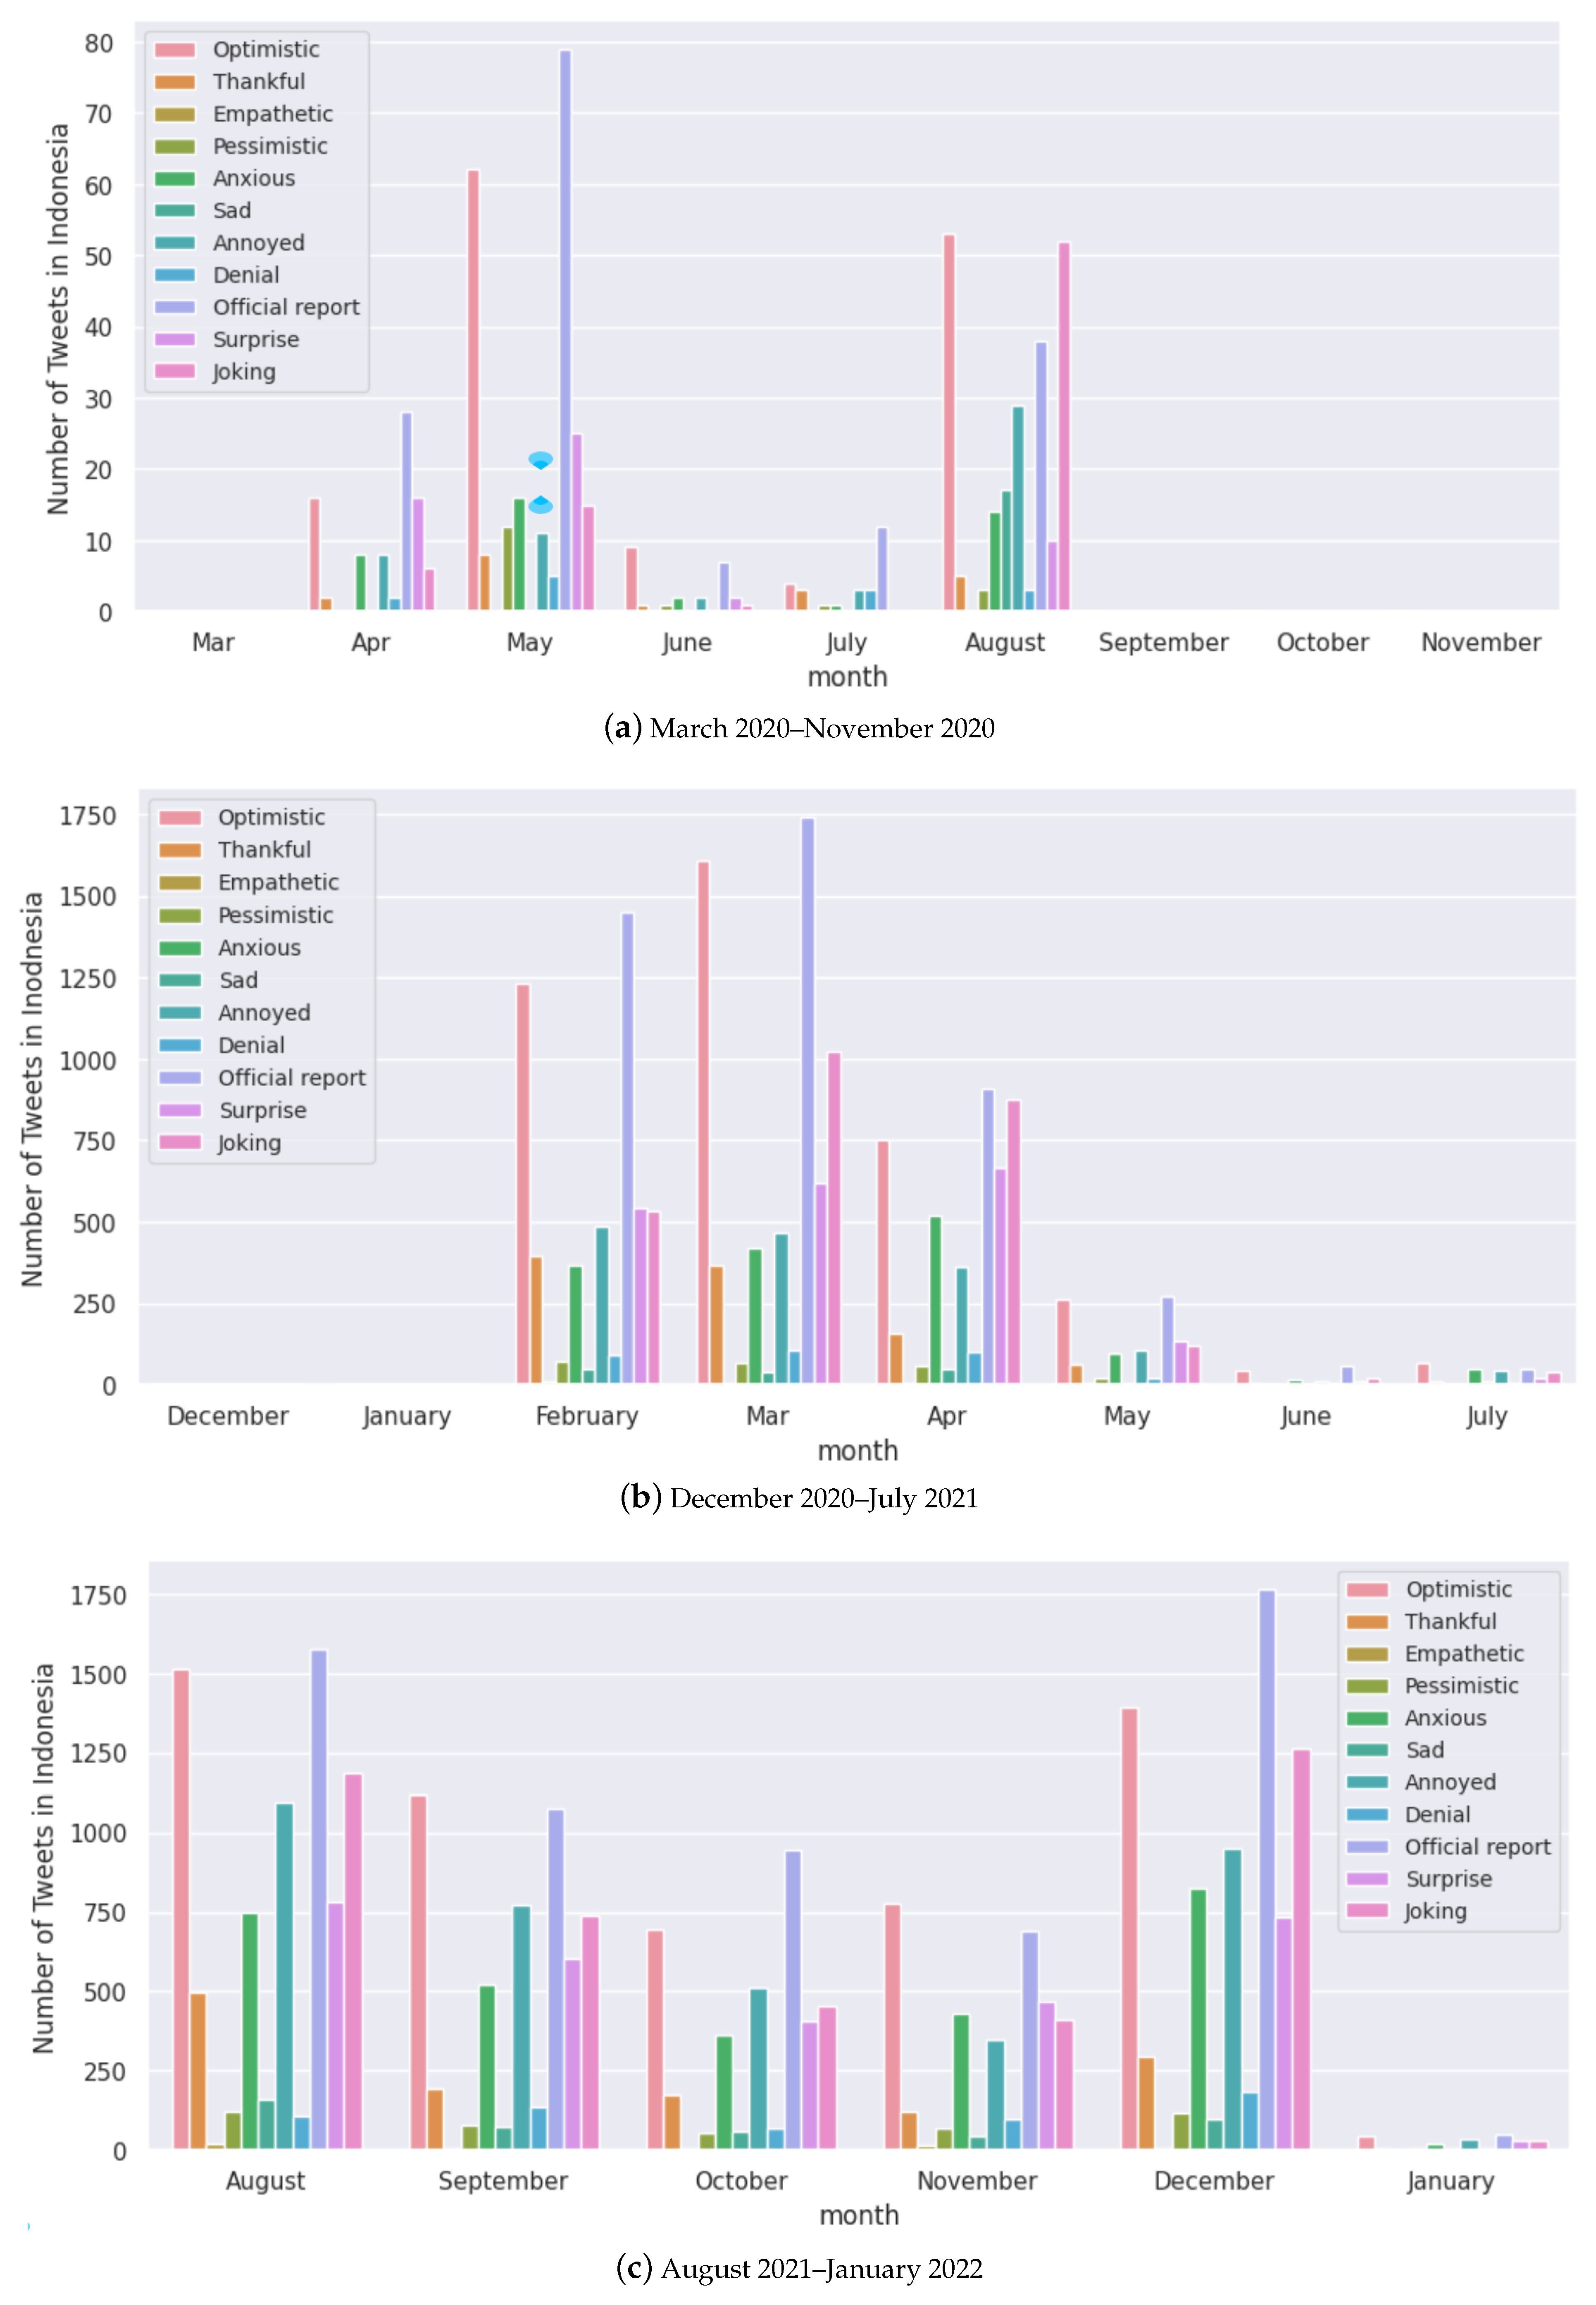
Figure A5.
Monthly analysis of the number of tweets for each sentiment for Indonesia.
Figure A5.
Monthly analysis of the number of tweets for each sentiment for Indonesia.
References
- Gorbalenya, A.E.; Baker, S.C.; Baric, R.S.; de Groot, R.J.; Drosten, C.; Gulyaeva, A.A.; Haagmans, B.L.; Lauber, C.; Leontovich, A.M.; Neuman, B.W.; et al. The species Severe acute respiratory syndrome-related coronavirus: Classifying 2019-nCoV and naming it SARS-CoV-2. Nat. Microbiol. 2020, 5, 536. [Google Scholar]
- Monteil, V.; Kwon, H.; Prado, P.; Hagelkrüys, A.; Wimmer, R.A.; Stahl, M.; Leopoldi, A.; Garreta, E.; Del Pozo, C.H.; Prosper, F.; et al. Inhibition of SARS-CoV-2 infections in engineered human tissues using clinical-grade soluble human ACE2. Cell 2020, 181, 905–913. [Google Scholar] [CrossRef] [PubMed]
- World Health Organization. Coronavirus Disease 2019 (COVID-19): Situation Report, 72; World Health Organization: Geneva, Switzerland, 2020. [Google Scholar]
- Cucinotta, D.; Vanelli, M. WHO declares COVID-19 a pandemic. Acta Bio-Medica Atenei Parm. 2020, 91, 157–160. [Google Scholar]
- Jordan, S.E.; Hovet, S.E.; Fung, I.C.H.; Liang, H.; Fu, K.W.; Tse, Z.T.H. Using Twitter for Public Health Surveillance from Monitoring and Prediction to Public Response. Data 2019, 4, 6. [Google Scholar] [CrossRef]
- Goel, A.; Gupta, L. Social Media in the Times of COVID-19. J. Clin. Rheumatol. 2020, 26, 220–223. [Google Scholar] [CrossRef] [PubMed]
- Cinelli, M.; Quattrociocchi, W.; Galeazzi, A.; Valensise, C.M.; Brugnoli, E.; Schmidt, A.L.; Zola, P.; Zollo, F.; Scala, A. The COVID-19 social media infodemic. Sci. Rep. 2020, 10, 16598. [Google Scholar] [CrossRef] [PubMed]
- Tasnim, S.; Hossain, M.M.; Mazumder, H. Impact of rumors and misinformation on COVID-19 in social media. J. Prev. Med. Public Health 2020, 53, 171–174. [Google Scholar] [CrossRef]
- Sharma, K.; Seo, S.; Meng, C.; Rambhatla, S.; Dua, A.; Liu, Y. Coronavirus on social media: Analyzing misinformation in Twitter conversations. arXiv 2020, arXiv:2003.12309. [Google Scholar]
- Mian, A.; Khan, S. Coronavirus: The spread of misinformation. BMC Med. 2020, 18, 89. [Google Scholar] [CrossRef]
- Apuke, O.D.; Omar, B. Fake news and COVID-19: Modelling the predictors of fake news sharing among social media users. Telemat. Inform. 2021, 56, 101475. [Google Scholar] [CrossRef]
- Abd-Alrazaq, A.; Alhuwail, D.; Househ, M.; Hamdi, M.; Shah, Z. Top concerns of tweeters during the COVID-19 pandemic: Infoveillance study. J. Med. Internet. Res. 2020, 22, e19016. [Google Scholar] [CrossRef] [PubMed]
- Barkur, G.; Vibha, G.B.K. Sentiment analysis of nationwide lockdown due to COVID 19 outbreak: Evidence from India. Asian J. Psychiatry 2020, 51, 102089. [Google Scholar] [CrossRef] [PubMed]
- Karami, A.; Anderson, M. Social media and COVID-19: Characterizing anti-quarantine comments on Twitter. Proc. Assoc. Inf. Sci. Technol. 2020, 57, e349. [Google Scholar] [CrossRef] [PubMed]
- Kumar, J.; Katto, M.S.; Siddiqui, A.A.; Sahito, B.; Jamil, M.; Rasheed, N.; Ali, M. Knowledge, attitude, and practices of healthcare workers regarding the use of face mask to limit the spread of the new coronavirus disease (COVID-19). Cureus 2020, 12, e7737. [Google Scholar] [CrossRef] [PubMed]
- Burki, T. The online anti-vaccine movement in the age of COVID-19. Lancet Digit. Health 2020, 2, e504–e505. [Google Scholar] [CrossRef]
- Puri, N.; Coomes, E.A.; Haghbayan, H.; Gunaratne, K. Social media and vaccine hesitancy: New updates for the era of COVID-19 and globalized infectious diseases. Hum. Vaccines Immunother. 2020, 16, 2586–2593. [Google Scholar] [CrossRef]
- Blume, S. Anti-vaccination movements and their interpretations. Soc. Sci. Med. 2006, 62, 628–642. [Google Scholar] [CrossRef]
- Hussain, A.; Ali, S.; Ahmed, M.; Hussain, S. The anti-vaccination movement: A regression in modern medicine. Cureus 2018, 10, e2919. [Google Scholar] [CrossRef]
- Berman, J.M. Anti-Vaxxers: How to Challenge a Misinformed Movement; MIT Press: Cambridge, MA, USA, 2020. [Google Scholar]
- Kata, A. A postmodern Pandora’s box: Anti-vaccination misinformation on the Internet. Vaccine 2010, 28, 1709–1716. [Google Scholar] [CrossRef]
- Ołpiński, M. Anti-vaccination movement and parental refusals of immunization of children in USA. Pediatr. Pol. 2012, 87, 381–385. [Google Scholar] [CrossRef]
- Benecke, O.; DeYoung, S.E. Anti-vaccine decision-making and measles resurgence in the United States. Glob. Pediatr. Health 2019, 6, 2333794X19862949. [Google Scholar] [CrossRef] [PubMed]
- de Figueiredo, A.; Simas, C.; Karafillakis, E.; Paterson, P.; Larson, H.J. Mapping global trends in vaccine confidence and investigating barriers to vaccine uptake: A large-scale retrospective temporal modelling study. Lancet 2020, 396, 898–908. [Google Scholar] [CrossRef] [PubMed]
- Megget, K. Even COVID-19 can’t kill the anti-vaccination movement. BMJ 2020, 369, m2184. [Google Scholar] [CrossRef] [PubMed]
- Yao, H.; Chen, J.H.; Xu, Y.F. Patients with mental health disorders in the COVID-19 epidemic. Lancet Psychiatry 2020, 7, e21. [Google Scholar] [CrossRef]
- Pfefferbaum, B.; North, C.S. Mental health and the Covid-19 pandemic. N. Engl. J. Med. 2020, 383, 510–512. [Google Scholar] [CrossRef]
- Cullen, W.; Gulati, G.; Kelly, B. Mental health in the Covid-19 pandemic. QJM Int. J. Med. 2020, 113, 311–312. [Google Scholar] [CrossRef] [PubMed]
- World Health Organization. Mental Health and Psychosocial Considerations During the COVID-19 Outbreak, 18 March 2020; Technical Report; World Health Organization: Geneva, Switzerland, 2020. [Google Scholar]
- Liu, J.J.; Bao, Y.; Huang, X.; Shi, J.; Lu, L. Mental health considerations for children quarantined because of COVID-19. Lancet Child Adolesc. Health 2020, 4, 347–349. [Google Scholar] [CrossRef]
- Otter, D.W.; Medina, J.R.; Kalita, J.K. A survey of the usages of deep learning for natural language processing. IEEE Trans. Neural Netw. Learn. Syst. 2020, 32, 604–624. [Google Scholar] [CrossRef]
- Liu, S.; Yang, N.; Li, M.; Zhou, M. A recursive recurrent neural network for statistical machine translation. In Proceedings of the 52nd Annual Meeting of the Association for Computational Linguistics (Volume 1: Long Papers), Baltimore, MD, USA, 22–27 June 2014; pp. 1491–1500. [Google Scholar]
- Lakew, S.M.; Cettolo, M.; Federico, M. A comparison of transformer and recurrent neural networks on multilingual neural machine translation. arXiv 2018, arXiv:1806.06957. [Google Scholar]
- Basiri, M.E.; Nemati, S.; Abdar, M.; Cambria, E.; Acharya, U.R. ABCDM: An attention-based bidirectional CNN-RNN deep model for sentiment analysis. Future Gener. Comput. Syst. 2021, 115, 279–294. [Google Scholar] [CrossRef]
- Li, D.; Qian, J. Text sentiment analysis based on long short-term memory. In Proceedings of the 2016 First IEEE International Conference on Computer Communication and the Internet (ICCCI), Wuhan, China, 13–15 October 2016; pp. 471–475. [Google Scholar]
- Hochreiter, S.; Schmidhuber, J. Long short-term memory. Neural Comput. 1997, 9, 1735–1780. [Google Scholar] [CrossRef] [PubMed]
- Vaswani, A.; Shazeer, N.; Parmar, N.; Uszkoreit, J.; Jones, L.; Gomez, A.N.; Kaiser, Ł.; Polosukhin, I. Attention is all you need. Adv. Neural Inf. Process. Syst. 2017, 5998–6008. [Google Scholar]
- Karita, S.; Chen, N.; Hayashi, T.; Hori, T.; Inaguma, H.; Jiang, Z.; Someki, M.; Soplin, N.E.Y.; Yamamoto, R.; Wang, X.; et al. A comparative study on transformer vs rnn in speech applications. In Proceedings of the 2019 IEEE Automatic Speech Recognition and Understanding Workshop (ASRU), Singapore, 14–18 December 2019; pp. 449–456. [Google Scholar]
- Devlin, J.; Chang, M.W.; Lee, K.; Toutanova, K. BERT: Pre-training of deep bidirectional transformers for language understanding. arXiv 2018, arXiv:1810.04805. [Google Scholar]
- Kherwa, P.; Bansal, P. Topic modeling: A comprehensive review. EAI Endorsed Trans. Scalable Inf. Syst. 2019, 7, e2. [Google Scholar] [CrossRef]
- Yadav, A.; Vishwakarma, D.K. Sentiment analysis using deep learning architectures: A review. Artif. Intell. Rev. 2020, 53, 4335–4385. [Google Scholar] [CrossRef]
- Cambria, E.; White, B. Jumping NLP curves: A review of natural language processing research. IEEE Comput. Intell. Mag. 2014, 9, 48–57. [Google Scholar] [CrossRef]
- Chang, Y.; Wang, X.; Wang, J.; Wu, Y.; Yang, L.; Zhu, K.; Chen, H.; Yi, X.; Wang, C.; Wang, Y.; et al. A survey on evaluation of large language models. ACM Trans. Intell. Syst. Technol. 2024, 15, 1–45. [Google Scholar] [CrossRef]
- Xue, J.; Chen, J.; Chen, C.; Zheng, C.; Li, S.; Zhu, T. Public discourse and sentiment during the COVID 19 pandemic: Using Latent Dirichlet Allocation for topic modeling on Twitter. PLoS ONE 2020, 15, e0239441. [Google Scholar] [CrossRef]
- Hung, M.; Lauren, E.; Hon, E.S.; Birmingham, W.C.; Xu, J.; Su, S.; Hon, S.D.; Park, J.; Dang, P.; Lipsky, M.S. Social network analysis of COVID-19 Sentiments: Application of artificial intelligence. J. Med. Internet. Res. 2020, 22, e22590. [Google Scholar] [CrossRef]
- Wang, T.; Lu, K.; Chow, K.P.; Zhu, Q. COVID-19 Sensing: Negative sentiment analysis on social media in China via Bert Model. IEEE Access 2020, 8, 138162–138169. [Google Scholar] [CrossRef]
- Chakraborty, K.; Bhatia, S.; Bhattacharyya, S.; Platos, J.; Bag, R.; Hassanien, A.E. Sentiment Analysis of COVID-19 tweets by Deep Learning Classifiers—A study to show how popularity is affecting accuracy in social media. Appl. Soft Comput. 2020, 97, 106754. [Google Scholar] [CrossRef] [PubMed]
- Cignarelli, A.; Sansone, A.; Caruso, I.; Perrini, S.; Natalicchio, A.; Laviola, L.; Jannini, E.A.; Giorgino, F. Diabetes in the Time of COVID-19: A Twitter-Based Sentiment Analysis. J. Diabetes Sci. Technol. 2020, 14, 1131–1132. [Google Scholar] [CrossRef] [PubMed]
- Zhou, J.; Yang, S.; Xiao, C.; Chen, F. Examination of community sentiment dynamics due to COVID-19 pandemic: A case study from Australia. arXiv 2020, arXiv:2006.12185. [Google Scholar] [CrossRef] [PubMed]
- Pokharel, B.P. Twitter sentiment analysis during COVID-19 outbreak in nepal. SSRN 3624719 2020. [Google Scholar] [CrossRef]
- Chandra, R.; Krishna, A. COVID-19 sentiment analysis via deep learning during the rise of novel cases. PLoS ONE 2021, 16, e0255615. [Google Scholar] [CrossRef]
- Kruspe, A.; Häberle, M.; Kuhn, I.; Zhu, X.X. Cross-language sentiment analysis of European Twitter messages duringthe COVID-19 pandemic. arXiv 2020, arXiv:2008.12172. [Google Scholar]
- Ng, Q.X.; Lim, S.R.; Yau, C.E.; Liew, T.M. Examining the prevailing negative sentiments related to COVID-19 vaccination: Unsupervised deep learning of Twitter posts over a 16 month period. Vaccines 2022, 10, 1457. [Google Scholar] [CrossRef]
- Mills, M.C.; Sivelä, J. Should spreading anti-vaccine misinformation be criminalised? BMJ 2021, 372, n272. [Google Scholar] [CrossRef] [PubMed]
- Johnson, N.F.; Velásquez, N.; Restrepo, N.J.; Leahy, R.; Gabriel, N.; El Oud, S.; Zheng, M.; Manrique, P.; Wuchty, S.; Lupu, Y. The online competition between pro-and anti-vaccination views. Nature 2020, 582, 230–233. [Google Scholar] [CrossRef]
- Tang, L.; Bie, B.; Park, S.E.; Zhi, D. Social media and outbreaks of emerging infectious diseases: A systematic review of literature. Am. J. Infect. Control 2018, 46, 962–972. [Google Scholar] [CrossRef]
- Mollema, L.; Harmsen, I.A.; Broekhuizen, E.; Clijnk, R.; De Melker, H.; Paulussen, T.; Kok, G.; Ruiter, R.; Das, E. Disease detection or public opinion reflection ? Content analysis of tweets, other social media, and online newspapers during the measles outbreak in The Netherlands in 2013. J. Med. Internet. Res. 2015, 17, e3863. [Google Scholar] [CrossRef] [PubMed]
- Kim, S.C.; Hawkins, K.H. The psychology of social media communication in influencing prevention intentions during the 2019 US measles outbreak. Comput. Hum. Behav. 2020, 111, 106428. [Google Scholar] [CrossRef]
- Freberg, K.; Palenchar, M.J.; Veil, S.R. Managing and sharing H1N1 crisis information using social media bookmarking services. Public Relat. Rev. 2013, 39, 178–184. [Google Scholar] [CrossRef]
- Ng, Q.X.; Teo, Y.Q.J.; Kiew, C.Y.; Lim, B.P.Y.; Lim, Y.L.; Liew, T.M. Examining the Prevailing Negative Sentiments Surrounding Measles Vaccination: Unsupervised Deep Learning of Twitter Posts from 2017 to 2022. Cyberpsychol. Behav. Soc. Netw. 2023, 26, 621–630. [Google Scholar] [CrossRef]
- Yang, Q.; Alamro, H.; Albaradei, S.; Salhi, A.; Lv, X.; Ma, C.; Alshehri, M.; Jaber, I.; Tifratene, F.; Wang, W.; et al. SenWave: Monitoring the Global Sentiments under the COVID-19 Pandemic. arXiv 2020, arXiv:2006.10842. [Google Scholar]
- Lande, J.; Chandra, R. Global COVID-19 X (Twitter) Dataset. SSRN 2024. [Google Scholar] [CrossRef]
- Lande, J.; Pillay, A.; Chandra, R. Deep learning for COVID-19 topic modelling via Twitter: Alpha, Delta and Omicron. PLoS ONE 2023, 18, e0288681. [Google Scholar] [CrossRef]
- Elman, J.L.; Zipser, D. Learning the hidden structure of speech. J. Acoust. Soc. Am. 1988, 83, 1615–1626. [Google Scholar] [CrossRef]
- Elman, J.L. Finding structure in time. Cogn. Sci. 1990, 14, 179–211. [Google Scholar] [CrossRef]
- Werbos, P.J. Backpropagation through time: What it does and how to do it. Proc. IEEE 1990, 78, 1550–1560. [Google Scholar] [CrossRef]
- Chandra, R. Competition and Collaboration in Cooperative Coevolution of Elman Recurrent Neural Networks for Time-Series Prediction. Neural Networks Learn. Syst. IEEE Trans. 2015, 26, 3123–3136. [Google Scholar] [CrossRef] [PubMed]
- Omlin, C.W.; Giles, C.L. Constructing deterministic finite-state automata in recurrent neural networks. J. ACM 1996, 43, 937–972. [Google Scholar] [CrossRef]
- Omlin, C.W.; Giles, C.L. Training second-order recurrent neural networks using hints. In Proceedings of the Ninth International Conference on Machine Learning. Morgan Kaufmann, Aberdeen, Scotland, 1–3 July 1992; pp. 363–368. [Google Scholar]
- Hochreiter, S. The vanishing gradient problem during learning recurrent neural nets and problem solutions. Int. J. Uncertain. Fuzziness Knowl.-Based Syst. 1998, 6, 107–116. [Google Scholar] [CrossRef]
- Graves, A.; Schmidhuber, J. Framewise phoneme classification with bidirectional LSTM and other neural network architectures. Neural Netw. Off. J. Int. Neural Netw. Soc. 2005, 18, 602–610. [Google Scholar] [CrossRef] [PubMed]
- Schuster, M.; Paliwal, K. Bidirectional recurrent neural networks. Signal Process. IEEE Trans. 1997, 45, 2673–2681. [Google Scholar] [CrossRef]
- Fan, Y.; Qian, Y.; Xie, F.L.; Soong, F.K. TTS synthesis with bidirectional LSTM based recurrent neural networks. In Proceedings of the INTERSPEECH, Singapore, 14–18 September 2014. [Google Scholar]
- Graves, A.; Jaitly, N.; Mohamed, A.R. Hybrid speech recognition with deep bidirectional LSTM. In Proceedings of the 2013 IEEE Workshop on Automatic Speech Recognition and Understanding, Olomouc, Czech Republic, 8–12 December 2013; pp. 273–278. [Google Scholar]
- Chandra, R.; Saini, R. Biden vs Trump: Modeling us general elections using BERT language model. IEEE Access 2021, 9, 128494–128505. [Google Scholar] [CrossRef]
- Chandra, R.; Kulkarni, V. Semantic and Sentiment Analysis of Selected Bhagavad Gita Translations Using BERT-Based Language Framework. IEEE Access 2022, 10, 21291–21315. [Google Scholar] [CrossRef]
- Chandra, R.; Ranjan, M. Artificial intelligence for topic modelling in Hindu philosophy: Mapping themes between the Upanishads and the Bhagavad Gita. PLoS ONE 2022, 17, e0273476. [Google Scholar] [CrossRef] [PubMed]
- Brown, P.F.; Della Pietra, V.J.; Desouza, P.V.; Lai, J.C.; Mercer, R.L. Class-based n-gram models of natural language. Comput. Linguist. 1992, 18, 467–480. [Google Scholar]
- Zhang, Z.; Sabuncu, M. Generalized cross entropy loss for training deep neural networks with noisy labels. Adv. Neural Inf. Process. Syst. 2018, 31, 8792–8802. [Google Scholar]
- Chen, Y.C. A tutorial on kernel density estimation and recent advances. Biostat. Epidemiol. 2017, 1, 161–187. [Google Scholar] [CrossRef]
- Baker, C.L. Double negatives. Linguist. Inq. 1970, 1, 169–186. [Google Scholar] [CrossRef]
- Oldenburg, J.; Klamroth, R.; Langer, F.; Albisetti, M.; Von Auer, C.; Ay, C.; Korte, W.; Scharf, R.E.; Pötzsch, B.; Greinacher, A. Diagnosis and management of vaccine-related thrombosis following AstraZeneca COVID-19 vaccination: Guidance statement from the GTH. Hämostaseologie 2021, 41, 184–189. [Google Scholar]
- Knoll, M.D.; Wonodi, C. Oxford–AstraZeneca COVID-19 vaccine efficacy. Lancet 2021, 397, 72–74. [Google Scholar] [CrossRef]
- Wise, J. COVID-19: European countries suspend use of Oxford-AstraZeneca vaccine after reports of blood clots. BMJ 2021, 372, n699. [Google Scholar] [CrossRef] [PubMed]
- Dror, A.A.; Eisenbach, N.; Taiber, S.; Morozov, N.G.; Mizrachi, M.; Zigron, A.; Srouji, S.; Sela, E. Vaccine hesitancy: The next challenge in the fight against COVID-19. Eur. J. Epidemiol. 2020, 35, 775–779. [Google Scholar] [CrossRef]
- Dubé, È.; Ward, J.K.; Verger, P.; MacDonald, N.E. Vaccine hesitancy, acceptance, and anti-vaccination: Trends and future prospects for public health. Annu. Rev. Public Health 2021, 42, 175–191. [Google Scholar] [CrossRef] [PubMed]
- Potamias, R.A.; Siolas, G.; Stafylopatis, A.G. A transformer-based approach to irony and sarcasm detection. Neural Comput. Appl. 2020, 32, 17309–17320. [Google Scholar] [CrossRef]
- Verma, P.; Shukla, N.; Shukla, A. Techniques of sarcasm detection: A review. In Proceedings of the 2021 International Conference on Advance Computing and Innovative Technologies in Engineering (ICACITE), Greater Noida, India, 4–5 March 2021; pp. 968–972. [Google Scholar]
- Dzisi, E.K.J.; Dei, O.A. Adherence to social distancing and wearing of masks within public transportation during the COVID 19 pandemic. Transp. Res. Interdiscip. Perspect. 2020, 7, 100191. [Google Scholar] [CrossRef]
- Kaplan, R.M.; Milstein, A. Influence of a COVID-19 vaccine’s effectiveness and safety profile on vaccination acceptance. Proc. Natl. Acad. Sci. USA 2021, 118, e2021726118. [Google Scholar] [CrossRef]
- Singh, A.; Halgamuge, M.N.; Moses, B. An analysis of demographic and behavior trends using social media: Facebook, Twitter, and Instagram. Soc. Netw. Anal. 2019, 87–108. [Google Scholar]
- Ferrara, E.; Cresci, S.; Luceri, L. Misinformation, manipulation, and abuse on social media in the era of COVID-19. J. Comput. Soc. Sci. 2020, 3, 271–277. [Google Scholar] [CrossRef] [PubMed]
- Kruspe, A.; Häberle, M.; Hoffmann, E.J.; Rode-Hasinger, S.; Abdulahhad, K.; Zhu, X.X. Changes in Twitter geolocations: Insights and suggestions for future usage. arXiv 2021, arXiv:2108.12251. [Google Scholar]
- Littlejohn, S.W.; Foss, K.A. Encyclopedia of Communication Theory; Sage: Thousand Oaks, CA, USA, 2009; Volume 1. [Google Scholar]
- Fouad, N.A. Work and vocational psychology: Theory, research, and applications. Annu. Rev. Psychol. 2007, 58, 543–564. [Google Scholar] [CrossRef]
- Glanz, K.; Bishop, D.B. The role of behavioral science theory in development and implementation of public health interventions. Annu. Rev. Public Health 2010, 31, 399–418. [Google Scholar] [CrossRef]
- Vydra, S.; Kantorowicz, J. Tracing policy-relevant information in social media: The case of Twitter before and during the COVID-19 Crisis. Stat. Politics Policy 2021, 12, 87–127. [Google Scholar] [CrossRef]
- Gilani, Z.; Farahbakhsh, R.; Tyson, G.; Crowcroft, J. A large-scale behavioural analysis of bots and humans on twitter. ACM Trans. Web (TWEB) 2019, 13, 1–23. [Google Scholar] [CrossRef]
- Liu, X. A big data approach to examining social bots on Twitter. J. Serv. Mark. 2019, 33, 369–379. [Google Scholar] [CrossRef]


Disclaimer/Publisher’s Note: The statements, opinions and data contained in all publications are solely those of the individual author(s) and contributor(s) and not of MDPI and/or the editor(s). MDPI and/or the editor(s) disclaim responsibility for any injury to people or property resulting from any ideas, methods, instructions or products referred to in the content. |
© 2024 by the authors. Licensee MDPI, Basel, Switzerland. This article is an open access article distributed under the terms and conditions of the Creative Commons Attribution (CC BY) license (https://creativecommons.org/licenses/by/4.0/).