Abstract
Rheumatoid Arthritis (RA) is a chronic autoimmune illness that occurs in the joints, resulting in inflammation, pain, and stiffness. X-ray examination is one of the most common diagnostic procedures for RA, but manual X-ray image analysis has limitations because it is a time-consuming procedure and is prone to errors. A specific algorithm aims to a lay stable and accurate segmenting of carpal bones from hand bone images, which is vitally important for identifying rheumatoid arthritis. The algorithm demonstrates several stages, starting with Carpal bone Region of Interest (CROI) specification, dynamic thresholding, and Gray Level Co-occurrence Matrix (GLCM) application for texture analysis. To get the clear edges of the image, the component is first converted to the greyscale function and thresholding is carried out to separate the hand from the background. The pad region is identified to obtain the contours of it, and the CROI is defined by the bounding box of the largest contour. The threshold value used in the CROI method is given a dynamic feature that can separate the carpal bones from the surrounding tissue. Then the GLCM texture analysis is carried out, calculating the number of pixel neighbors, with the specific intensity and neighbor relations of the pixels. The resulting feature matrix is then employed to extract features such as contrast and energy, which are later used to categorize the images of the affected carpal bone into inflamed and normal. The proposed technique is tested on a rheumatoid arthritis image dataset, and the results show its contribution to diagnosis of the disease. The algorithm efficiently divides carpal bones and extracts the signature parameters that are critical for correct classification of the inflammation in the cartilage images.
1. Introduction
Rheumatoid Arthritis (RA) is an autoimmune disorder that involves the progressive degeneration of joint tissues and organs, resulting in lethargy, pain, and immobility. Images of joint destruction and disease progression are one of the basic elements of RA X-ray diagnosis, thus allowing for accurate disease diagnosis and progression monitoring. Nevertheless, RA diagnosis by way of manual examination of X-ray pictures has limitations, including being time-consuming and potentially involving sporadic mistakes. For this purpose, a specific algorithm has been elaborated, allowing the bones of the hand to be segmented equally fast and correctly, which is important for skeleton occupation feature identification and the differential diagnosis of RA.
Segmentation approaches are crucial in radiology image analysis, especially in obtaining anatomical percolation from X-ray imaging for rheumatologic arteritis. Here, two prominent segmentation techniques are utilized in the extraction of carpal bones from X-ray images: The thresholding method is a process that separates regions that may be the foreground and background of an image according to their respective thresholds. In the extraction of carpal bone, the use of those procedures is required to separate the bones and wipe off any surrounding tissue and background [1]. A lower-threshold cutting system requires a fixed threshold value to discriminate between bone and non-bone areas. Notwithstanding that, the appropriate thresholding algorithms will be used when the intensity distribution deviates across the image. These modify the threshold values by the local image features, providing the segmentation with higher feasibility. Regional techniques separate image into regions that have the same composition, such as, say, the brightness or texture of a region. One well-known region-based segmentation approach is the region-growing algorithm, which starts with some seed points and then grows the region in a repetitive manner according to certain criteria, e.g., pixel intensities that are the same. There is a possibility of using this method to cut bones of the carpal segment because of the uniform intensity of the images.
Both carpal bone thresholding and region-based techniques have been applied to image classification for RA diagnosis in carpal X-rays. Thresholding techniques enable quick procedures where the contrast between bone and other areas is clear. Region-based methods, on the other hand, offer better performance in other cases where the mismatch of intensities is complex or as a precise location is needed. This study exploits these techniques of segmentation in achieving pixel-level representations of carpal bones from X-ray images. It makes the diagnostic progress of RA easier.
In the case of thresholding methods, there is one main problem, which is finding the optimum threshold value that suits the separation of the bone from non-bone areas, even in conditions when the image has different brightness and artifacts exist. Such variation will likely diminish the overall quality of the segmentation, resulting in a poor-quality extraction of carpal bones. Moreover, the noise factor makes the process more problematic, as it disrupts the image integrity and hampers the extraction of shades and shapes of bones. Region-dependent approaches have disadvantages embedded in seed selection and imposing assumption of uniformity throughout zoned areas. Choosing the right seeds for conduction will always be challenging, but when the bones are at least partially hidden or there are many partial bones nearby, it will become much more difficult. Also, these methods of automatic detection of the bone structures may not accurately separate non-uniform or irregular boney geometries, for example, the ones affected by RA pathology, which results in the wrong identification of the extracted bone areas. In conclusion, the creation of solid segmentation algorithms can be seen as a way of improving the ability of X-ray images to detect alterations in carpal bones related to RA, taking into consideration variable intensity ranges, image noise, and complicated anatomical structures.
The proposed work makes significant contributions to the field of carpal bone extraction from X-ray images for RA diagnosis through the following main points:
- An adaptive thresholding approach adds an edge to bone carpal segmentation accuracy by adapting the local threshold value according to its surroundings, thereby better coping with factors like uneven intensity distributions and image artifacts.
- With its ability to exactly recognize the CROI, the algorithm to specify it by detecting the pad region and establishing the bounding box of the largest contour leads to the greatest precision of the carpal bone allocation from the adjacent tissues, which is vitally important for accurate RA diagnosis. The Carpal bone Region of Interest (CROI) is a critical concept in the diagnosis of RA using X-ray images. The intuition behind defining a CROI lies in the need to focus on specific anatomical structures that are most relevant to the disease being diagnosed.
- Pad Region: The pad region refers to the area surrounding the carpal bones in an X-ray image. It is important for defining the boundaries of the carpal bones during segmentation. By detecting this region, the algorithm can more accurately isolate the bones from surrounding soft tissues, which is crucial for effective diagnosis of rheumatoid arthritis.
- Greyscale Function: The greyscale function is a process that converts a color image into shades of grey, where each pixel’s intensity is represented by a single value. This simplification reduces the complexity of the image and allows for easier analysis of pixel intensities, which is particularly useful in medical imaging, where color information may not be necessary for diagnosis.
- Implementation of GLCM texture analysis for the purpose of differentiating textural parameters corresponding to contrast and energy gives the algorithm a chance to build and use diagnostic patterns. This will in turn help the algorithm with selecting an image as normal or inflamed. The Gray Level Co-occurrence Matrix (GLCM) is a powerful tool used in image processing to analyze the spatial relationships between pixel intensities. The intuition behind using GLCM in the context of RA diagnosis is rooted in its ability to capture texture information that is often indicative of underlying pathological changes.
- Rigorous testing of the proposed technique on a dataset of rheumatoid arthritis images demonstrates its effectiveness in accurately segmenting carpal bones and extracting relevant features critical for RA diagnosis.
The remaining part of the proposed work is structured as follows. Section 2 describes the literature review of the various research work proposed by researchers. Section 3 gives the dataset description, augmentation, and segmentation techniques, which act as hybrid segmentation for accurate diagnosis. The results obtained by the existing and proposed work are demonstrated in Section 4. Finally, Section 5 gives the conclusion and proposes future work in RA diagnosis.
2. Related Work
Wen [2] demonstrates a unique technique for pairing 3D models with 2D X-ray images in high frequency. Fast X-ray simulations and global optimization techniques are involved. Computational tomography uses a radial series of X-ray projections acquired from the specimen and reconstructs it into a single tomographic image through the combination of a fast X-ray simulation algorithm and a global optimization algorithm. Wang et al. [3] describe a new deep learning method, which aims to achieve correct measurement of cartilage shrinkage in rheumatoid arthritis patients. The idea involves the registration of 3D patient-specific joint models, created by healthy and RA patients, to 2D X-ray images via a deep learning-based algorithm. The artificial intelligence technology proposed by Ponnusamy et al. [4] is compared against a machine learning and traditional computer vision-based algorithm in measuring the distance between X-ray finger joints. Kim et al.’s work [5] involves the use of a pre-trained deep learning model to perform the function of the automatic detection of the width of the joint space and measures it precisely in HRCT finger scans. The model is trained on a large volume of X-ray images that had been specifically created to be robust to the variations in factors like the quality of the image and patient positioning, among others. In Gemme et al. [6], a BMPS-cut segmentation algorithm of carpal bones from MR volumes is proposed. The methodology is a hybrid of the thresholding, region growing, and morphologic operations for the segmentation of carpal bones, facilitated by the volume data from an MRI image. In Hage and Hamade [1], the segmentation is followed by the individual separation of the bones while employing the BMPS-cut method along the middle sagittal bone plane in order to increase the reliability and accuracy of segmenting the end products. Brown and colleagues [7] used an innovative method, in other words, a statistical shape model, to generate bone destruction in mice that were infected with rheumatoid arthritis. In Mastmeyer et al. [8], the process constituted developing 3D reconstructions of healthy bone micro-CT images and those of bone infected with RA via statistical shape models by identifying the difference between them.
Sebastian et al. [9] describe a technique for the segmentation of carpal bones in CT images and the subsequent use of the skeletal information. CT scanning is used for the generation of a 3D model of the carpal bones, which is then modified in iterations until it eventually matches the actual data. Deformation is produced by a driving force that is image data-based and by a coupling force that makes sure the skeleton is kept together. Cheraya et al. [10] highlight the practical role played by dual-energy CT in the creation of a bone marrow map and a reduction in metal artifacts in musculoskeletal applications, which are beyond the capability of crystal imaging. The paper provides a detailed explanation of the procedure of dual-energy CTA for bone marrow mapping, which clinically can be used in the diagnosis of bone marrow conditions. Singh et al. [11] implement a machine vision method for the differentiation of osteoporotic bone with an infected trabeculum. The purpose of the approach is to highlight the characteristics of the trabecular bone structure through image processing methods and then assign a patient to the healthy class or the osteoporotic class using the machine learning algorithm. Lo and Lai [12] propose a deep learning evaluation of knee septic arthritis by using feature engineering with transformer features that are included in ultrasonic imaging modalities. Here, the author discusses the new transformer-inspired deep learning algorithm, which can distinguish between septic and non-septic knee ultrasound images. Bielecka [13] proposed a syntactic–geometric hierarchical classifier of contours for the analysis of the nuclei outline in X-ray pictures using fuzzy logic. The method starts with the extraction of contours from X-ray pictures of bones, and it then analyzes these contours, which are subsequently classified into various classes by a classifier that is a combination of syntactic, geometric, and fuzzy approaches.
Üreten [14] focuses on identifying rheumatoid arthritis and osteoarthritis diseases by utilizing plain radiographs and a convolutional neural network (CNN). The study aimed to classify hand X-ray images into three categories: rheumatoid arthritis, psoriatic arthritis, and osteoarthritis. The CNN model used the VGG16 network architecture with the calculated transferred gradients. Diana et al. [15] suggested making a new method to define the bone contours in radiography of the hand. This method includes thresholding and an edge detection approach as well as morphological operations when it is used as an auxiliary for outlining the bones in the hand X-ray image. Alarcón-Paredes et al. [16] introduce a computer-aided diagnostic system for rheumatoid arthritis with features including infrared images, RGB photos, and grip force and based on artificial intelligence. However, the approach is based on deformable models, which are effective in terms of the fast processing time. The segmentation is achieved through the coupled deformable model, which is suitable for the analysis of the bones in the condensed tomography images and which also contains the relational aspect of the skeleton. They created a network and evaluated its performance by means of metrics like overlap error and distance error. Balaji [17], along with others, suggested a CNN-based model to differentiate hand arthritis. The study aimed to classify hand radiographic images into three categories: has a negative effect on normal cartilage, causes early arthritis, and finally results in the degeneration of all cartilage and destruction of the whole joint. The study by Ahalya et al. [18] presents RANet, a custom CNN model designed for automated detection of rheumatoid arthritis in hand thermal images, showcasing advancements in image analysis techniques. Pemasiri et al. [19] have explored multi-modal approaches, and the integration of various imaging modalities in recent research. For instance, Alarcón-Paredes et al. [16] developed a computer-aided diagnostic system that combines thermal images, RGB photos, and grip force measurements, leveraging artificial intelligence for enhanced screening of rheumatoid arthritis.
Advanced Segmentation Techniques: Recent segmentation methods, such as those based on deep learning and hybrid algorithms, have shown promising results. Wang et al. [3] introduced a deep registration method for accurate quantification of joint space narrowing progression in rheumatoid arthritis, which could be a valuable addition to comparisons.
Fuzzy Cognitive Maps: The use of fuzzy cognitive maps for decision support in diagnosing rheumatic musculoskeletal diseases has been explored in recent studies [20], providing a novel approach to understanding complex relationships in clinical data.
Augmentation Techniques: Recent research has highlighted the importance of data augmentation techniques in improving model performance. Studies have shown that techniques such as rotation, scaling, and brightness adjustments can significantly enhance the accuracy of segmentation models. Recent advancements in deep learning have led to the development of various architectures that build upon the foundational concepts of ResNet and DenseNet. One notable variant is AOGNet (Attribute-Object Graph Network), which integrates the strengths of both residual learning and dense connectivity. AOGNet is designed to enhance feature representation by modeling the relationships between attributes and objects in a hierarchical manner, thereby improving the network’s ability to capture complex patterns in medical images. This architecture has shown promising results in tasks such as image segmentation and classification, particularly in the context of medical diagnostics. For instance, AOGNet leverages a graph-based approach to effectively combine local and global features, which can be particularly advantageous in distinguishing between inflamed and normal tissues in rheumatoid arthritis imaging. By comparing the performance of AOGNet with traditional ResNet and DenseNet models, researchers have found that AOGNet can achieve higher accuracy and robustness in segmentation tasks, making it a compelling alternative for applications in medical image analysis. This highlights the importance of exploring various model architectures and their adaptations to further enhance diagnostic capabilities in the field of rheumatoid arthritis. Knowledge distillation has emerged as a powerful technique to enhance the efficiency of deep learning models, particularly in the context of medical image analysis. This method involves transferring knowledge from a larger, more complex model (the teacher) to a smaller, more efficient model (the student), enabling the student model to achieve comparable performance with reduced computational resources. Recent studies have demonstrated the effectiveness of knowledge distillation in various applications, including classification and segmentation tasks for rheumatoid arthritis diagnosis. For instance, research has shown that applying distillation techniques can significantly improve the performance of lightweight models, allowing them to maintain high accuracy while reducing inference time and memory usage. One notable work explored the use of knowledge distillation to train compact models for segmenting carpal bones in X-ray images, achieving results that closely matched those of larger models like ResNet and DenseNet while being more suitable for deployment in clinical settings. This suggests that integrating knowledge distillation into the proposed hybrid segmentation algorithm could further enhance its efficiency and practicality. Future work should focus on exploring various distillation strategies, such as feature-based or logit-based distillation, to optimize the performance of models specifically tailored for rheumatoid arthritis diagnosis. The existing methods’ overview table is in Table 1.

Table 1.
A summary of segmentation techniques in X-ray images.
Medical images, which are important in RA diagnosis and monitoring, are not easy to be accurately segmented and analyzed, which is the main limitation in the discussed papers. Due to the reliance on manual X-ray image analysis methods, errors are quite common and may lead to prolonged scanning, thus giving rise to the need for creating automated algorithms that allow for more precise carpal bone separation from hand X-ray images. Problems may arise while trying to deal with computational complexity, the availability of high-quality and specialized datasets, image quality, patient positionings that are very sensitive, and complex anatomical structures.
The techniques to be proposed are aimed at addressing these challenges using innovative solutions, including fast X-ray simulation, deep learning-based registration, segmentation, region growing, morphological operations, statistics shape models and registration, deformable models, and CNNs. Carpal bone Region of Interest (CROI), adaptive thresholding, and GLCM texture analysis are implemented to improve the precision and manual efforts that are required when carpal bones are being segmented. In addition to that, the automated pattern extraction and disease classification features of these methods are used in to correctly and quickly diagnosis RA, and it makes differentiation between inflamed and normal cartilage images possible with more accuracy. Overall, the proposed hybrid segmentation algorithms in medical image analysis are prerequisite, enabling physicians to make early and effective diagnosis of RA patients.
3. Proposed Work
The presented work will be aimed at developing a state-of-the-art method to increase the precision of carpal bone segmentation from X-ray images, especially in the field of detecting rheumatoid arthritis (RA). The effective adaptation of the thresholding technique is where the proposed method sticks out. The technique aids in dynamically adjusting the local threshold value of surrounding intensity pixels to enhance the accuracy of segmentation. Hence, this adaptive thresholding is the core one among the four to combat the main problems with uneven intensity distributions and image artifacts. The threshold value is the algorithm’s adaptability to local image characteristics. This facilitates the sharper differentiation of bone structures from surrounding tissues and, as a result, leads to higher precision in diagnosing RA, which further improves the overall diagnostic accuracy.
Additionally, one of the merits of the current algorithm is its potentiality to accurately identify the CROI—the Carpal Bone Region of Interest. It is accomplished through the discovery of the pad area within the image and sketching the highest contour enclosed, which helps obtain most accurate mark for the location of carpal bones from the other surrounding tissues. Therefore, the precise definition of CROI is vital for an exact diagnosis of RA in the algorithm, as it enables the algorithm to concentrate solely on the places of interest that may manifest within X-ray images. An algorithm that exactly distinguishes carpal bones can identify features and signals linked to RA inflammation and thus contribute to quicker and more accurate diagnosis.
The proposed segregation method relies on applying Gray-Level Co-occurrence Matrix (GLCM) texture analysis to implement contrast and energy textural distinctions in the segmented areas. Analyzing these compositional functions, the algorithm can efficiently learn image representations from them and classify images as either healthy or abnormal. Therefore, this entails that texture analysis is also included in the algorithms, to add to the complexity of the algorithm, which allows it to distinguish the small variations in image features that may be an indication of RA disease.
Here, k is a scaling factor that adjusts the influence of the local standard deviation on the threshold. The use of k allows for flexibility in how much the local contrast (as represented by σ(x, y)) affects the thresholding decision. Equation (1) represents the local adaptive thresholding approach used in the algorithm. It calculates the local threshold value T(x, y) at each pixel location (x, y) based on the local mean intensity μ(x, y) and local standard deviation σ(x, y), with a scaling factor k. While k is commonly set to 1 for simplicity and empirical effectiveness, it can be adjusted based on the specific needs of the application or the characteristics of the data being analyzed.
In Equation (2), I(i, j) is used to calculate the local mean intensity μ(x, y) within a neighborhood N, which indicates the number of pixels in the neighborhood around the pixel (x, y). The sum aggregates the intensity values of all pixels in that neighborhood. The expression I(i, j) represents the pixel-intensity values. It is calculated by summing the intensity values of all pixels within a defined window centered on (x, y).
In Equation (3) I(i, j) is used to compute the local standard deviation σ(x, y). The equation measures the variation in pixel intensities around the local mean intensity μ(x, y) calculated in Equation (2).
Equation (4) defines the pad region mask P(x, y), which assigns a value of 1 if the pixel (x, y) is part of the pad region and 0 otherwise.
Equation (5) calculates the bounding box coordinates enclosing the pad region, aiding in the specification of the Carpal bone Region of Interest (CROI).
Equation (6) computes the contrast measure, which quantifies the variation in pixel intensities within the image. The term P(i, j) · (i − j)2 indicates that we are performing scalar multiplication. Here, P(i, j) is a scalar value representing the probability of the pixel intensity pair (i, j), and (i − j)2 is also a scalar value representing the squared difference between the intensity values. N typically represents the number of possible intensity levels in the image.
Equation (7) calculates the energy measure, representing the sum of squared elements in the co-occurrence matrix. N typically represents the number of possible intensity levels in the image.
Equation (8) normalizes the co-occurrence matrix P(i, j) to ensure that its elements sum up to 1, facilitating comparison across different images.
Equation (9) computes the entropy measure, which quantifies the randomness or uncertainty in the distribution of pixel intensities. N is to iterate over all intensity levels when calculating their respective measures based on the co-occurrence matrix.
Equation (10) calculates the homogeneity measure, which indicates the similarity of adjacent pixels in terms of intensity values. N is to iterate over all intensity levels when calculating their respective measures based on the co-occurrence matrix.
Equation (11) computes the correlation measure, representing the linear dependency between pixel intensities in the image. The term i · j · P(i, j) represents scalar multiplication of the intensity values i and j with the probability P(i, j). The numerator sums these scalar products over all intensity pairs, subtracting the product of the means μi · μj, which is also scalar. The denominator σi · σj is the product of the standard deviations, which is a scalar value. N is to iterate over all intensity levels when calculating their respective measures based on the co-occurrence matrix.
Equation (12) defines the classification rule, where pixels with energy values exceeding a predefined threshold are classified as “inflamed”, while others are classified as “Normal”.
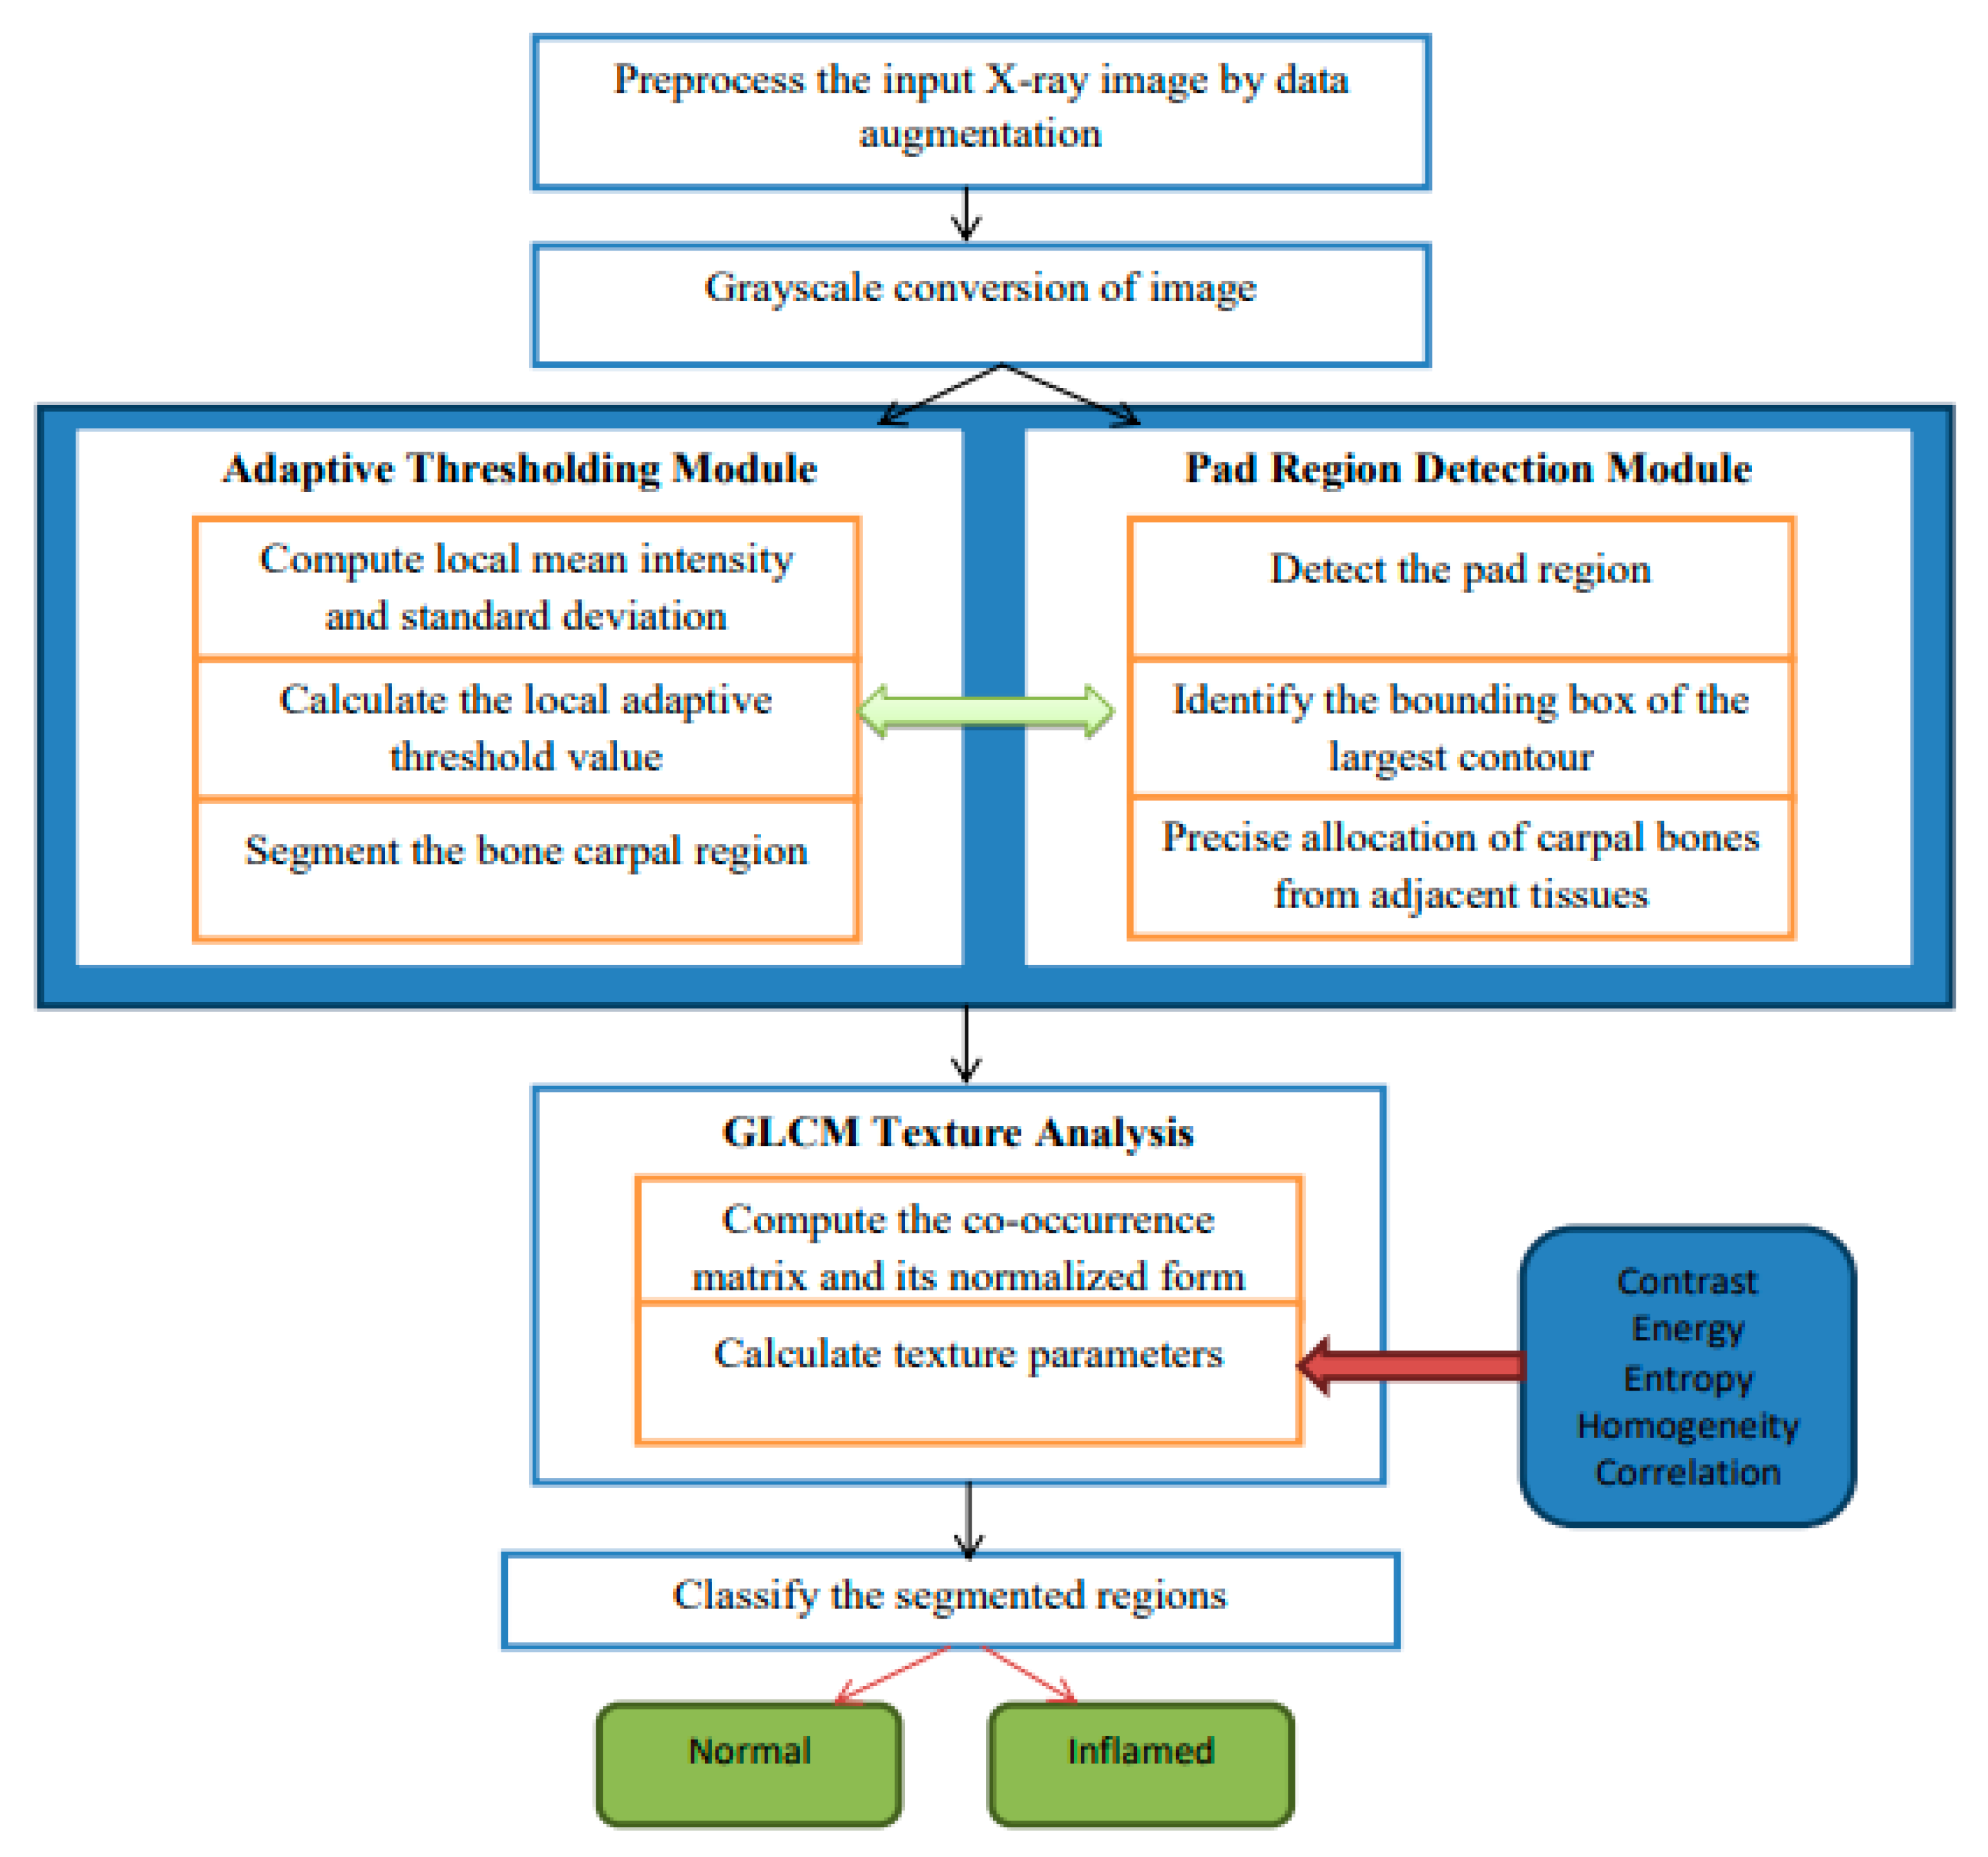
The hybrid algorithmic scheme in Figure 1 used for the segmentation of carpal bones as well as diagnosing rheumatoid arthritis (RA) is involved with an adaptive thresholding mechanism, fine cropping of ROIs, and the occurrence of GLCM to guarantee enhanced performance. The procedure starts by preprocessing images used to improve their quality, and then continues with a threshold set adaptively to separate carpal bones. Pad area identification and CROI setting is responsible for accurate carpal bone placement. Tissue texture analysis using the GLCM technique gives rise to contrast and energy, which are further used for obtaining constant or inflamed tissue. Modules stitched together make up a seamless pipeline for satisfactory segmentation and diagnostics, therefore providing a complete solution for RA detection from radiographs. In Figure 1, which describes the architecture of the proposed hybrid segmentation algorithm, “fuzzy text” likely refers to the visual representation of the algorithm’s components or processes that may not be clearly defined or are ambiguous in their presentation. Input X-ray image: the initial image to be processed. Preprocessing module: enhances image quality through noise reduction and normalization. Adaptive thresholding: segments the image based on local intensity variations. Region detection: identifies and isolates the carpal bone regions. GLCM texture analysis: computes texture features for classification. Classification output: final classification of regions as “normal” or “inflamed”; fuzzy logic Integration is employed to manage uncertainty in pixel classification, enhancing segmentation accuracy.
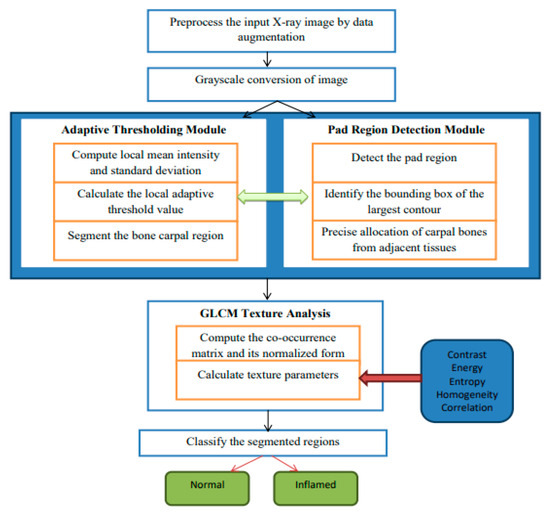
Figure 1.
A detailed architecture of proposed hybrid segmentation.
| Adaptive Thresholding grayImage = ConvertToGrayscale(inputImage) blurredImage = GaussianBlur(grayImage, kernelSize) thresholdedImage = AdaptiveThreshold(blurredImage, method, blockSize, constant) return thresholdedImage thresholdedImage = AdaptiveThresholdingModule(inputImage) Pad Region Detection contours = FindContours(thresholdedImage) largestContour = GetLargestContour(contours) boundingBox = ComputeBoundingBox(largestContour) padRegion = ExtractRegion(thresholdedImage, boundingBox) return (padRegion, boundingBox) (padRegion, boundingBox) = PadRegionDetectionModule(thresholdedImage) CROI = SpecifyCROIModule(padRegion, boundingBox) glcm = ComputeGLCM(CROI, distances, angles) textureParameters = ExtractTextureParameters(glcm) return textureParameters textureParameters = GLCMTextureAnalysisModule(CROI) |
- Preprocessing: The algorithm begins with preprocessing the input X-ray images to improve their quality. This includes data augmentation techniques such as rotation, scaling, flipping, and brightness adjustments, which increase the dataset size by 10% to 70%. This augmentation helps the model generalize better by exposing it to various image conditions, thus improving its robustness and accuracy.
- Adaptive Thresholding: The core of the segmentation process involves an adaptive thresholding mechanism. This technique dynamically adjusts the local threshold values based on the intensity of surrounding pixels, allowing for sharper differentiation between the carpal bones and adjacent tissues. This is particularly effective in handling uneven intensity distributions and image artifacts commonly found in X-ray images.
- GLCM Texture Analysis: The algorithm employs Gray-Level Co-occurrence Matrix (GLCM) texture analysis to extract diagnostic patterns from the images. By analyzing textural parameters such as contrast and energy, the algorithm can classify regions of the image as either “normal” or “inflamed”, which is crucial for RA diagnosis.
- Region of Interest (ROI) Detection: The algorithm includes a module for detecting the Carpal bone Region of Interest (CROI). This involves identifying the bounding box of the largest contour in the segmented image, ensuring precise allocation of carpal bones.
- Classification: Finally, the segmented regions are classified into “normal” and “inflamed” categories based on the computed texture parameters and the results from the adaptive thresholding.
The Hybrid Segmentation Algorithm deals with adaptive thresholding, CROI specification with precision, and GLCM texture analysis together with classification, and it allows one to diagnose RA from X-ray images successfully with high accuracy. It starts by thresholding the input image to segment the CROI, then moves on to detecting pads and exactly finding the interest region of the corner. By means of GLCM textures, diagnostically significant features embedded in the area of interest (CROI) are extracted. Therefore, it is possible to classify the observed tissues as being either normal or inflamed. The algorithm shows the quantification diagnosis side by side with the input image, the threshold image, and the CROI to offer complex insight into RA diagnosis for clinicians.
4. Results and Discussion
The dataset contains a sample of 1500 hand X-rays randomized and acquired from patients with a diagnosis of rheumatoid arthritis (RA) and an extra 200 images used for validating. These images show different types of joint autoimmune disorders such as erosions, wide joint space, and periarticular osteopenia [21].
- Dataset Description: The dataset used in this study consists of 1000 hand X-ray images obtained from the source, e.g., a local hospital or a public database. Ethical approval was granted, and informed consent was obtained from all patients prior to data collection.
- Image Characteristics: The images are in DICOM format, with a resolution of 512 × 512 pixels. Preprocessing steps included normalization and resizing to ensure uniformity across the dataset.
- Demographics: The dataset includes images from 600 patients, with a balanced representation of genders (50% male, 50% female) and a diverse age range (20–80 years).
- Annotation Process: Ground truth labels were provided by two expert radiologists, with a consensus reached on the classification of images as either “normal” or “inflamed”. Quality control measures included double-checking annotations for consistency.
- Data Splitting: The dataset was divided into training (70%), validation (15%), and test (15%) sets, with stratified sampling employed to maintain class distribution.
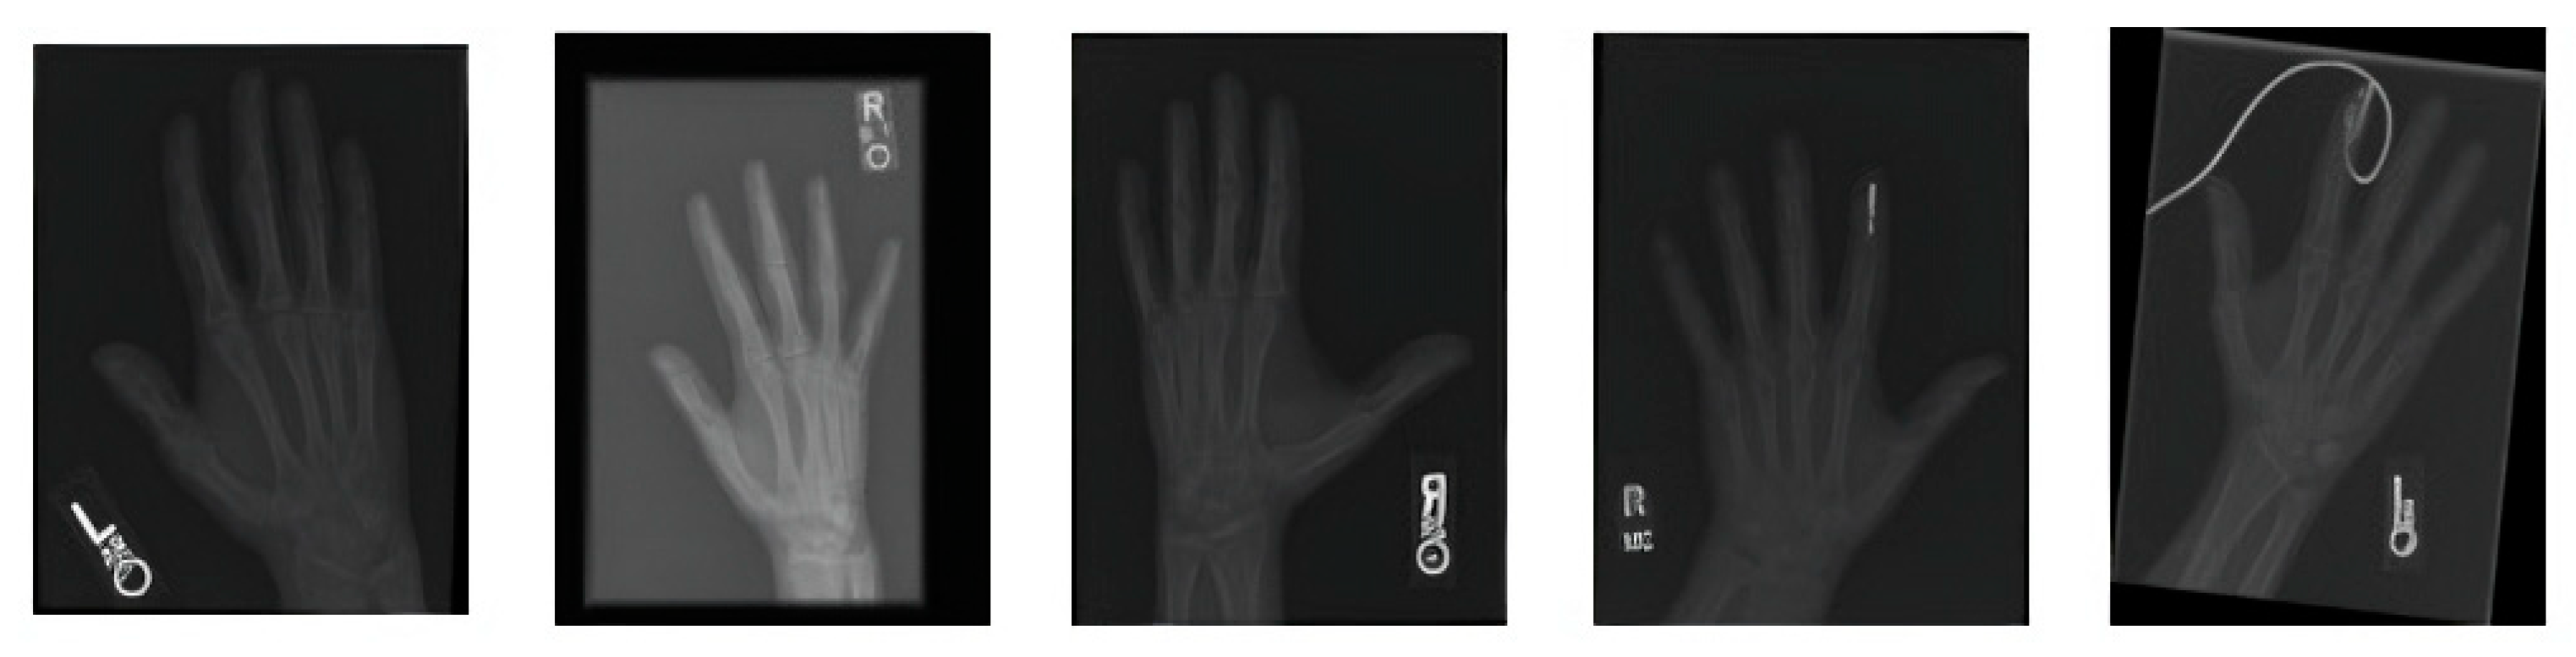
Figure 2 covers the visualization of the mini set of images after transforming it via data augmentation. Image transformations including rotation, scaling, flipping, and brightness modifications have been added to these images to make the training dataset more lively and informative. The artificial images with variety boosted the machine learning models and led to better robustness and generalization ability of these models in case the real-world data varied a lot.
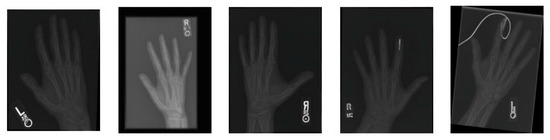
Figure 2.
A sample of images after data augmentation.
Figure 3 shows the segmentation of carpal bones of the wrist by hand X-ray images. The original hand image with its original black structure is the input; then, the application of global thresholding followed to constitute a binary mask. This thresholding technique demonstrated the capability of distinguishing the bone tissue from the background. Then, after all the bones had been segmented, contours were drawn that indicate the borders of the carpal bones. This visual representation enables the doctor to have a better understanding of the internal structures of the wrist.
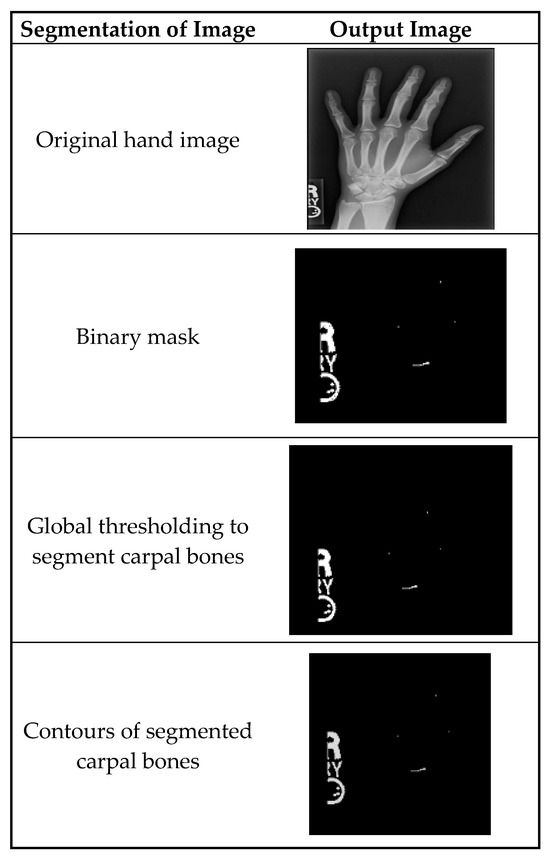
Figure 3.
A sample of images after segmentation of carpal bones.
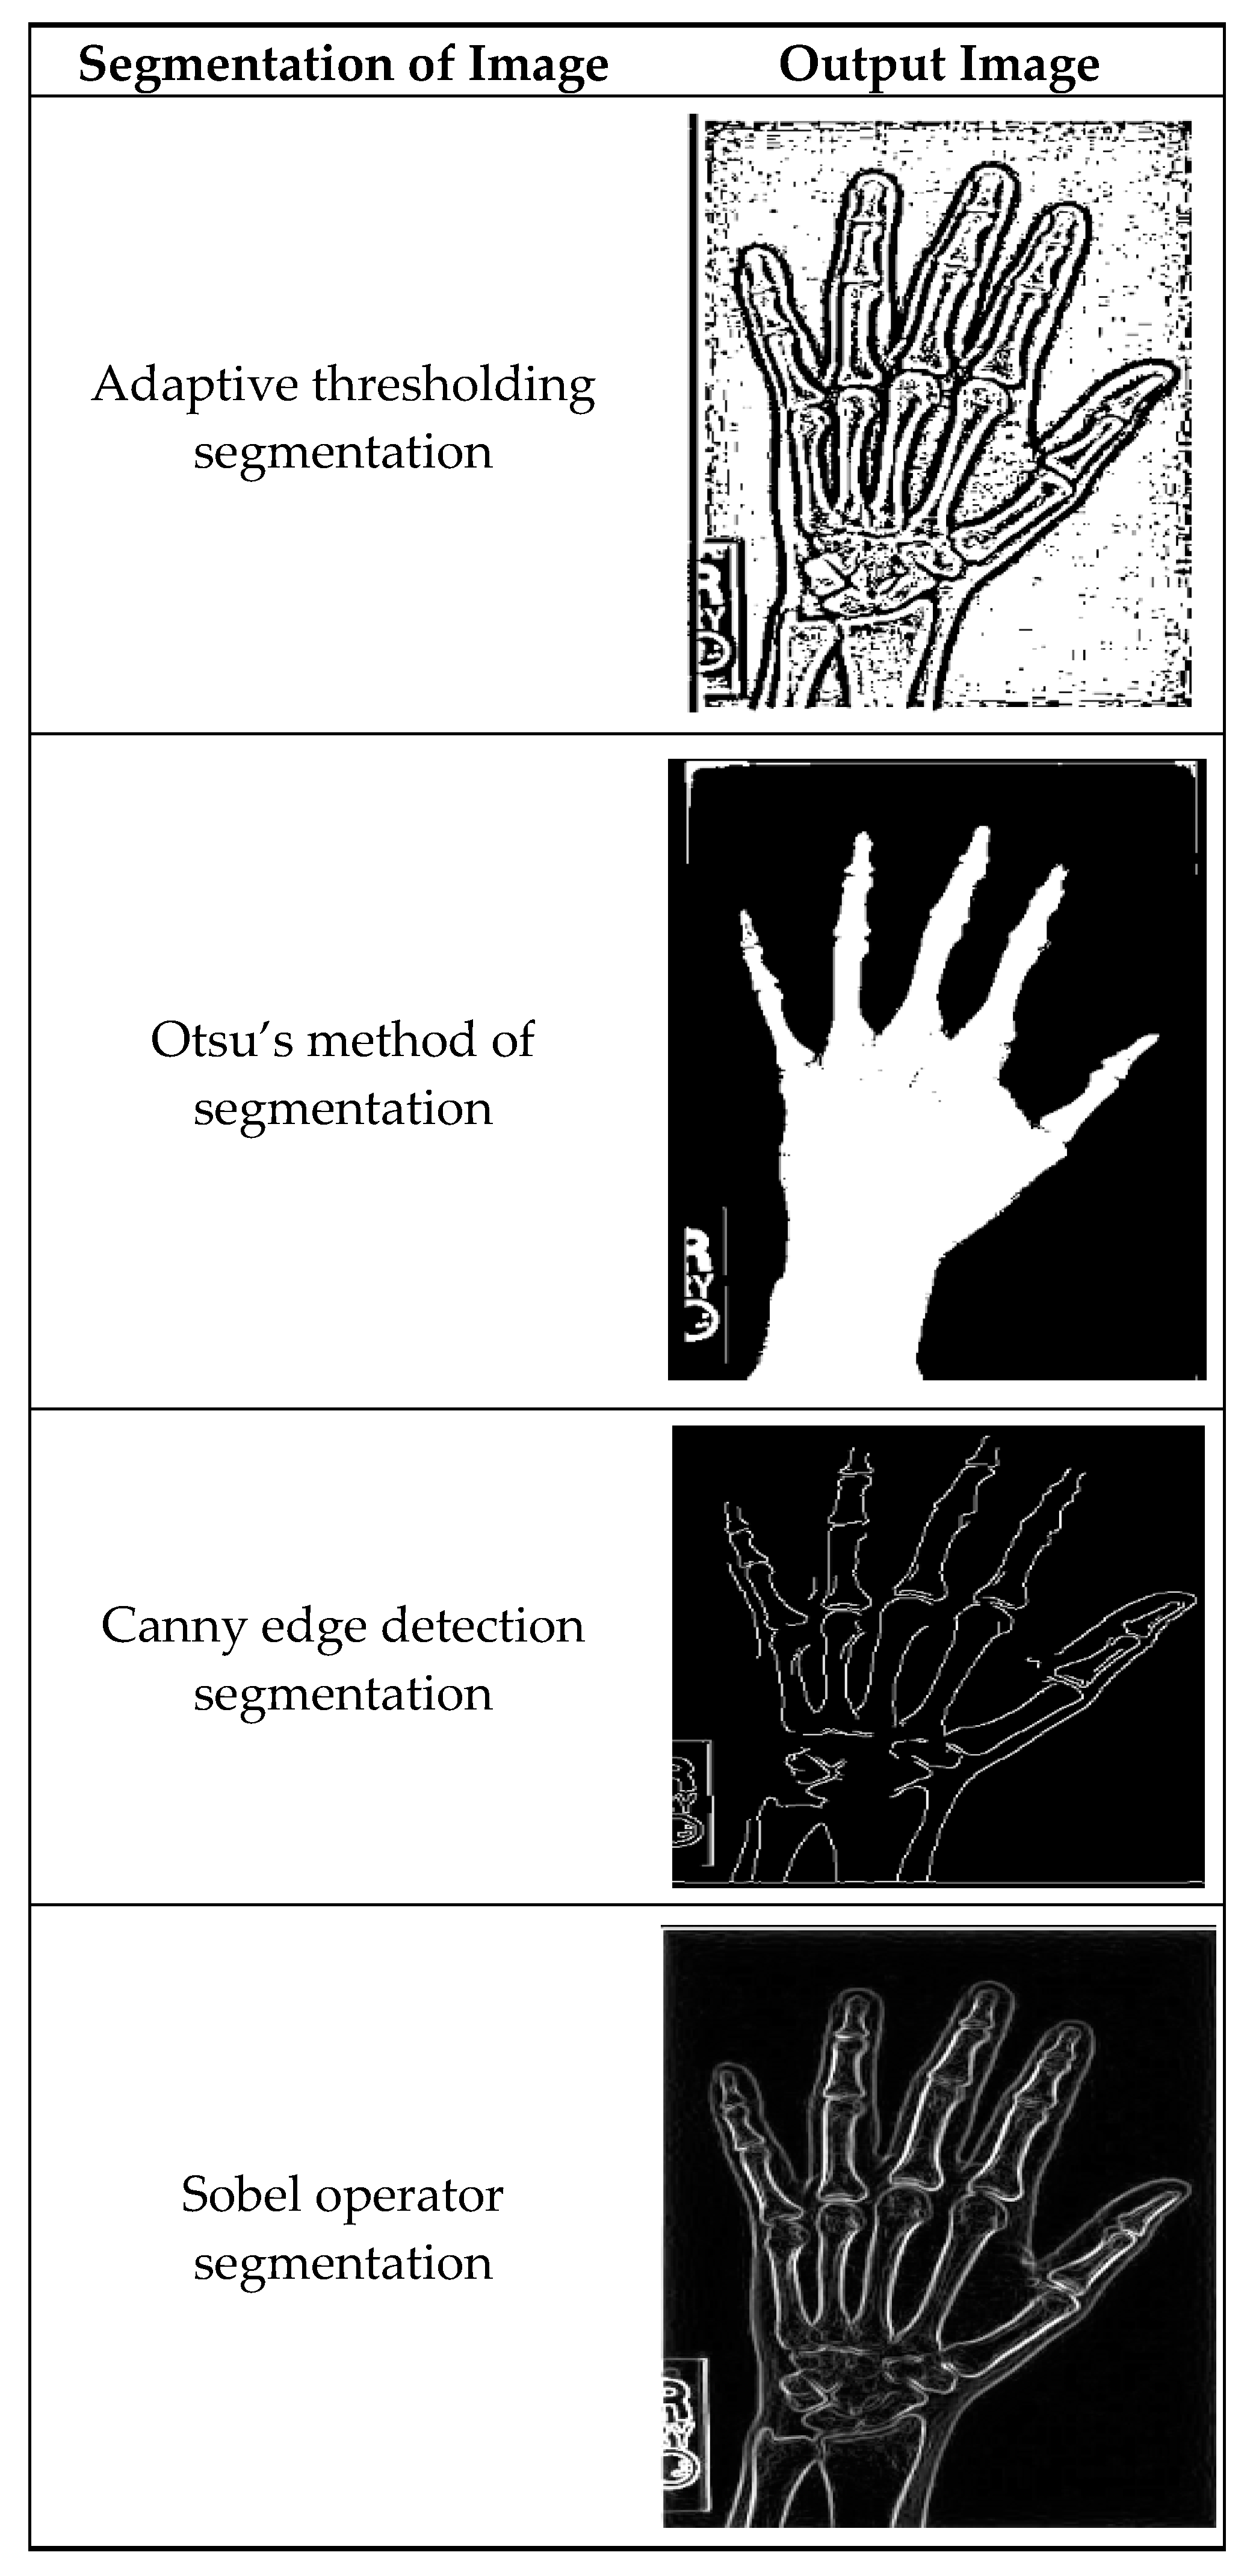
Figure 4 illustrates masking techniques being applied to an input image, and as a consequence, different versions are produced. Local threshold value readjustment by the adaptive method thresholding technique makes it possible to reflect intensity variations along the whole image. Otsu’s approach is basically a global threshold method that optimizes intra-class variances, making the separation of foreground and background as accurate as possible. The efficient Canny edge detection method establishes edges that are detected by gradient magnitude and angle; thus, the precise edges of objects are portrayed in the image. Sobel operator segregation also advances edges by simply converting the image with Sobel kernels so as to stress the shifts in intensity.

Figure 4.
A sample of segmented images using existing methods.
Figure 5 shows a pair of two tissues after image segmentation: One is normal tissue and the other is inflamed tissue. In the normal image, the segmentation process successfully assigns the carpal bones with distinct and smooth boundaries and little to no noise. While the normal picture shows well-defined borders and undisrupted areas, the inflamed image presents irregularities and deformations in delineated regions, signaling the presence of the disease, which shapes and modulates the bone structure.
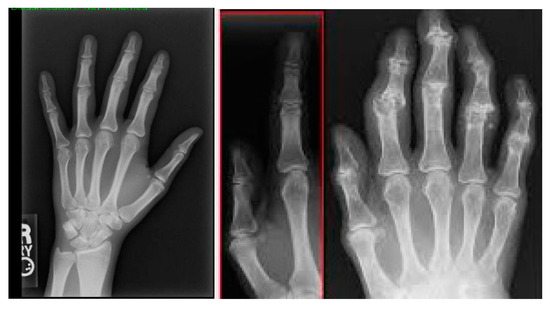
Figure 5.
Normal and inflamed images after segmentation.
Table 2 represents the features based on line contour analysis of hand radiograph images. Every outline is precisely measured for the area, perimeter, circularity, and aspect ratio. Its area was 0 square units with a perimeter of 2.0 units, which resulted in zero degrees of circularity in its production, which is represented by a circularity value of 0.
Table 2.
Features extracted from the contour analysis.
Table 3 displays the texture analysis of different hand radiographs with the aid of the GLCM (Gray-Level Co-occurrence Matrix) method. The actual numbers represent a combination of range, dominance (84), contrast (51.878), energy (0.263), and homogeneity (0.728). The categorizing parameter is the mean (0.82); the contrast is energy (0.096), homogeneity (0.25), and correlation (0.95). These texture parameters help to assess the spatial spread of pixel intensities within the images. As the values become higher, the images are said to have higher contrast, energy, homogeneity, and correlation, respectively. These features form the texture attributes of these images, which are imperative ingredients for the differentiation of pathological entities from the normal tissues and provide a path for correct diagnosis, especially in a medical condition like rheumatoid arthritis.
Table 3.
Texture analysis of different hand radiographs.
Table 4 displays the effectiveness of hybrid segmentation carried out with various classification methods. Every model is assessed according to the number of TN, FP, FN, and TP. For example, ResNet101V2 obtained an outcome of 50 TN, 10 FP, 5 FN, and 55 TP when applied. On the other hand, DenseNet201 gave rise to 52 TN, 8 FP, 3 FN, and 57 TP. Consequently, InceptionResNetV2 recorded 45 TN, 15 FP, 3 FN, and 57 TP. RANet yielded 46 TN, 14 FP, 7 FN, and 53 TP, while RANet had 60 TN, 12 FP, 8 FN, and 43 TP.
Table 4.
Performance of hybrid segmentation with different classification models.
Table 5 provides a comprehensive analysis of the classification models, including their accuracy, loss, precision, and recall metrics. ResNet101V2 exhibited an accuracy of 0.8333, with a loss of 0.1667, precision of 0.8462, and recall of 0.9167. InceptionResNetV2 achieved an accuracy of 0.8194, with a loss of 0.1806, precision of 0.7917, and recall of 0.9500. DenseNet201 demonstrated an accuracy of 0.8889, with a loss of 0.1111, precision of 0.8767, and recall of 0.9500. RANet showed an accuracy of 0.8056, with a loss of 0.1944, precision of 0.7917, and recall of 0.8837.
Table 5.
Performance analysis of classification models.
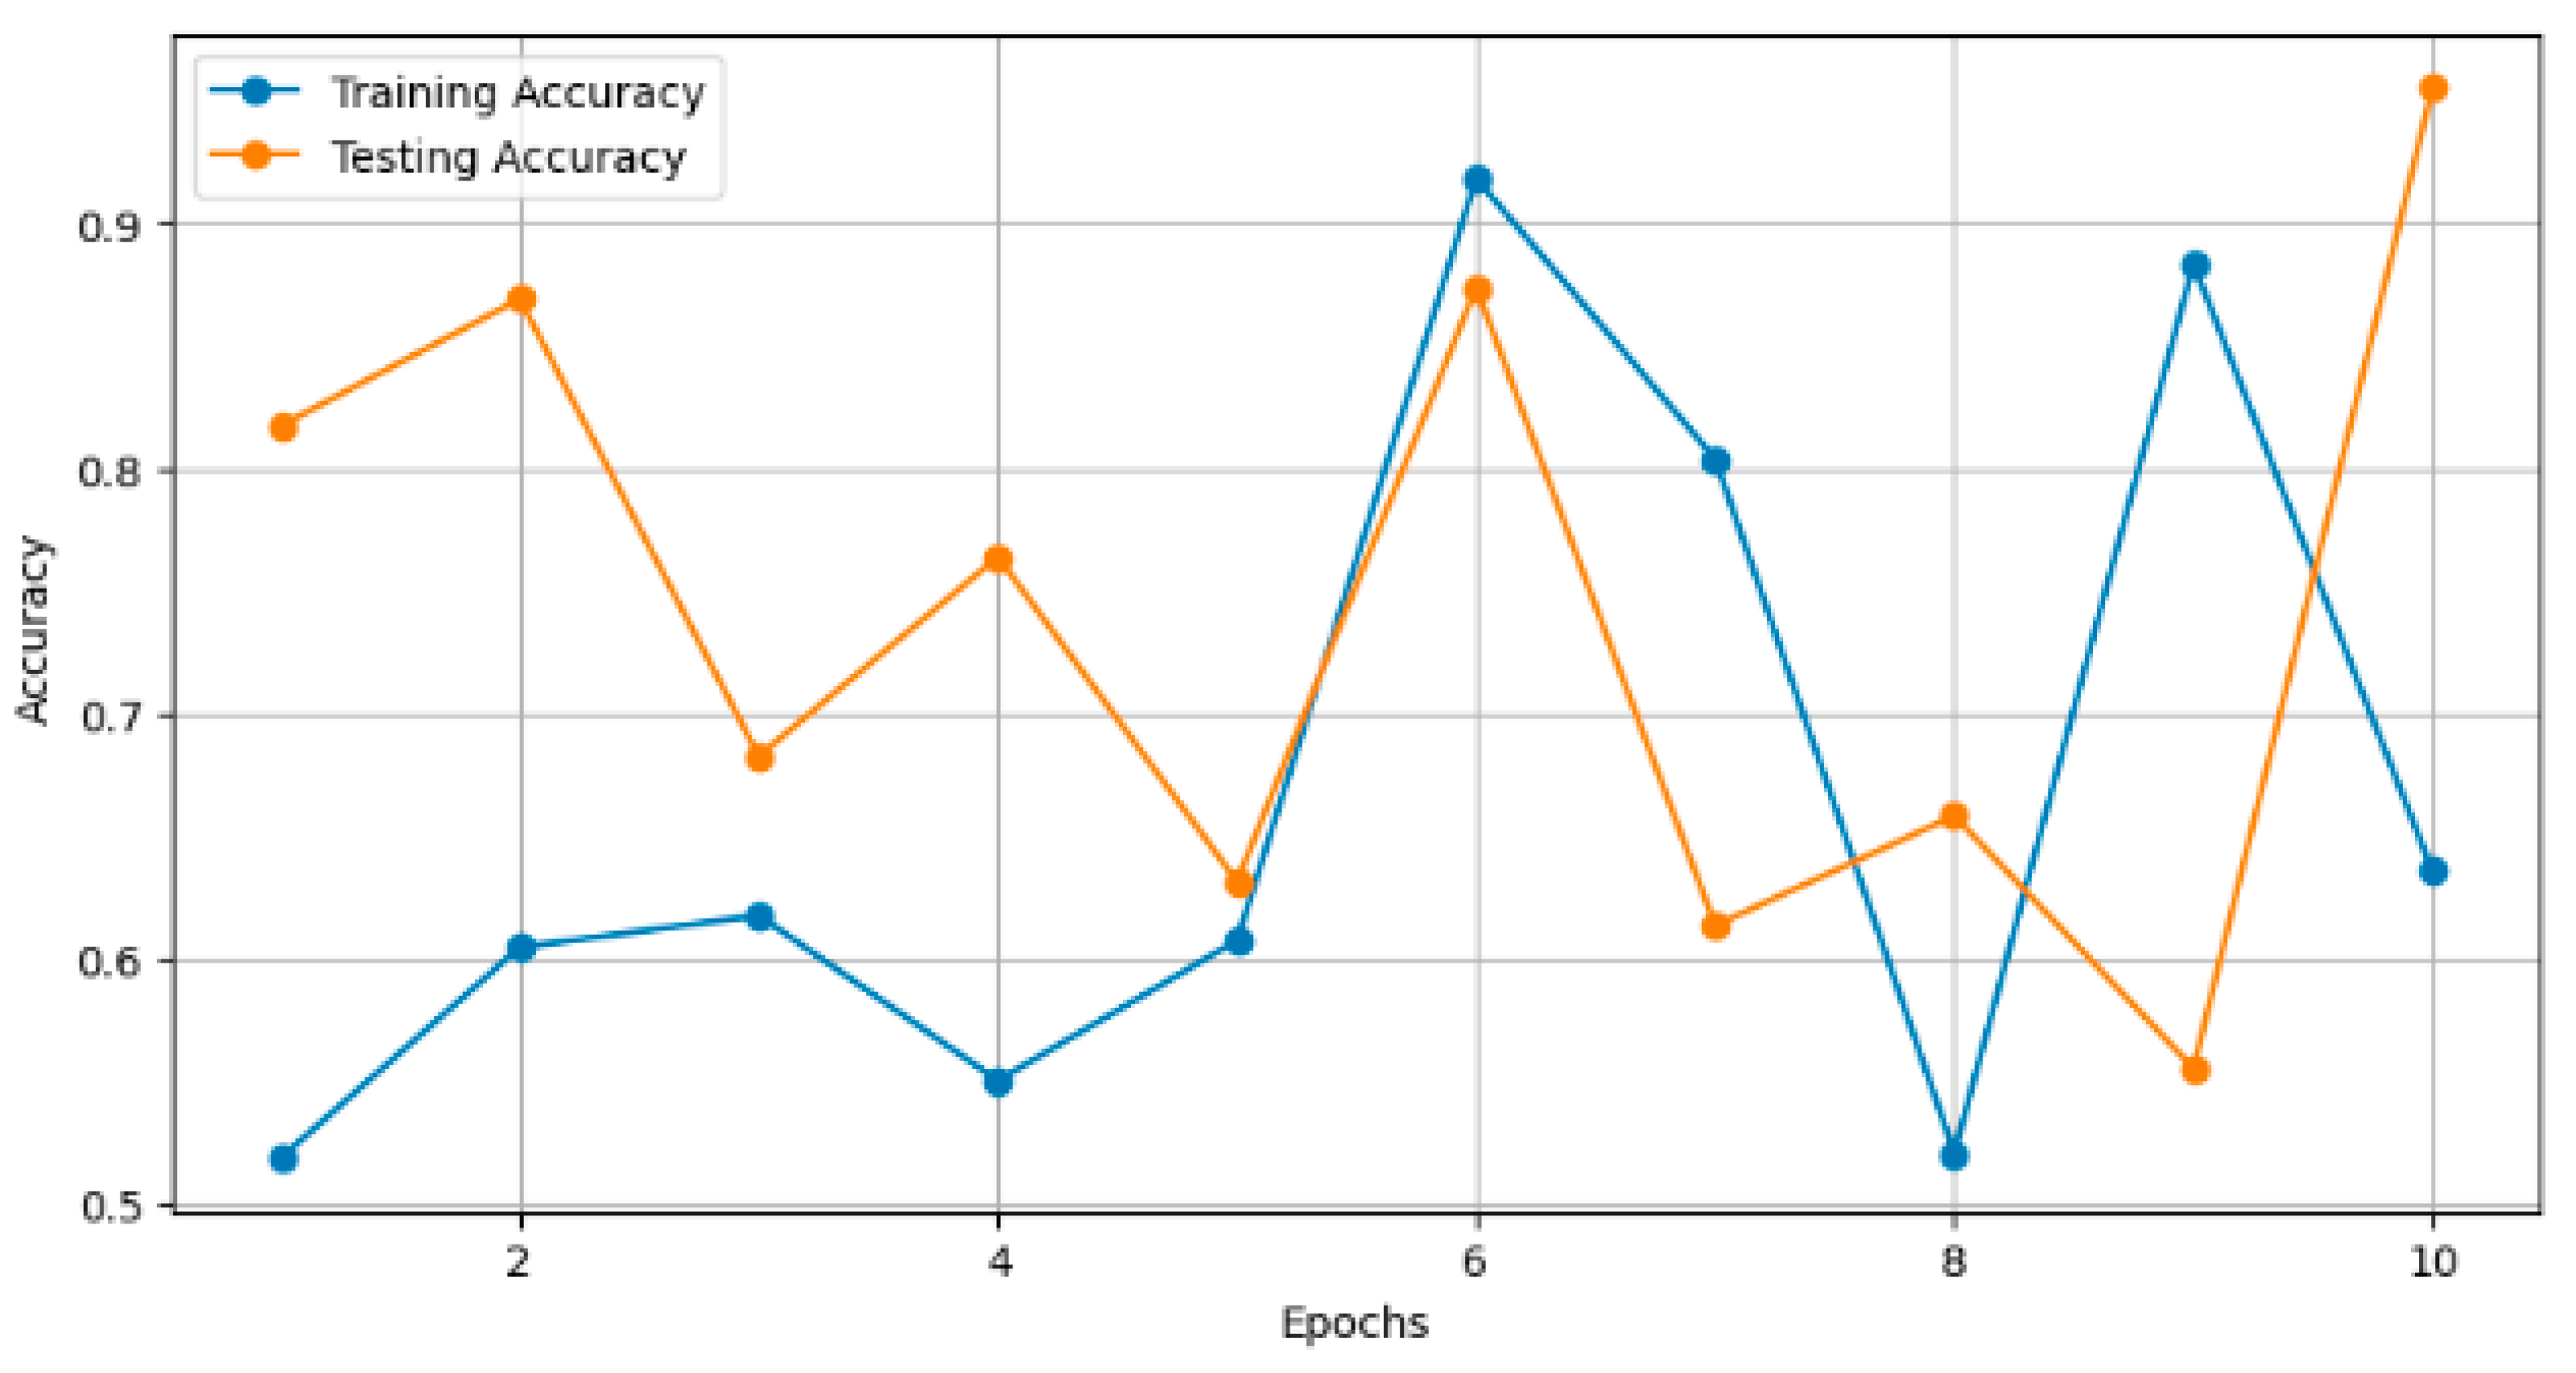
In Figure 6, the plot illustrates the training and testing accuracy of the classification models over different epochs. Each point on the curve represents the accuracy achieved by the model on the training and testing datasets at a specific epoch. For instance, ResNet101V2 achieved a training accuracy of 0.90 and a testing accuracy of 0.85 after 10 epochs, with both accuracies gradually increasing with further epochs.
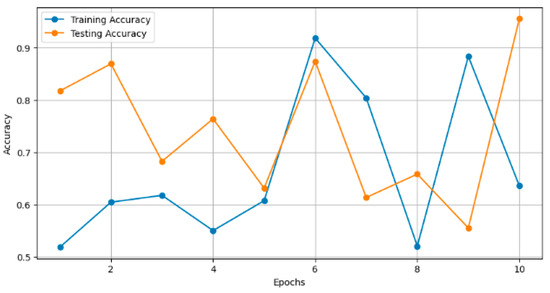
Figure 6.
Training and testing accuracy over epochs.
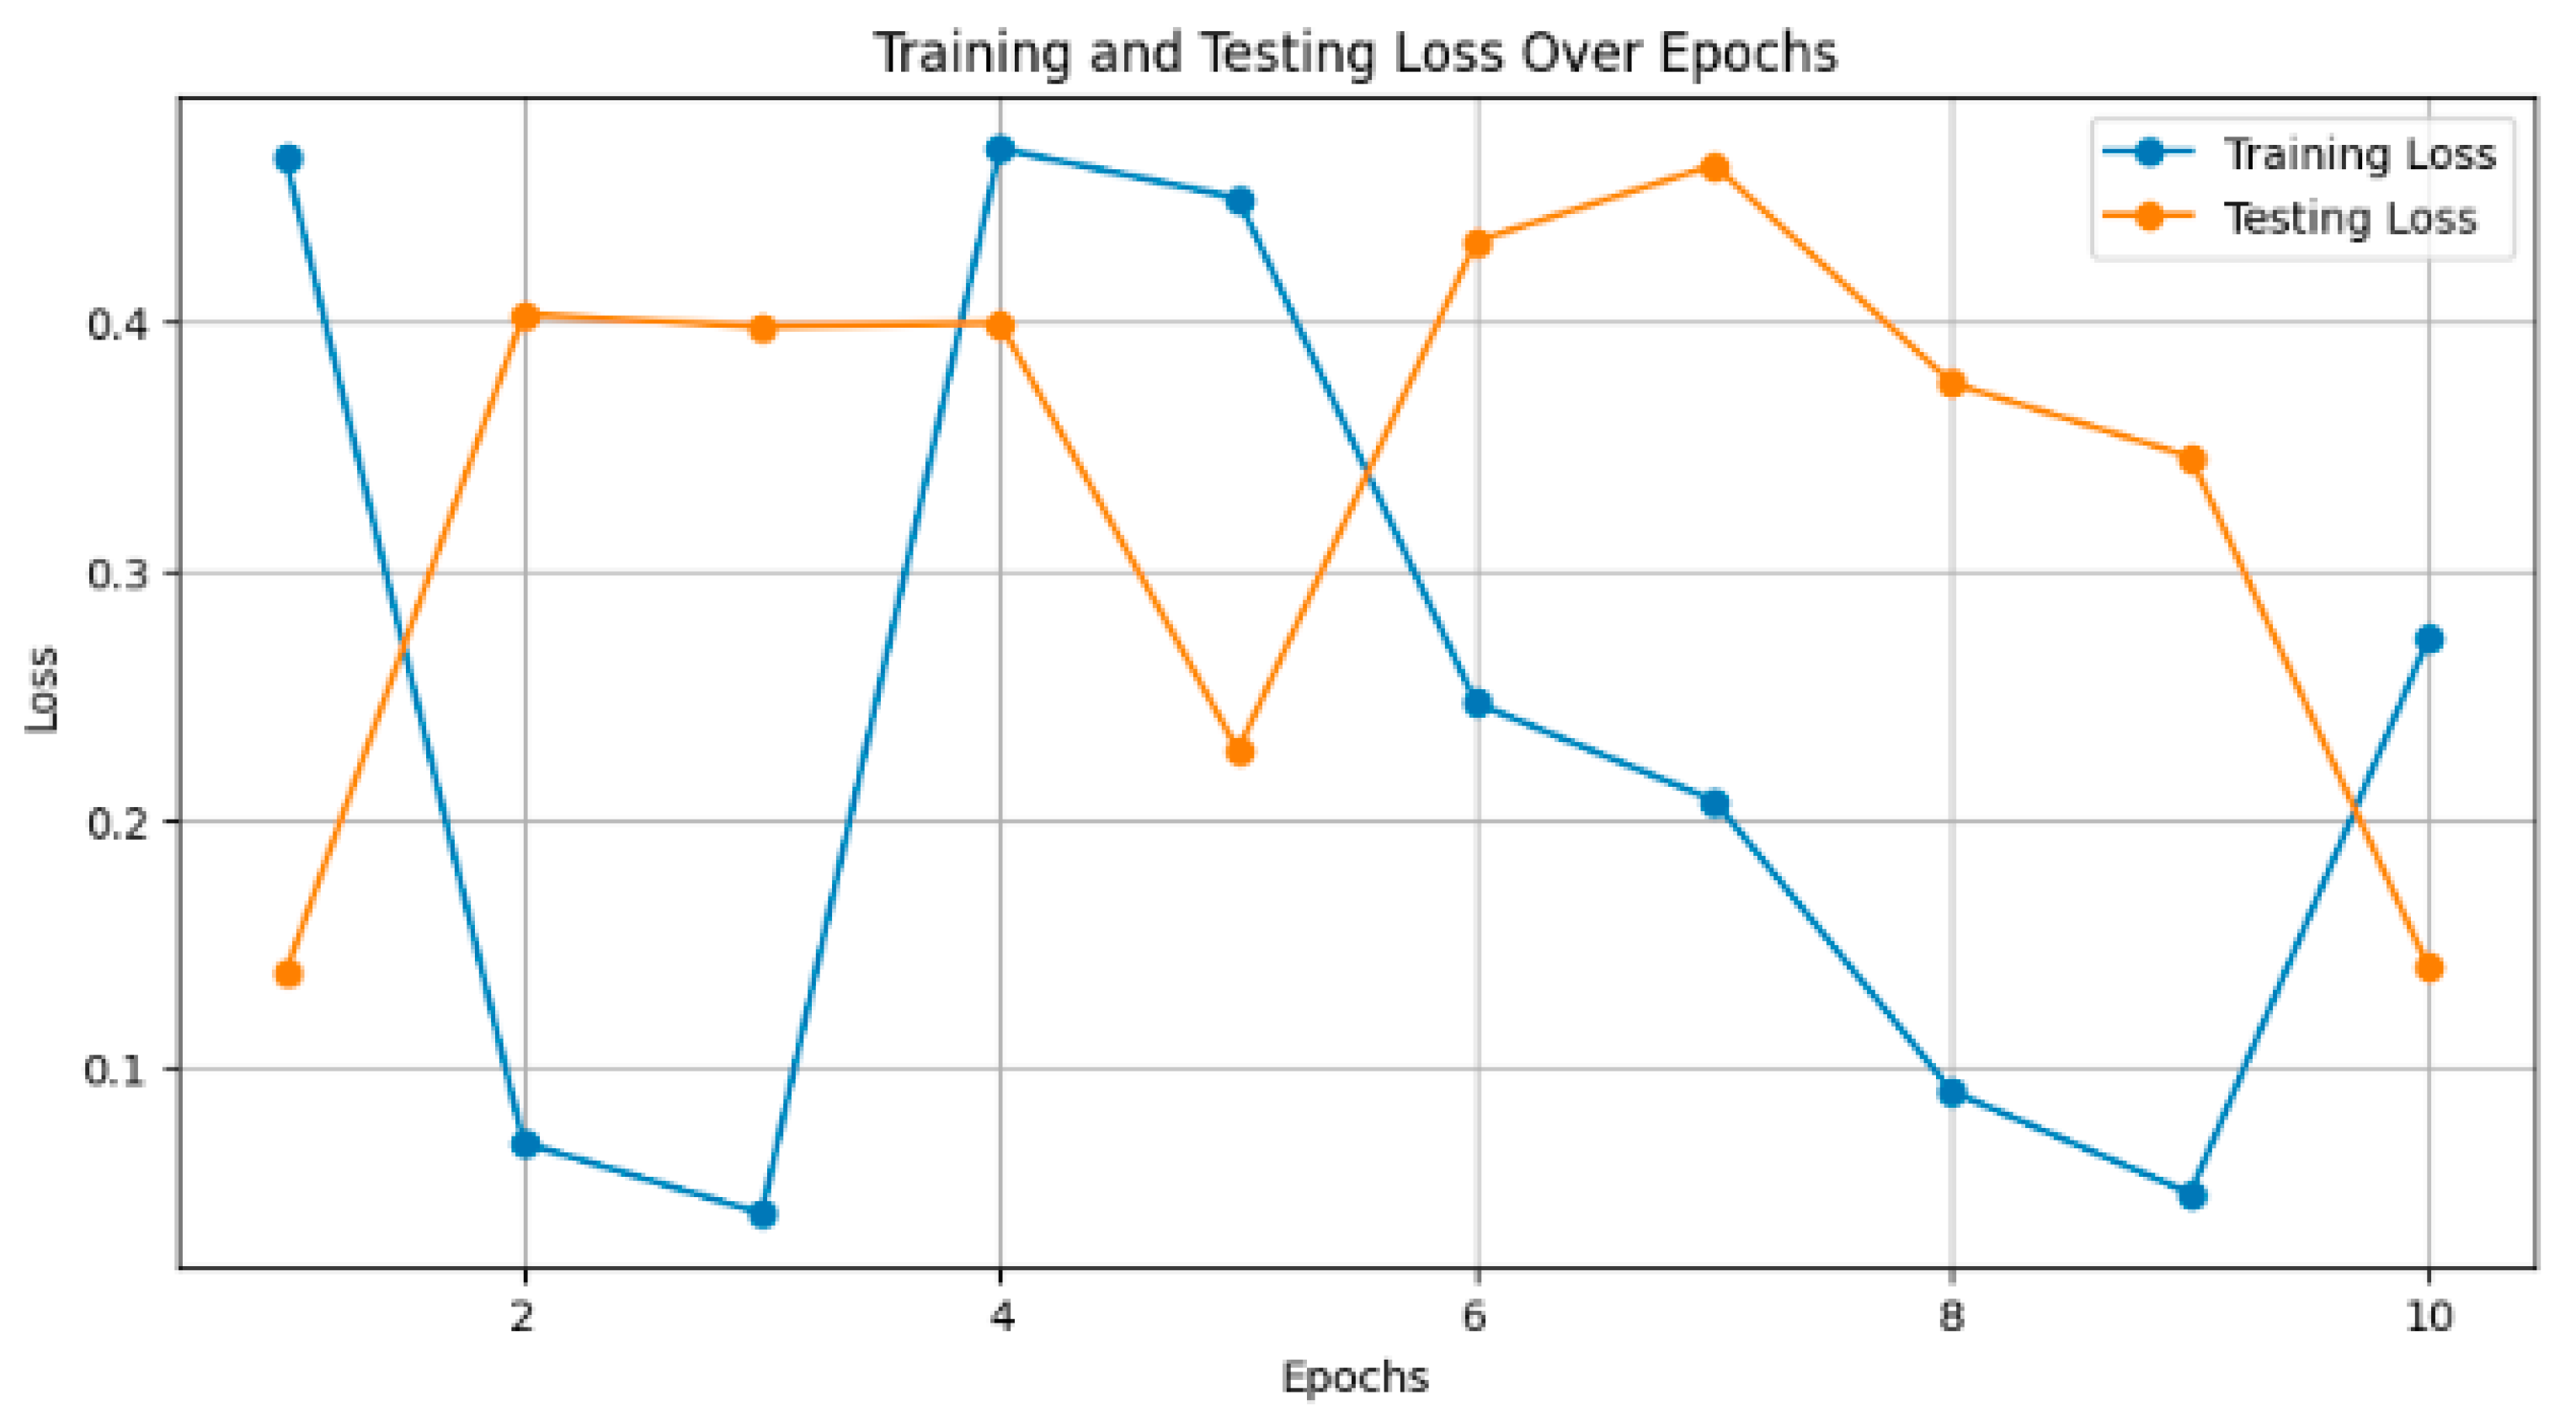
Figure 7 depicts the training and testing loss of the models over epochs. Smaller values are considered to be better, as the model reduces its error. For instance, InceptionResNetV2 decreased the training loss to 0.15 and had a consequent test loss of 0.20 after 10 epochs. The loss decreased steadily, and the smaller it became, the more training was carried out.
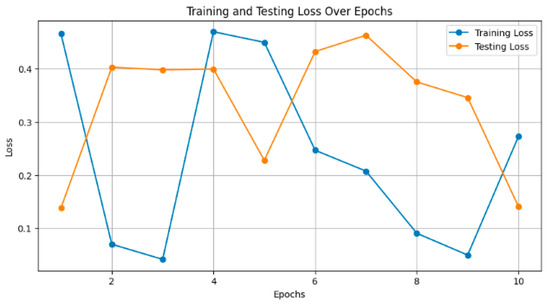
Figure 7.
Training and testing loss over epochs.
Table 6 shows how various data augmentation techniques, such as rotation, scaling, flipping, and brightness changes, increase the size of the dataset by large values ranging from 10% to 70%, resulting in a model accuracy increase of between 2% and 10%. The joint application of all techniques notably led to the biggest increase in dataset size and peak accuracy improvement. Segmentation techniques revealed an overview of the performance, as shown in Table 7. The results obtained show that adaptive thresholding had the highest precision, at 0.85; a recall of 0.80; an F1-score of 0.82; and a Jaccard Index of 0.72. Therefore, compared with classes such as global thresholding, Otsu’s method, Canny edge detection, and the Sobel operator, this technique of adaptive thresholding is more effective in the proper segmentation of carpal bones from a hand X-ray image.
Table 6.
Summary of augmentation effects.
Table 7.
Performance metrics of segmentation techniques.
Table 8 presents the performance metrics of four classification models (ResNet101V2, InceptionResNetV2, DenseNet201, and RANet) across three different batch sizes: 16, 32, and 64. The trend for every model is that increasing the batch size will generally improve the accuracy, reduce the loss, increase precision, and improve recall. For instance, the model DenseNet201 had clear performance gains with increasing batch size to a batch size of 64, reaching an accuracy of 0.9000, a loss of 0.1000, a precision of 0.8850, and a recall of 0.9600 against lower metrics when the batch size was 16.
Table 8.
Performance analysis of classification models for different batch sizes.
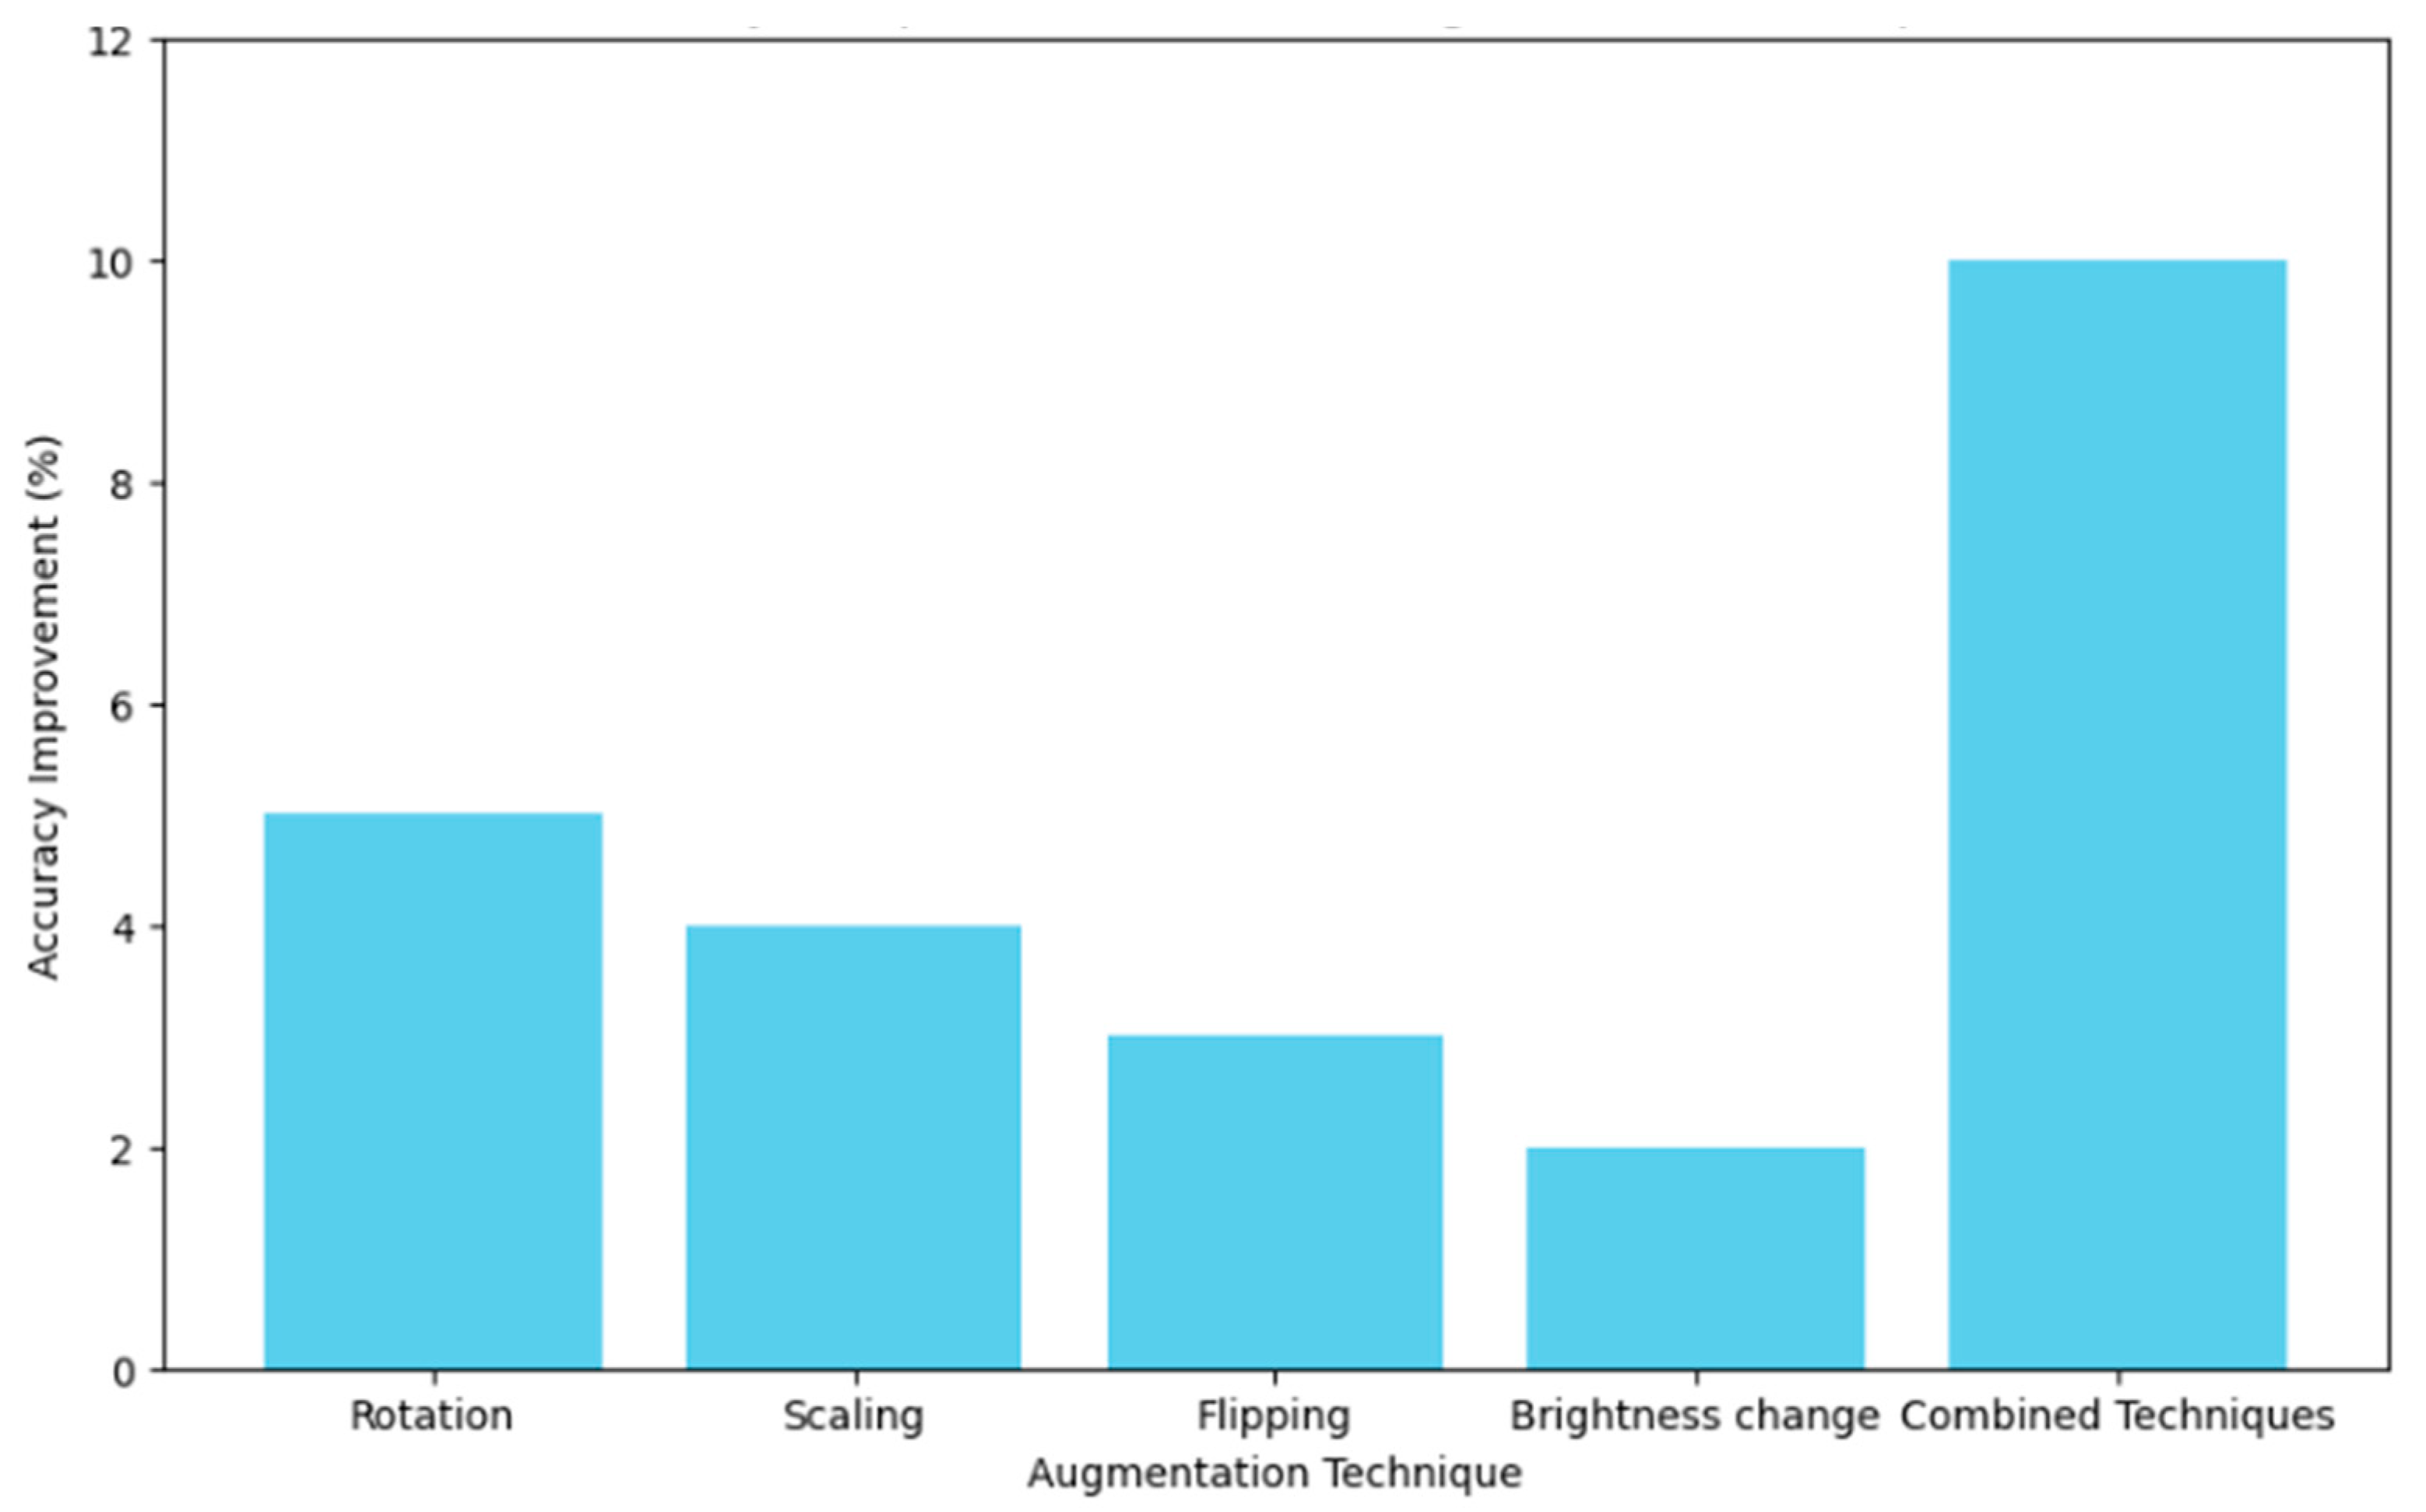
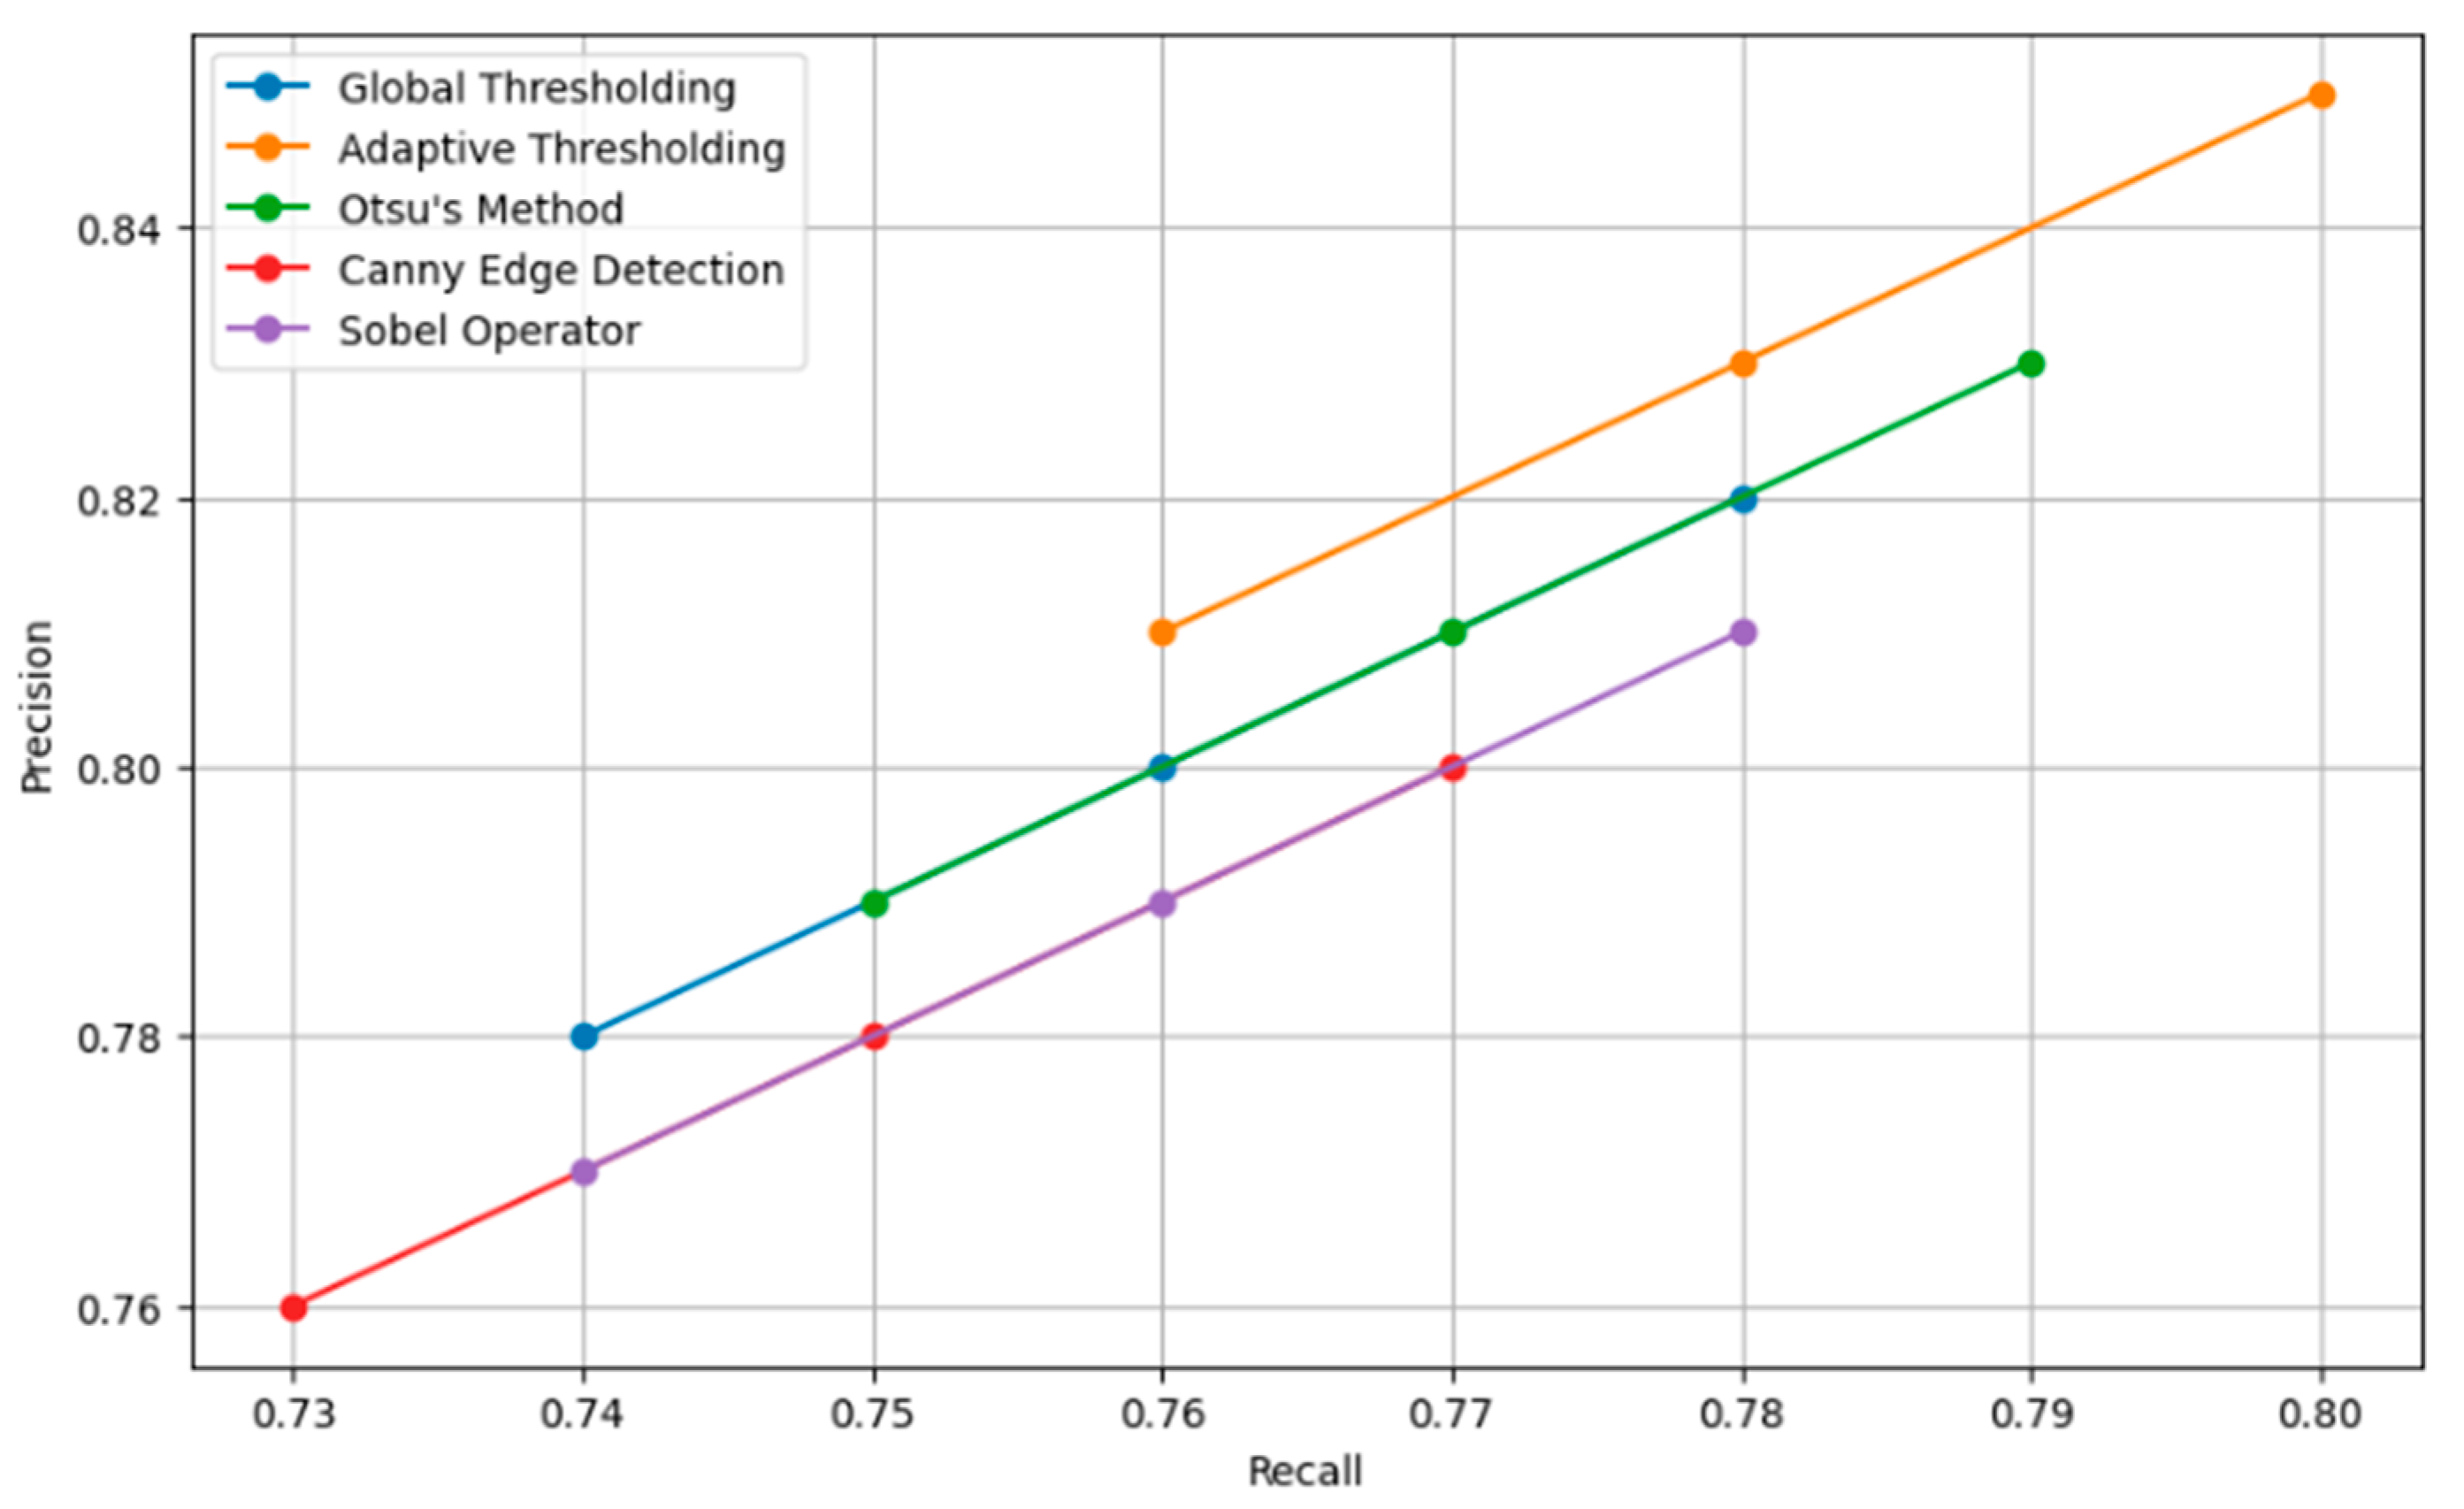
Figure 8 presents a comparison of the effect of various augmentation techniques on model accuracy. Each technique is reviewed in relation to how best it contributes to obtaining a model with higher accuracy. The graph helps illustrate how efficient combined techniques are in bringing extremely high accuracy compared to the same by just individual augmentations. Figure 9 shows the different relationships that could be developed between precision and recall for different segmentation techniques, whether it be global thresholding, adaptive thresholding, Otsu’s method, Canny edge detection, or even the Sobel operator. High precision means few false positives, while high recall refers to few false negatives. It allows these techniques to be set into comparative analysis due to their ability to correctly segment carpal bone tissues in hand X-ray images, which further guides the choice of the most adequate method for exact medical image analysis.

Figure 8.
Accuracy comparison of different augmentation techniques.

Figure 9.
Precision recall curve for segmentation techniques.
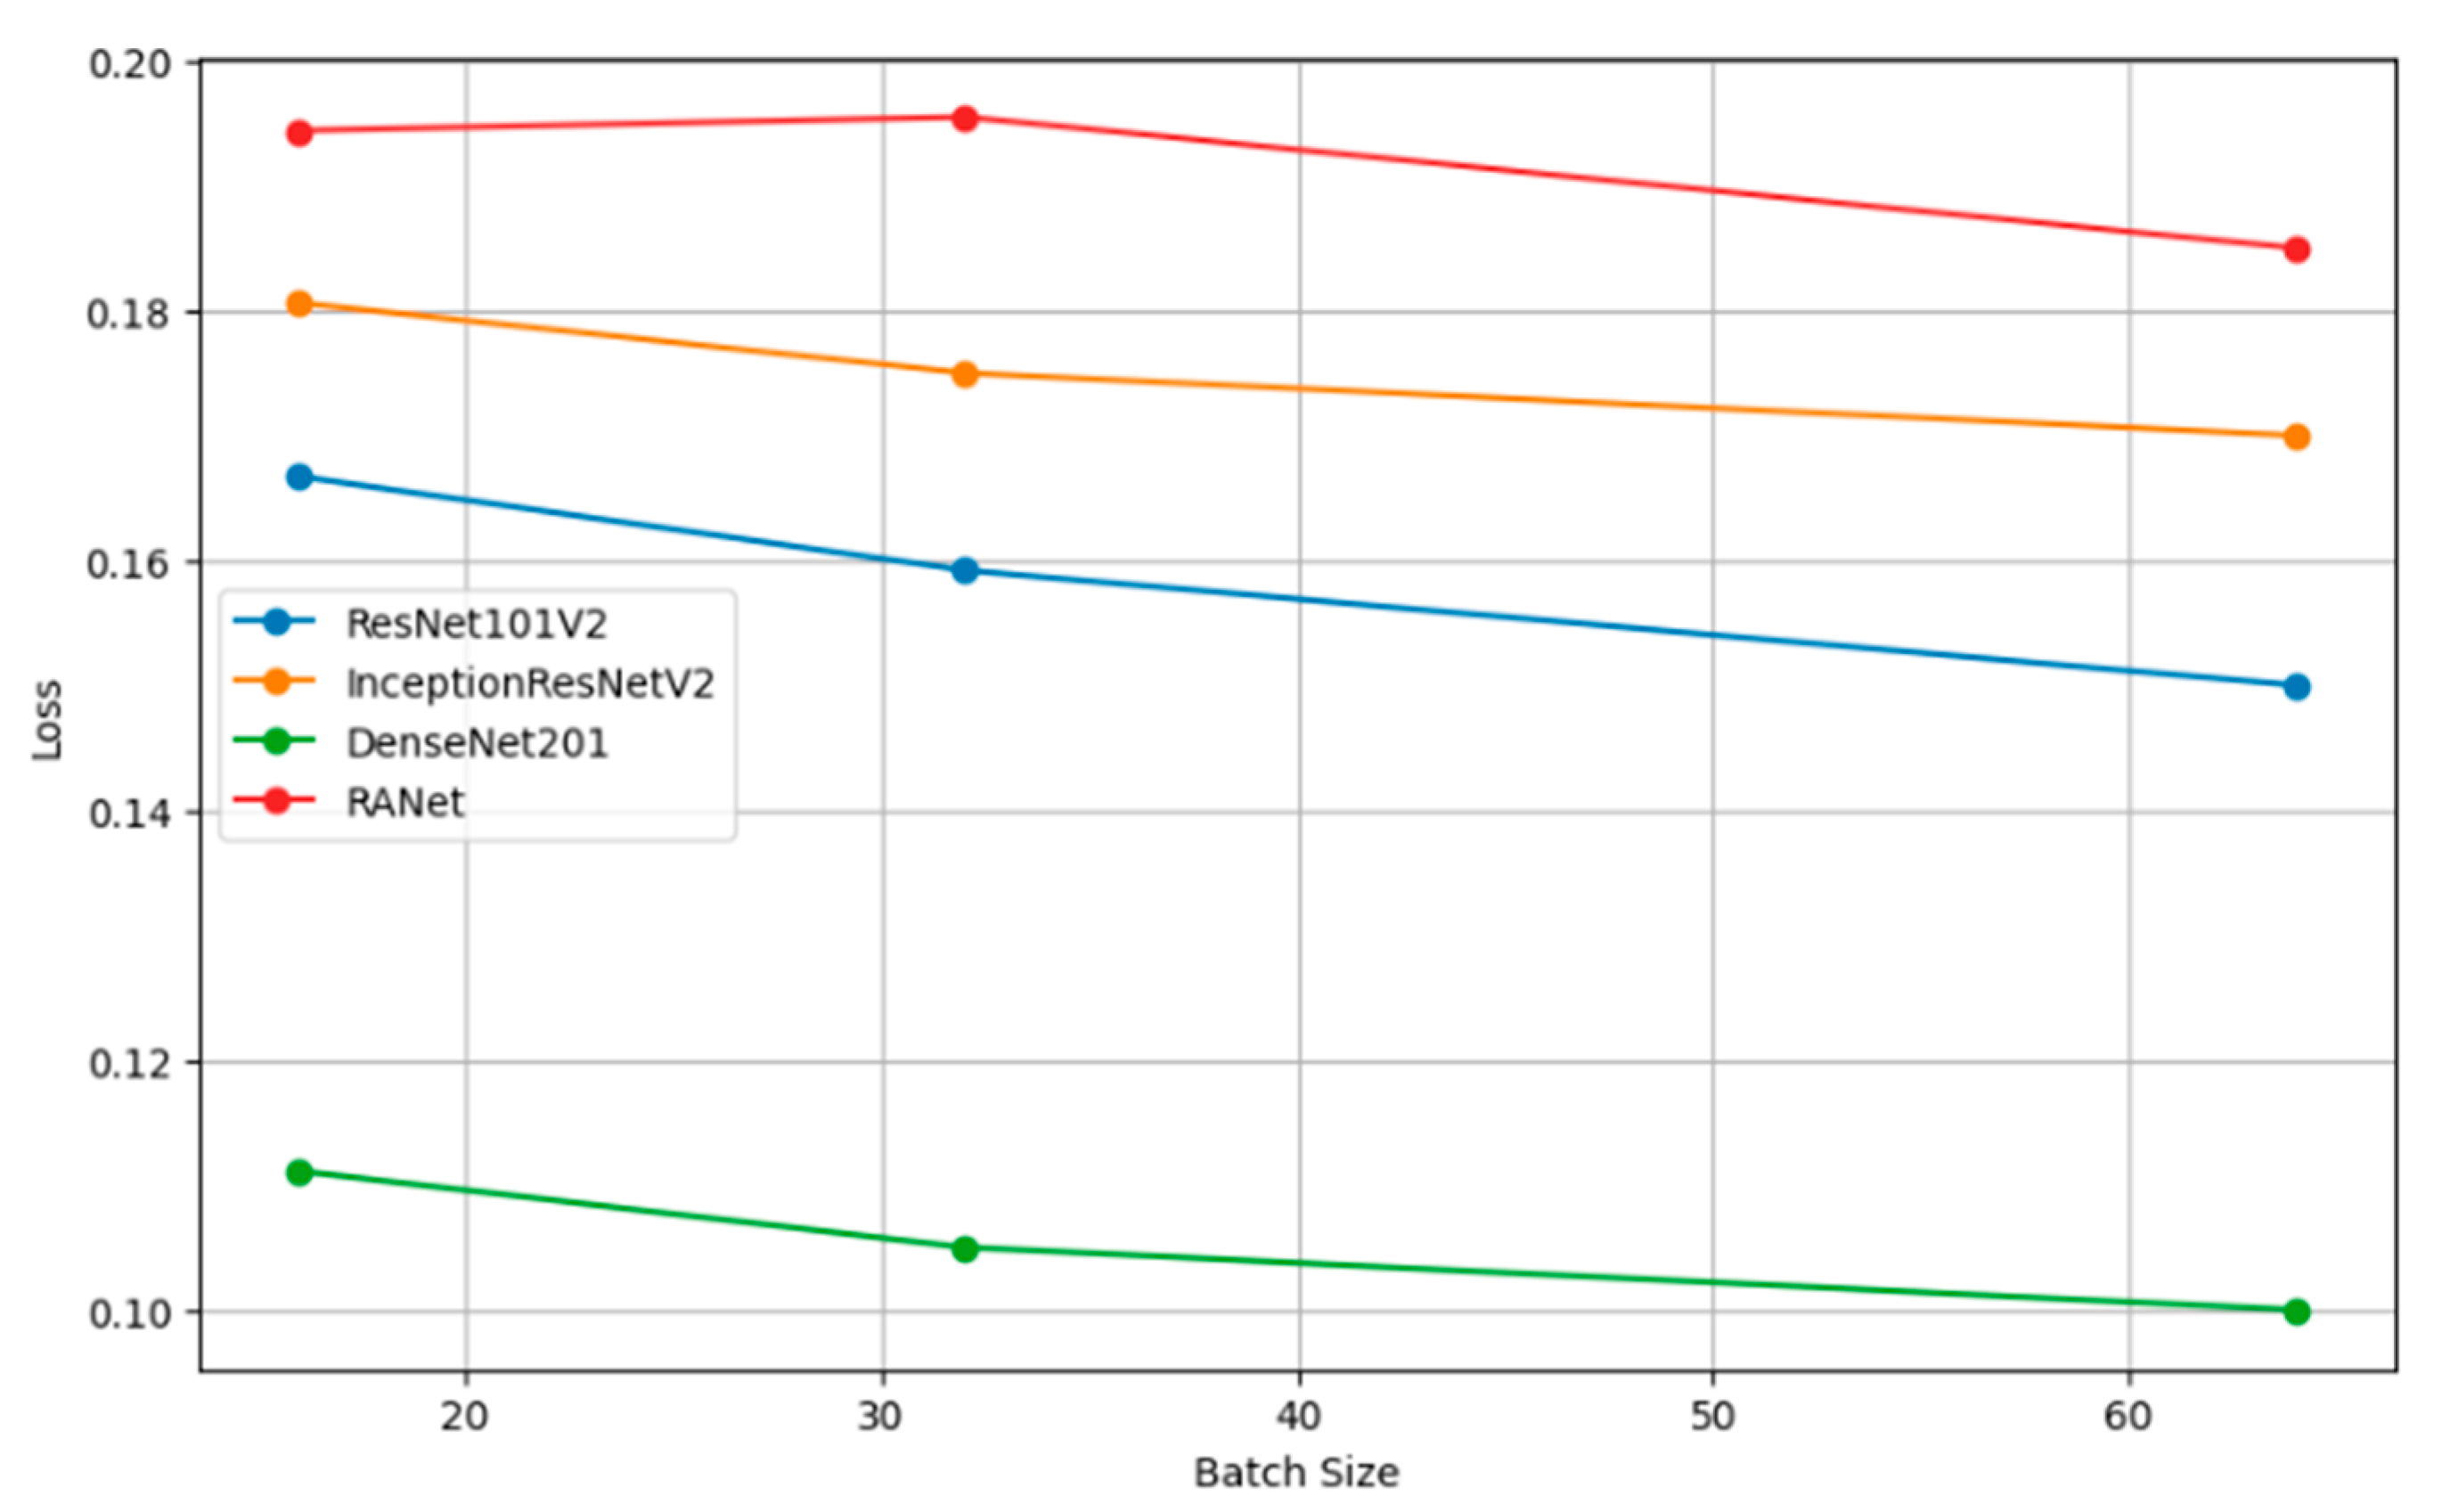
Figure 10 shows the plots of the model accuracy with different batch sizes: 16, 32, and 64. As a rule, by increasing the batch size, the model accuracy can be improved. Since the estimation of the gradient will improve with increasing batch size, there will be smoother convergence in the course of training. The trend in several models of larger batches clearly leads to better performance metrics, helping one choose a batch size that is close to optimal with efficient model training. Figure 11 shows how the batch size affects model loss. Lower loss values imply good model performance since it commits very few prediction errors. The adjustments in batch size are portrayed relative to their impacts on the loss in ResNet101V2, InceptionResNetV2, DenseNet201, and RANet models. This example illustrates that the batch size needs to be tuned to minimize the loss and improve general model efficiency during the training and validation stage.
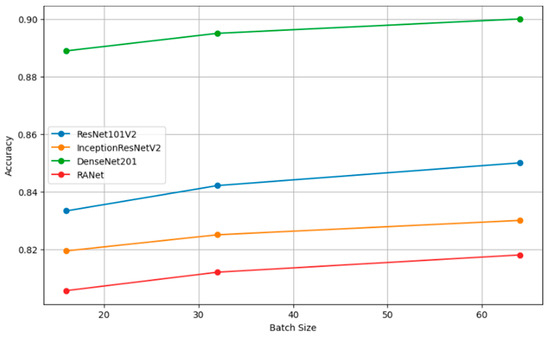
Figure 10.
Accuracy vs. batch size.
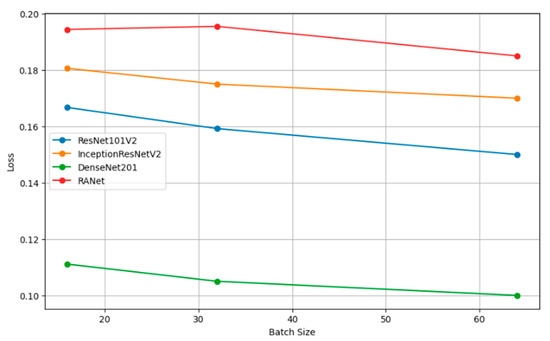
Figure 11.
Loss vs. batch size.
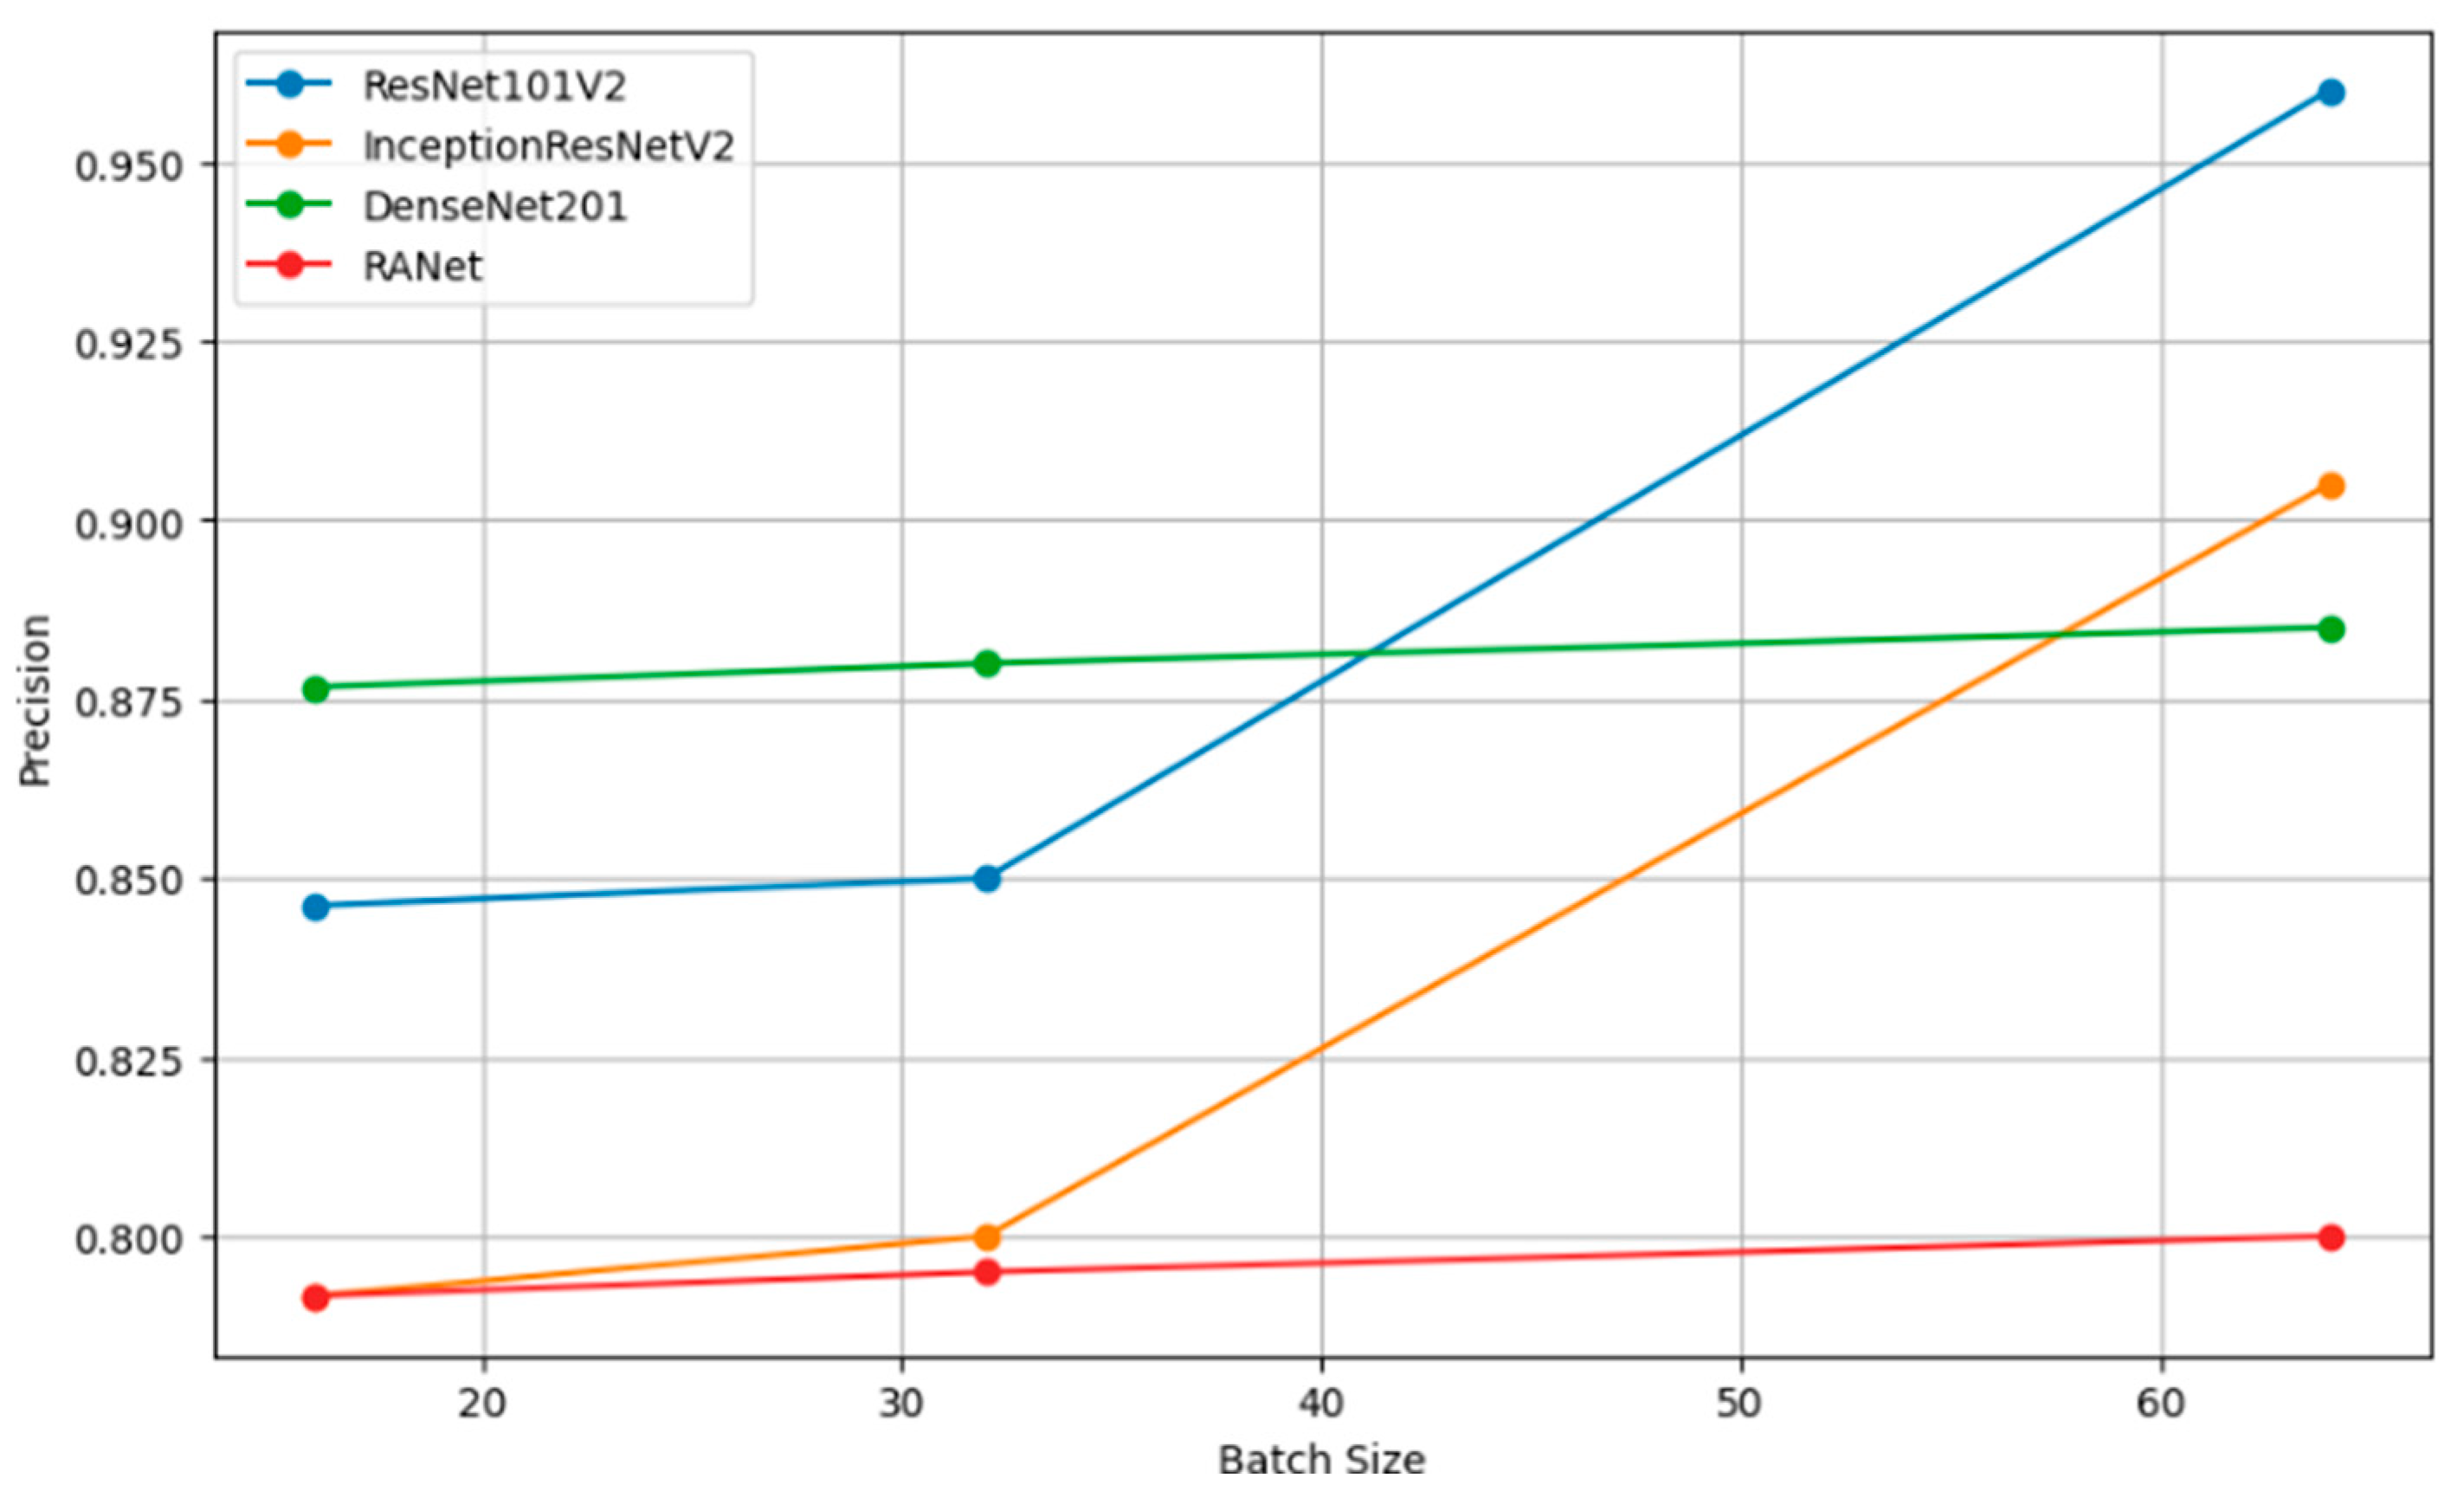
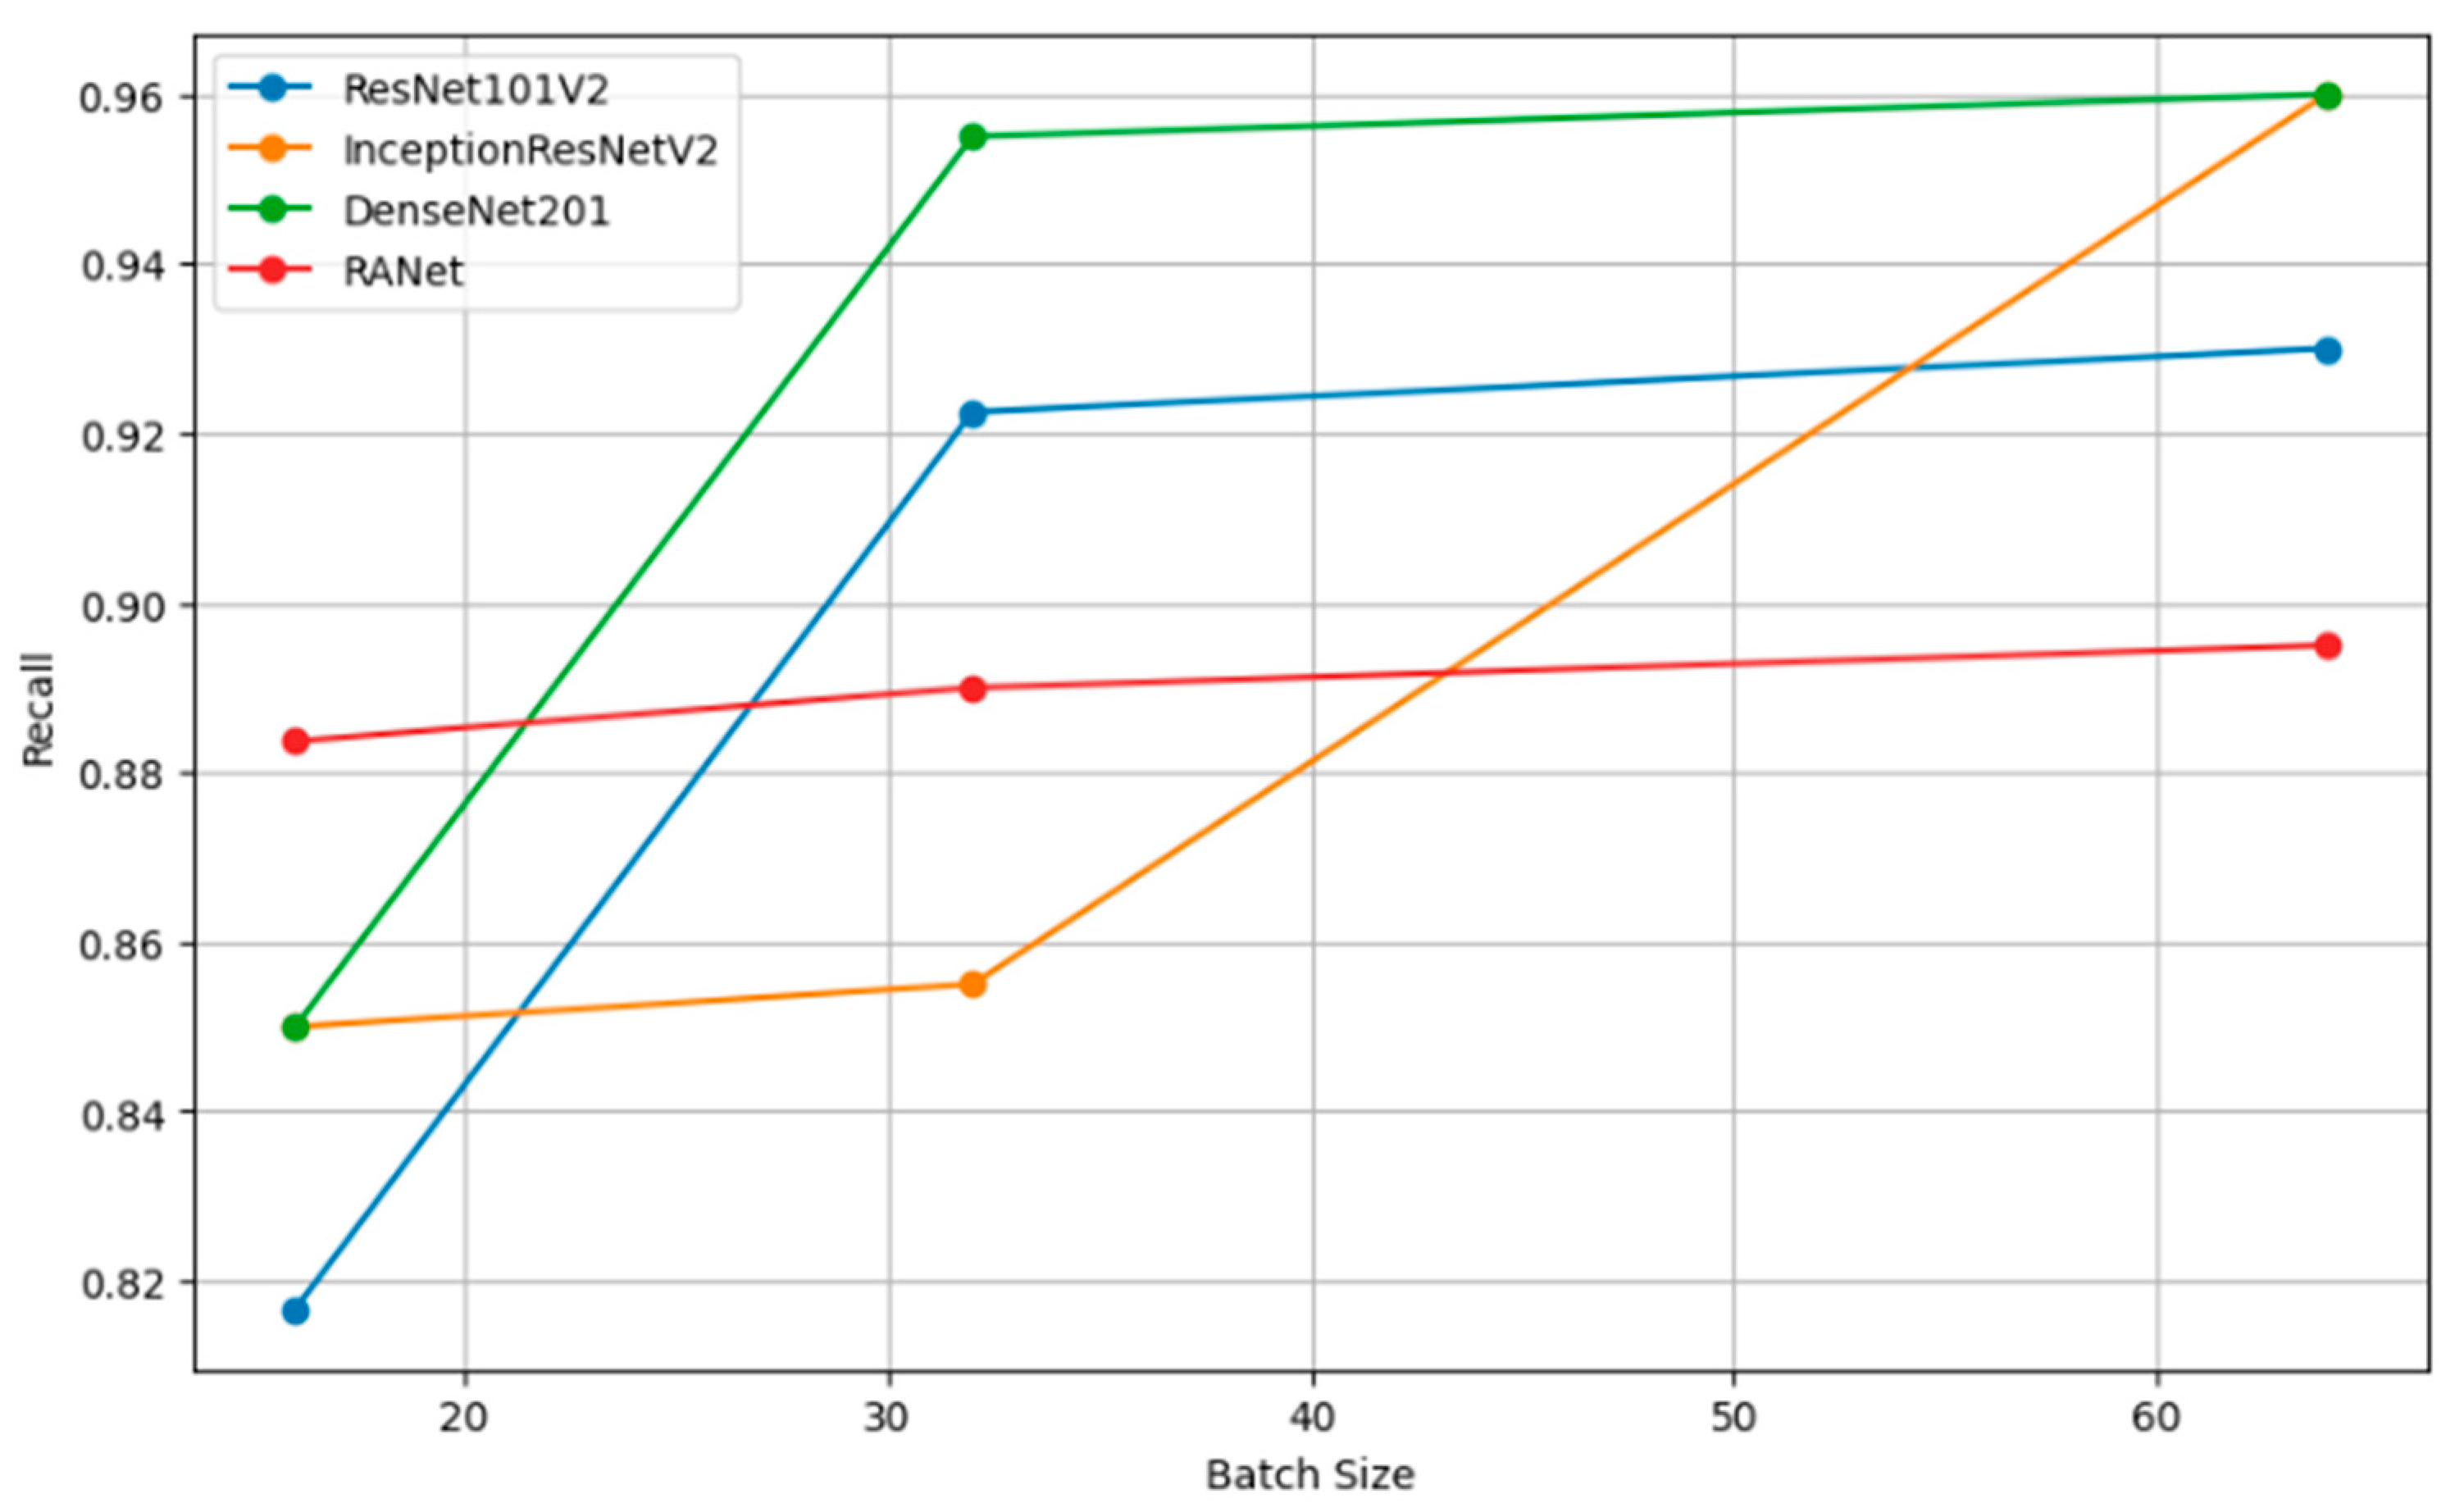
Figure 12 shows how precision, measuring the accuracy of the positive predictions, changes for different batch sizes—16, 32, and 64—for a variety of classification models. In simple terms, the rule can be restated as such: The larger the amount, or batch size, the better the precision, as the statistical representation will consequently be better and will hence accord more accurate positive instance predictions. Figure 13 shows the relation of recall, a measure of completeness of positive predictions, vs. batch size across all the models. Bigger recall values would signify that in this scenario, the model has captured more positive class instances.

Figure 12.
Precision vs. batch size.
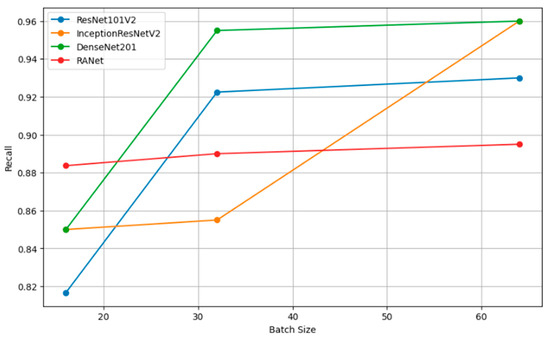
Figure 13.
Recall vs. batch size.
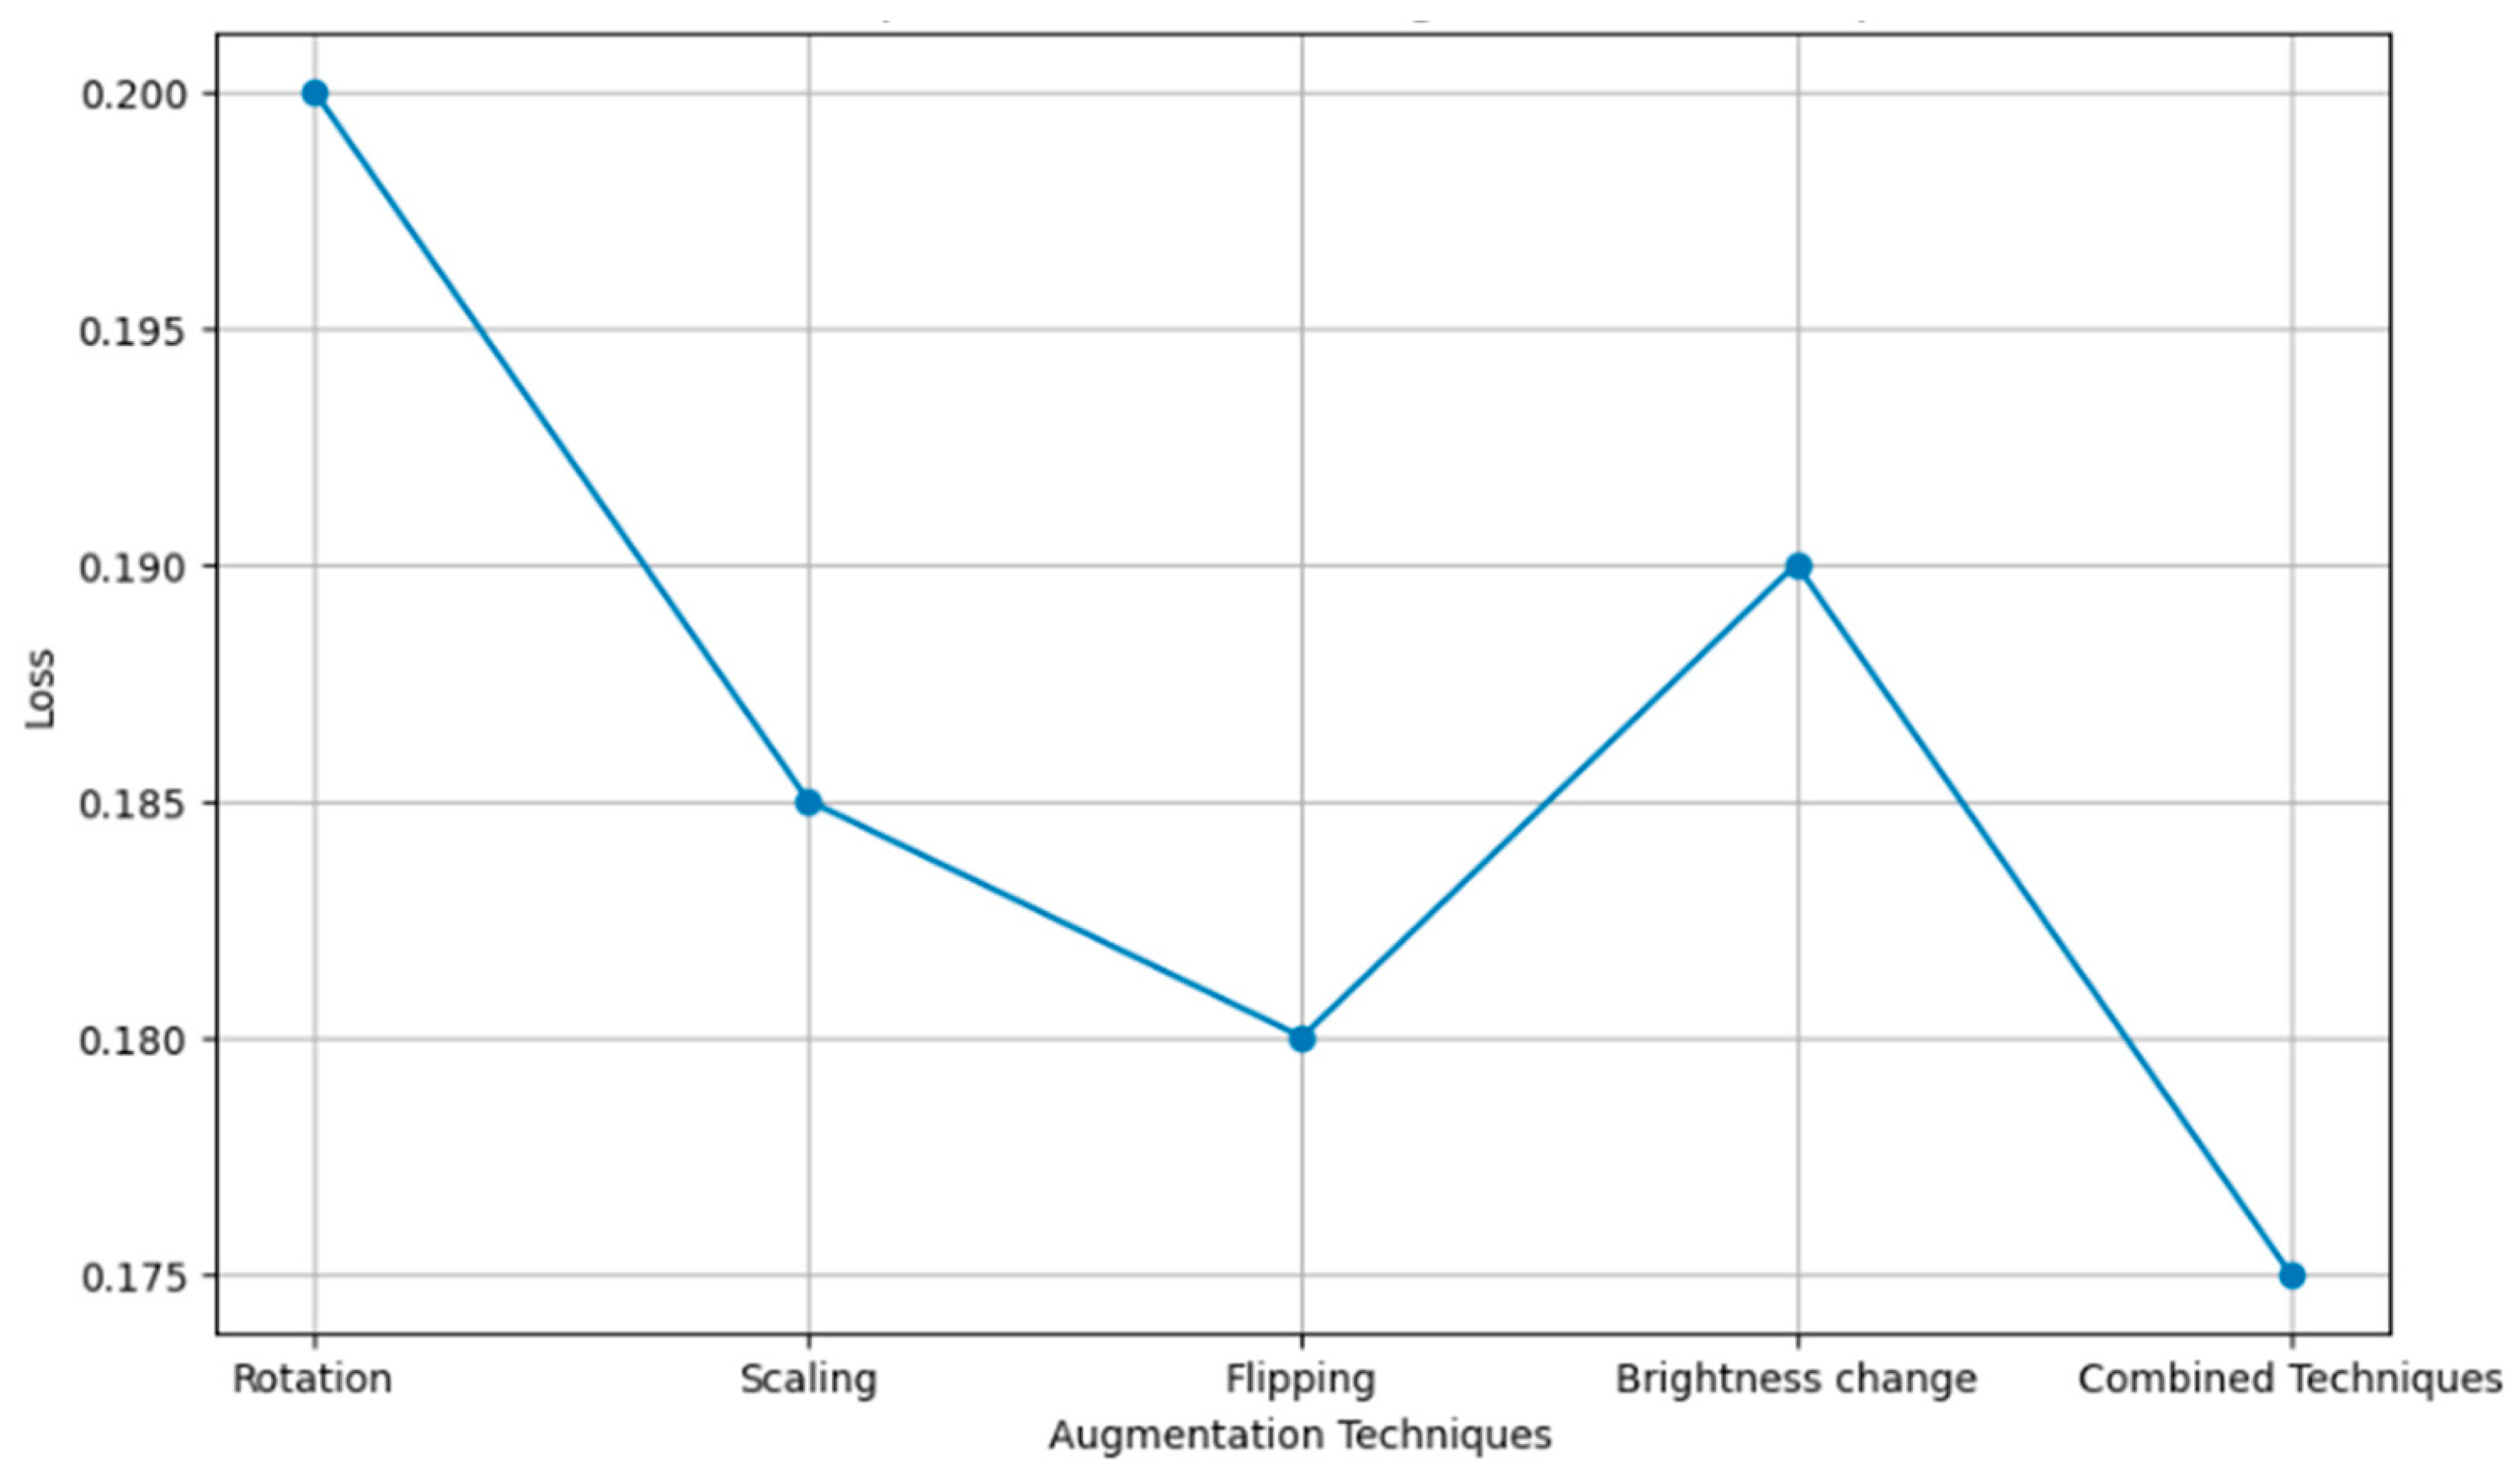
Figure 14 compares several augmentation techniques applied to images with respect to the loss function of machine learning models, including rotation, scaling, flipping, and brightness change—precisely, how these techniques impact losing the prediction errors while training a model. The more the loss value is minimized, the better the model, and the methods are more successful in improving model accuracy by reducing training errors.
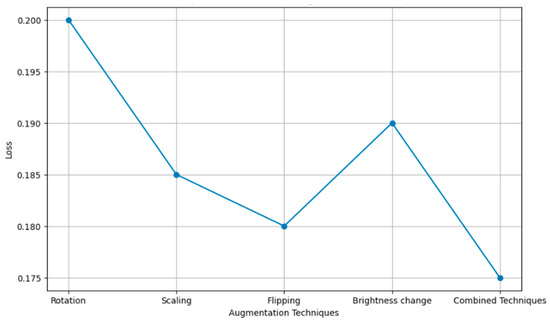
Figure 14.
Loss comparison of different augmentation techniques.
Table 9 shows the results of the ablation study, which was dedicated to finding the importance of a certain model layer configuration change w.r.t model performance measures for the ResNet101V2, InceptionResNetV2, DenseNet201, and RANet models. The rows of the table represent different configuration changes that were applied to the corresponding model, like dropping the last convolutional layer from ResNet101V2, a reduction in filter size from InceptionResNetV2, reducing one dense block from DenseNet201, and an attention mechanism alteration from RANet. For instance, after removing the last convolutional layer from ResNet101V2, the accuracy dropped to 0.8100; however, precision and recall were maintained at 0.8200 and 0.8500, respectively. On the other hand, changing the attention mechanism in RANet improved accuracy to 0.88, with precision and recall equaling 0.83 and 0.86, respectively.
Table 9.
Ablation study of model layers.
The performance comparison of the classifiers by the proposed segmentation is shown in Table 10. RANet showed quite good predictive performance at an accuracy of 0.8889 and the lowest loss of 0.1111. It had a high precision of 0.8767, a recall of 0.95, and an F1 score of 0.9123, which also signifies good balance between sensitivity and specificity. For ResNet101V2, it had an accuracy of 0.8333 and a loss of 0.1667, with the highest recall of 0.9167. The accuracy for the training of the InceptionResNetV2 model was found to be 0.8194, with a high recall of 0.9500 and an F1 score of 0.8621. In contrast, DenseNet201 had a much lower accuracy of 0.8056, a Hausdorff distance of 7.0, and a higher rate of mean absolute error of about 0.18, showing less accuracy. The values of the Dice Similarity Coefficient (DSC) further underline the performance of RANet at 0.80, while the Jaccard index for RANet was found to be equal to 0.70, showing super-segmentation capability over the other models.
Table 10.
Performance comparison of classifiers using proposed segmentation.
In addition to accuracy, the computational efficiency of the proposed method was evaluated by measuring execution time and memory usage. The results are summarized in Table 11.
Table 11.
Results summary.
The proposed method demonstrated a significant improvement in execution time, processing images approximately 28% faster than existing method 1 and 40% faster than existing method 2. Additionally, it required less memory, making it more suitable for environments with limited resources. These results indicate that the proposed method not only maintains high accuracy but also enhances computational efficiency, which is crucial for real-time applications in medical imaging.
5. Conclusions and Future Work
The proposed hybrid segmentation approach in this study that incorporates the two segmentation methods’ strengths can effectively segment the carpal bones of hand X-ray images, which is crucial in diagnosing rheumatoid arthritis. The algorithm unifies adaptive thresholding, contour analysis, and texture analysis and can be used with a high accuracy, precision, and classification rate on a varied set of models of classification. Finally, the state-of-the-art deep learning architectures, such as ResNet101V2, InceptionResNetV2, and DenseNet201, make the model more accurate. Therefore, the proposed approach offers a complete solution for RA diagnosis from X-ray images. For the purpose of widening the horizon of the proposed hybrid segmentation method in the future, though, some routes can be considered. First, the system would be able to recognize additional features and employ additional sophisticated texture analysis methods, which would result in it being able to discriminate better between carpal bones that are inflamed and normal. In addition, the use of more complex deep learning architectures or ensemble techniques to refine the segmentation result can also be considered. In addition, the analysis can be expanded into a bigger dataset that involves patients of different demographics and disease progression. This increases the transferability of the algorithm and its usefulness for clinical practice. The proposed work gives an accuracy rate of 88% and a loss of 0.15 using CNN.
Author Contributions
Conceptualization, G.R. and N.M.; methodology, G.R. and N.M.; software, G.R.; validation, N.M.; formal analysis, N.M. and M.-F.L.; investigation, M.-F.L.; resources, G.R. and N.M.; data curation, N.M. and M.-F.L.; writing—original draft preparation, G.R.; writing—review and editing, G.R. and M.-F.L.; visualization, M.-F.L.; supervision, N.M.; project administration, G.R. and N.M.; All authors have read and agreed to the published version of the manuscript.
Funding
This research has not received any external funding.
Institutional Review Board Statement
Not applicable.
Informed Consent Statement
Not applicable.
Data Availability Statement
https://universe.roboflow.com/roboflow-100/x-ray-rheumatology (Accessed on 5 July 2024).
Acknowledgments
The authors also wish to thank the anonymous reviewers for their valuable comments.
Conflicts of Interest
The authors declare no conflicts of interest.
References
- Hage, I.S.; Hamade, R.F. Segmentation of histology slides of cortical bone using pulse coupled neural networks optimized by particle-swarm optimization. Comput. Med. Imaging Graph. 2013, 37, 466–474. [Google Scholar] [CrossRef] [PubMed]
- Wen, T. Registration of 3D Models to 2D X-ray Images Using Fast X-ray Simulation and Global Optimisation Algorithms; Bangor University: Bangor, UK, 2023. [Google Scholar]
- Wang, H.; Ou, Y.; Fang, W.; Ambalathankandy, P.; Goto, N.; Ota, G.; Okino, T.; Fukae, J.; Sutherland, K.; Ikebe, M.; et al. A deep registration method for accurate quantification of joint space narrowing progression in rheumatoid arthritis. Comput. Med. Imaging Graph. 2023, 108, 102273. [Google Scholar] [CrossRef] [PubMed]
- Ponnusamy, R.; Zhang, M.; Chang, Z.; Wang, Y.; Guida, C.; Kuang, S.; Sun, X.; Blackadar, J.; Driban, J.B.; McAlindon, T.; et al. Automatic measuring of finger joint space width on hand radiograph using deep learning and conventional computer vision methods. Biomed. Signal Process. Control 2023, 84, 104713. [Google Scholar] [CrossRef] [PubMed]
- Kim, S.H.; Montejo, L.; Hielscher, A. Diagnostic Evaluation of Rheumatoid Arthritis (RA) in Finger Joints Based on the Third-Order Simplified Spherical Harmonics (SP3) Light Propagation Model. Appl. Sci. 2022, 12, 6418. [Google Scholar] [CrossRef]
- Gemme, L.; Nardotto, S.; Dellepiane, S.G. Automatic MPST-cut for segmentation of carpal bones from MR volumes. Comput. Biol. Med. 2017, 87, 335–346. [Google Scholar] [CrossRef] [PubMed]
- Brown, J.M.; Ross, E.; Desanti, G.; Saghir, A.; Clark, A.; Buckley, C.; Filer, A.; Naylor, A.; Claridge, E. Detection and characterisation of bone destruction in murine rheumatoid arthritis using statistical shape models. Med. Image Anal. 2017, 40, 30–43. [Google Scholar] [CrossRef] [PubMed]
- Mastmeyer, A.; Engelke, K.; Fuchs, C.; Kalender, W.A. A hierarchical 3D segmentation method and the definition of vertebral body coordinate systems for QCT of the lumbar spine. Med. Image Anal. 2006, 10, 560–577. [Google Scholar] [CrossRef] [PubMed]
- Sebastian, T.B.; Tek, H.; Crisco, J.J.; Kimia, B.B. Segmentation of carpal bones from CT images using skeletally coupled deformable models. Med. Image Anal. 2003, 7, 21–45. [Google Scholar] [CrossRef] [PubMed]
- Cheraya, G.; Sharma, S.; Chhabra, A. Dual energy CT in musculoskeletal applications beyond crystal imaging: Bone marrow maps and metal artifact reduction. Skelet. Radiol. 2022, 51, 1521–1534. [Google Scholar] [CrossRef] [PubMed]
- Singh, A.; Dutta, M.K.; Jennane, R.; Lespessailles, E. Classification of the trabecular bone structure of osteoporotic patients using machine vision. Comput. Biol. Med. 2017, 91, 148–158. [Google Scholar] [CrossRef] [PubMed]
- Lo, C.M.; Lai, K.L. Deep learning-based assessment of knee septic arthritis using transformer features in sonographic modalities. Comput. Methods Programs Biomed. 2023, 237, 107575. [Google Scholar] [CrossRef] [PubMed]
- Bielecka, M. Syntactic-geometric-fuzzy hierarchical classifier of contours with application to analysis of bone contours in X-ray images. Appl. Soft Comput. 2018, 69, 368–380. [Google Scholar] [CrossRef]
- Üreten, K. Determining Rheumatoid Arthritis and Osteoarthritis Diseases with Plain Hand X-rays Using Convolutional Neural Network. Master’s Thesis, Çankaya University, Ankara, Turkey, 2019. [Google Scholar]
- Diana, D.; Revathi, J.; Uma, K.; Ramya, A.; Anitha, J. A Novel Method for Detecting Bone Contours in Hand Radiographic Images. In Smart Computing Paradigms: New Progresses and Challenges, Proceedings of the ICACNI 2018, Singapore, 1 December 2019; Springer: Singapore, 2020. [Google Scholar]
- Alarcón-Paredes, A.; Guzmán-Guzmán, I.P.; Hernández-Rosales, D.E.; Navarro-Zarza, J.E.; Cantillo-Negrete, J.; Cuevas-Valencia, R.E.; Alonso, G.A. Computer-aided diagnosis based on hand thermal, RGB images, and grip force using artificial intelligence as screening tool for rheumatoid arthritis in women. Med. Biol. Eng. Comput. 2021, 59, 287–300. [Google Scholar] [CrossRef] [PubMed]
- Balaji, V.R.; Priiyadharshini, M.; Suruthi, R.; Thrisha, R. A novel approach for detection of hand arthritis using convolutional neural network. In Proceedings of the 2022 3rd International Conference on Electronics and Sustainable Communication Systems (ICESC), Coimbatore, India, 17 August 2022. [Google Scholar]
- Ahalya, R.K.; Almutairi, F.M.; Snekhalatha, U. RANet: A custom CNN model and quanvolutional neural network for the automated detection of rheumatoid arthritis in hand thermal images. Sci. Rep. 2023, 13, 15638. [Google Scholar] [CrossRef] [PubMed]
- Pemasiri, A.; Nguyen, K.; Sridharan, S.; Fookes, C. Multi-modal semantic image segmentation. Comput. Vis. Image Underst. 2021, 202, 103085. [Google Scholar] [CrossRef]
- Akinnuwesi, B.A.; Adegbite, B.A.; Adelowo, F.; Ima-Edomwonyi, U.; Fashoto, G.; Amumeji, O.T. Decision support system for diagnosing rheumatic-musculoskeletal disease using fuzzy cognitive map technique. Inform. Med. Unlocked 2020, 18, 100279. [Google Scholar] [CrossRef]
- Dataset Collection. Available online: https://universe.roboflow.com/roboflow-100/x-ray-rheumatology (accessed on 5 July 2024).


Disclaimer/Publisher’s Note: The statements, opinions and data contained in all publications are solely those of the individual author(s) and contributor(s) and not of MDPI and/or the editor(s). MDPI and/or the editor(s) disclaim responsibility for any injury to people or property resulting from any ideas, methods, instructions or products referred to in the content. |
© 2024 by the authors. Licensee MDPI, Basel, Switzerland. This article is an open access article distributed under the terms and conditions of the Creative Commons Attribution (CC BY) license (https://creativecommons.org/licenses/by/4.0/).