Article

AI–Big Data Analytics Platform for Energy Forecasting in Modern Power Systems

by
Martin Santos-Dominguez
,
Nicasio Hernandez Flores
,
Isaac Alberto Parra-Ramirez
and
Gustavo Arroyo-Figueroa
*
Instituto Nacional de Electricidad y Energias Limpias, Cuernavaca 62490, Mexico
*
Author to whom correspondence should be addressed.
Big Data Cogn. Comput. 2025, 9(11), 272; https://doi.org/10.3390/bdcc9110272
Submission received: 14 August 2025 / Revised: 17 October 2025 / Accepted: 29 October 2025 / Published: 31 October 2025
(This article belongs to the Special Issue Machine Learning and AI Technology for Sustainable Development)

Abstract

Big Data Analytics is vital for power grids, as it empowers informed decision-making, anticipates potential operational and maintenance issues, optimizes grid management, supports renewable energy integration, ultimately reduces costs, improves customer service, monitors consumer behavior, and offers new services. This paper describes the AI–Big Data Analytics Architecture based on a data lake architecture that uses a reduced and customized set of Hadoop and Spark as a cost-effective, on-premises alternative for advanced data analytics in power systems. As a case study, a comparative analysis of electricity price forecasting models in the day-ahead market for nodes of the Mexican national electrical system using statistical, machine learning, and deep learning models, is presented. To build and select the best forecasting model, a data science and machine learning methodology is used. The results show that the Gradient Boosting and Support Vector Regression models presented the best performance, with a Mean Absolute Percentage Error (MAPE) between 1% and 4% for five-day-ahead electricity price forecasting. The implementation of the best forecasting model into the Big Data Analytics Platform allows the automation of the calculation of the local electricity price forecast per node (every 24, 72, or 120 h) and its display in a comparative dashboard with actual and forecasted data for decision-making on demand. The proposed architecture is a valuable tool that allows the future implementation of intelligent energy forecasting models in power grids, such as load demand, fuel prices, power generation, and consumption, among others.

1. Introduction

Modern power grids and electricity markets are undergoing digitalization to enable more efficient and secure operations, better forecasting, and better decision-making [1]. The goal is to optimize grid operations, optimize energy distribution, and improve the overall reliability and sustainability of the system [2]. This improves the efficiency, reliability, quality, and safety of the electricity system while reducing environmental impact, with economic and social benefits.
These new operating conditions require the integration of emerging and robust information technologies to facilitate the storage, processing, and effective use of information generated by sensors and smart meters from the operational processes of the electrical system [3]. Due to the complexity and heterogeneity of electricity networks and markets, as well as the high volume of information they must process, Big Data Analytics is emerging as an enabling technology for the development and future success of electricity grids and markets [4,5].
Big Data collects, stores, processes, and analyzes large volumes of data to generate valuable knowledge and information. Big Data algorithms based on Artificial Intelligence (AI) and machine learning (ML) algorithms allow the extraction of valuable information and leverage it to analyze and solve electrical system problems, for example, forecasting demand and prices, controlling multiple microgrids, managing the electricity market, and estimating asset health, among others [6]. The power of Big Data Analytics can help electrical systems reduce operation and maintenance costs, integrate renewable energy sources, improve customer service, and track consumer behavior [7]. Big Data Analytics can drive innovation in the energy sector, leading to the development of new technologies, business models, and services [8,9]. Some benefits of using Big Data Analytics in the electrical system are as follows:
  • Improved grid operations and management. Big Data Analytics identifies issues in a timely manner through real-time monitoring of grid performance, overloads, and voltage imbalances. It allows the prediction of potential failures by analyzing data from sensors and equipment, with maintenance proactively scheduled to minimize downtime and improve system reliability. It allows for the optimization of the dispatch of power generation resources through data analysis, ensuring a balance between supply and demand while minimizing costs and carbon emissions [10]. It helps maintain grid stability by predicting and managing fluctuations in energy supply and demand, which is important given the increasing integration of renewable energy sources [11].
  • Improved energy forecasting and load management. Big Data Analytics helps predict future energy demand more accurately, allowing the electricity system to plan optimal resource allocation and reduce the risk of shortages or surpluses [12]. It allows for the analysis of customer consumption patterns, enabling the implementation of dynamic pricing strategies and demand response programs, shifting consumption away from peak hours and optimizing grid utilization. It enables the development of tailored energy solutions for each customer, promoting energy efficiency and cost savings [13].
  • Improved efficiency and cost reduction. Big Data Analytics optimizes energy flow and reduces transmission losses by identifying energy losses in distribution networks [14]. It optimizes maintenance programs and minimizes outages by improving asset management, significantly reducing system operating and maintenance costs [15,16]. It allows for resource planning and investment decisions for electrical infrastructure by identifying energy consumption patterns and market trends [17].
  • Enabling smart grids and integrating renewable energy. Big Data Analytics is a strategic partner for the development and operation of smart grids, facilitating two-way communication between power grids and customers and the integration of distributed energy resources [18]. It enables the management of the intermittency of renewable energy sources such as solar and wind, optimizing their integration into the grid and ensuring a reliable and stable energy supply. It facilitates efficient energy management and promotes the use of renewable energy to achieve decarbonization goals [19].
On the other hand, energy forecasting is a powerful tool that provides valuable information for determining future energy needs over a period to maintain the balance between supply and demand and the stability of the electrical system [20]. These projections of future values are essential for decision-making related to operation, maintenance, scheduling, energy planning, and the electricity market. The main types of energy forecasting are load demand [21], solar and wind generation [22], electricity consumption [23], and electricity price [24].
Electricity price forecasting (EPF) plays a critical role in energy markets, enabling market participants to optimize trading strategies, mitigate financial risks, and maintain grid stability. However, accurate forecasting has become increasingly difficult due to the rapid expansion of renewable energy sources such as wind, solar, and hydropower, regulatory interventions, and unforeseen disruptions such as generator outages or transmission limitations. These complexities make EPF particularly challenging, as prices exhibit high volatility, nonlinearity, and sudden peaks.
Statistical models due to their interpretability and ability to capture temporal dependencies have dominated EPF. These include, primarily, the autoregressive integrated moving average (ARIMA) and its variants, such as Box–Cox transformation, ARIMA errors, and Trend and Seasonal components (BATS). While these methods remain widely used, they often struggle to capture the nonlinearities, regime shifts, and extreme price fluctuations that characterize modern electricity markets [25].
Recently, machine learning (ML) models have been successfully used in EPF, offering greater flexibility to model complex and non-linear relationships. ML approaches such as Support Vector Machine (SVM), Random Forest (RF), and gradient boosting algorithms (e.g., XGB, LGBM) have demonstrated strong performance in discovering intricate patterns within market data [26].
The SVR shows moderate performance in electricity markets due to its limited ability to adapt to high-frequency price fluctuations [27]. RF is a robust model that strikes a balance between accuracy, interpretability, and scalability. It offers reliable medium-term forecasts, but it performs poorly in the face of short-term volatility [28].
Both XGB and LGBM models have shown good performance, improving forecast accuracy by incorporating multiple influencing factors, including weather conditions, fuel prices, and demand trends [29] due to their adaptive capabilities [30]. XGB and LGBM have performed well in European markets such as Ireland, outperforming DL models [31]. Overall, XGB demonstrates robust and versatile performance in electricity price forecasting, with strengths in real-time market adaptation.
Deep learning models, particularly recurrent neural networks (RNNs), have been widely adopted in the day-ahead market due to their ability to learn hierarchical feature representations and capture temporal dependencies [32,33]. Despite their predictive power, these models often require large datasets, entail significant computational costs, and are prone to overfitting. In response, ensemble ML has gained traction; these integrated models offer a promising way forward, balancing interpretability, computational cost, and accuracy to improve forecasting performance in increasingly volatile and data-rich electricity markets.
In this context, the contributions of this work focus on addressing three key challenges in the implementation of Big Data Analytics in power grid operational time:
  • First, a Big Data Analytics Platform to implement and automate intelligent models in electrical systems is proposed. This platform allows processing raw data from the electrical systems and transforming it into knowledge that adds value for operational and strategic decision-making.
  • Second, a comparative analysis of statistical and machine learning models for electricity price forecasting is presented. For this purpose, two classical statistical models were evaluated: Autoregressive Integrated Moving Average (ARIMA) and Box–Cox transformation, ARIMA errors, Trend and Seasonal components (BATS), and seven ML models: Random Forest (RF), Gradient Boosting (GB), Light Gradient Boosting M (LGBM), Extreme Gradient Boosting (XGB), Support Vector Machine (SVM), artificial neural networks (ANN), and one DL model: long short-term memory (LSTM).
  • Third, the implementation of the best forecasting model into the Big Data Analytics Platform to display the day-ahead electricity price forecast per node through dynamic graphic reports, providing a descriptive and prescriptive data analytics system for decision-making in operational time.
The remainder of this paper is organized as follows: Section 2 presents the description of the concept and current state of Big Data platforms and systems. Section 3 describe the main characteristics of the Big Data Analytics Platform Proposed. Section 4 describes the model comparison methodology of the electricity price forecast models by node, including the selection of the model with the best performance. Section 5 outlines the integration of the model with the best performance, and the automation of the calculation of the electricity price forecast per node by day. Finally, the main conclusions of this work are shown in Section 6.

2. Big Data Platforms

This section presents the Big Data technologies that could be adopted to implement a dedicated Big Data processing architecture for electricity grids. Power grids gather large amounts of data every day due to the digital transformation of their processes. They collect information not only in relational databases but also in semi-structured and unstructured formats across a range of internal, external, and distributed applications, such as documentary information, log files, emails, images, videos, meter data, sensor data, messages, and more [34].
In relational databases, historical information is stored in the operational databases. It is common to perform analyses processes on them, occupying the same infrastructure for the operational process and the generation of reports and statistical analysis of the data. However, as repositories grow larger, they become slower for both transactional processes and ad hoc reports, so companies must choose to migrate their data to appropriate infrastructure to perform more specialized analysis [35]. Nevertheless, acquiring data analysis tools is a significant investment because it requires expensive licensed analysis tools and specialized hardware to ensure optimal operations.
Furthermore, various advanced data analysis and processing techniques using artificial intelligence are now available, enabling the development of advanced models, including forecasts that aid in more assertive decision-making. These techniques allow companies to explore their historical data and gain insight into process behavior. Therefore, data has become very important today, as analyzing it with these techniques can represent a competitive advantage [36]. The knowledge gained from historical data makes it a valuable asset for companies, making the process profitable.
At their core, Big Data platforms are comprehensive ecosystems of tools, technologies, and infrastructure designed to handle large volumes of data. Several Big Data platforms offer comprehensive features and solutions for businesses to manage and analyze complex datasets [37]. Table 1 shows the most prominent Big Data platforms used by electric companies.
All platforms are based on the Apache Hadoop and Apache Spark projects. Commercial platforms provide a cloud environment with tools that enable implementation and customization, from data ingestion and storage to data processing and visualization. They offer a comprehensive solution for managing and harnessing the power of data. Commercial platforms require subscription or licensing fees, which in some cases can be substantially high.
Alternatively, the use of open-source Big Data tools offers a cost-effective option for integrating an infrastructure on-premises that allows for exploring the implementation of advanced forecasting models, including various time-series processing techniques with machine learning. This allows for scaling up based on demand to develop and process other models of interest. Additionally, the integrated infrastructure allows for the implementation of these models in Business Intelligence dashboards that reflect comparative results of real data and periodically updated forecasts [38].
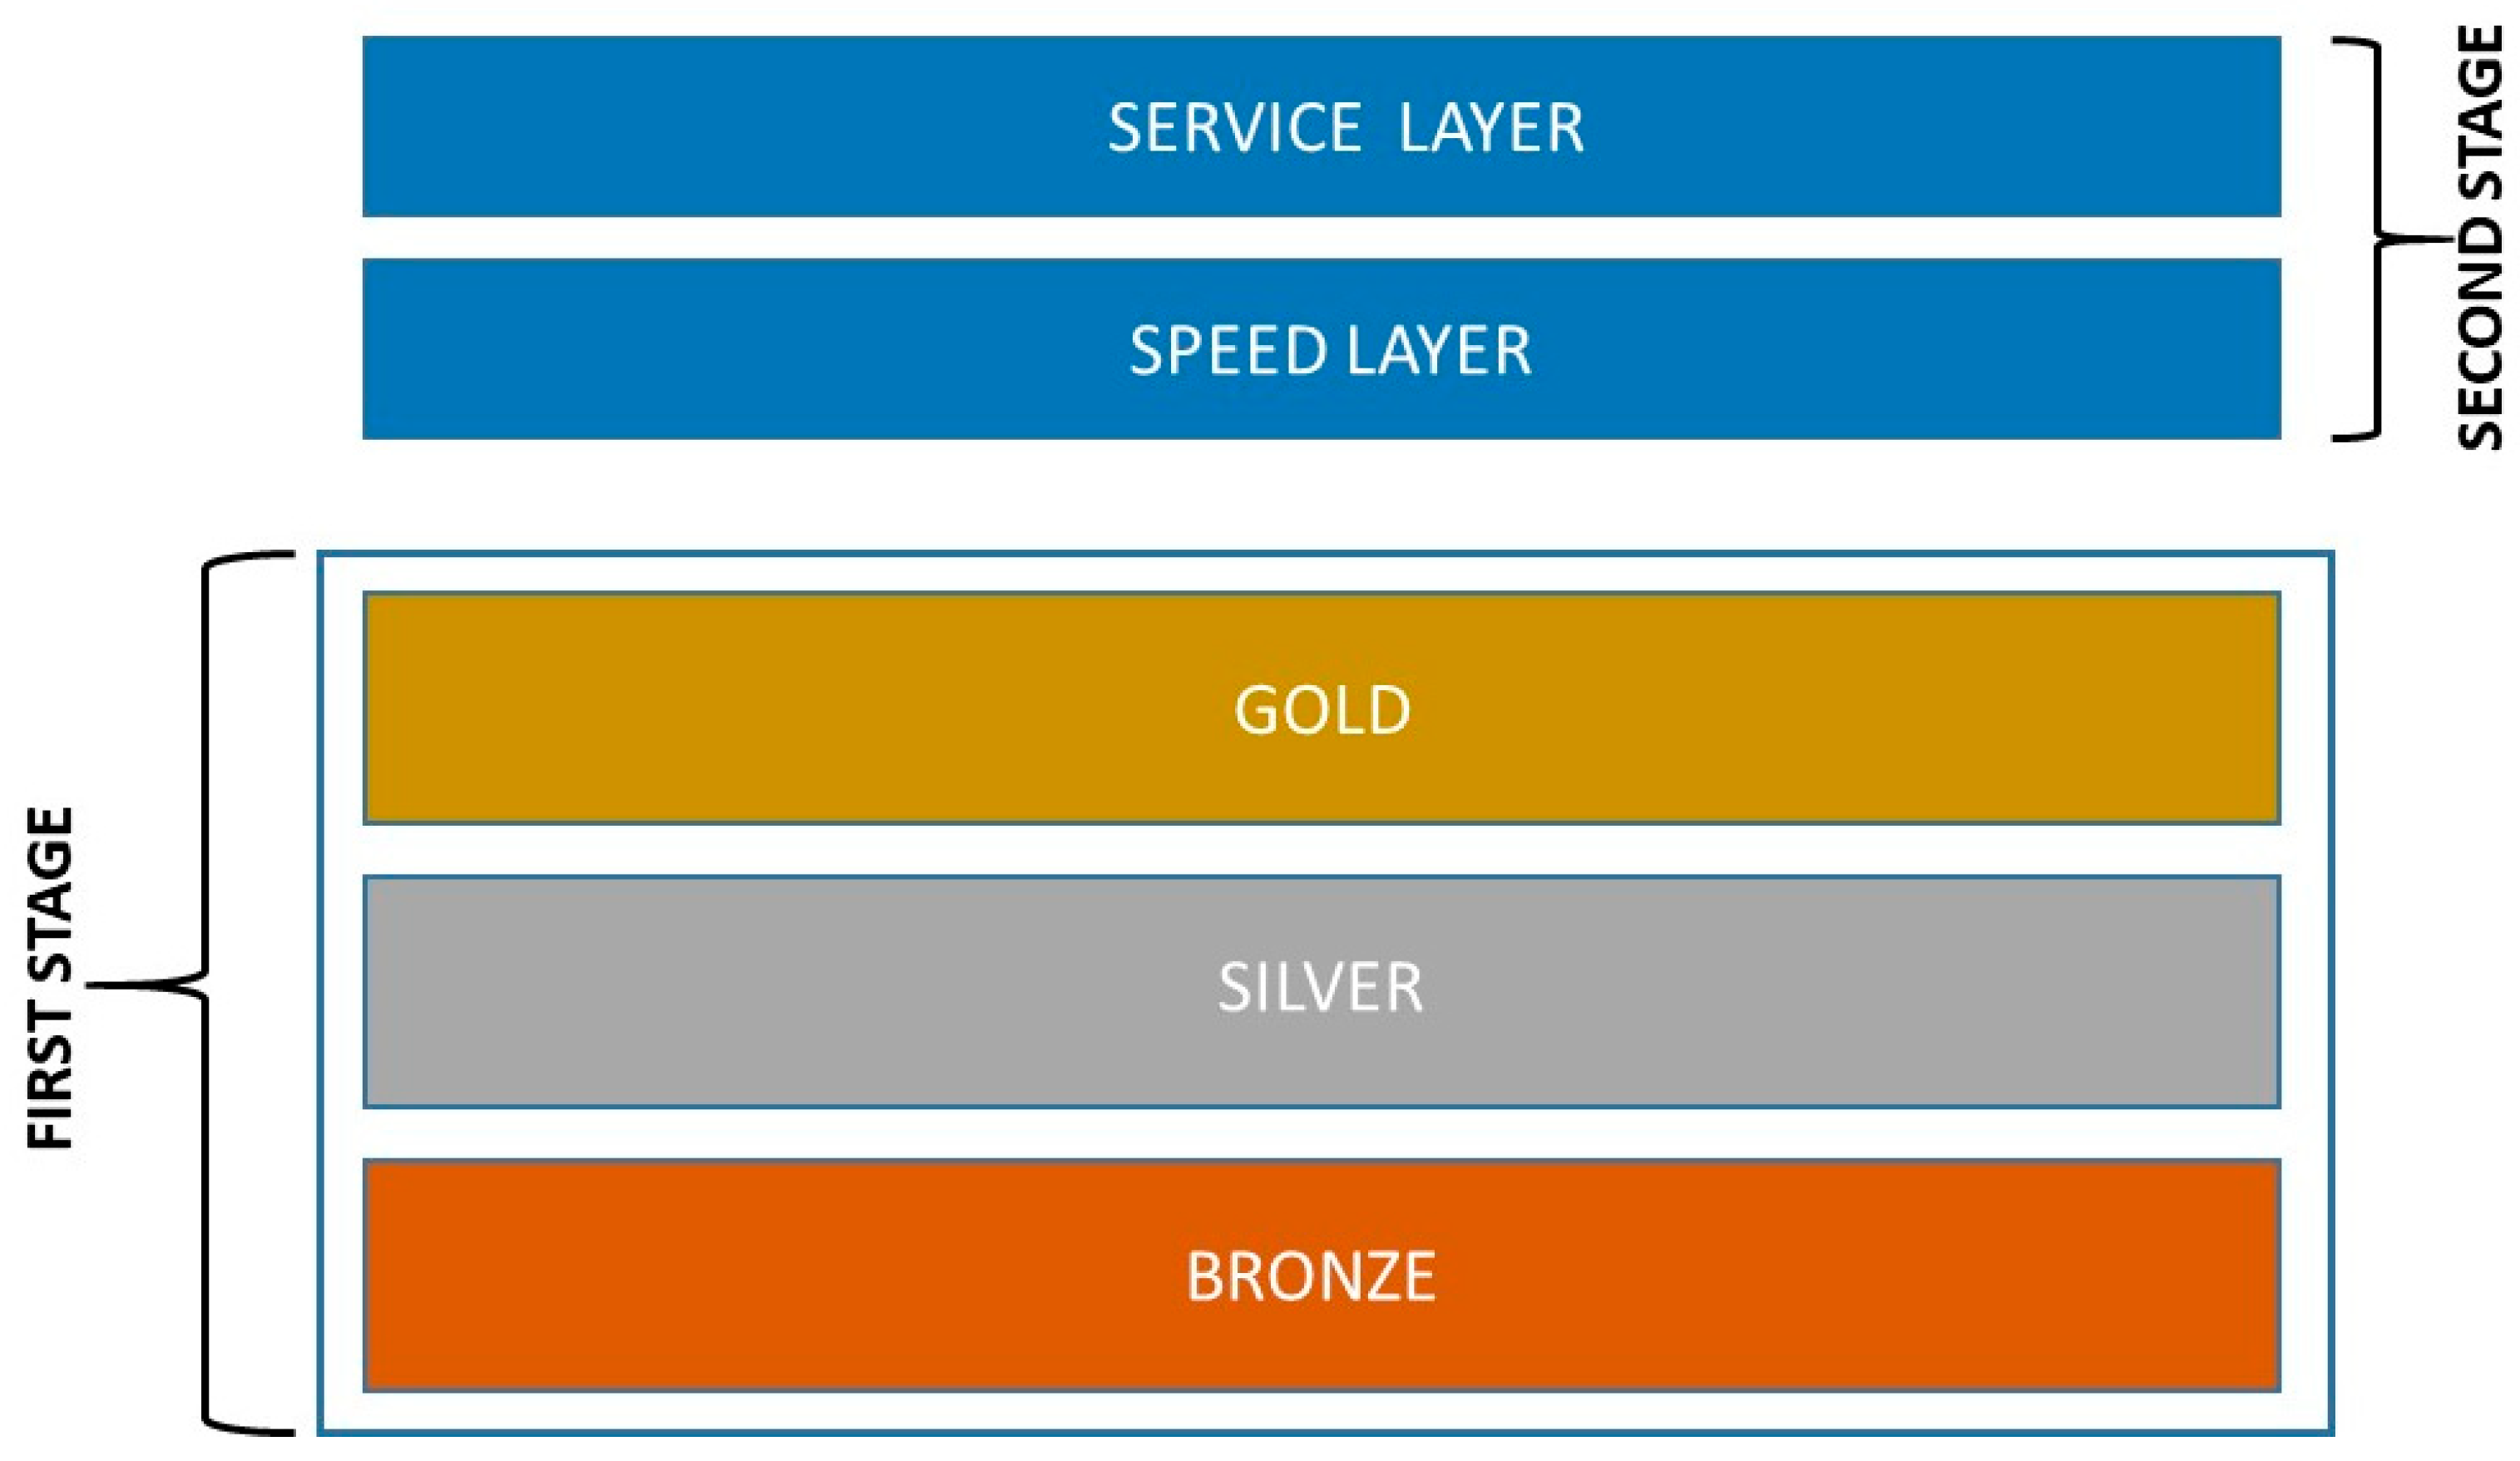
Companies can choose to use these open-source tools and move forward with integrating repositories that can grow with their needs while simultaneously maturing their analysis processes to implement advanced data processing solutions [39]. They can start by implementing data puddles (fewer than six nodes) that are later integrated and converted into data ponds (between ten and twenty nodes) and then move on to a more comprehensive data lake (greater than twenty nodes), as shown in Figure 1.
The data repository is separated into three layers for the data puddle: bronze, silver, and gold. The bronze layer is used to store raw, unmodified data. The silver layer stores treated and cleaned data ready for analysis and model development. The gold layer stores data resulting from the analysis, trained models, and prediction results, thus ensuring the separation of information and governance. Additionally, at a more mature stage, two upper layers can be added for the acquisition of real-time data streams for direct in-memory processing using Apache Spark, and a services layer to include the results of the blending of all the data. This would allow the incorporation of smart grid data to model smart grid behaviors and strengthen its operation in a lambda-like architecture [40], as shown in Figure 2.

3. Big Data Analytics Platform Proposed

The Big Data Analytics Platform proposed was designed taking into account the requirements of the national electric company: (1) an on-premises platform; (2) low-cost, local, and without licenses or subscription fees; (3) adapted to the company’s technological infrastructure; (4) scalable; (5) the models need to be focused regionally, resulting in several models that must be executed simultaneously to obtain results in adequate time, so parallel and distributed processing is necessary; (6) the ability to process data in real time by applying AI models trained with historical data.
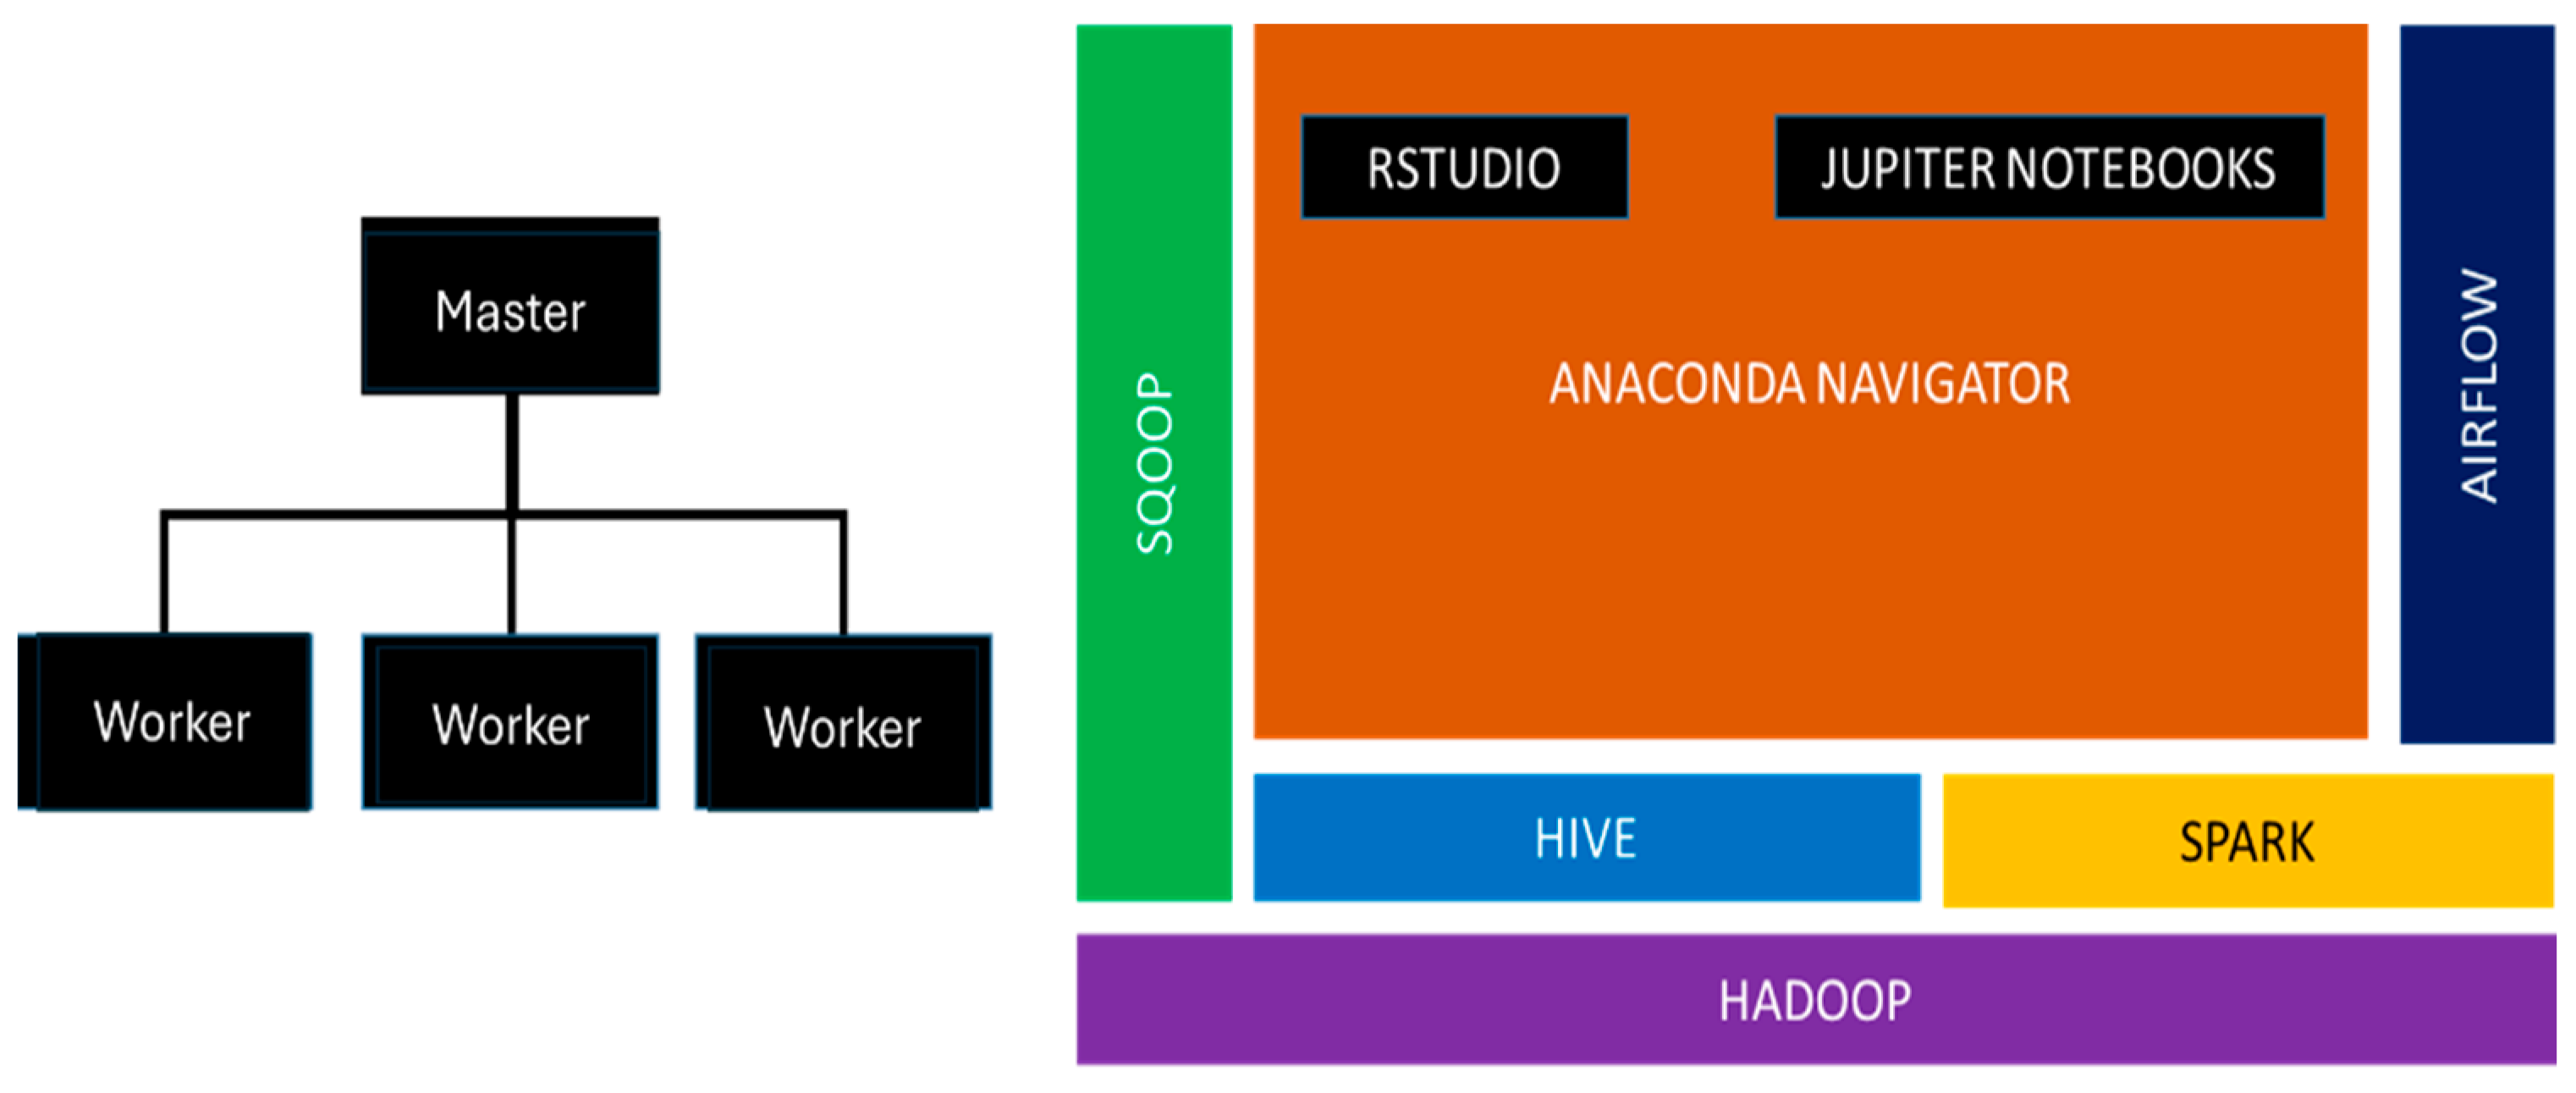
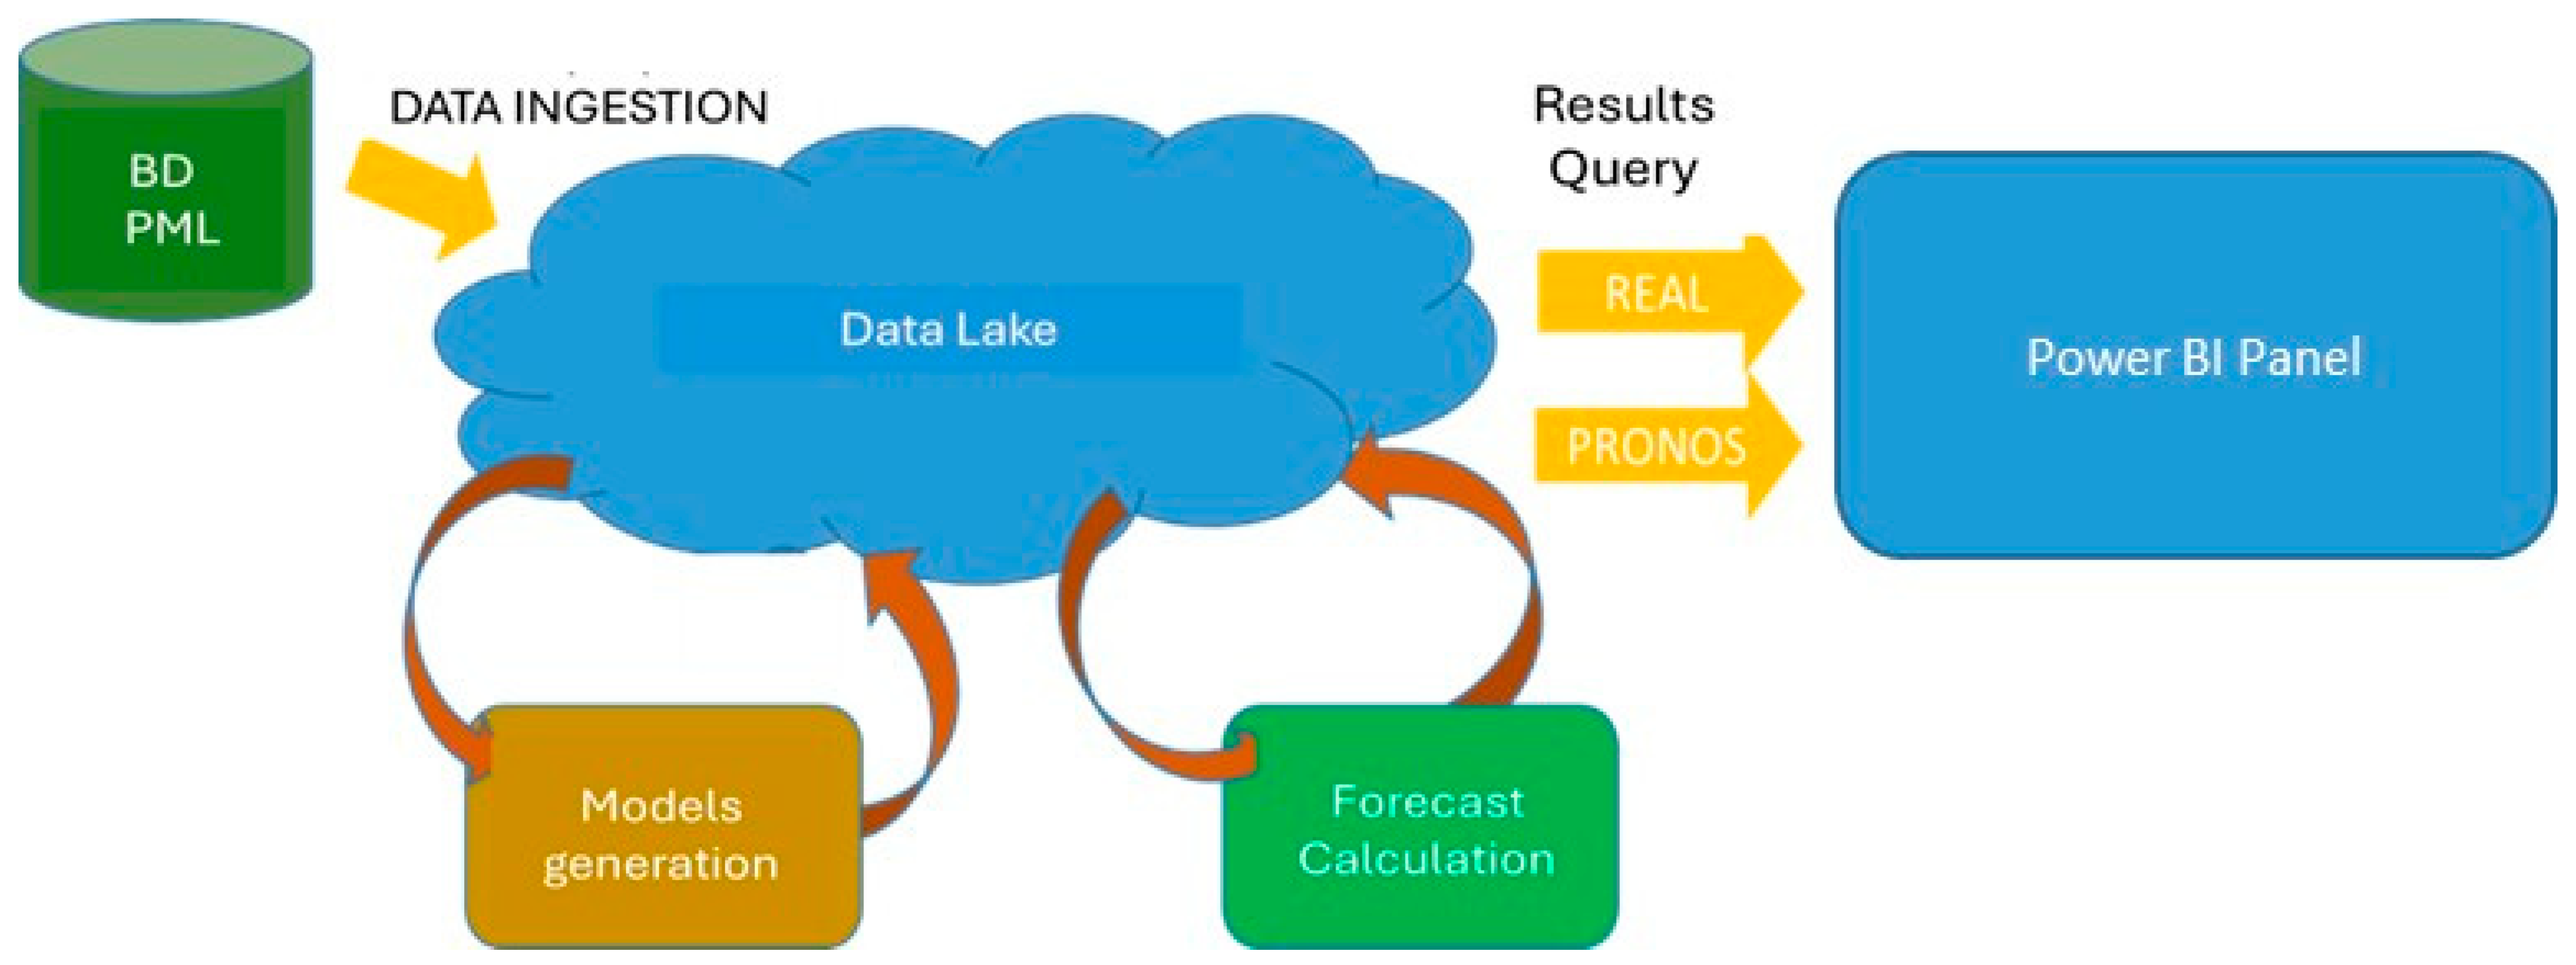
The architecture of the proposed Big Data Analytics, based on data lake architecture [41] with open-source tools, is shown in Figure 3. The structure of the data lake architecture was deployed on four virtual machines, each with eight CPU cores, 32 GB of RAM, 2 TB of disk space for data, and the enterprise Linux Red Hat 9.1 operating system.
A cluster configuration of one master and three workers, and the following open source tools were installed:
  • Apache Hadoop: A tool for repository integration (Data Lake) that enables distributed data storage and processing.
  • Apache Sqoop: A tool for massive data ingestion from relational databases.
  • Apache Hive: A tool for managing repositories in the data lake and querying information using SQL.
  • Apache Spark: A distributed data processing engine with advanced processing capabilities, mainly used for stream processing.
  • Apache Airflow: A tool for deploying and periodically running task executor agents.
  • Anaconda Navigator: Data science tools for advanced data analysis and model development.
The integrated infrastructure has the following characteristics:
  • It is an on-premises platform adapted to the information technology infrastructure of the electric company.
  • It is a cost-effective solution, compared with the use of third-party commercial tools that require paid licenses and specialized hardware.
  • It allows the integration of data from various information sources: structured, semi-structured, and unstructured.
  • It uses a reduced and customized set of the Hadoop and Spark ecosystem, which allows the implementation of advanced analytics using ML on demand.
  • It can scale horizontally (by adding more virtual machines) to expand the space and processing capacity of the data lake.
  • It is a suitable alternative for integrating Big Data infrastructure into the power grids and leveraging distributed processing capabilities.
This infrastructure is proposed as a cost-effective solution that can be scaled and serve to develop other models and new forms of data analysis for the company. After a period of maturity, the company may decide to adopt Big Data commercial tools or a hybrid solution that allows it to grow and integrate more solutions. Several models used by electric utilities require localized solutions tailored to specific geographical regions, and their computations often need to be executed in parallel. The proposed platform supports this capability by enabling distributed and concurrent processing.
The choice of the data lake solution comes from the need to offer a data platform for advanced analytics and predictions. In addition, the choice of a data lake architecture is mainly to allow high flexibility and scalability. These two characteristics allow the implementation of robust data analysis models for tasks such as energy forecasting, fault detection, and maintenance, among others.

4. Materials and Methods for Electricity Price-Forecasting Models

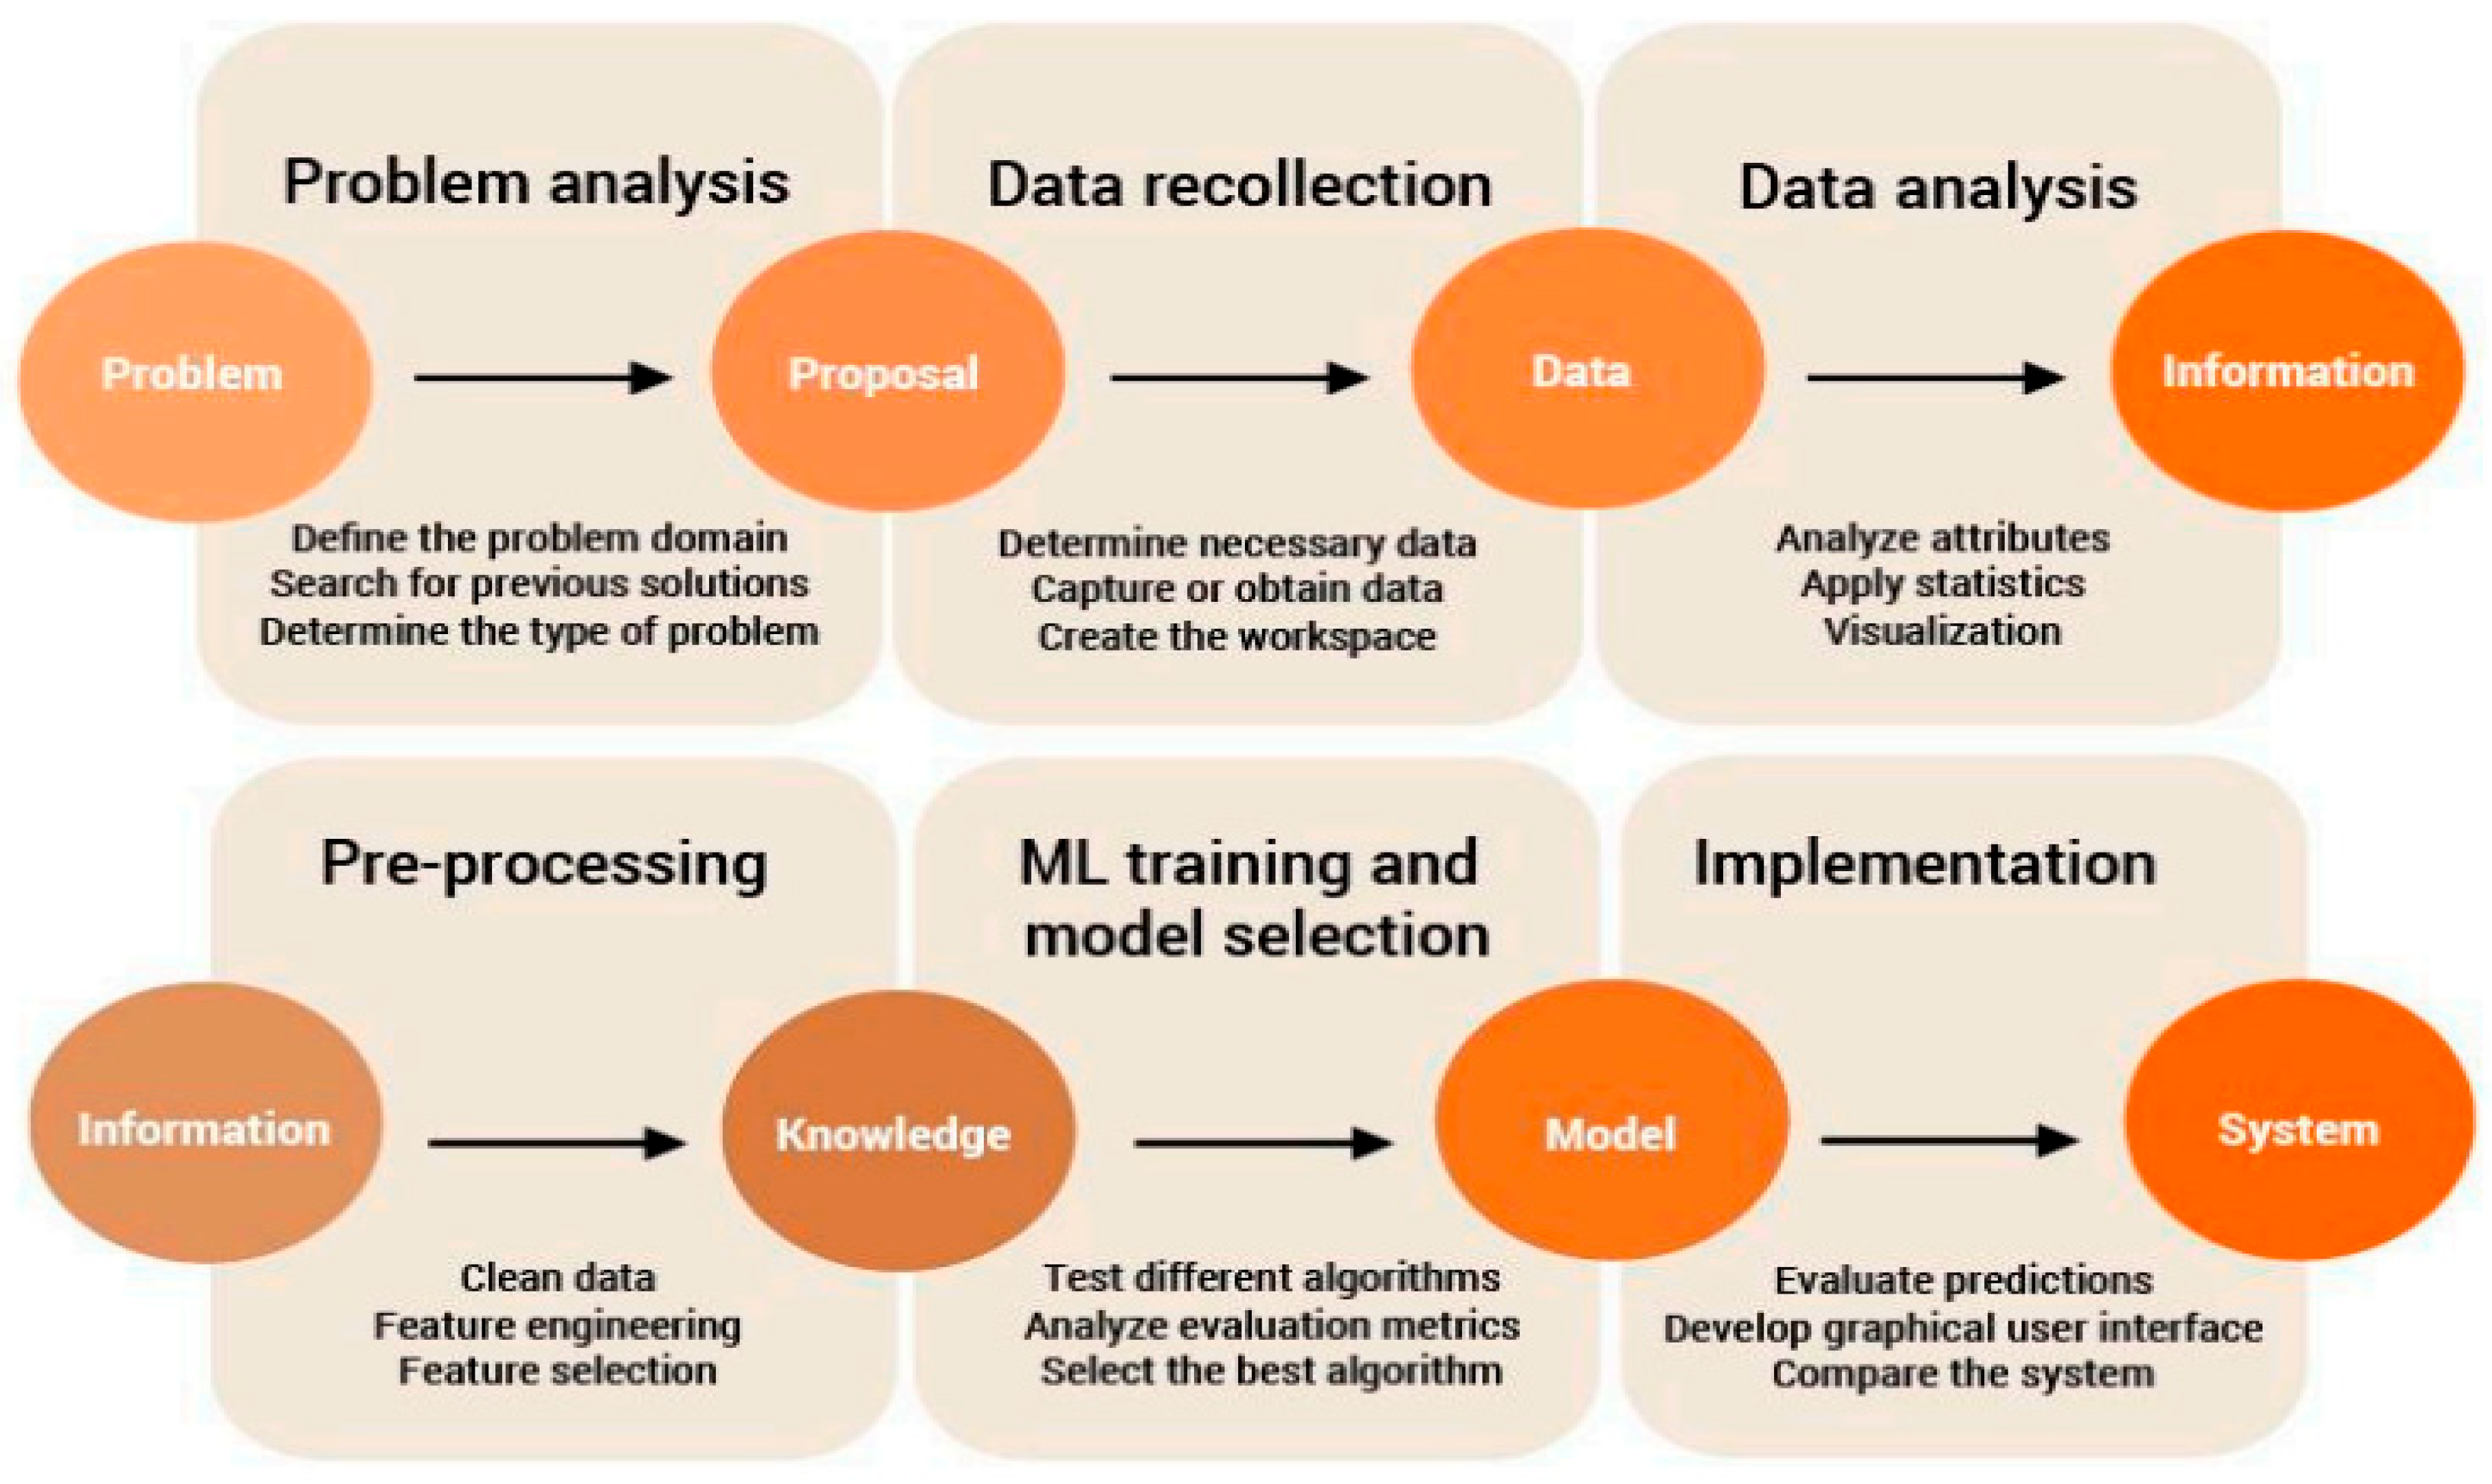
The data science (DS) and machine learning (ML) methodology [42] applied in the present work for electricity price-forecasting models is presented in Figure 1. The ML methodology is composed of six steps: problem analysis, data collection, data analysis, pre-processing, ML training, model selection, and system implementation (see Figure 4). In the system implementation stage, the best forecast model per node is implemented in the proposed Big Data Analytics Platform.

4.1. Problem Analysis

The National Electrical System (SEN) is composed of the National Transmission Grid (RNT) and the General Distribution Networks (RGD), which deliver the electricity produced at the power plants to Basic Service Users (USB) and Market Users (UM). In Mexico, electricity transmission is carried out through a large system for the National Interconnected System (SIN) and two peninsular systems: Baja California System (BCA) and Baja California Sur System (BCS) [43].
By August 2023, the SEN had 2553 NodeP, which are connection points in the grid where the physical injection or withdrawal of energy is modeled. Each NodeP has an associated local electricity price (LEP). This price is used for financial settlements in the Wholesale Electricity Market (MEM). The National Energy Control Center (CENACE) [44] carries out the operational management of the MEM. CENACE calculates the electricity price for each node as the sum of three components:
  • Energy Component, which represents the energy production cost calculated by CENACE.
  • Congestion Component, which represents the cost derived from adding each additional megawatt to the grid due to transmission restrictions.
  • Losses Component, which represents the cost caused by the increase in grid losses when supplying each additional megawatt.
Predicting the current and future local electricity price by node is vital for the optimal functioning of the energy market, in which generators, suppliers, marketers, and end users participate.

4.2. Data Collection

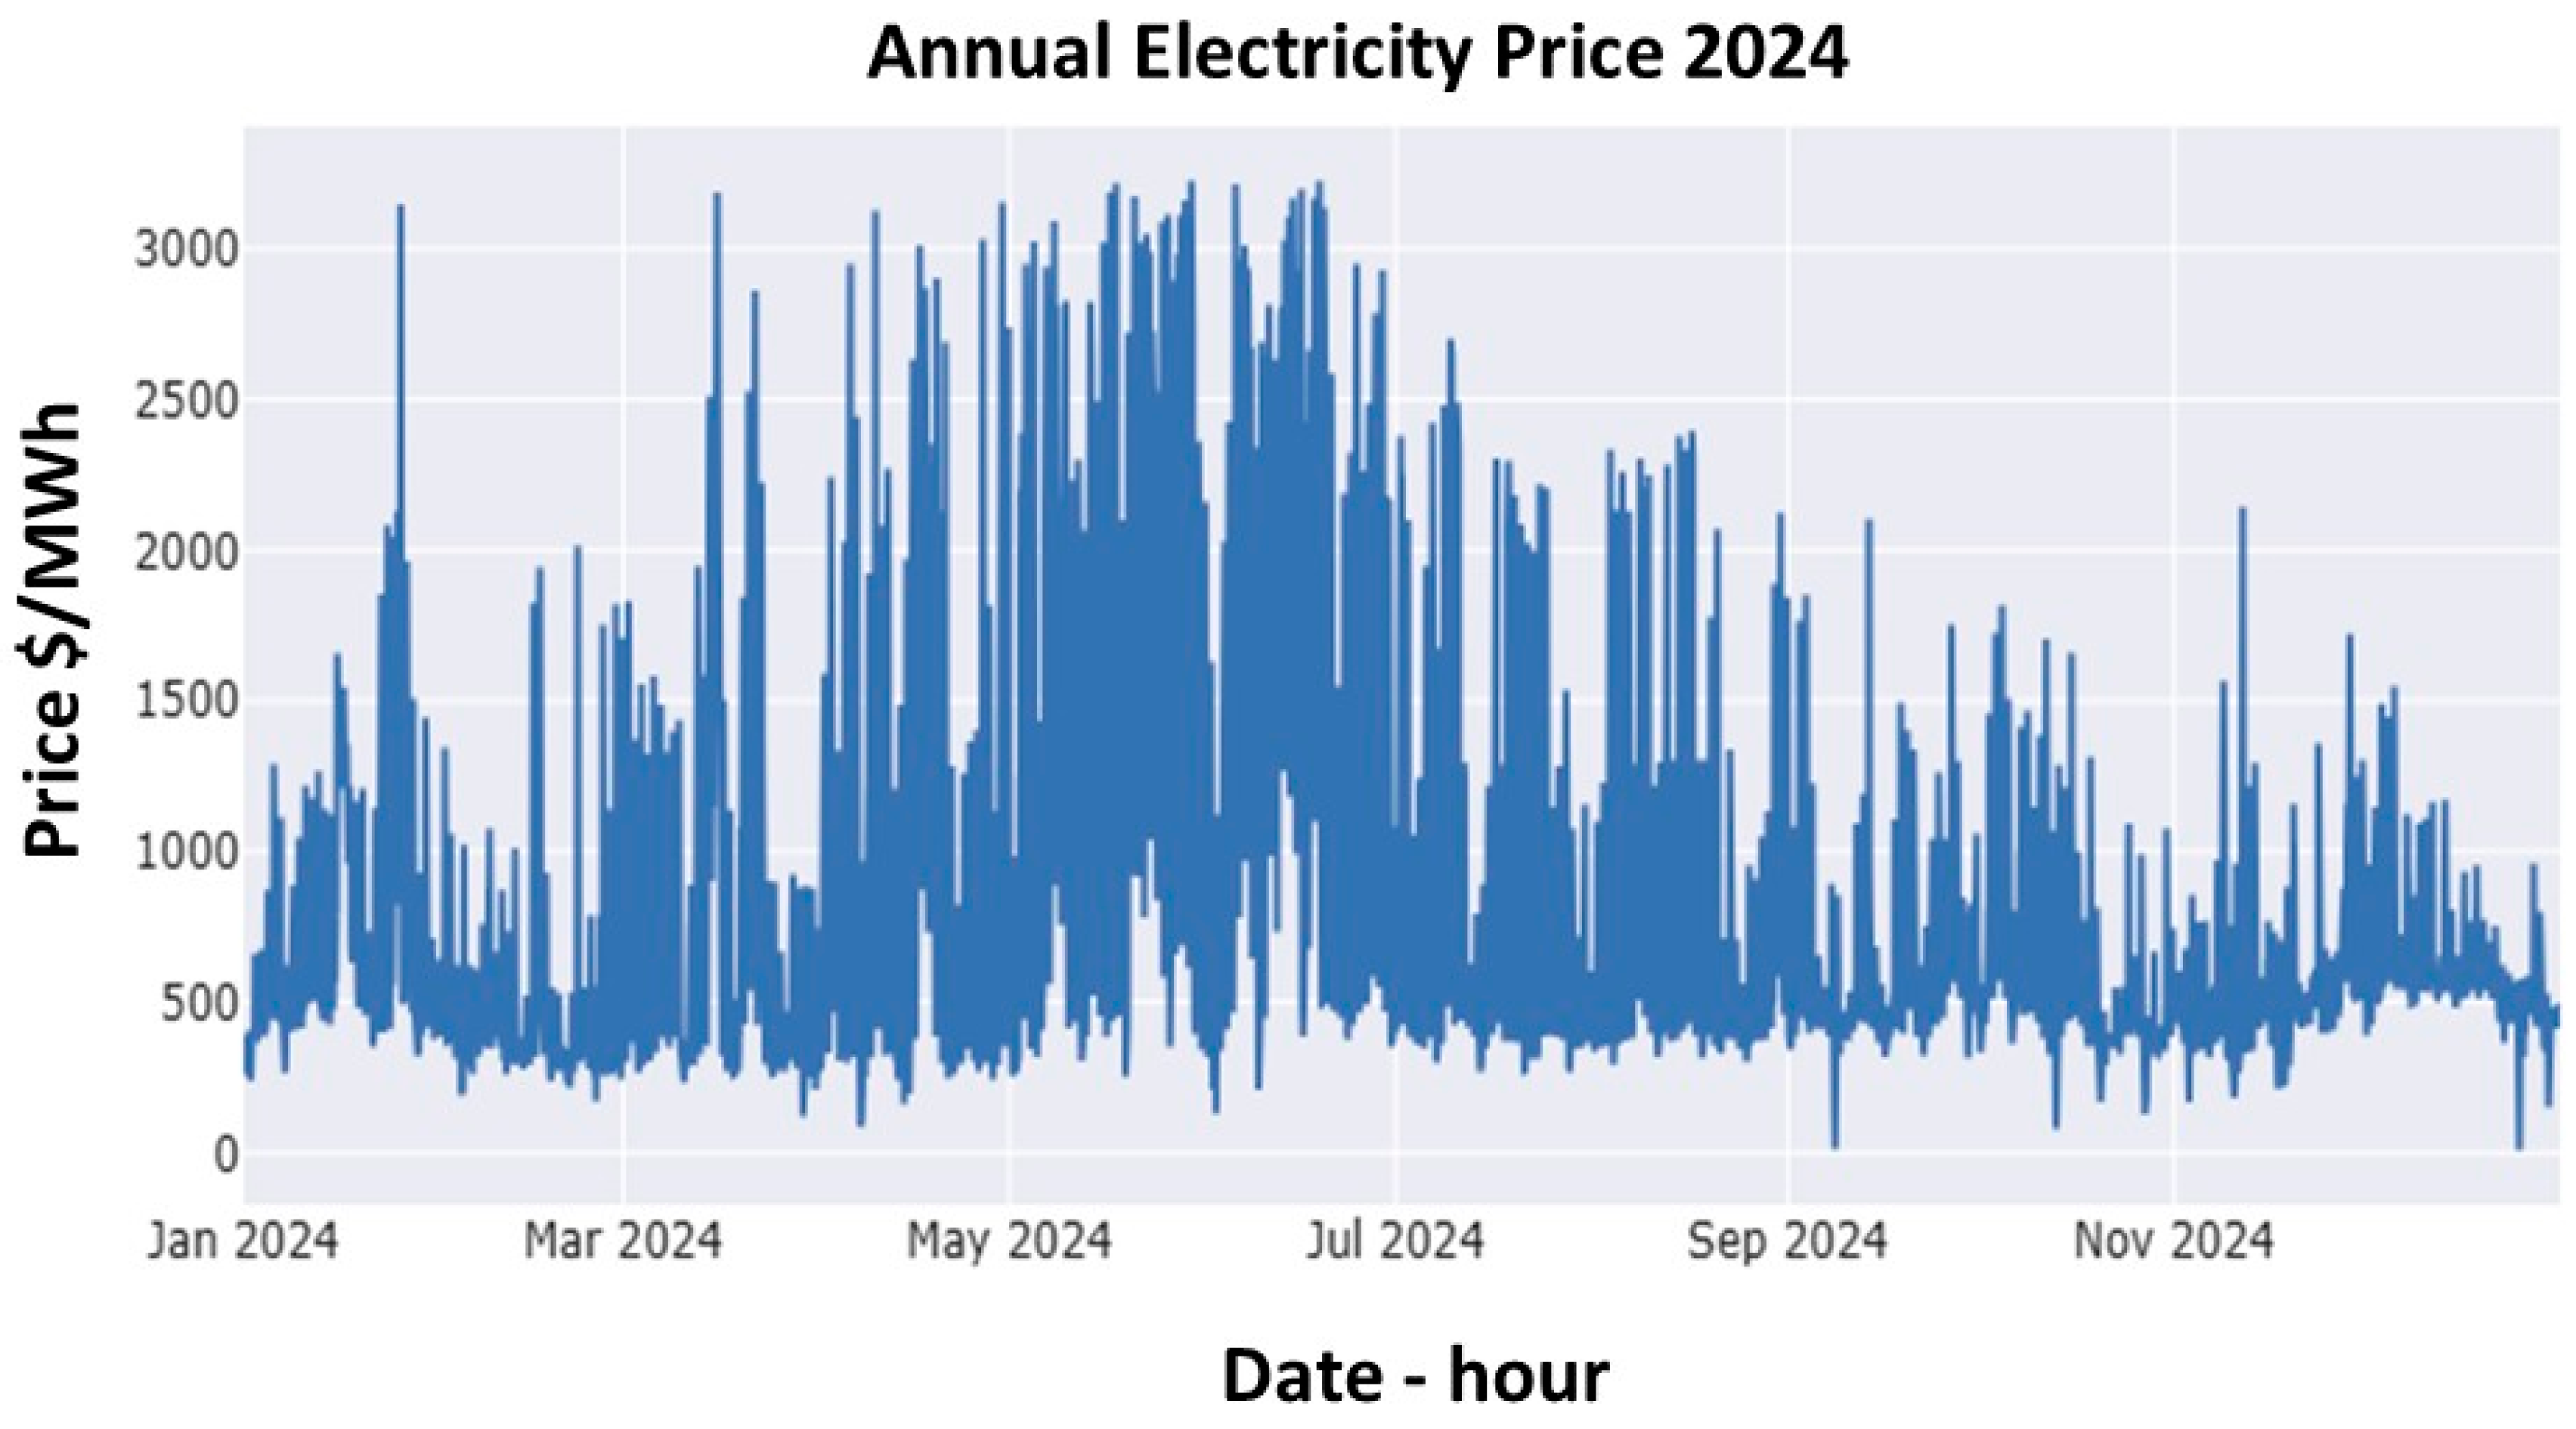
The data on historical electricity prices by node were obtained from the CENACE site. The data show the three components: energy, congestion, and losses on an hourly basis over a period from 2021 to 2024. During this period, 35,000 historical records were analyzed (one per hour per node). Additionally, historical data on the variables that influence electricity prices were obtained, such as temperature (°C) and fuel price on an hourly basis during the same period. The time series of the historical electricity price for node 01AUO-115 for the year 2024 is shown in Figure 5.

4.3. Data Analysis

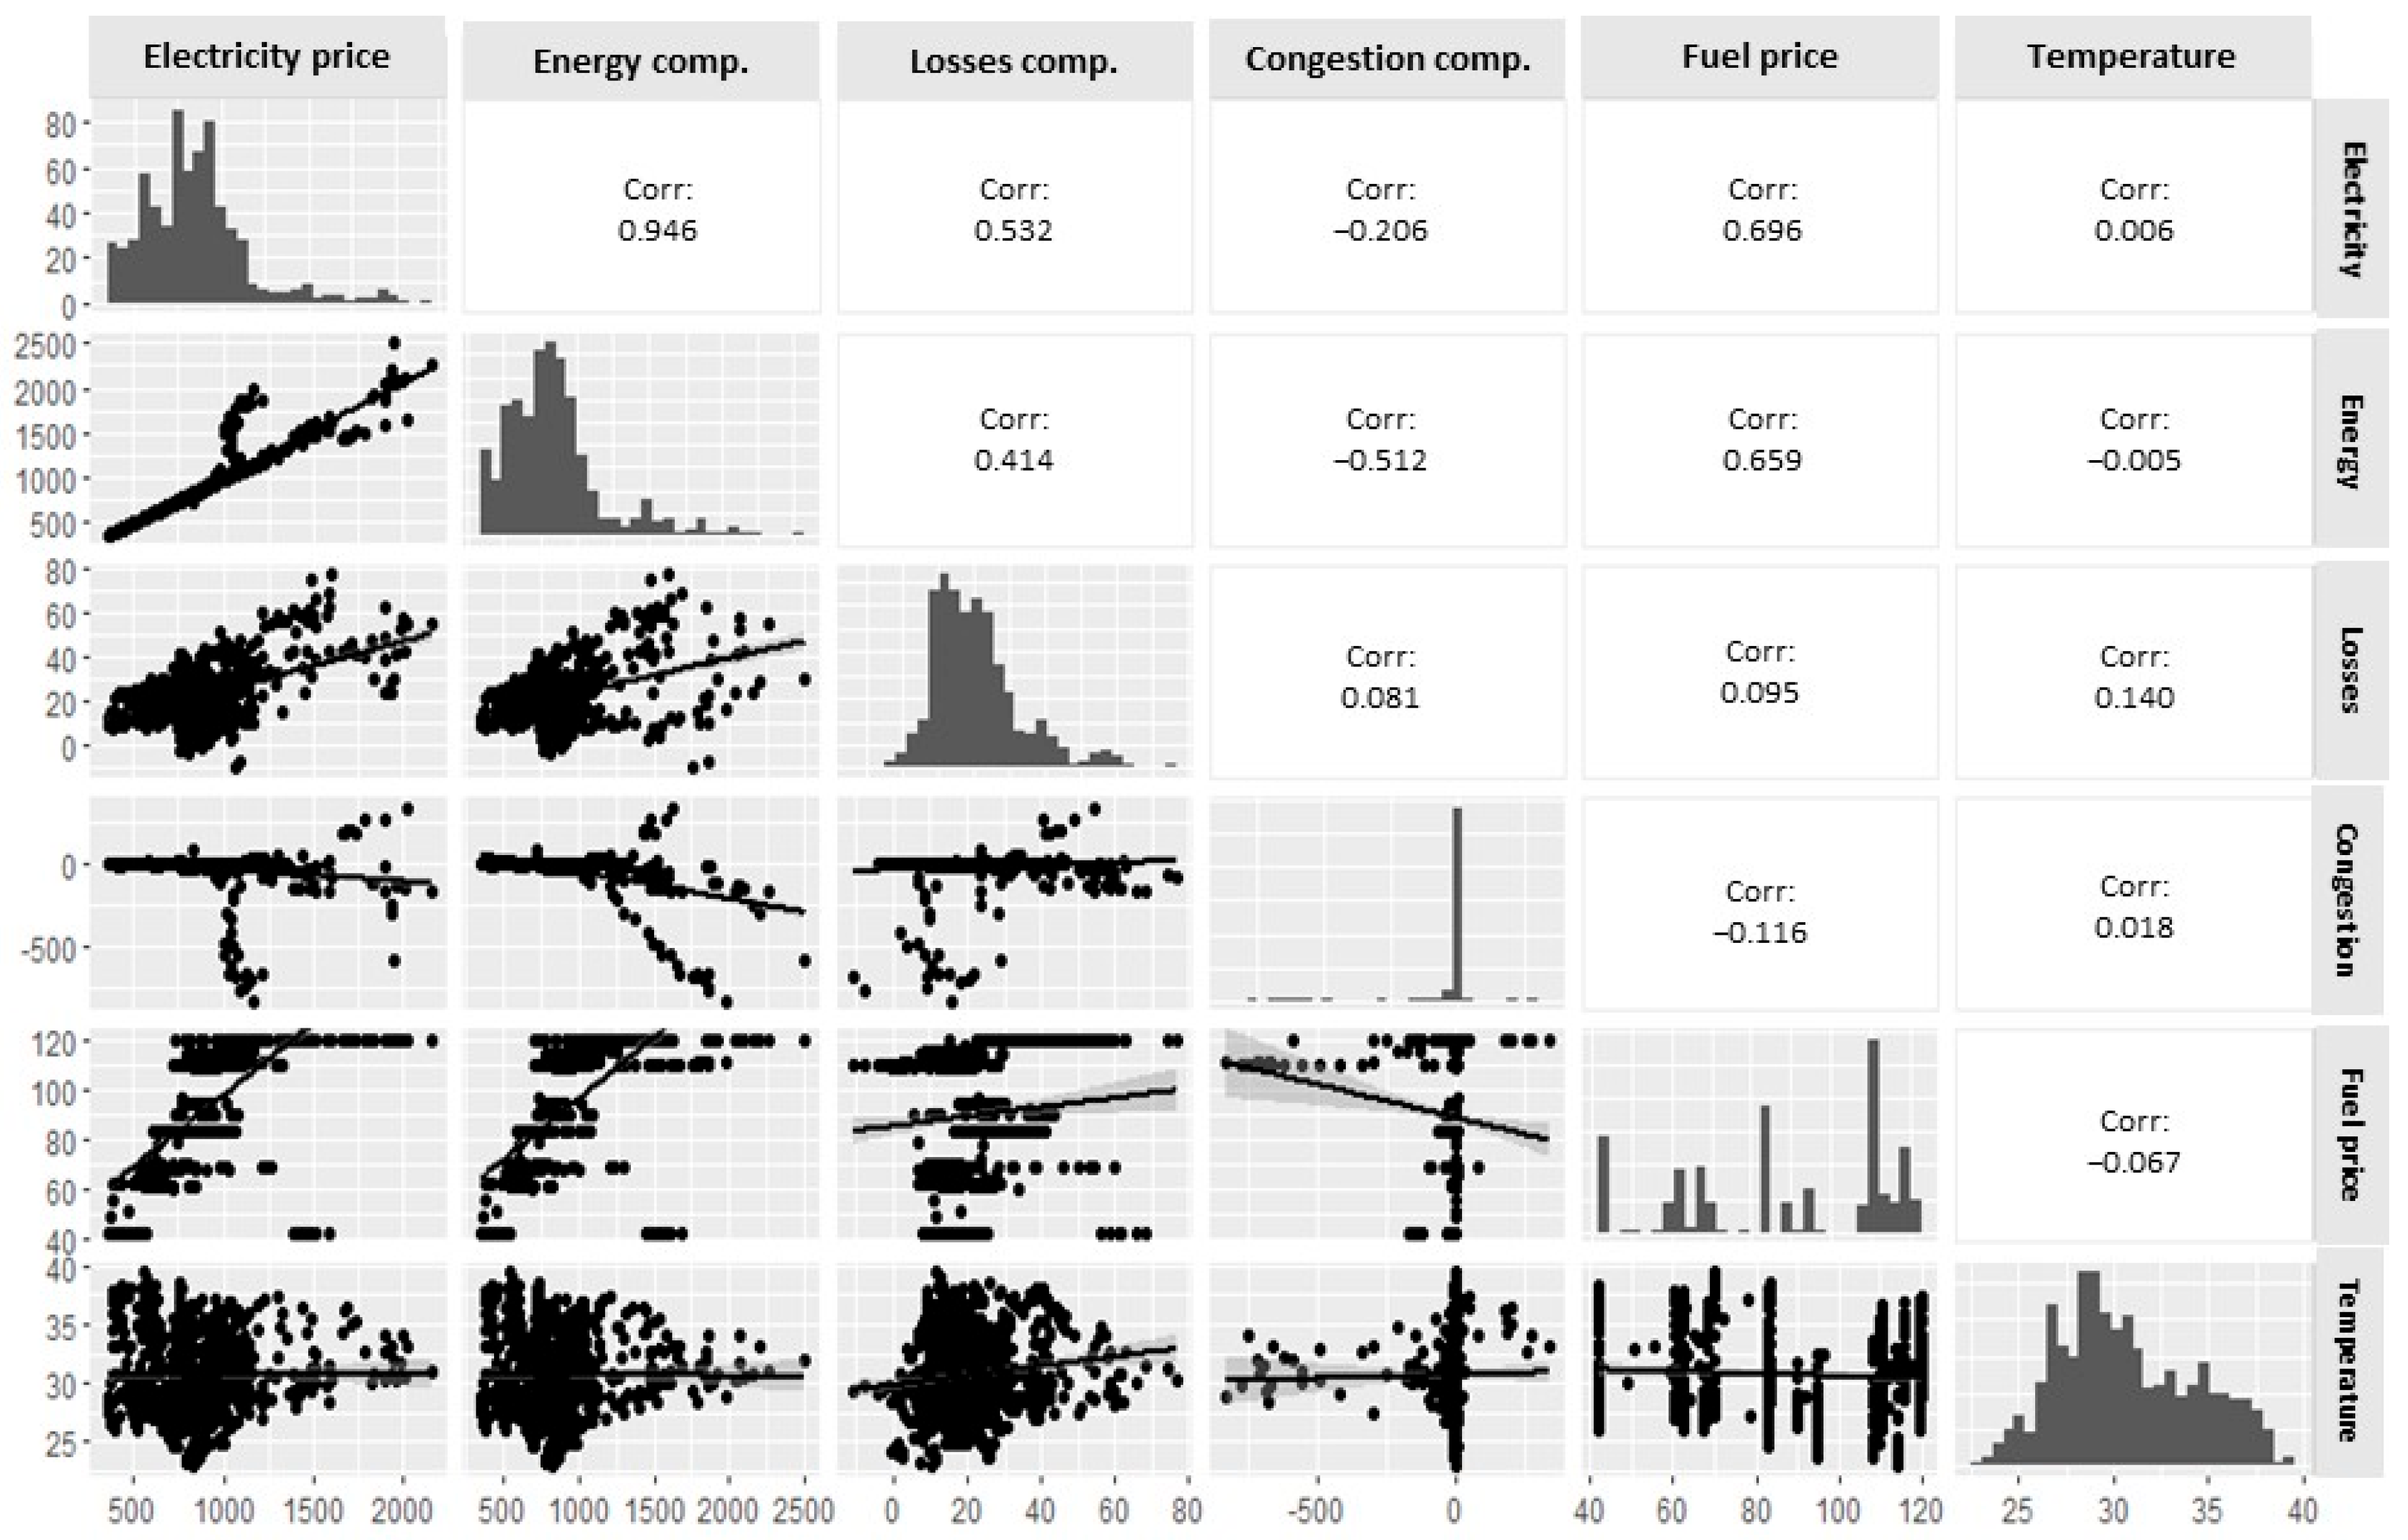
In order to find relationships between the available influencing variables (independent variables), a correlation analysis was performed on the variable of interest (dependent variable) with each of the variables. Correlation is the degree of relationship between two variables; that is, two variables are said to be correlated when an increase or decrease in one causes a change in the other [45]. Figure 6 presents a matrix with the results and graphs of the correlation analysis between the variables.
After performing the correlation analysis and estimating the coefficients, the variables most strongly correlated with the electricity price variable are Energy Component and Fuel Price. Conversely, the variables with the lowest correlation are Loss Component, Temperature, and Congestion Component.

4.4. Pre-Processing

To ensure that ML models are built accurately and reliably, raw data must be pre-processed. The pre-processing stage consists of three steps: (i) Data Cleaning: This refers to the process of identifying and correcting or removing null, incomplete, or outlier data, extraneous nomenclature, or symbols. (ii) Imputation: Generating null or missing data values. (iii) Normalization: Normalizing raw data to fit features to a standard scale.
Fortunately, for this study, most of the data obtained were complete, with no missing data or unusual nomenclature. Only in the case of the fuel price variable were certain missing data detected, necessitating an imputation process to complete them. In the case of the temperature variable, since reliable and sufficient information is currently lacking, synthetic data were obtained solely for understanding the experimental behavior of this variable.

4.5. Training and Evaluation Software

As a training and evaluation platform a work environment based on Python 3.10 as a programming language, Jupyter Notebook as a notebook, and Anaconda as a package and framework for the development and evaluation of models was used [46]. For pre-processing, standard Python packages such as NumPy [47] and pandas [48] were used. The sklearn [49] package for training ML models, including RF and GBoost, was used. To implement an LSTM network, the Keras deep learning library was used.

5. Comparative Analysis of Electricity Price-Forecasting Models

To build and select the best forecasting model per node, the following steps were performed: (i) selection of the historical time series of local electricity prices per node; (ii) model selection and construction; and (iii) model performance evaluation. These steps were applied to each node of the SEN.

5.1. Data Selection

To demonstrate the methodology and results obtained from the electricity price forecast, six nodes of SIN were selected. The nodes were selected based on their characteristics so that they can be generalized to electricity price forecasting for other nodes with similar characteristics. The annual database of the electricity price history was divided into learning (88%), validation (10%), and testing (2%) databases. Table 2 shows the selected nodes and their characteristics.

5.2. Forecasting Model Training

Node 06MON-115 was taken as an example to describe the methodology used and to select the best forecast model. Nine models were selected, taking into account the characteristics of the time series of electricity price, forecasting objective, and previous work carried out on energy forecasting (demand, consumption, energy generation, electricity price) [50]. Two statistical models—Autoregressive Integrated Moving Average (ARIMA), Box–Cox transformation, ARIMA errors, and Trend and Seasonal components (BATS)—and seven ML models—Random Forest (RF), Gradient Boosting (GB), Light Gradient Boosting M (LGBM), Extreme Gradient Boosting (XGB), Support Vector Regression (SVR), artificial neural network (ANN), and long short-term memory (LSTM)—were used. A grid search cross-validation procedure with k = 5 folds, and the Adam optimizer was used. The optimized parameters of the forecasting models for node 01AUO-115 are shown in Table 3.

5.3. Forecast Model Performance for Node 01AUO-115

The models were evaluated according to the classic accuracy metrics used for time series forecasting models [51]: Mean Absolute Error (MAE), Root Mean Square Error (RMSE), Mean Absolute Percentage Error (MAPE), and the coefficient of determination (R2). The testing performance of the statistical and ML models for node 01AUO-115 for 7-day forecasting is shown in Table 4. The best-performing model is highlighted in bold. In general, the best-performing model is the SVR model for all four performance metrics. This model outperformed the rest of the models, both statistical and ML models. It can be seen that SVR presents a slightly better performance than GB and XGB. Therefore, the SVR model appears as the model with the best overall performance for electricity price forecasting of node 01AUO-115.
Figure 7 shows a comparison between the real and forecast values for a 7-day forecast. It can be seen that the SVR model follows the electricity price curve with great accuracy from 25 March 2024 to 1 April 2024, with the exception of 29 March 2024, when the real value is lower than the forecast. This demonstrates the predictive capacity of the SVR model to forecast electricity prices at a node in the electricity system.

5.4. Forecasting Models for Six Nodes

To select the best forecasting model for each of the SEN nodes, the same methodology presented previously was used to select the best forecasting model for node 01AUO-115. For each node, the nine proposed statistical and ML models were evaluated. The model that performed best according to all four metrics was selected. Table 5 shows the performance of the best forecasting models selected for each node.
The results show that the best-performing model is not always the same. The best-performing models for the six selected nodes are the SVR and XGB models. This indicates that there is no generalized model for all nodes, so it is necessary to build a model for each node. The selection of the best forecasting model depends on the data characteristics and forecast horizon. The results show that for electricity local price forecasting in the national electric system (SEN), an XGBoost model can be better than an LSTM model due to the specific characteristics of the dataset and the prediction horizon. In the case of the electricity price time series, the relevant information is found in the most recent (short-term) observations. This may be one of the reasons why XGBoost can outperform the LSTM model.
The model generated for each node can predict the seasonal behavior of the time series and generate values within the statistical variance. However, it is unable to predict excessive increases in the electricity price forecast in cases where external factors generate a disturbance. To improve this, it is necessary to include other external influencing variables in the model, such as climatological variables, day type of the week, energy price rules, hourly energy demand per node, energy supplied for each generator and contribution per node, reliability index of generator plants, etc.

6. AI–Big Data Analytics Platform

The best forecast models for each node were implemented in the AI–Big Data Analytics Platform, taking the generated energy, congestion, and loss components as covariates, using historical data to fit the statistical model, and calculating the forward forecast for the next 1 or 5 days for each node, as shown in Figure 8.
The selected models per node are stored and executed to calculate the day forecast at each node. Taking hourly data of energy, loss, and congestion components, forecasts for the next 5 days are calculated, and the results are stored in the data repository. The forecast period can be adjusted according to requirements.
The forecast “1 or 5” days in advance is queried from a Microsoft Power BI Pro dashboard through a connection to Apache Hive, and the actual and forecasted electricity price information is extracted. The mean absolute percentage error is measured periodically each month, and the models can be recalibrated with historical data, incorporating the most recent data.
Local price forecasting deployment was automated using processes of periodic data extraction, forecast calculation, and results query in R scripts within agents that run periodically (every 24 h) scheduled in Apache Airflow.
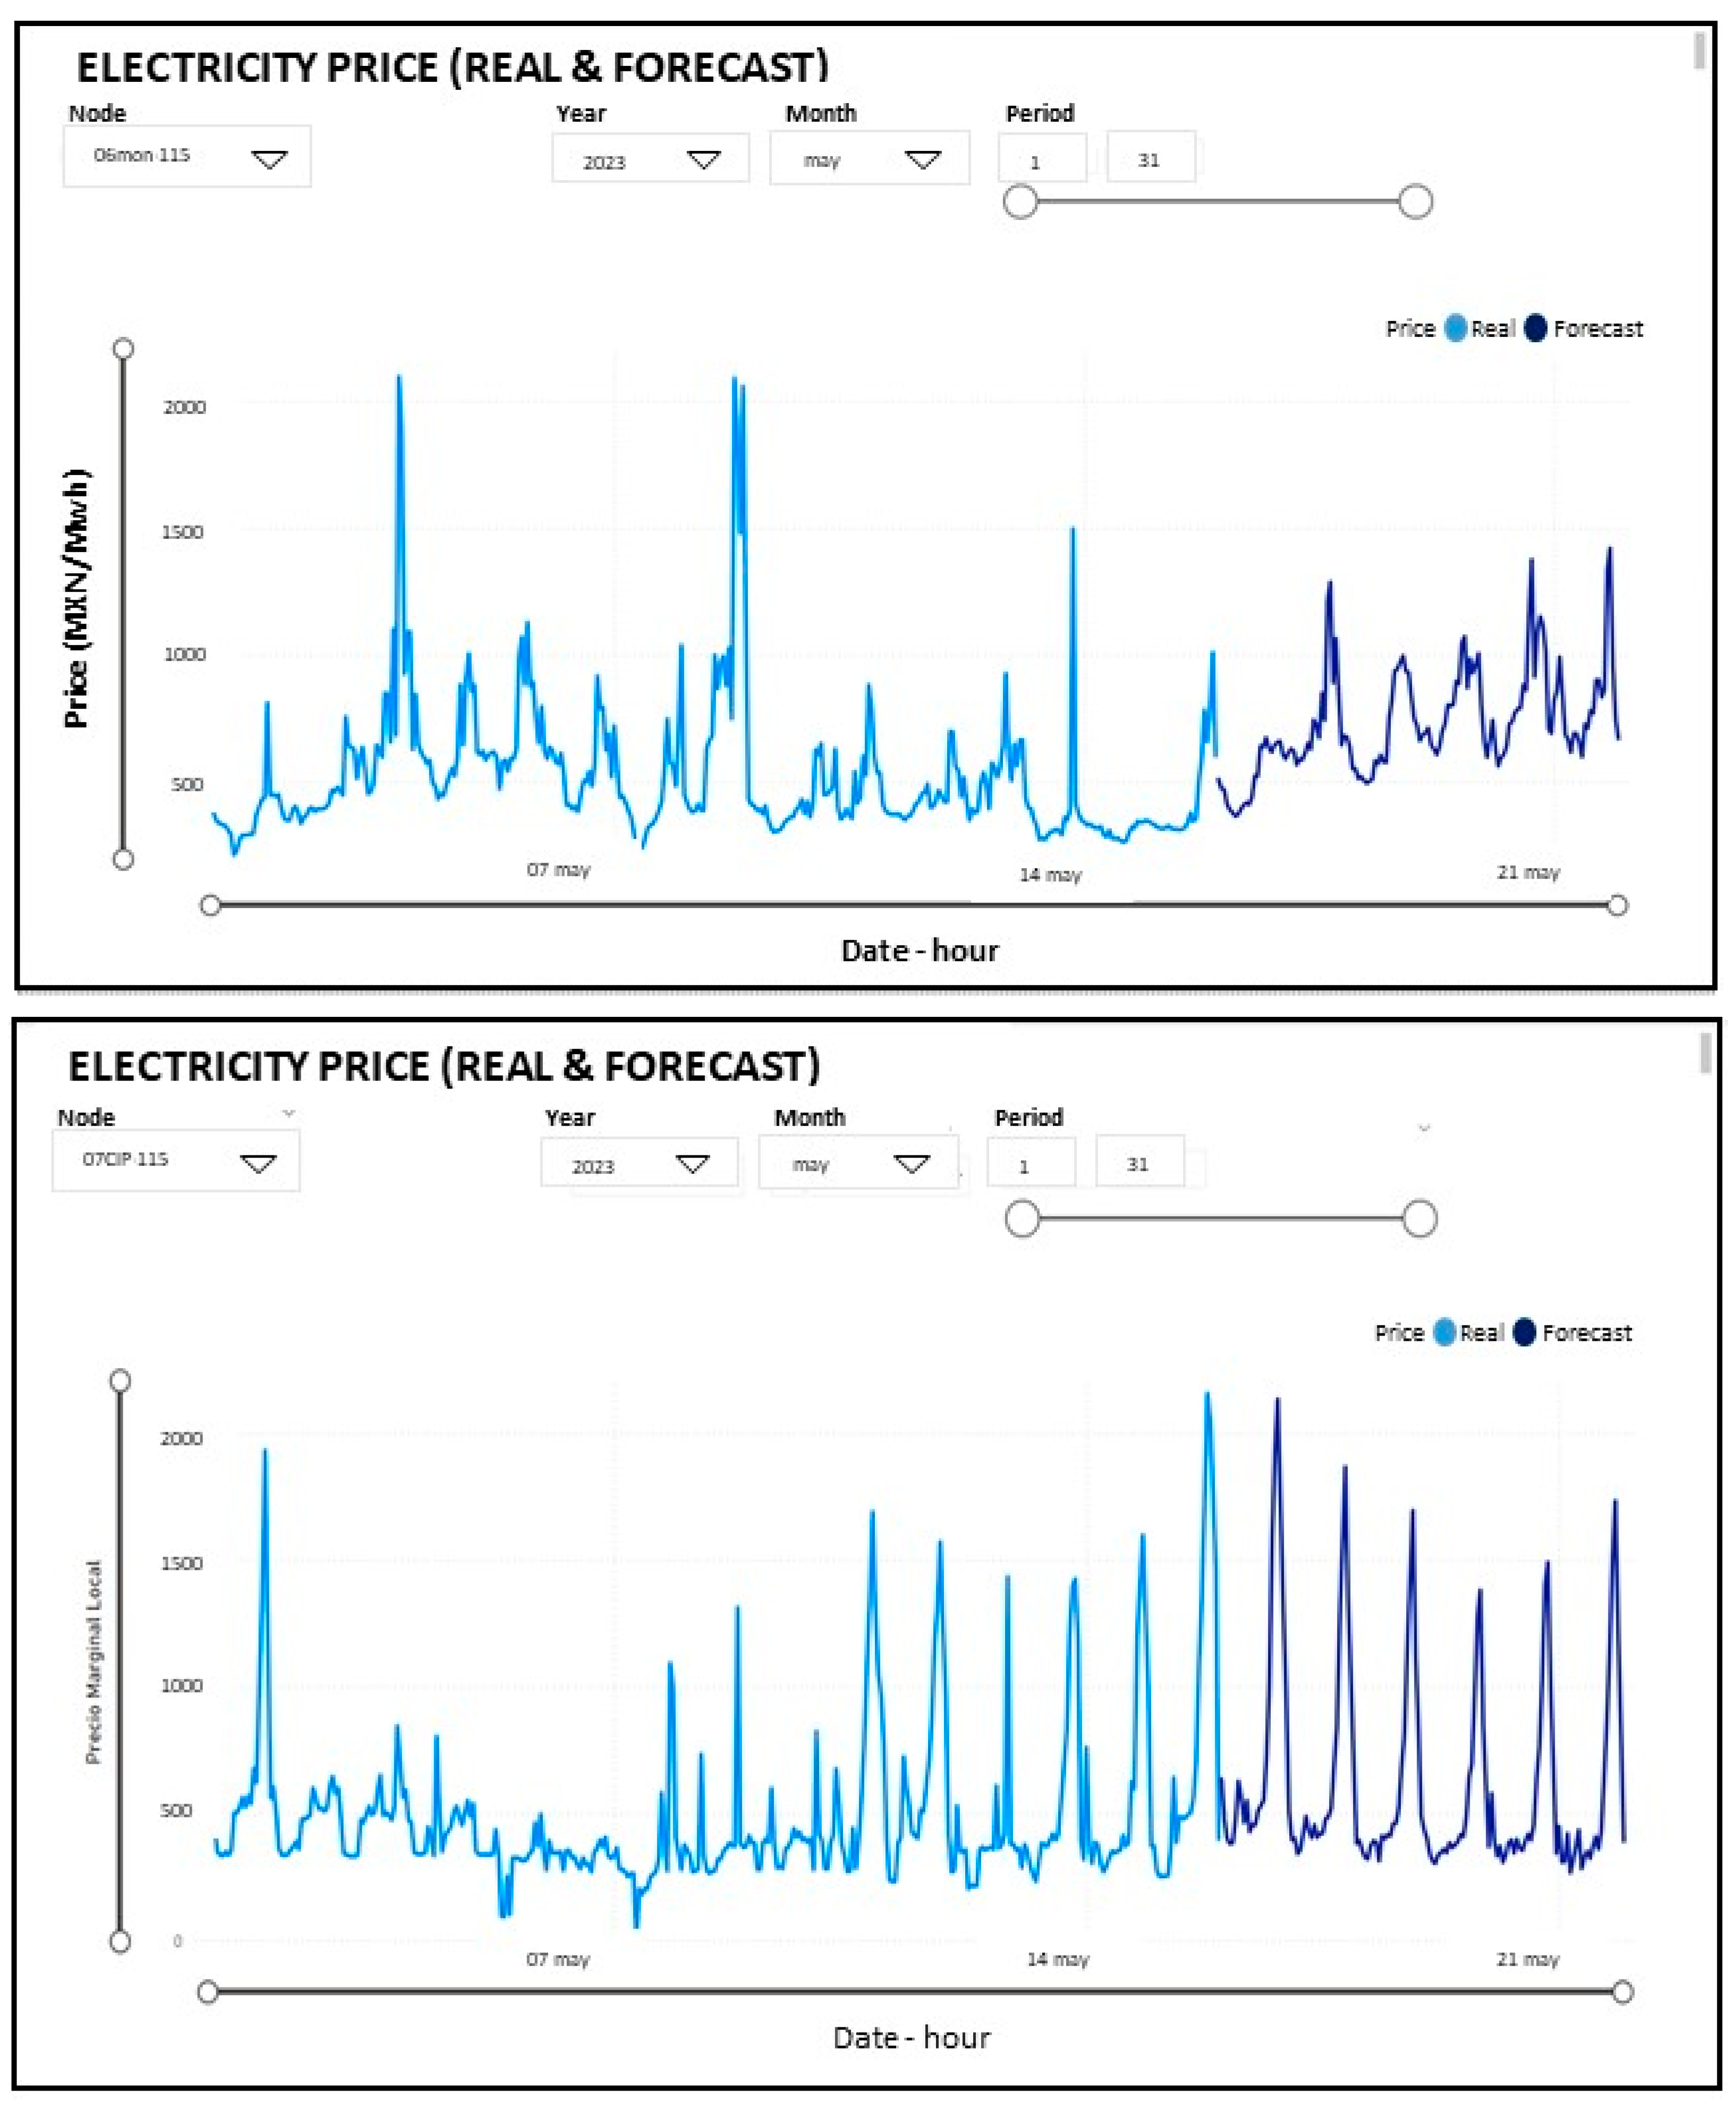
Figure 9 shows some screenshots of the descriptive and prescriptive data analytics graphs obtained from the Power BI dashboard implemented by node, which show the behavior of the forecasting models.
In this dashboard, you can select the node and the period you wish to query, displaying the graph corresponding to the selected node. The system generates the forecast for selected nodes of the electric system in 15 min based on the availability of the previous day’s data. The dashboard extracts new information from the repository incrementally, so it updates almost instantly, with data refreshed every 24 h. The model selected for each node is retrained every 24 h using a 4-week historical data window. This window is shifted daily. The graphics in Figure 9 show the 5-day forecasts calculated each day. The descriptive analytics of the time series data are presented as a light blue line, which corresponds to electricity price (MXN/MWh) from 01 to 17 May 2023. The predictive analytics of the time series are shows in a black-blue line, which corresponds to forecast electricity price (MXN/MWh) from 18 to 22 May 2023.
These results are useful for the wholesale electricity market’s marketing department for bidding energy in the day-ahead market. The AI–Big Data Analytics Platform is a valuable tool that allows for the implementation of intelligent energy forecast models in power grids, such as hourly electricity demand, fuel prices, power generation, and consumption, among others.

7. Conclusions

This work aims to propose a Big Data Analytics platform powered by AI and machine learning, leveraging open-source tools as a cost-effective solution for energy systems. It presents a case study on the comparative analysis of statistical and ML models for electricity price forecasting in the Mexican market. The results demonstrate how relatively simple models such as SVR and XGB can achieve strong forecasting performance in practical settings, rather than relying on complex (LSTM) or state-of-the-art models (like transformers). This is a practical case of ML applied to automate and improve prediction accuracy of electricity price forecasting using the proposed platform.
The platform proposed, based on a data lake architecture, uses a reduced and customized set of Hadoop and Spark. This platform is a cost-effective, on-premises solution that can be scaled horizontally, enabling distributed and concurrent processing, adapted to the information technological infrastructure of the electric company and serving to generate and process advanced AI predictive models and new forms of data analysis. In addition, the choice of a data lake architecture is mainly to allow high flexibility and scalability. These two characteristics allow the implementation of robust data analysis models for tasks such as energy forecasting, fault detection, and maintenance, among others
To select the best local electricity price forecasting model, a comparative analysis of statistical, ML, and DL models is presented. For this purpose, nine models were evaluated: two statistical (ARIMA, BATs), six ML (RF, GB, GBM, XGB, SVR, and ANN), and one DL (LSTM). The hyperparameters of the ML models were optimized using a grid search cross-validation procedure and Adam optimizer for ANN and LSTM. The results show that the SVR and XGB models perform better for each particular node, with a MAPE error between 1 and 4%. The selection of the best forecasting model depends on the time series characteristics; for this comparative analysis, only the historical time series of the electricity price was used. The LSTM model presented inferior performance because it requires additional external influencing variables, such as climatological variables, day type of the week, energy price rules, hourly energy demand per node, type of energy supplied for each generator and contribution, reliability index of generator plants, etc., which allow it to better model the behavior of the time series. The models were evaluated for all nodes of the national electrical system.
The implementation of the best forecasting model into the Big Data Analytics Platform allows for the automation of the calculation of the local electricity price forecast per node daily (every 24, 72, or 120 h) and its display in a comparative dashboard with actual and forecasted data for decision-making on demand.
As future work, we will implement demand forecasting models, electricity consumption forecasting models, and renewable energy generation forecasting models in the proposed architecture. However, this platform will also allow us to implement fault detection models for power grid systems and assets, as well as pattern recognition.

Author Contributions

Conceptualization, G.A.-F.; software, M.S.-D.; validation, G.A.-F. and I.A.P.-R.; investigation, M.S.-D. and G.A.-F.; data curation, M.S.-D. and N.H.F.; writing—original draft, G.A.-F.; writing—review and editing, supervision, I.A.P.-R. All authors have read and agreed to the published version of the manuscript.

Funding

This research received no external funding.

Institutional Review Board Statement

Not applicable.

Informed Consent Statement

Not applicable.

Data Availability Statement

The raw data supporting the conclusions of this article will be made available by the authors on request.

Acknowledgments

The authors would like to thank the Instituto Nacional de Electricidad y Energías Limpias for its comments and reviews.

Conflicts of Interest

The authors declare no conflicts of interest.

References

  1. Liao, H.; Michalenko, E.; Vegunta, S.C. Review of Big Data Analytics for Smart Electrical Energy Systems. Energies 2023, 16, 3581. [Google Scholar] [CrossRef]
  2. Arroyo-Figueroa, G. Editorial: An overview of Applied Artificial Intelligence in Power Grids. Int. J. Comb. Optim. Probl. Inform. 2024, 15, 1–6. [Google Scholar] [CrossRef]
  3. Wang, Y.; Chen, Q.; Hong, T.; Kang, C. Review of Smart Meter Data Analytics: Applications, Methodologies, and Challenges. IEEE Trans. Smart Grid 2019, 10, 3125–3148. [Google Scholar] [CrossRef]
  4. Zhou, K.; Fu, C.; Yang, S. Big data driven smart energy management: From big data to big insights. Renew. Sustain. Energy Rev. 2016, 56, 215–225. [Google Scholar] [CrossRef]
  5. Jiang, H.; Wang, K.; Wang, Y.; Gao, M.; Zhang, Y. Energy big data: A survey. IEEE Access 2016, 4, 3844–3861. [Google Scholar] [CrossRef]
  6. Guerrero-Prado, J.S.; Alfonso-Morales, W.; Caicedo-Bravo, E.; Zayas-Pérez, B.; Espinosa-Reza, A. The Power of Big Data and Data Analytics for AMI Data: A Case Study. Sensors 2020, 20, 3289. [Google Scholar] [CrossRef] [PubMed]
  7. Zhang, Y.; Huang, T.; Bompard, E.F. Big data analytics in smart grids: A review. Energy Inform. 2018, 1, 8. [Google Scholar] [CrossRef]
  8. Kezunovic, M.; Pinson, P.; Obradovic, Z.; Grijalva, S.; Hong, T.; Bessa, R. Big data analytics for future electricity grids. Electr. Power Syst. Res. 2020, 189, 106788. [Google Scholar] [CrossRef]
  9. Syed, D.; Zainab, A.; Ghrayeb, A.; Refaat, S.S.; Abu-Rub, H.; Bouhali, O. Smart Grid Big Data Analytics: Survey of Technologies, Techniques, and Applications. IEEE Access 2021, 9, 59564–59585. [Google Scholar] [CrossRef]
  10. Escobedo, G.; Jacome, N.; Arroyo-Figueroa, G. Big Data & Analytics to Support the Renewable Energy Integration of Smart Grids—Case Study: Power Solar Generation. In Proceedings of the 2nd International Conference on Internet of Things, Big Data and Security IoTBDS, Porto, Portugal, 24–26 April 2017; Volume 1, pp. 267–275. [Google Scholar] [CrossRef]
  11. Alhamrouni, I.; Abdul Kahar, N.H.; Salem, M.; Swadi, M.; Zahroui, Y.; Kadhim, D.J.; Mohamed, F.A.; Alhuyi Nazari, M. A Comprehensive Review on the Role of Artificial Intelligence in Power System Stability, Control, and Protection: Insights and Future Directions. Appl. Sci. 2024, 14, 6214. [Google Scholar] [CrossRef]
  12. Seyedan, M.; Mafakheri, F. Predictive big data analytics for supply chain demand forecasting: Methods, applications, and research opportunities. J. Big Data 2020, 7, 53. [Google Scholar] [CrossRef]
  13. Mohanty, A.; Ramasamy, A.K.; Verayiah, R.; Bastia, S.; Dash, S.S.; Elahi, M.; Soudagar, M.; Khan, T.M.Y.; Cuce, E. Smart grid and application of big data: Opportunities and challenges. Sustain. Energy Technol. Assess. 2024, 71, 104011. [Google Scholar] [CrossRef]
  14. Barja-Martinez, S.; Aragüés-Peñalba, M.; Munné-Collado, Í.; Lloret-Gallego, P.; Bullich-Massagué, E.; Villafafila-Robles, R. Artificial intelligence techniques for enabling Big Data services in distribution networks: A review. Renew. Sustain. Energy Rev. 2021, 150, 111459. [Google Scholar] [CrossRef]
  15. Huang, L. Intelligent Condition Monitoring and Fault Diagnosis of Generator based on Internet of Things and Big Data Technology. In Proceedings of the 2023 IEEE 13th International Conference on Electronics Information and Emergency Communication (ICEIEC), Beijing, China, 14–16 July 2023; pp. 85–89. [Google Scholar]
  16. Wang, X.; Duan, Z. Application of Artificial Intelligence Technology in Power Equipment Condition Prediction and Maintenance. In Proceedings of the International Conference on Power, Electrical Engineering, Electronics and Control (PEEEC), Athens, Greece, 25–27 September 2023; pp. 86–90. [Google Scholar] [CrossRef]
  17. Kaytez, F.; Taplamacioglu, M.C.; Cam, E.; Hardalac, F. Forecasting electricity consumption: A comparison of regression analysis, neural networks and least squares support vector machines. Int. J. Electr. Power Energy Syst. 2015, 67, 431–438. [Google Scholar] [CrossRef]
  18. Ahmad, T.; Madonski, R.; Zhang, D.; Huang, C.; Mujeeb, A. Data-driven probabilistic machine learning in sustainable smart energy/smart energy systems: Key developments, challenges, and future research opportunities in the context of smart grid paradigm. Renew. Sustain. Energy Rev. 2022, 160, 112128. [Google Scholar] [CrossRef]
  19. Diamantoulakis, P.D.; Kapinas, V.M.; Karagiannidis, G.K. Big Data Analytics for Dynamic Energy Management in Smart Grids. Big Data Res. 2015, 2, 94–101. [Google Scholar] [CrossRef]
  20. Hong, T.; Pinson, P.; Wang, Y.; Weron, R.; Yang, D.; Zareipour, H. Energy Forecasting: A Review and Outlook. J. Power Energy 2020, 7, 376–388. [Google Scholar] [CrossRef]
  21. Kuster, C.; Rezgui, Y.; Mourshed, M. Electrical load forecasting models: A critical systematic review. Sustain. Cities Soc. 2017, 35, 257–270. [Google Scholar] [CrossRef]
  22. Ren, Y.; Suganthan, P.N.; Srikanth, N. Ensemble methods for wind and solar power forecasting—A state-of-the-art review. Renew. Sustain. Energy Rev. 2015, 50, 82–91. [Google Scholar] [CrossRef]
  23. Klyuev, R.V.; Morgoev, I.D.; Morgoeva, A.D.; Gavrina, O.A.; Martyushev, N.V.; Efremenkov, E.A.; Mengxu, Q. Methods of Forecasting Electric Energy Consumption: A Literature Review. Energies 2022, 15, 8919. [Google Scholar] [CrossRef]
  24. Lago, J.; Marcjasz, G.; Schutter, B.; Weron, R. Forecasting day-ahead electricity prices: A review of state-of-the-art algorithms, best practices and an open-access benchmark. Appl. Energy 2021, 293, 116983. [Google Scholar] [CrossRef]
  25. Lago, J.; De Ridder, F.; De Schutter, B. Forecasting spot electricity prices: Deep learning approaches and empirical comparison of traditional algorithms. Appl. Energy 2018, 221, 386–405. [Google Scholar] [CrossRef]
  26. Yang, Z.; Ce, L.; Lian, L. Electricity price forecasting by a hybrid model, combining wavelet transform, ARMA and kernel-based extreme learning machine methods. Appl. Energy 2017, 190, 291–305. [Google Scholar] [CrossRef]
  27. Kılıç, D.K.; Nielsen, P.; Thibbotuwawa, A. Intraday Electricity Price Forecasting via LSTM and Trading Strategy for the Power Market: A Case Study of the West Denmark DK1 Grid Region. Energies 2024, 17, 2909. [Google Scholar] [CrossRef]
  28. Dudek, G. A Comprehensive Study of Random Forest for Short-Term Load Forecasting. Energies 2022, 15, 7547. [Google Scholar] [CrossRef]
  29. Zhao, X.; Li, Q.; Xue, W.; Zhao, Y.; Zhao, H.; Guo, S. Research on Ultra-Short-Term Load Forecasting Based on Real-Time Electricity Price and Window-Based XGBoost Model. Energies 2022, 15, 7367. [Google Scholar] [CrossRef]
  30. Narajewski, M. Probabilistic forecasting of German electricity imbalance prices. Energies 2022, 15, 4976. [Google Scholar] [CrossRef]
  31. O’Connor, C.; Collins, J.; Prestwich, S.; Visentin, A. Electricity Price Forecasting in the Irish Balancing Market. Energy Strategy Rev. 2024, 54, 101436. [Google Scholar] [CrossRef]
  32. Zahid, M.; Ahmed, F.; Javaid, N.; Abbasi, R.A.; Zainab Kazmi, H.S.; Javaid, A.; Bilal, M.; Akbar, M.; Ilahi, M. Electricity price and load forecasting using enhanced convolutional neural network and enhanced support vector regression in smart grids. Electronics 2019, 8, 122. [Google Scholar] [CrossRef]
  33. Heidarpanah, M.; Hooshyaripor, F.; Fazeli, M. Daily electricity price forecasting using artificial intelligence models in the Iranian electricity market. Energy 2023, 263, 126011. [Google Scholar] [CrossRef]
  34. Sarnovsky, M.; Bednar, P.; Smatana, M. Big Data Processing and Analytics Platform Architecture for Process Industry Factories. Big Data Cogn. Comput. 2018, 2, 3. [Google Scholar] [CrossRef]
  35. Chen, C.L.P.; Zhang, C.-Y. Data-intensive applications, challenges, techniques and technologies: A survey on Big Data. Inf. Sci. 2014, 275, 314–347. [Google Scholar] [CrossRef]
  36. Pravin, A.K.; Dhawale, G.; Kumbhar, S.; Patil, U.; Magdum, P. A comprehensive review: Machine learning and its application in integrated power system. Energy Rep. 2021, 7, 5467–5474. [Google Scholar] [CrossRef]
  37. El-Afifi, M.I.; Sedhom, B.E.; Eladl, A.A.; Padmanaban, S. Survey of technologies, techniques, and applications for big data analytics in smart energy hub. Energy Strategy Rev. 2024, 56, 101582. [Google Scholar] [CrossRef]
  38. Ajah, I.A.; Nweke, H.F. Big Data and Business Analytics: Trends, Platforms, Success Factors and Applications. Big Data Cogn. Comput. 2019, 3, 32. [Google Scholar] [CrossRef]
  39. Nambiar, A.; Mundra, D. An Overview of Data Warehouse and Data Lake in Modern Enterprise Data Management. Big Data Cogn. Comput. 2022, 6, 132. [Google Scholar] [CrossRef]
  40. Buyya, R.; Calheiros, R.N.; Dastjerdi, A.V. Big Data Principles and Paradigmes; Morgan Kaufmann: San Francisco, CA, USA, 2023. [Google Scholar]
  41. Escobedo, G.; Jacome, N.; Arroyo-Figueroa, G. Design of a Technology Management Infrastructure for Large Volumes of Data in an Intelligent Power Network. Res. Comput. Sci. 2016, 122, 113–126. [Google Scholar] [CrossRef]
  42. Amaya-Sanchez, Q.; Argumedo, M.J.D.M.; Aguilar-Lasserre, A.A.; Reyes Martinez, O.A.; Arroyo-Figueroa, G. Fault Diagnosis in Power Generators: A Comparative Analysis of Machine Learning Models. Big Data Cogn. Comput 2024, 8, 145. [Google Scholar] [CrossRef]
  43. Programa Sectorial de Energía 2020–2024. Secretaria de Energia (SENER). 2024. Available online: https://www.gob.mx/cms/uploads/attachment/file/562631/PS_SENER_CACEC-DOF_08-07-2020.pdf (accessed on 23 May 2024).
  44. Sistema de Información del Mercado (SIM). Centro Nacional de Control de Energía (CENACE). 2024. Available online: https://www.gob.mx/cenace/acciones-y-programas/sistema-de-informacion-de-mercado-sim (accessed on 23 May 2024).
  45. Nielsen, A. Practical Time Series Analysis: Prediction with Statistics and Machine Learning. Oreilly Media Inc.: Sebastopol, CA, USA, 2019. [Google Scholar]
  46. Anaconda Software Distribution. 2025. Conda (Version 3-13.5). Available online: https://anaconda.org/anaconda/python (accessed on 27 July 2024).
  47. Oliphant, T.E. A Guide to NumPy. 2006. Volume 1. Available online: https://web.mit.edu/dvp/Public/numpybook.pdf (accessed on 27 July 2024).
  48. McKinney, W. Pandas: A foundational python library for data analysis and statistics. Python High Perform. Sci. Comput. 2011, 14, 1–9. [Google Scholar]
  49. Pedregosa, F.; Varoquaux, G.; Gramfort, A.; Michel, V.; Thirion, B.; Grisel, O.; Blondel, M.; Prettenhofer, P.; Weiss, R.; Dubourg, V.; et al. Scikit-learn: Machine learning in Python. J. Mach. Learn. Res. 2011, 12, 2825–2830. [Google Scholar]
  50. Mystakidis, A.; Koukaras, P.; Tsalikidis, N.; Ioannidis, D.; Tjortjis, C. Energy Forecasting: A Comprehensive Review of Techniques and Technologies. Energies 2024, 17, 1662. [Google Scholar] [CrossRef]
  51. St-Aubin, P.; Agard, B. Precision and Reliability of Forecasts Performance Metrics. Forecasting 2022, 4, 882–903. [Google Scholar] [CrossRef]
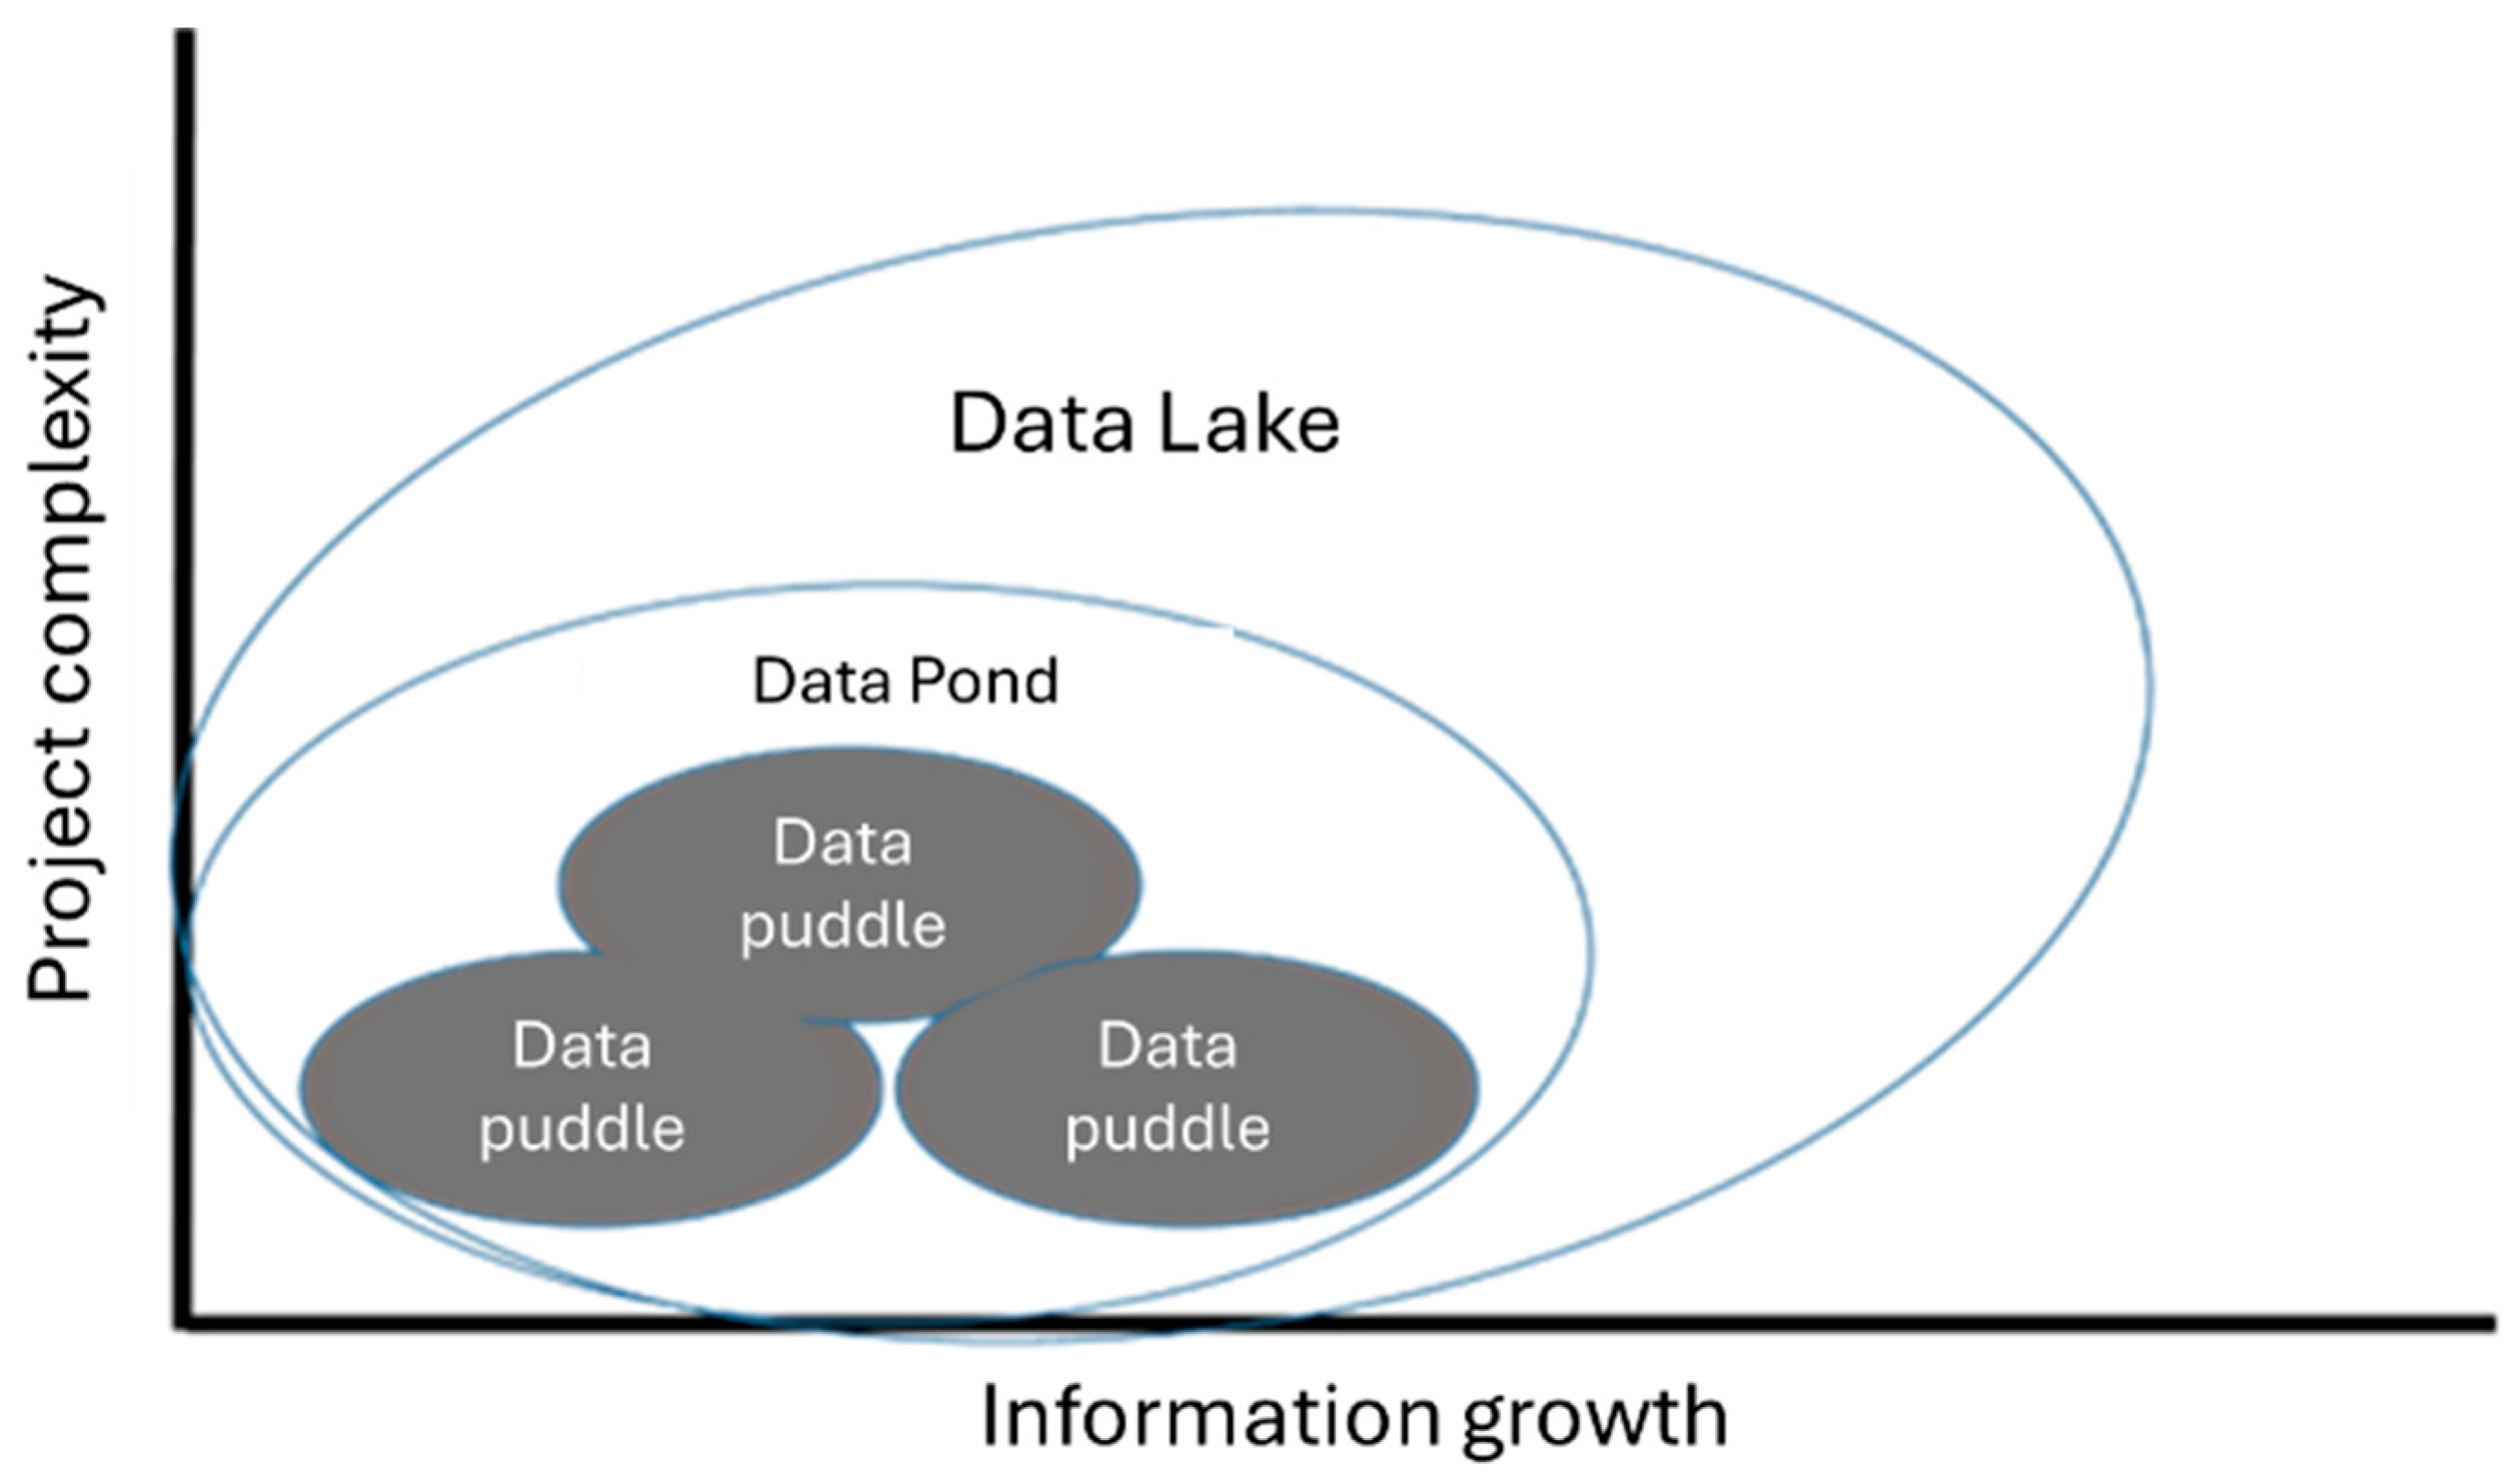
Figure 1. Big Data tools adoption model.
Bdcc 09 00272 g001
Figure 2. Repository growth structure.
Bdcc 09 00272 g002
Figure 3. Big Data Analytics architecture with open source tools.
Bdcc 09 00272 g003
Figure 4. DS-ML methodology for electricity price-forecasting models.
Bdcc 09 00272 g004
Figure 5. Time series of the historical electricity price for node 01AUO-115.
Bdcc 09 00272 g005
Figure 6. Correlation matrix between variables.
Bdcc 09 00272 g006
Figure 7. Seven-day forecast for node 01AUO-115 using the SVR model.
Bdcc 09 00272 g007
Figure 8. Electricity price forecast model implementation by node.
Bdcc 09 00272 g008
Figure 9. Dashboard forecasting electricity price of the AI–Big Data platform for the nodes 06MON-115 and 07CIP-115.
Bdcc 09 00272 g009
Table 1. Big Data platforms: open-source and commercial frameworks.
Big Data PlatformsMain CharacteristicsType
Apache HadoopAn open-source framework that enables distributed processing of massive datasets across clusters. Hadoop provides a scalable and cost-effective solution for storing, processing, and analyzing massive amounts of structured and unstructured data.Open source
Apache SparkA unified analytics engine for batch processing, streaming data, machine learning, and graph processing.Open source
Google Cloud BigQueryA powerful and accessible platform for organizations to unify data, connect it to AI, and automate data tasks, which provides a fully managed and serverless data warehouse solution.Commercial
Amazon EMR (MapReduce)A managed cluster platform from AWS for processing and analyzing large datasets using open source Big Data frameworks.Commercial
Microsoft Azure HDInsightProvides a fully managed cloud analytics service for processing and analyzing large datasets using open-source platforms in the Azure environment. Commercial
ClouderaA comprehensive suite of tools and services based on open source Big Data frameworks designed to manage and analyze large volumes of data. Commercial
IBM InfoSphere BigInsightsAn enterprise-focused Apache Hadoop platform that offers a range of tools to manage and analyze large volumes of structured as well as unstructured data in a reliable manner. Commercial
DatabricksA platform built on Apache Spark that simplifies the process of building, deploying, and managing big data and machine learning workflows by providing a cloud-based environment.Commercial
Table 2. Nodes selected for electricity price analysis and forecasting.
Node CodeVoltage Level (kV)Transmission ZoneCharacteristics
01AUO-115115CentralCentral regional control center node that presents negative congestion in most of the data.
07SAF-115115Baja California SurBaja California Sur regional control center node that presents zero congestion in most cases.
01TTH-230230NoresteNortheast regional control center node that presents zero congestion in most cases, followed by positive congestion.
08SLC-230230PeninsularEastern regional control center node that presents positive congestion in most of the data.
03AGM-400400OccidentalWestern regional control center node that presents zero congestion in most cases, followed by negative congestion.
02CBE-400400OrientalEastern regional control center node that presents zero congestion in most cases, followed by negative congestion.
Table 3. Forecasting model parameters.
ModelParameterValue Range
ARIMAorderp = 3, d = 0, q = 4
BATSSeasonal period120
RFRegressorn_estimators200
random_state42
GBRegressorn_estimators,200
max_depth,5
random_state42
LGBMRegressorn_estimators,200
max_depth,5
random_state42
XGBRegressorn_estimators,200
max_depth,5
base_score0.5
SVRkernel=rbf
C = 100100
epsilon0.5
ANN-MLPActivation functionReLU
OptimizerAdam
LSTMLearning_rate0.001–0.4
Epochs100
batch_size32
Activation functionReLU
OptimizerAdam
Table 4. Forecast models performance for node 01AUO-115.
ModelMAERMSEMAPER2
ARIMA57.3676.186.250.902412
BATS27.4934.093.150.984756
RF7.0915.692.380.991265
GB4.319.381.510.996879
LGBM8.8519.273.130.986819
XGB4.3510.461.410.996114
SVR2.955.661.210.998864
ANN34.1991.1910.200.700000
LSTM7.5918.772.600.990568
Table 5. Best-performing forecasting model for the six nodes.
NodeModelMAERMSEMAPER2
01AUO-115SVR2.955.661.210.998864
07SAF-115XGB3.244.511.150.999775
01TTH-230SVR1.874.480.80.999239
04PLD-230XGB110.19651.332.990.897721
03AGM-400SVR1.643.110.940.999547
02CBE-400XGB44.39342.502.440.927826
Disclaimer/Publisher’s Note: The statements, opinions and data contained in all publications are solely those of the individual author(s) and contributor(s) and not of MDPI and/or the editor(s). MDPI and/or the editor(s) disclaim responsibility for any injury to people or property resulting from any ideas, methods, instructions or products referred to in the content.