
Degradation of N-(n-butyl) Thiophosphoric Triamide (NBPT) with and without Nitrification Inhibitor in Soils


Abstract
:1. Introduction
2. Materials and Methods
2.1. Soil Characteristics
2.2. Experimental Design and Treatment Applications
2.3. Extraction and Analysis of NBPT
2.4. Kinetics and Statistical Analysis
3. Results
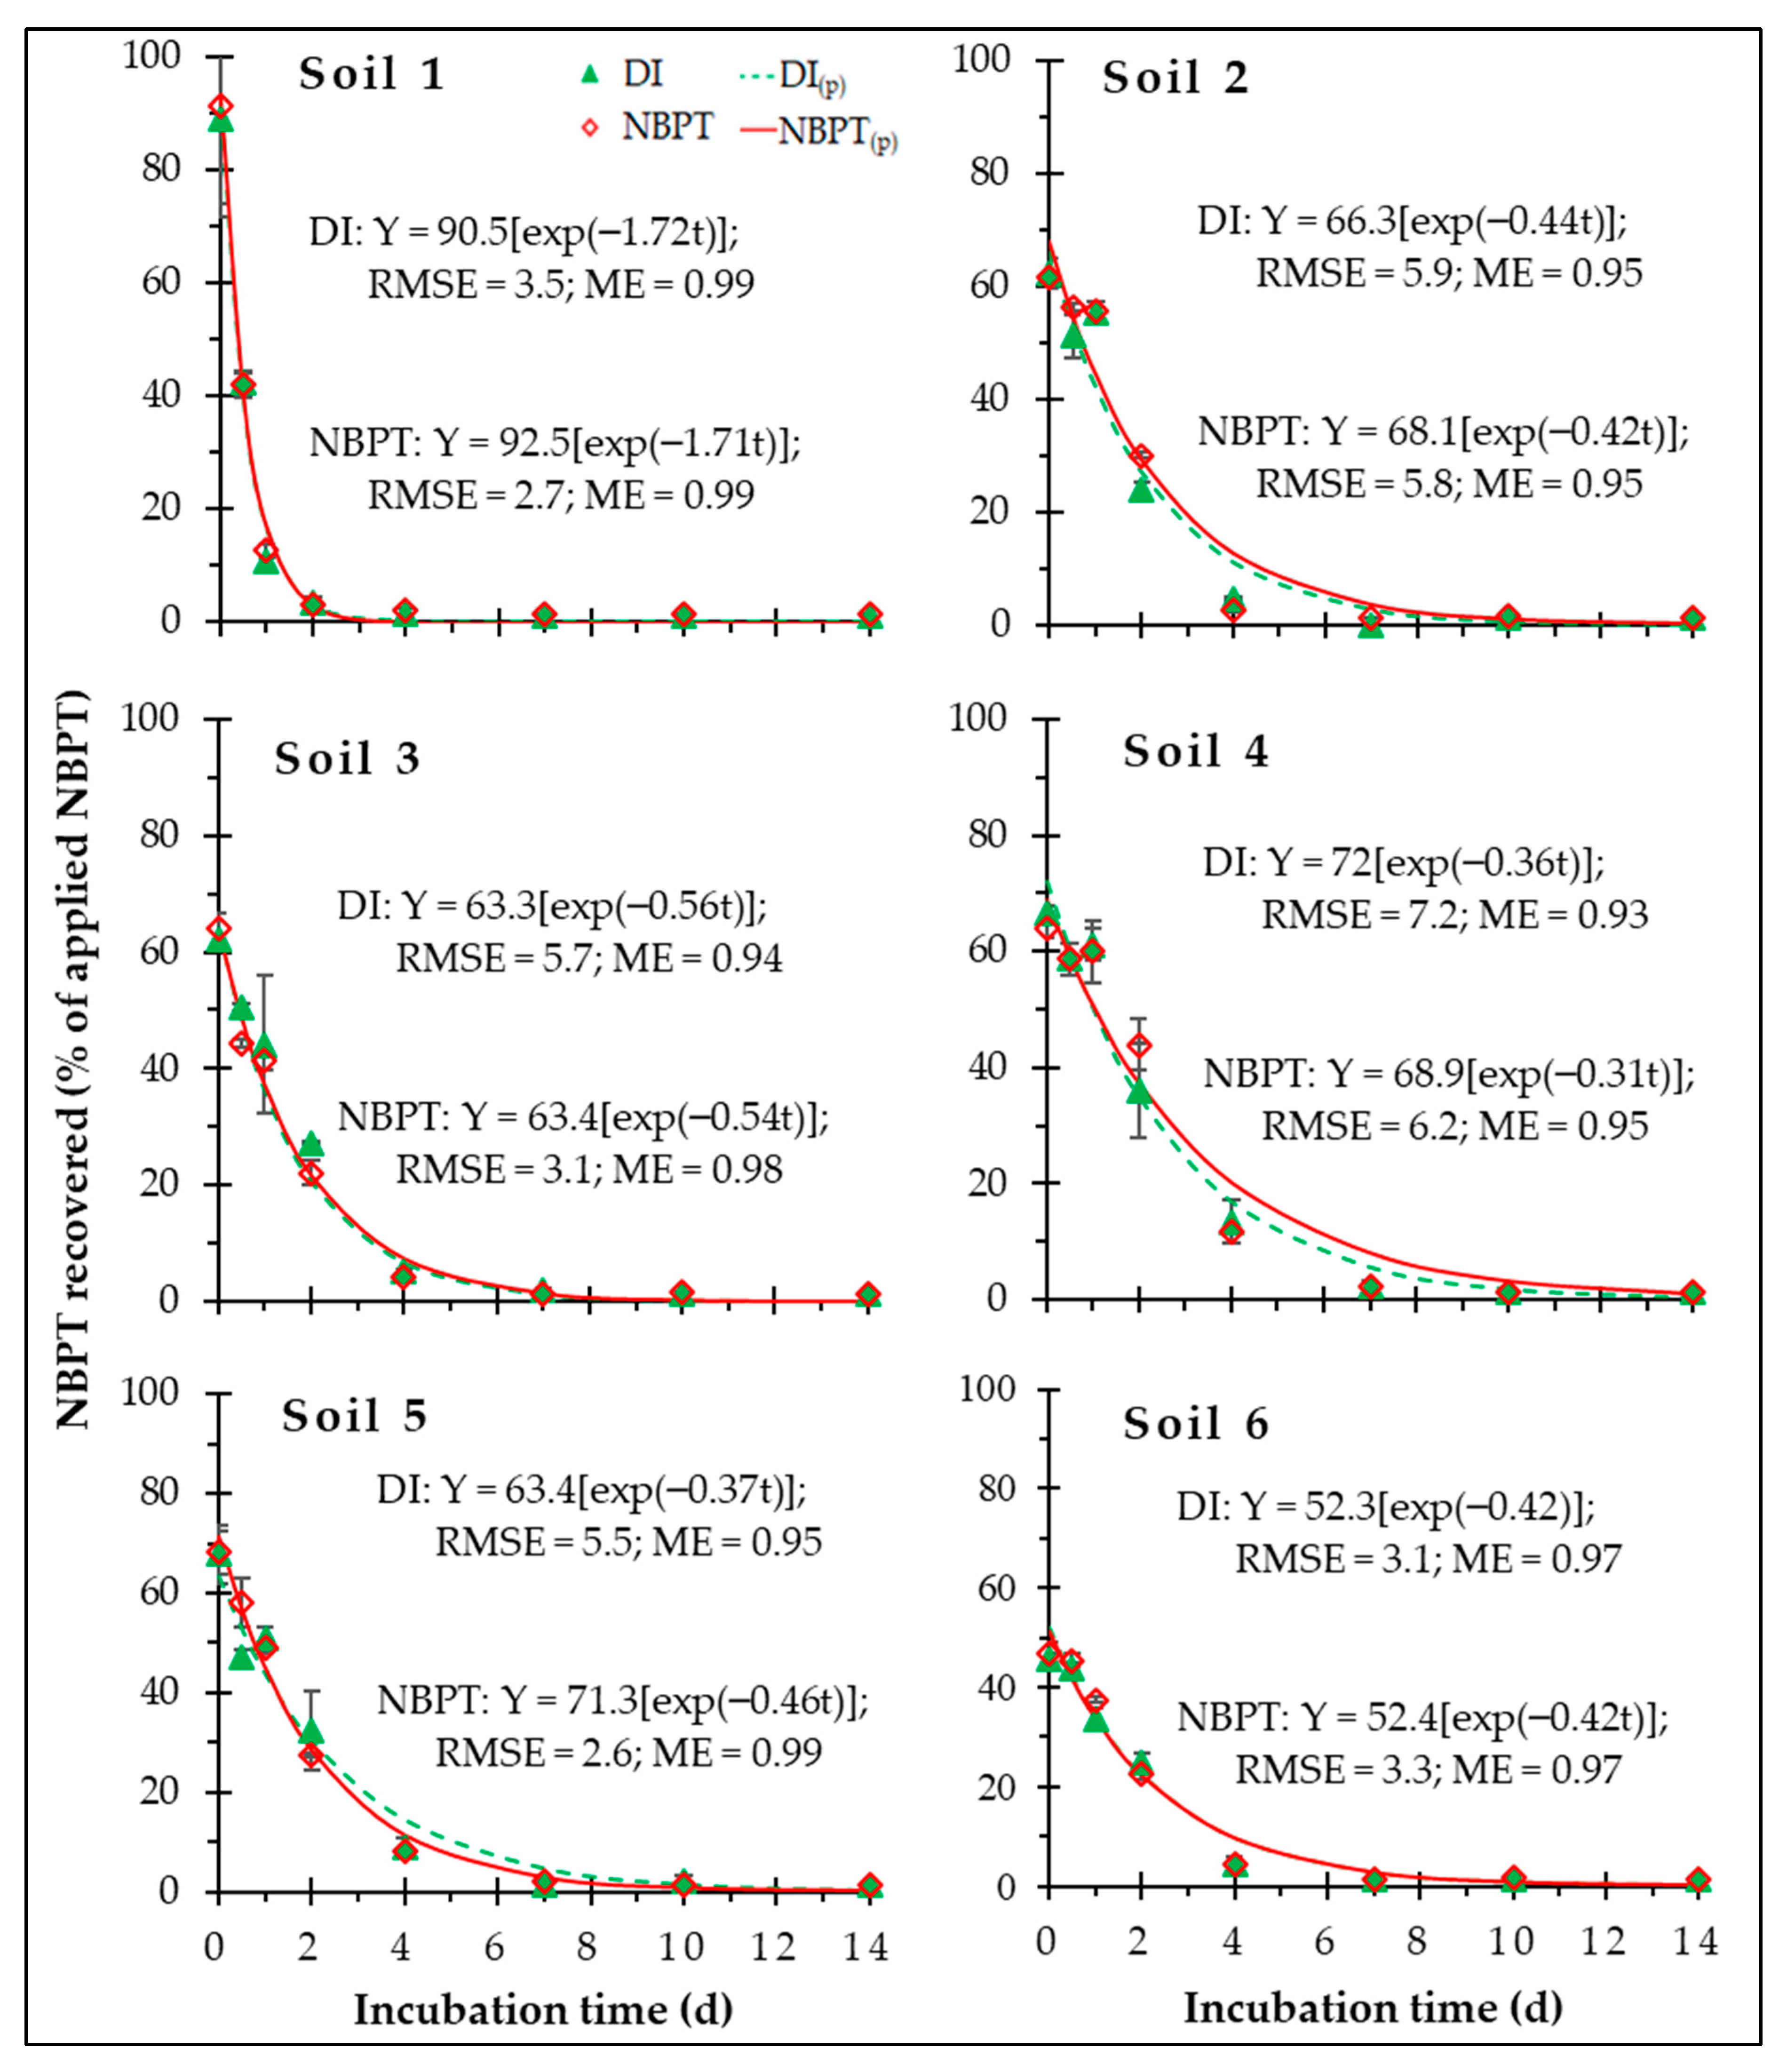
3.1. NBPT Recovery
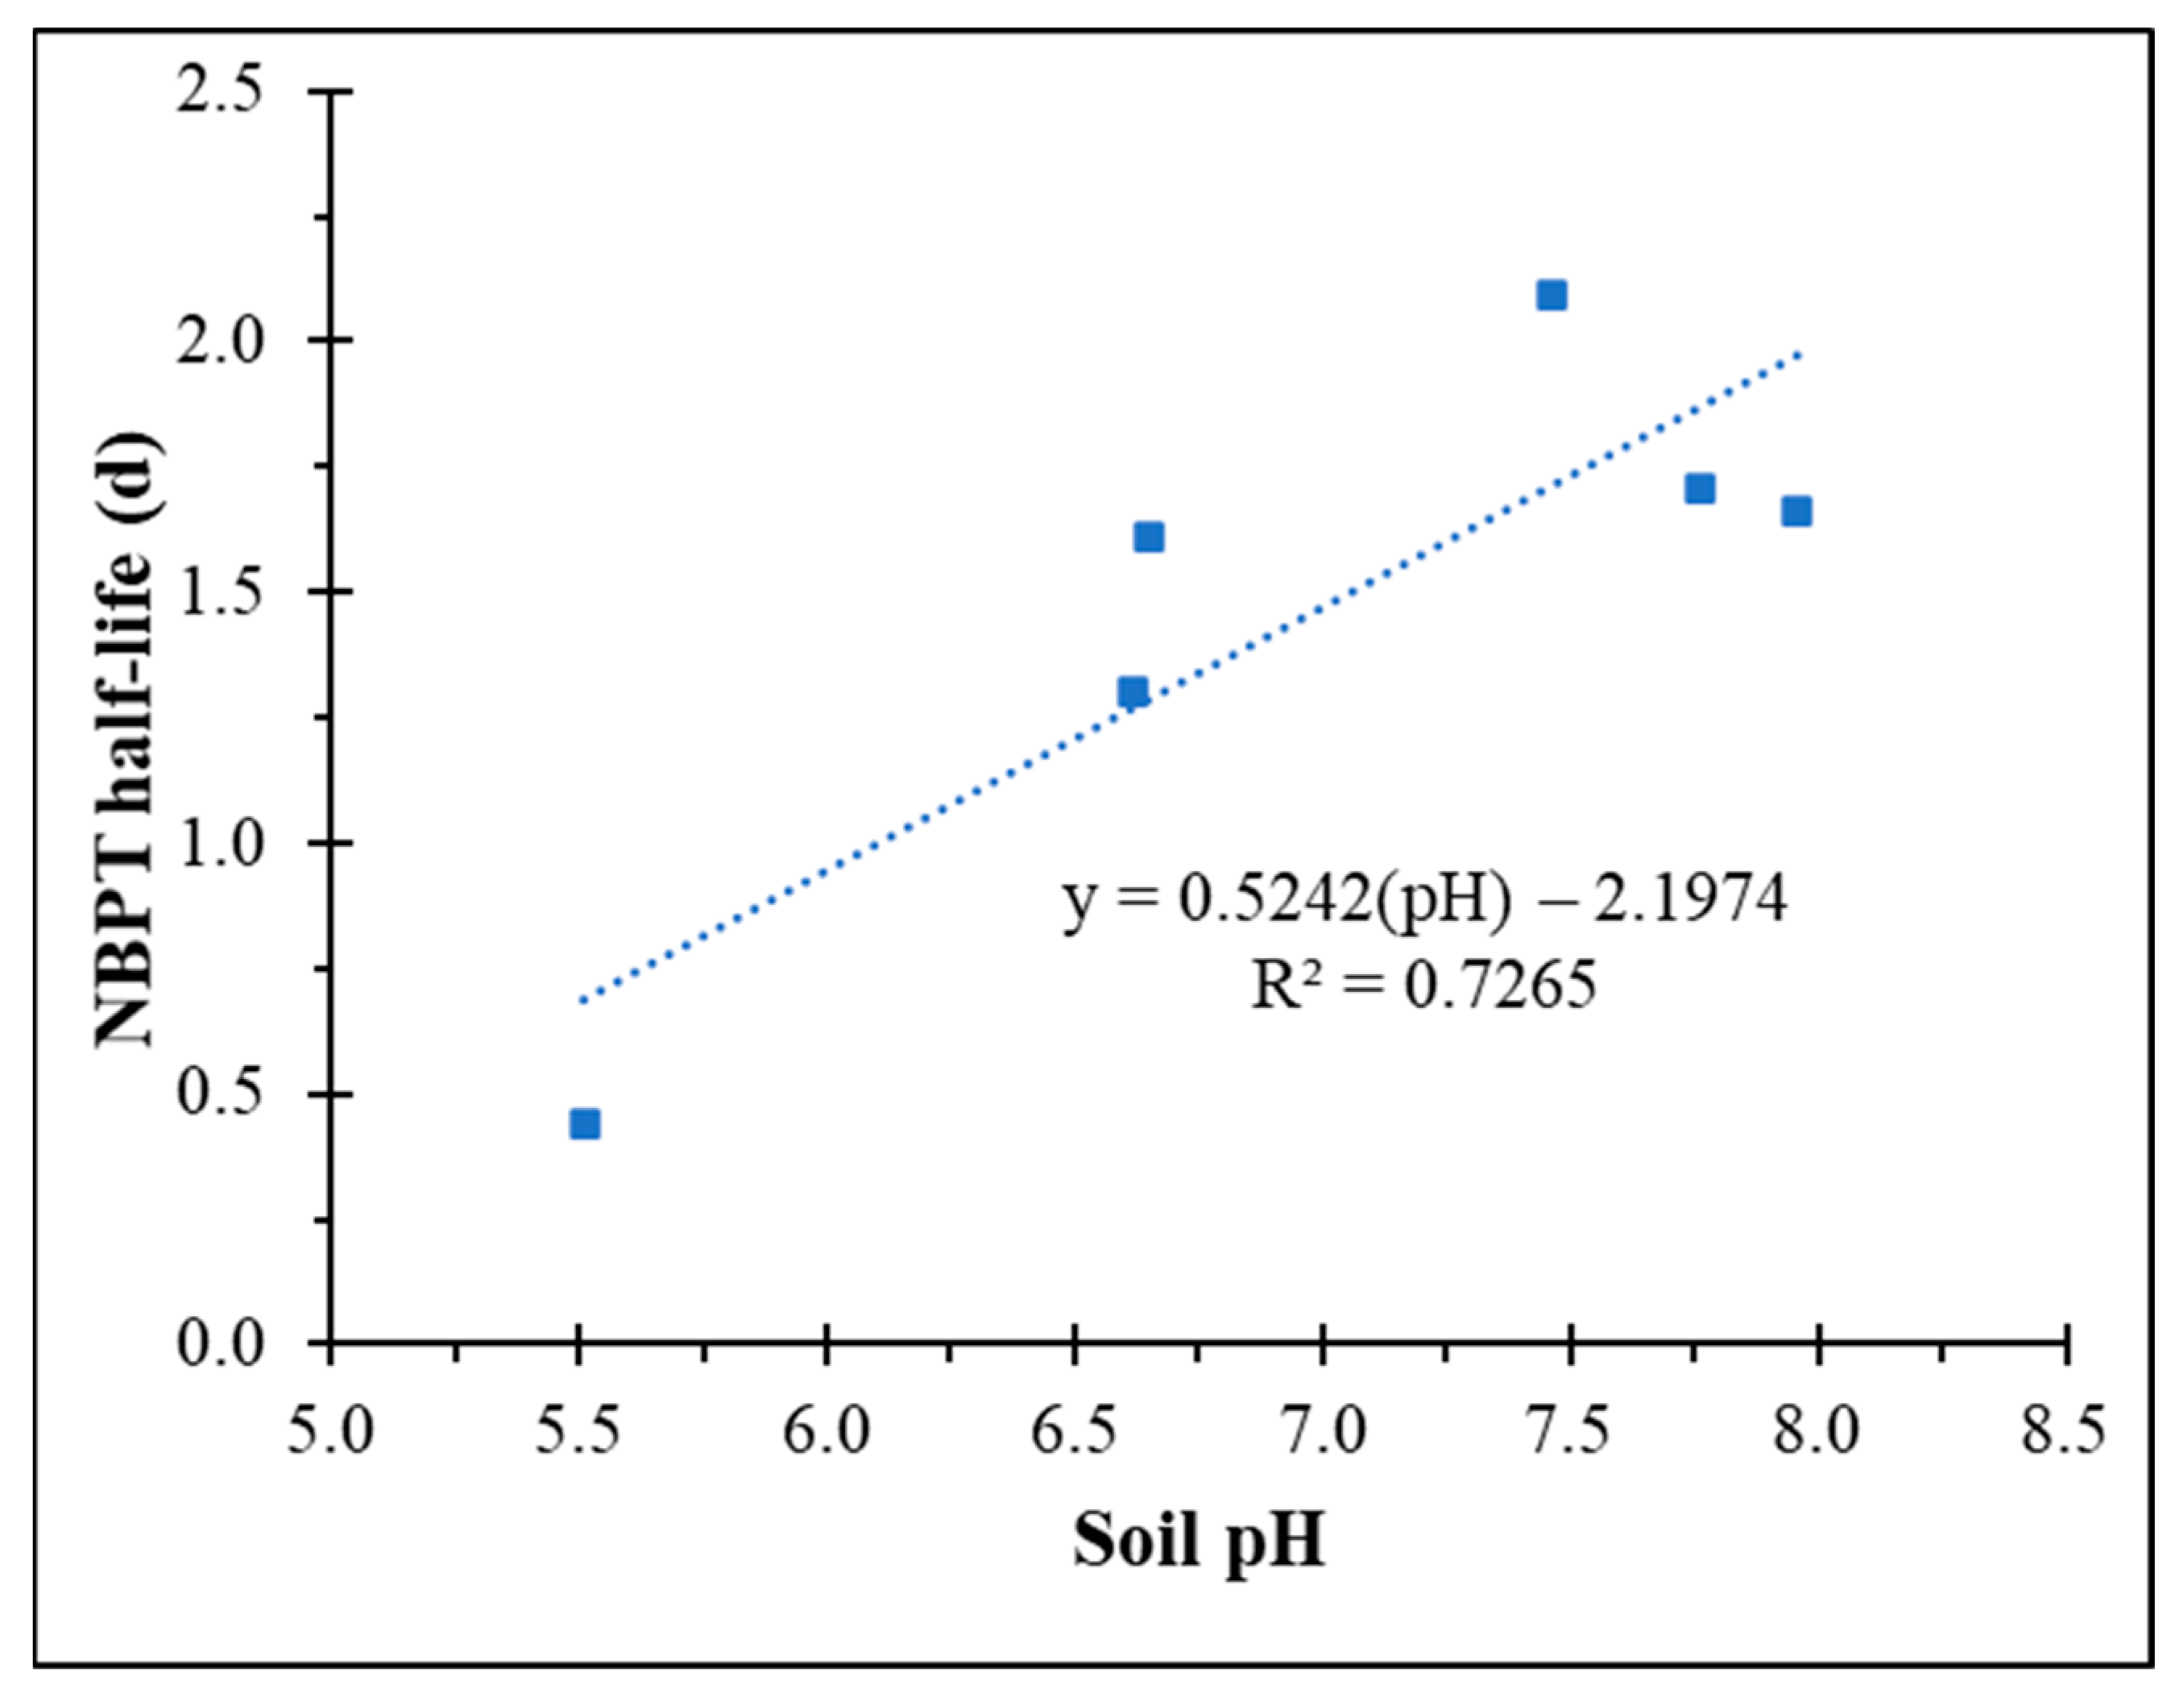
3.2. Kinetics of NBPT Degradation
4. Conclusions
Author Contributions
Funding
Data Availability Statement
Acknowledgments
Conflicts of Interest
References
- Mazzei, L.; Cianci, M.; Contaldo, U.; Ciurli, S. Insights into urease inhibition by N-(n-Butyl) phosphoric triamide through an integrated structural and kinetic approach. J. Agric. Food Chem. 2019, 67, 2127–2138. [Google Scholar] [CrossRef] [PubMed]
- Cantarella, H.; Otto, R.; Soares, J.R.; De Brito Silva, A.G. Agronomic efficiency of NBPT as a urease inhibitor: A review. J. Adv. Res. 2018, 13, 19–27. [Google Scholar] [CrossRef] [PubMed]
- Sheppard, S.C.; Bittman, S.; Bruulsema, T.W. Monthly ammonia emissions from fertilizers in 12 Canadian Ecoregions. Can. J. Soil Sci. 2010, 90, 113–127. [Google Scholar] [CrossRef]
- Modolo, L.V.; Da-Silva, C.J.; Brandão, D.S.; Chaves, I.S. A minireview on what we have learned about urease inhibitors of agricultural interest since mid-2000s. J. Adv. Res. 2018, 13, 29–37. [Google Scholar] [CrossRef]
- Lasisi, A.A.; Akinremi, O.O.; Kumaragamage, D. Efficacy of a new N-(n-butyl) thiophosphoric triamide formulation in reducing ammonia volatilization from urea-based fertilizers. Can. J. Soil Sci. 2019, 99, 395–405. [Google Scholar] [CrossRef]
- Sigurdarson, J.J.; Svane, S.; Karring, H. The molecular processes of urea hydrolysis in relation to ammonia emissions from agriculture. Rev. Environ. Sci. Biotechnol. 2018, 17, 241–258. [Google Scholar] [CrossRef] [Green Version]
- Creason, G.L.; Schmitt, M.R.; Douglass, E.A.; Hendrscrson, L.L. Urease inhibitory activity associated with N-butyl thiophosphoric triamide is due to formation of its oxon analog. Soil Biol. Biochem. 1990, 22, 209–211. [Google Scholar] [CrossRef]
- Gioacchini, P.; Nastri, A.; Marzadori, C.; Giovannini, C.; Vittori Antisari, L.; Gessa, C. Influence of urease and nitrification inhibitors on N losses from soils fertilized with urea. Biol. Fertil. Soils 2002, 36, 129–135. [Google Scholar] [CrossRef]
- Zaman, M.; Nguyen, M.L.; Blennerhassett, J.D.; Quin, B.F. Reducing NH3, N2O and NO3−-N losses from a pasture soil with urease or nitrification inhibitors and elemental S-amended nitrogenous fertilizers. Biol. Fertil. Soils 2008, 44, 693–705. [Google Scholar] [CrossRef]
- Soares, J.R.; Cantarella, H.; Menegale, M.L.d.C. Ammonia volatilization losses from surface-applied urea with urease and nitrification inhibitors. Soil Biol. Biochem. 2012, 52, 82–89. [Google Scholar] [CrossRef]
- Frame, W. Ammonia volatilization from urea treated with NBPT and two nitrification inhibitors. Agron. J. 2017, 109, 378–387. [Google Scholar] [CrossRef]
- Mariano, E.; De Sant Ana Filho, C.R.; Bortoletto-Santos, R.; Bendassolli, J.A.; Trivelin, P.C.O. Ammonia losses following surface application of enhanced-efficiency nitrogen fertilizers and urea. Atmos. Environ. 2019, 203, 242–251. [Google Scholar] [CrossRef]
- Lasisi, A.A.; Akinremi, O.O.; Zhang, Q.; Kumaragamage, D. Efficiency of fall versus spring applied urea-based fertilizers treated with urease and nitrification inhibitors I. Ammonia volatilization and mitigation by NBPT. Soil Sci. Soc. Am. J. 2020, 84, 949–962. [Google Scholar] [CrossRef]
- Lasisi, A.A.; Akinremi, O.O.; Kumaragamage, D. Nitrification inhibitor reduces the inhibitory effect of N-(n-butyl) thiophosphoric triamide (NBPT) on the hydrolysis of urea. Soil Sci. Soc. Am. J. 2020, 84, 1782–1794. [Google Scholar] [CrossRef]
- Lasisi, A.A.; Akinremi, O.O. Kinetics and thermodynamics of urea hydrolysis in the presence of urease and nitrification inhibitors. Can. J. Soil Sci. 2021, 101, 192–202. [Google Scholar] [CrossRef]
- Hendrickson, L.; Douglass, E. Metabolism of the urease inhibitor N-(n-butyl) thiophosphoric (NBPT) in soils. Soil Biol. Biochem. 1993, 25, 1613–1618. [Google Scholar] [CrossRef]
- Engel, R.E.; Towey, B.D.; Gravens, E. Degradation of the urease inhibitor NBPT as affected by soil pH. Soil Sci. Soc. Am. J. 2015, 79, 1674–1683. [Google Scholar] [CrossRef]
- MAFRI Manitoba Agriculture, Food and Rural Initiative. Soil Series Descriptions; MAFRI: Carman, MB, Canada, 2010; 208p. [Google Scholar]
- Walkley, A.; Black, I.A. An examination of the Degtjareff method for determining soil organic matter, and a proposed modification of the chromic acid titration method. Soil Sci. 1934, 37, 29–38. [Google Scholar] [CrossRef]
- Hendershot, W.H.; Lalande, H.; Duquette, M. Ion exchange and exchangeable cations. In Soil Sampling and Methods of Analysis; Carter, M.R., Gregorich, E.G., Eds.; Canadian Society of Soil Science: Boca Raton, FL, USA, 2008; pp. 173–178. [Google Scholar]
- Tabatabai, M.; Bremner, J.M. Assay of urease activity in soils. Soil Biol. Biochem. 1972, 4, 479–487. [Google Scholar] [CrossRef]
- Gee, G.W.; Bauder, J.W. Particle-size analysis. In Methods of Soil Analysis, Agronomy Monograph 9, 2nd ed.; Klute, A., Ed.; ASA: Winscosin, WI, USA, 1986; pp. 383–411. [Google Scholar]
- Cassel, D.K.; Nielsen, D.R. Field capacity and available water capacity. In Methods of Soil Analysis, Agronomy Monograph 9, 2nd ed.; Klute, A., Ed.; ASA: Winscosin, WI, USA, 1986; pp. 901–926. [Google Scholar]
- SAS Institute, Inc. SAS/STAT 13.2 User’s Guide, Version 9.4; SAS Institute, Inc.: Cary, NC, USA, 2014. [Google Scholar]
- Archontoulis, S.V.; Miguez, F.E. Nonlinear regression models and applications in agricultural research. Agron. J. 2015, 107, 786–798. [Google Scholar] [CrossRef] [Green Version]
- Suter, H.C.; Pengthamkeerati, P.; Walker, C.; Chen, D. Influence of temperature and soil type on inhibition of urea hydrolysis by N-(n-butyl) thiophosphoric triamide in wheat and pasture soils in south-eastern Australia. Soil Res. 2011, 49, 315–319. [Google Scholar] [CrossRef]
- Fan, X.; Yin, C.; Yan, G.; Cui, P.; Shen, Q.; Wang, Q.; Chen, H.; Zhang, N.; Ye, M.; Zhao, Y.; et al. The contrasting effects of N-(n-butyl) thiophosphoric triamide (NBPT) on N2O emissions in arable soils differing in pH are underlain by complex microbial mechanisms. Sci. Total Environ. 2018, 642, 155–167. [Google Scholar] [CrossRef] [PubMed]
- Sahrawat, K.L. Factors affecting nitrification in soils. Commun. Soil Sci. Plant Anal. 2008, 39, 1436–1446. [Google Scholar] [CrossRef] [Green Version]
- Christianson, C.B.; Byrnes, B.H.; Carmona, G. A comparison of the sulfur and oxygen analogs of phosphoric triamide urease inhibitors in reducing urea hydrolysis and ammonia volatilization. Fertil. Res. 1990, 26, 21–27. [Google Scholar] [CrossRef]
- Bremner, J.M.; McCarty, G.W.; Higuchi, T. Persistence of the inhibitory effects of phosphoroamides on urea hydrolysis in soils. Commun. Soil Sci. Plant Anal. 1991, 22, 1519–1526. [Google Scholar] [CrossRef]
- Kot, M.; Zaborska, W.; Orlinska, K. Inhibition of Jack Bean urease by N-(n-butyl) thiophosphorictriamide and N-(n-butyl) phosphorictriamide: Determination of the inhibition mechanism. J. Enzyme Inhib. 2001, 16, 507–516. [Google Scholar] [CrossRef] [Green Version]
- Engel, R.; Jones, C.; Wallander, R. Ammonia volatilization from urea and mitigation by NBPT following surface application to cold soils. Soil Sci. Soc. Am. J. 2011, 75, 2348–2357. [Google Scholar] [CrossRef]

| Soil Property | Soil 1 | Soil 2 | Soil 3 | Soil 4 | Soil 5 | Soil 6 |
|---|---|---|---|---|---|---|
| Soil classification a | Orthic Black Chernozem | Orthic Black Chernozem | Orthic Dark Gray Chernozem | Gleyed Cumulic Regosol | Gleyed Rego Black Chernozem | Gleyed Rego Black Chernozem |
| Soil series | Hibsin | Fairland | Dezwood | High Bluff | Dencross | Neurhorst |
| Soil pHwater | 5.51 | 6.65 | 6.62 | 7.46 | 7.76 | 7.96 |
| Electrical conductivity (µS cm−1) | 394 | 228 | 1853 | 899 | 1377 | 596 |
| Organic matter (g kg−1) | 27 | 33 | 34 | 45 | 88 | 71 |
| Available N (mg kg−1) | 31 | 15 | 186 | 58 | 22 | 82 |
| Field capacity (m m−3) | 0.35 | 0.34 | 0.36 | 0.41 | 0.61 | 0.44 |
| Urease activity (mg NH4+-N kg−1 soil hr−1) | 11 | 17 | 24 | 57 | 63 | 88 |
| Cation exchange capacity (cmol kg−1) | 16 | 14 | 23 | 28 | 47 | 36 |
| Soil texture | Sandy loam | Sandy loam | Loam | Loam | Clay | Clay loam |
| Sand (g kg−1) | 711 | 764 | 465 | 427 | 108 | 269 |
| Silt (g kg−1) | 123 | 128 | 318 | 325 | 322 | 343 |
| Clay (g kg−1) | 166 | 108 | 217 | 248 | 570 | 388 |
| Model Effect | df | Soil 1 | Soil 2 | Soil 3 | Soil 4 | Soil 5 | Soil 6 |
|---|---|---|---|---|---|---|---|
| Probability values | |||||||
| Inhibitor treatment (I) | 1 | 0.8588 | 0.8945 | 0.8266 | 0.813 | 0.9467 | 0.9731 |
| time (t) | 7 | <0.0001 | <0.0001 | <0.0001 | <0.0001 | <0.0001 | <0.0001 |
| I × t | 7 | 1.0000 | 0.0199 | 0.3853 | 0.8640 | 0.4941 | 0.7716 |
| Group Means | k | t1/2 |
|---|---|---|
| Inhibitor treatment (I) | d | d−1 |
| NBPT | 0.54 a | 1.32 a |
| DI | 0.54 a | 1.33 a |
| Soil (S) | ||
| Soil 1 | 1.72 a | 0.44 d |
| Soil 2 | 0.43 c | 1.61 b |
| Soil 3 | 0.55 b | 1.30 c |
| Soil 4 | 0.33 d | 2.09 a |
| Soil 5 | 0.41 c | 1.71 b |
| Soil 6 | 0.42 c | 1.66 b |
| Model effects | Probability values | |
| I | 0.8784 | 0.8876 |
| S | <0.0001 | <0.0001 |
| I × S | 0.5452 | 0.5021 |
Publisher’s Note: MDPI stays neutral with regard to jurisdictional claims in published maps and institutional affiliations. |
© 2022 by the authors. Licensee MDPI, Basel, Switzerland. This article is an open access article distributed under the terms and conditions of the Creative Commons Attribution (CC BY) license (https://creativecommons.org/licenses/by/4.0/).
Share and Cite
Lasisi, A.A.; Akinremi, O.O. Degradation of N-(n-butyl) Thiophosphoric Triamide (NBPT) with and without Nitrification Inhibitor in Soils. Nitrogen 2022, 3, 161-169. https://doi.org/10.3390/nitrogen3020012
Lasisi AA, Akinremi OO. Degradation of N-(n-butyl) Thiophosphoric Triamide (NBPT) with and without Nitrification Inhibitor in Soils. Nitrogen. 2022; 3(2):161-169. https://doi.org/10.3390/nitrogen3020012
Chicago/Turabian StyleLasisi, Ahmed A., and Olalekan O. Akinremi. 2022. "Degradation of N-(n-butyl) Thiophosphoric Triamide (NBPT) with and without Nitrification Inhibitor in Soils" Nitrogen 3, no. 2: 161-169. https://doi.org/10.3390/nitrogen3020012
APA StyleLasisi, A. A., & Akinremi, O. O. (2022). Degradation of N-(n-butyl) Thiophosphoric Triamide (NBPT) with and without Nitrification Inhibitor in Soils. Nitrogen, 3(2), 161-169. https://doi.org/10.3390/nitrogen3020012