Article

Increased Arctic NO3 Availability as a Hydrogeomorphic Consequence of Permafrost Degradation and Landscape Drying

1
Department of Marine, Earth, & Atmospheric Sciences, North Carolina State University, Raleigh, NC 27695, USA
2
Earth Systems Observations Group, Los Alamos National Laboratory, Los Alamos, NM 87545, USA
3
Nuclear Science & Engineering, Massachusetts Institute of Technology, Cambridge, MA 02139, USA
4
Environmental Sciences Division, Oak Ridge National Laboratory, Oak Ridge, TN 37830, USA
5
Department of Geography, University of Wisconsin-Madison, Madison, WI 53706, USA
6
Earth and Environmental Sciences Area, Lawrence Berkeley National Laboratory, Berkeley, CA 94720, USA
7
Alaska Regional Climate Services, National Oceanic & Atmospheric Administration, Anchorage, AK 99506, USA
*
Author to whom correspondence should be addressed.
Nitrogen 2022, 3(2), 314-332; https://doi.org/10.3390/nitrogen3020021
Submission received: 6 April 2022 / Revised: 18 May 2022 / Accepted: 20 May 2022 / Published: 21 May 2022
(This article belongs to the Special Issue Nitrogen Cycling in Permafrost Soils)

Abstract

:
Climate-driven permafrost thaw alters the strongly coupled carbon and nitrogen cycles within the Arctic tundra, influencing the availability of limiting nutrients including nitrate (NO3). Researchers have identified two primary mechanisms that increase nitrogen and NO3 availability within permafrost soils: (1) the ‘frozen feast’, where previously frozen organic material becomes available as it thaws, and (2) ‘shrubification’, where expansion of nitrogen-fixing shrubs promotes increased soil nitrogen. Through the synthesis of original and previously published observational data, and the application of multiple geospatial approaches, this study investigates and highlights a third mechanism that increases NO3 availability: the hydrogeomorphic evolution of polygonal permafrost landscapes. Permafrost thaw drives changes in microtopography, increasing the drainage of topographic highs, thus increasing oxic conditions that promote NO3 production and accumulation. We extrapolate relationships between NO3 and soil moisture in elevated topographic features within our study area and the broader Alaskan Coastal Plain and investigate potential changes in NO3 availability in response to possible hydrogeomorphic evolution scenarios of permafrost landscapes. These approximations indicate that such changes could increase Arctic tundra NO3 availability by ~250–1000%. Thus, hydrogeomorphic changes that accompany continued permafrost degradation in polygonal permafrost landscapes will substantially increase soil pore water NO3 availability and boost future fertilization and productivity in the Arctic.

1. Introduction

The geochemical evolution of permafrost regions with intensifying climate conditions affects hydrology, soil carbon, and nutrient availability in the Arctic considerably [1,2]. Nitrogen (N) is an important limiting nutrient in Arctic environments and changes to N availability and composition that accompany warming climate conditions have substantial ecological implications [2,3,4,5,6]. It is widely recognized that the sudden thaw of previously frozen organic material and observed shifts in vegetation species are causing increased availability of N in tundra and permafrost landscapes [4,7,8,9,10,11]. Keuper et al. [8] described the large N pools in permafrost as a “frozen feast” that have major ecological consequences when released through permafrost degradation. Hiltbrunner et al. [12] and Mekonnen et al. [13] identified the potential for the expansion of N-fixing shrubs to increase the nutrient availability across warming permafrost landscapes. More specifically, nitrate (NO3) fluxes and changes associated with climate intensification are primary factors determining Arctic fertilization and subsequent primary productivity [14,15].
Within permafrost environments with low topographic relief, polygons are widespread characteristic landscape features, occupying 74% of the Barrow Peninsula (near Utqiaġvik, AK, USA) and 53% of the broader Arctic coastal plain [16], and thus have large potential ecological impacts if polygon NO3 production increases. While polygonal permafrost landscapes are subject to impacts of ‘the frozen feast’, they do not experience the same encroachment of N-fixing vegetation (‘shrubification’) that other permafrost landscapes are observing. However, there are additional factors that can affect N distributions and availability in polygonal landscapes. Soil moisture content is a major determinant of nutrient-cycling rates in Arctic and sub-Arctic soils [7,17,18] and in certain settings, permafrost thaw leads to subsequent increases in soil drainage efficiency [7,19,20] and drier soils. Previous work indicates an impact of microtopography on NO3 availability in permafrost landscapes [6,7,21,22,23,24]. The relationship between microtopography and soil moisture as polygons degrade with a warming climate creates a nuanced but important control on nitrogen speciation and availability in polygonal landscapes [25,26].
Polygons form from successive freeze–thaw cycles that produce ice wedges, which disturb overlying soil [25,27,28,29]. Ice wedges initially form low-centered polygons (with a central topographic low). As permafrost degrades, ice wedges that surround low-centered polygons thaw, resulting in topographic inversions. Such inversion results in flat-centered polygons, and with increased degradation, high-centered polygons (with dome-like centers) [25,29,30,31]. These geomorphic transitions between polygon types are accompanied by changes in landscape hydrology as low-centered polygons typically have ponded water in their centers and drier elevated rims, while flat- and high-centered polygons have drier, more oxic, centers and wet surrounding troughs [32,33]. The distribution of polygonal features in a landscape can influence drainage patterns, with more thorough drainage occurring in high-centered polygons and more moisture retention occurring in low-centered polygons [15,25,27]. Previous studies have identified that soil nitrogen concentrations are closely correlated to soil moisture, with higher N content in drier soils [6,18,22,34]. Correspondingly, NO3 concentrations in perennially saturated polygonal tundra areas (low-centers and troughs) are overwhelmingly below the limit of detection [23,24].
Herein, we further consider the impacts of permafrost degradation and how this will further increase N availability (in the context of NO3) in Arctic and sub-Arctic soils. We use an integrated approach to assess novel and previously published observational data with multiple geospatial methods that consider the impact of microtopography, soil moisture (from greenness-index and spectral imagery approaches), and plant functional types on NO3 availability in a polygonal permafrost landscape. Specifically, we examine the relationship between microtopographic features, soil moisture, and NO3 compositions within a polygonal permafrost landscape; calculate NO3 inventories of the study area based on defined relationships between parameters and geospatial scaling; and investigate how different drying scenarios would impact future NO3 availability in these landscapes with anticipated climatic changes.

2. Materials and Methods

We investigated the relationship between soil moisture content and NO3 availability in the polygonal landscape of the Arctic Coastal Plain of Northern Alaska, USA, near the town of Utqiaġvik, AK. Particularly, we focused on elevated microtopographic features within a 1.91 km2 area of the Barrow Environmental Observatory (BEO) underlain by continuous permafrost and characterized by polygonal terrain (Figure 1). The unsaturated features we identified within the polygonal terrain of the BEO include centers of high-centered polygons, centers of flat-centered polygons, and rims of low-centered polygons. For brevity, we refer to these features as high-centers, flat-centers, and rims, respectively. We use the relationship between soil moisture and NO3 from these elevated topographic features, along with geospatial analyses, to estimate the current site NO3 inventory and investigate potential future changes in NO3 availability.
This work (a) contributes original observational data from the 2016 and 2017 field campaigns, (b) synthesizes original data with previously published observational data from the same sampling location from the 2012 and 2013 field campaigns, (c) extrapolates an integrated spatial distribution of NO3 within the study location based on microtopographic correlations, and (d) layers microtopography, soil moisture, wetness fractions, and vegetation (plant functional type) distributions to better interpret the complex and multi-pronged controls on NO3 within polygonal landscapes. It is worth noting that plant functional type designations are a secondary consideration in this study, but geospatial vegetation maps are incorporated for completeness and to motivate future work.
During the thaw seasons of 2016 and 2017, we collected 62 soil pore water samples from distinct elevated microtopographic features for NO3 analyses. Rhizosphere macro-rhizons [35] were inserted within the top 20 cm of the high-center, flat-center, and rim tundra features to collect water samples via syringe over a 24-h period. Water samples were immediately frozen for preservation and later thawed and filtered to 0.45 µm. Previously published NO3 data from within the BEO from distinct elevated microtopographic features from the 2012 and 2013 thaw season field campaigns (n = 83) followed the same sample collection strategy as the 2016 and 2017 campaigns. NO3 concentrations for the 2012–2013 and 2016–2017 field campaigns were determined using ion chromatography following the U.S. EPA method 300.0, (total NO3 n = 145; high-center NO3 n = 65; flat-center NO3 n = 49, rim NO3 n = 31). Gravimetry and time domain reflectometry (TDR) methods [36] were used to obtain soil moisture content measurements during the thaw seasons of 2012, 2013, 2016, and 2017 (total soil moisture n = 336; high-center soil moisture n = 87; flat-center soil moisture n = 97, rim soil moisture n = 152).
Due to logistical and sampling constraints, we only obtained 13 co-collected NO3 and soil moisture data points during the 2016 and 2017 field seasons but observed a strong negative correlation between NO3 and soil moisture (R2 = 0.97) when assessing distributions based on microtopographic designations. While co-located samples were sparse, metadata files with detailed sample location and microtopographic information published by the broader Next Generation Ecosystem Experiment (NGEE) Arctic project from the 2012 and 2013 campaigns, enabled us to increase our collective sample population and use a distribution regression with several assumptions: (a) although NO3 concentrations vary seasonally [18,23,24,37], we assume seasonality and annual influences are minimized by only selecting data collected during thaw seasons and classify all data according to their microtopographic designation rather than time, (b) the strong negative correlation between NO3 and soil moisture is assumed to exist regardless of season or year as supported by known redox relationships with NO3 stability, and (c) the microtopographic classification of samples distributes data according to drainage efficiency of geomorphic features and groups data from like-features to allow microtopographic distributions of parameter ranges to emerge. To confirm the elevated topographic feature/moisture content relation with NO3 (as suggested by previous studies and our co-located samples) from our broader synthesized data set, we calculated quantiles of soil moisture and NO3 and applied distributional linear regression to determine the inverse quantile soil moisture-NO3 relationships separately for rims, flat-centers, and high-centers (Table A1; see Appendix A).
Using the clear relation between topographic features and NO3 availability (see Results and Discussion), we upscaled our observational data with geospatial models of the BEO to estimate an overall NO3 inventory of the 1.91 km2 study area (Figure 1). To quantify the area extent of NO3 production we assumed that saturated features (troughs and low-centers, characterized as wet graminoid areas) do not contribute to NO3 production and that the three elevated topographic features (high-centers, flat-centers, and rims characterized as moss/lichen/dry graminoid areas) contribute to the total NO3 inventory. To constrain the depth of the NO3 production volume, we assumed that NO3 only accumulates in the upper ~20 cm of the active layer in elevated, well-drained oxic features above the water table in polygonal terrain. While the active layer (i.e., the seasonal thaw layer above permafrost) is deeper than 20 cm during summer months, ~20 cm is the observed depth at which the active layer becomes saturated and thus, NO3 production below this depth is assumed to be negligible because deeper depths are consistently saturated even in these elevated topographic features [22,23,24,32,38,39].
Because polygon features are microtopographic, accurate spatial mapping of features is needed to ensure the total area coverage of each feature is truly representative of the landscape to obtain representative inventories. Previous studies have successfully employed geospatial approaches to estimate subsurface biogeochemical processes and soil moisture content at the polygon-type and feature level [38,39,40]. We build on these studies by employing four geospatial approaches that utilized different moisture indicators to define the extent of the various features of interest and variations in saturated and unsaturated areas. These geospatial approaches rely on correlations of elevated topography/moisture content with: (1) microtopographic features [38]; (2) a greenness-based saturation index [41,42,43]; (3) plant functional types [44,45]; and (4) a high-resolution spectral imagery derived wetness-index [16,46] (additional details provided in Appendix A). Using multiple geospatial approaches better constrains uncertainty in our NO3 inventory estimates.
As we demonstrate later, polygon microtopographic features appeared to be a key characteristic in terms of variations in NO3 concentration, as opposed to simply classifying the area based on elevated topography/unsaturated versus saturated area. To relate NO3 variations to microtopographic features, we followed the LiDAR-based polygon microtopographic classification approach of [38] (Appendix A). We multiplied the aerial coverage approximations for rims, flat-centers, and high-centers [38] within our study site by the feature-specific quantiles of NO3 concentration and volumetric water content. To account for the variability of these parameters within a given feature, we used the 10, 25, 50, 75, and 90% quantiles to calculate the inventory range of each feature type (Table A1). The total mass of NO3 associated with each feature was then summed to estimate the total study area inventory (Equation (1)).
NO3inventory = ∑((Areafeature × GIScorrection_feature) × NO3feature × %Moisturefeature × Depth)feature
where NO3inventory is the calculated NO3 inventory (g) for our sampling region; Areafeature is the total area coverage (m2) of a specific elevated polygonal feature within our sampling region as defined by the geomorphic geospatial technique from Wainwright et al. [38]; GIScorrection_feature is a correction factor to account for the three geospatial approaches that do not provide feature-based discretization (for the geomorphic approach [38], GIScorrection_feature = 1); NO3feature is the NO3 concentration (g/m3) for specific polygonal features based on quantile distributions of our NO3 concentration data; %Moisturefeature is the volumetric moisture (%) for specific polygonal features based on statistical quantile distributions of our soil moisture data; Depth is the 0.20 m depth to which we assumed our oxic polygonal features produce NO3; feature links parameters to corresponding values for rims, flat-centers, and high-centers, which are all calculated separately and incorporated into the sum NO3inventory.
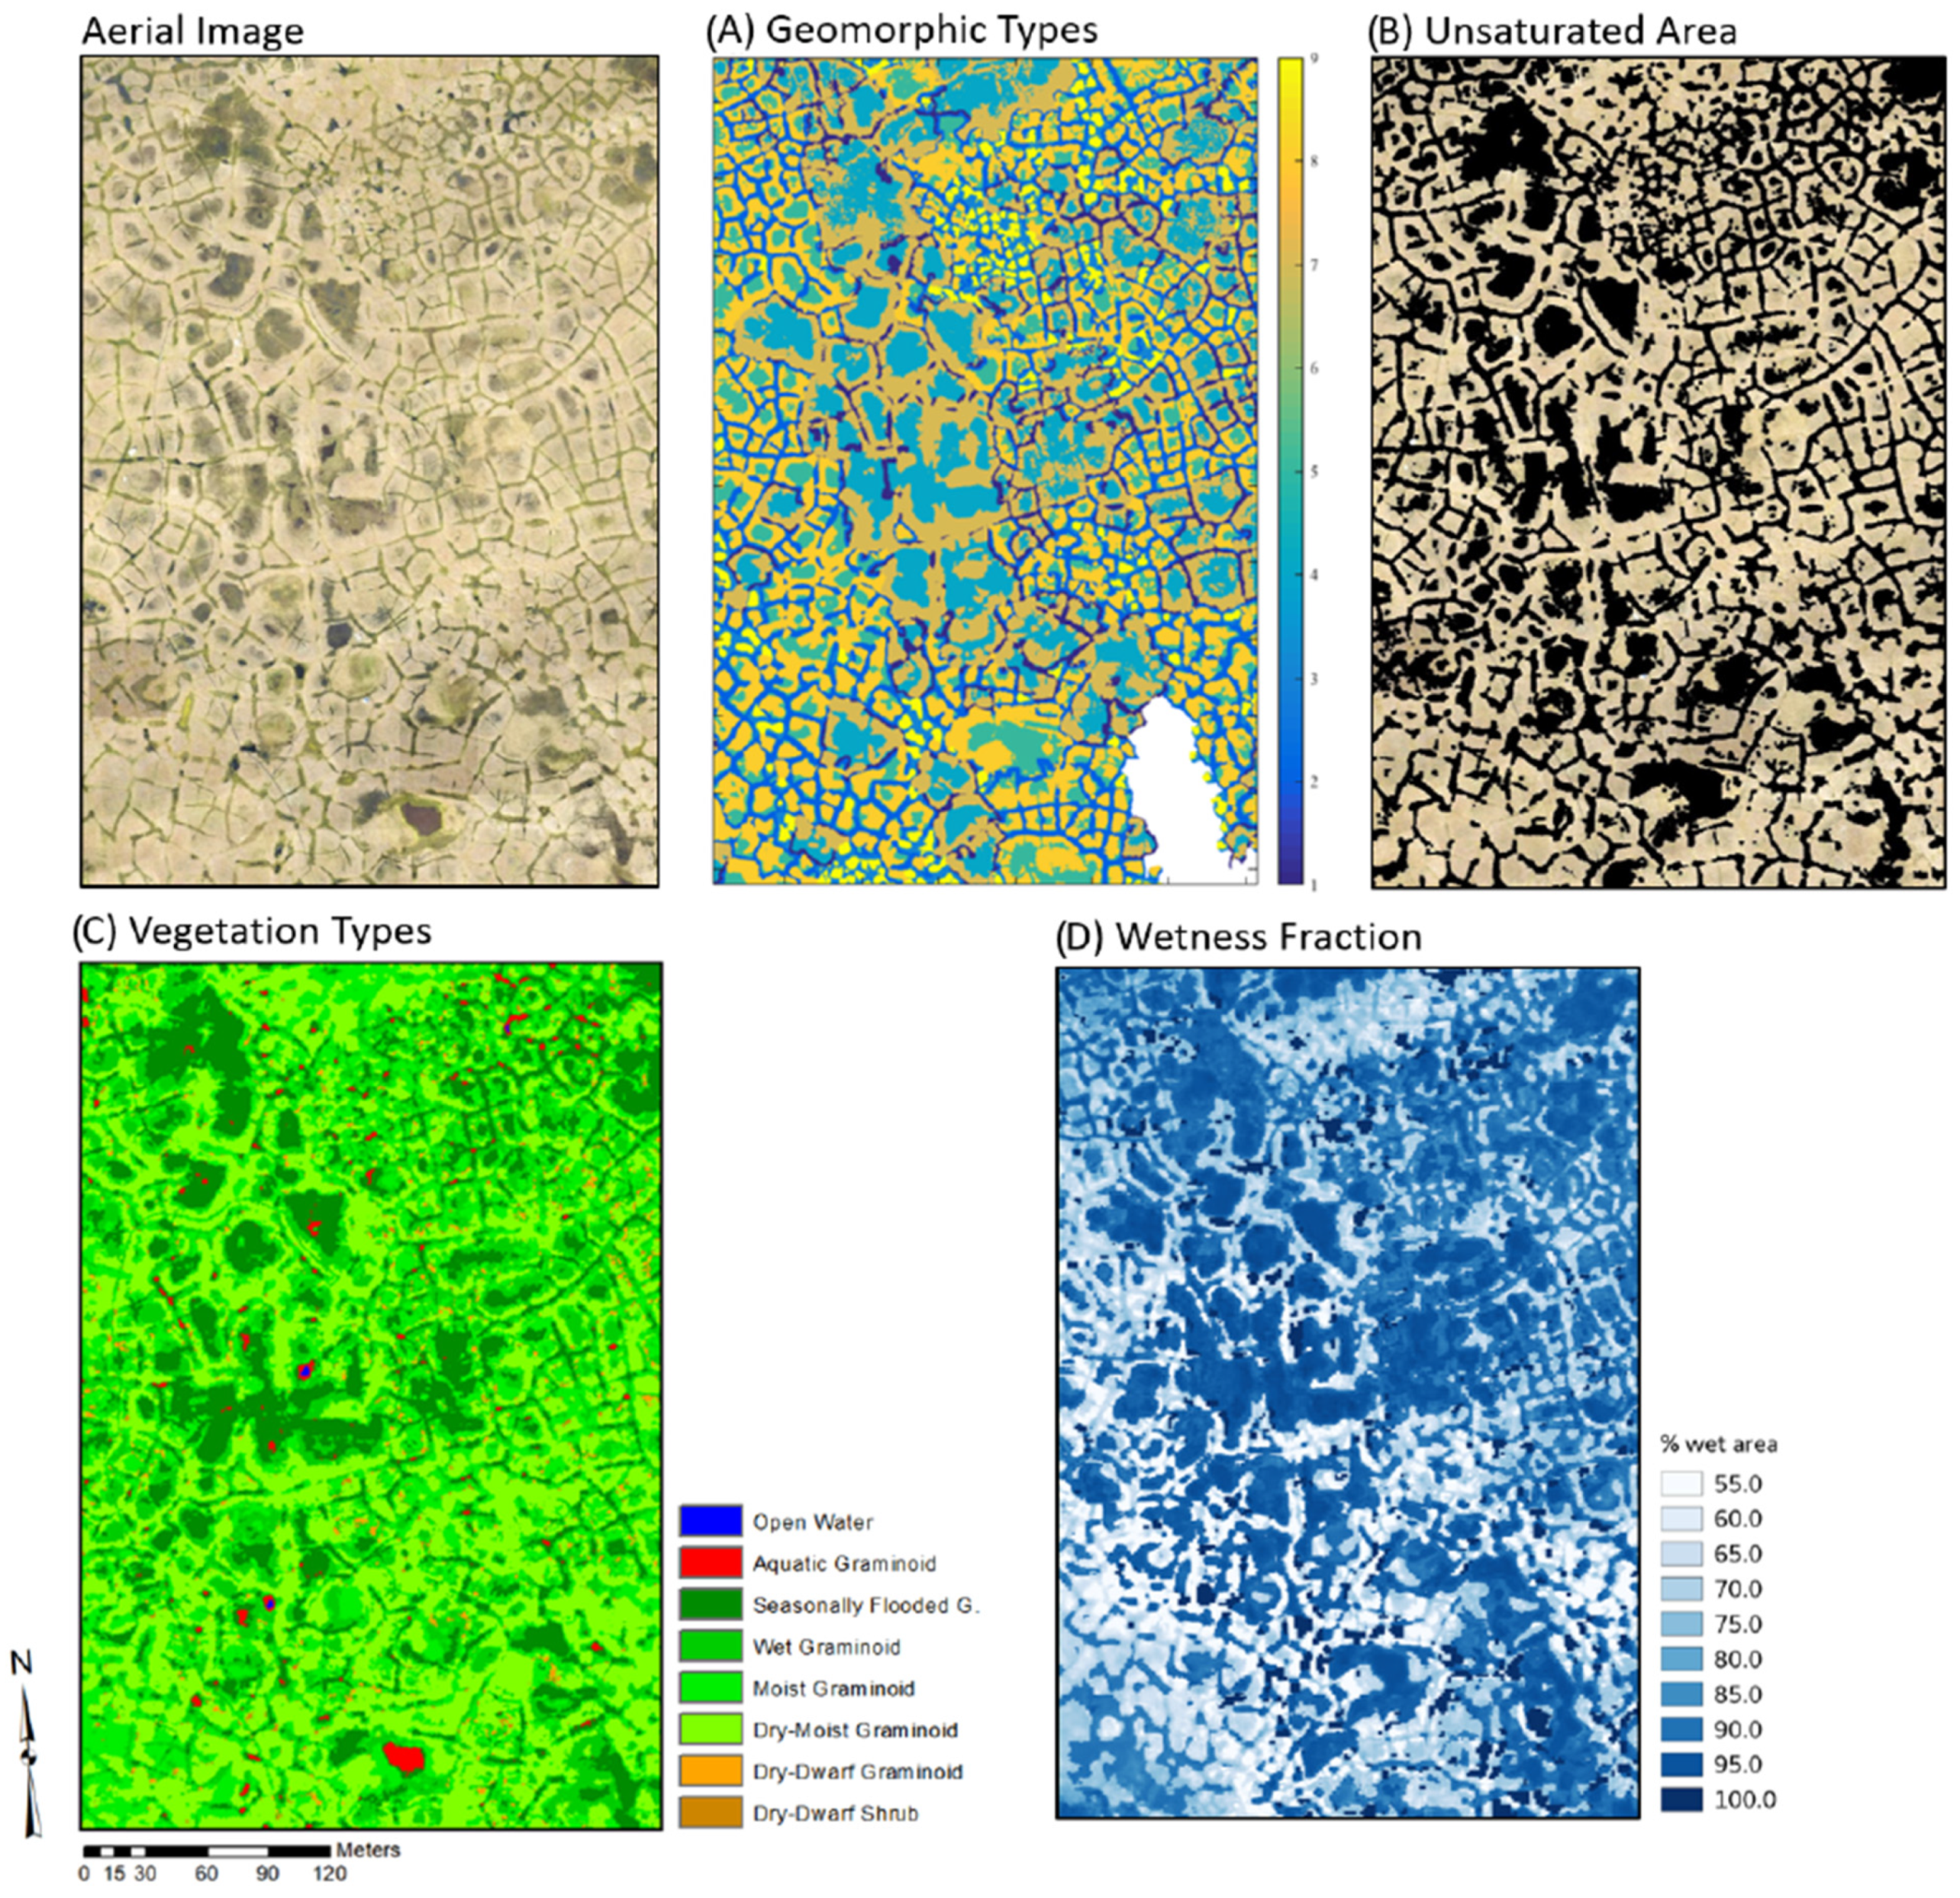
The greenness-based saturation index, plant community type, and high-resolution spectral imagery were used to derive wetness-index geospatial approaches that approximated the total unsaturated and saturated area coverage (Figure 2, see Appendix A for geospatial methods), but did not independently identify microtopographic distributions within the unsaturated areas. To incorporate these additional geospatial approaches to soil moisture designations while maintaining microtopographic coverage, the topographic coverage designations of Wainwright et al. [38] were adjusted based on correction factors derived for each additional geospatial approach (GIScorrectio_feature in Equation (1)). DEMs of the unsaturated areas from these approaches were overlaid with high-center, flat-center, and rim classifications from [38] so that microtopographic features could be identified and appropriate NO3 concentrations assigned based on quantiles of the relevant features from our broader data synthesis. Thus, the greenness-based saturation index, plant community type, and high-resolution spectral imagery geospatial approaches allowed us to improve our NO3 inventories beyond the topographic approach alone by correcting the assumption that all high-center, flat-center, and rim features remain unsaturated, and all lower-topography features remain saturated. The combined topographic geospatial approach with our additional geospatial approaches allowed more accurate landscape representations and further insights into soil moisture distributions within our microtopographic designations.

3. Results

3.1. Soil NO3 and Soil Moisture Distributions across Polygonal Microtopographic Features

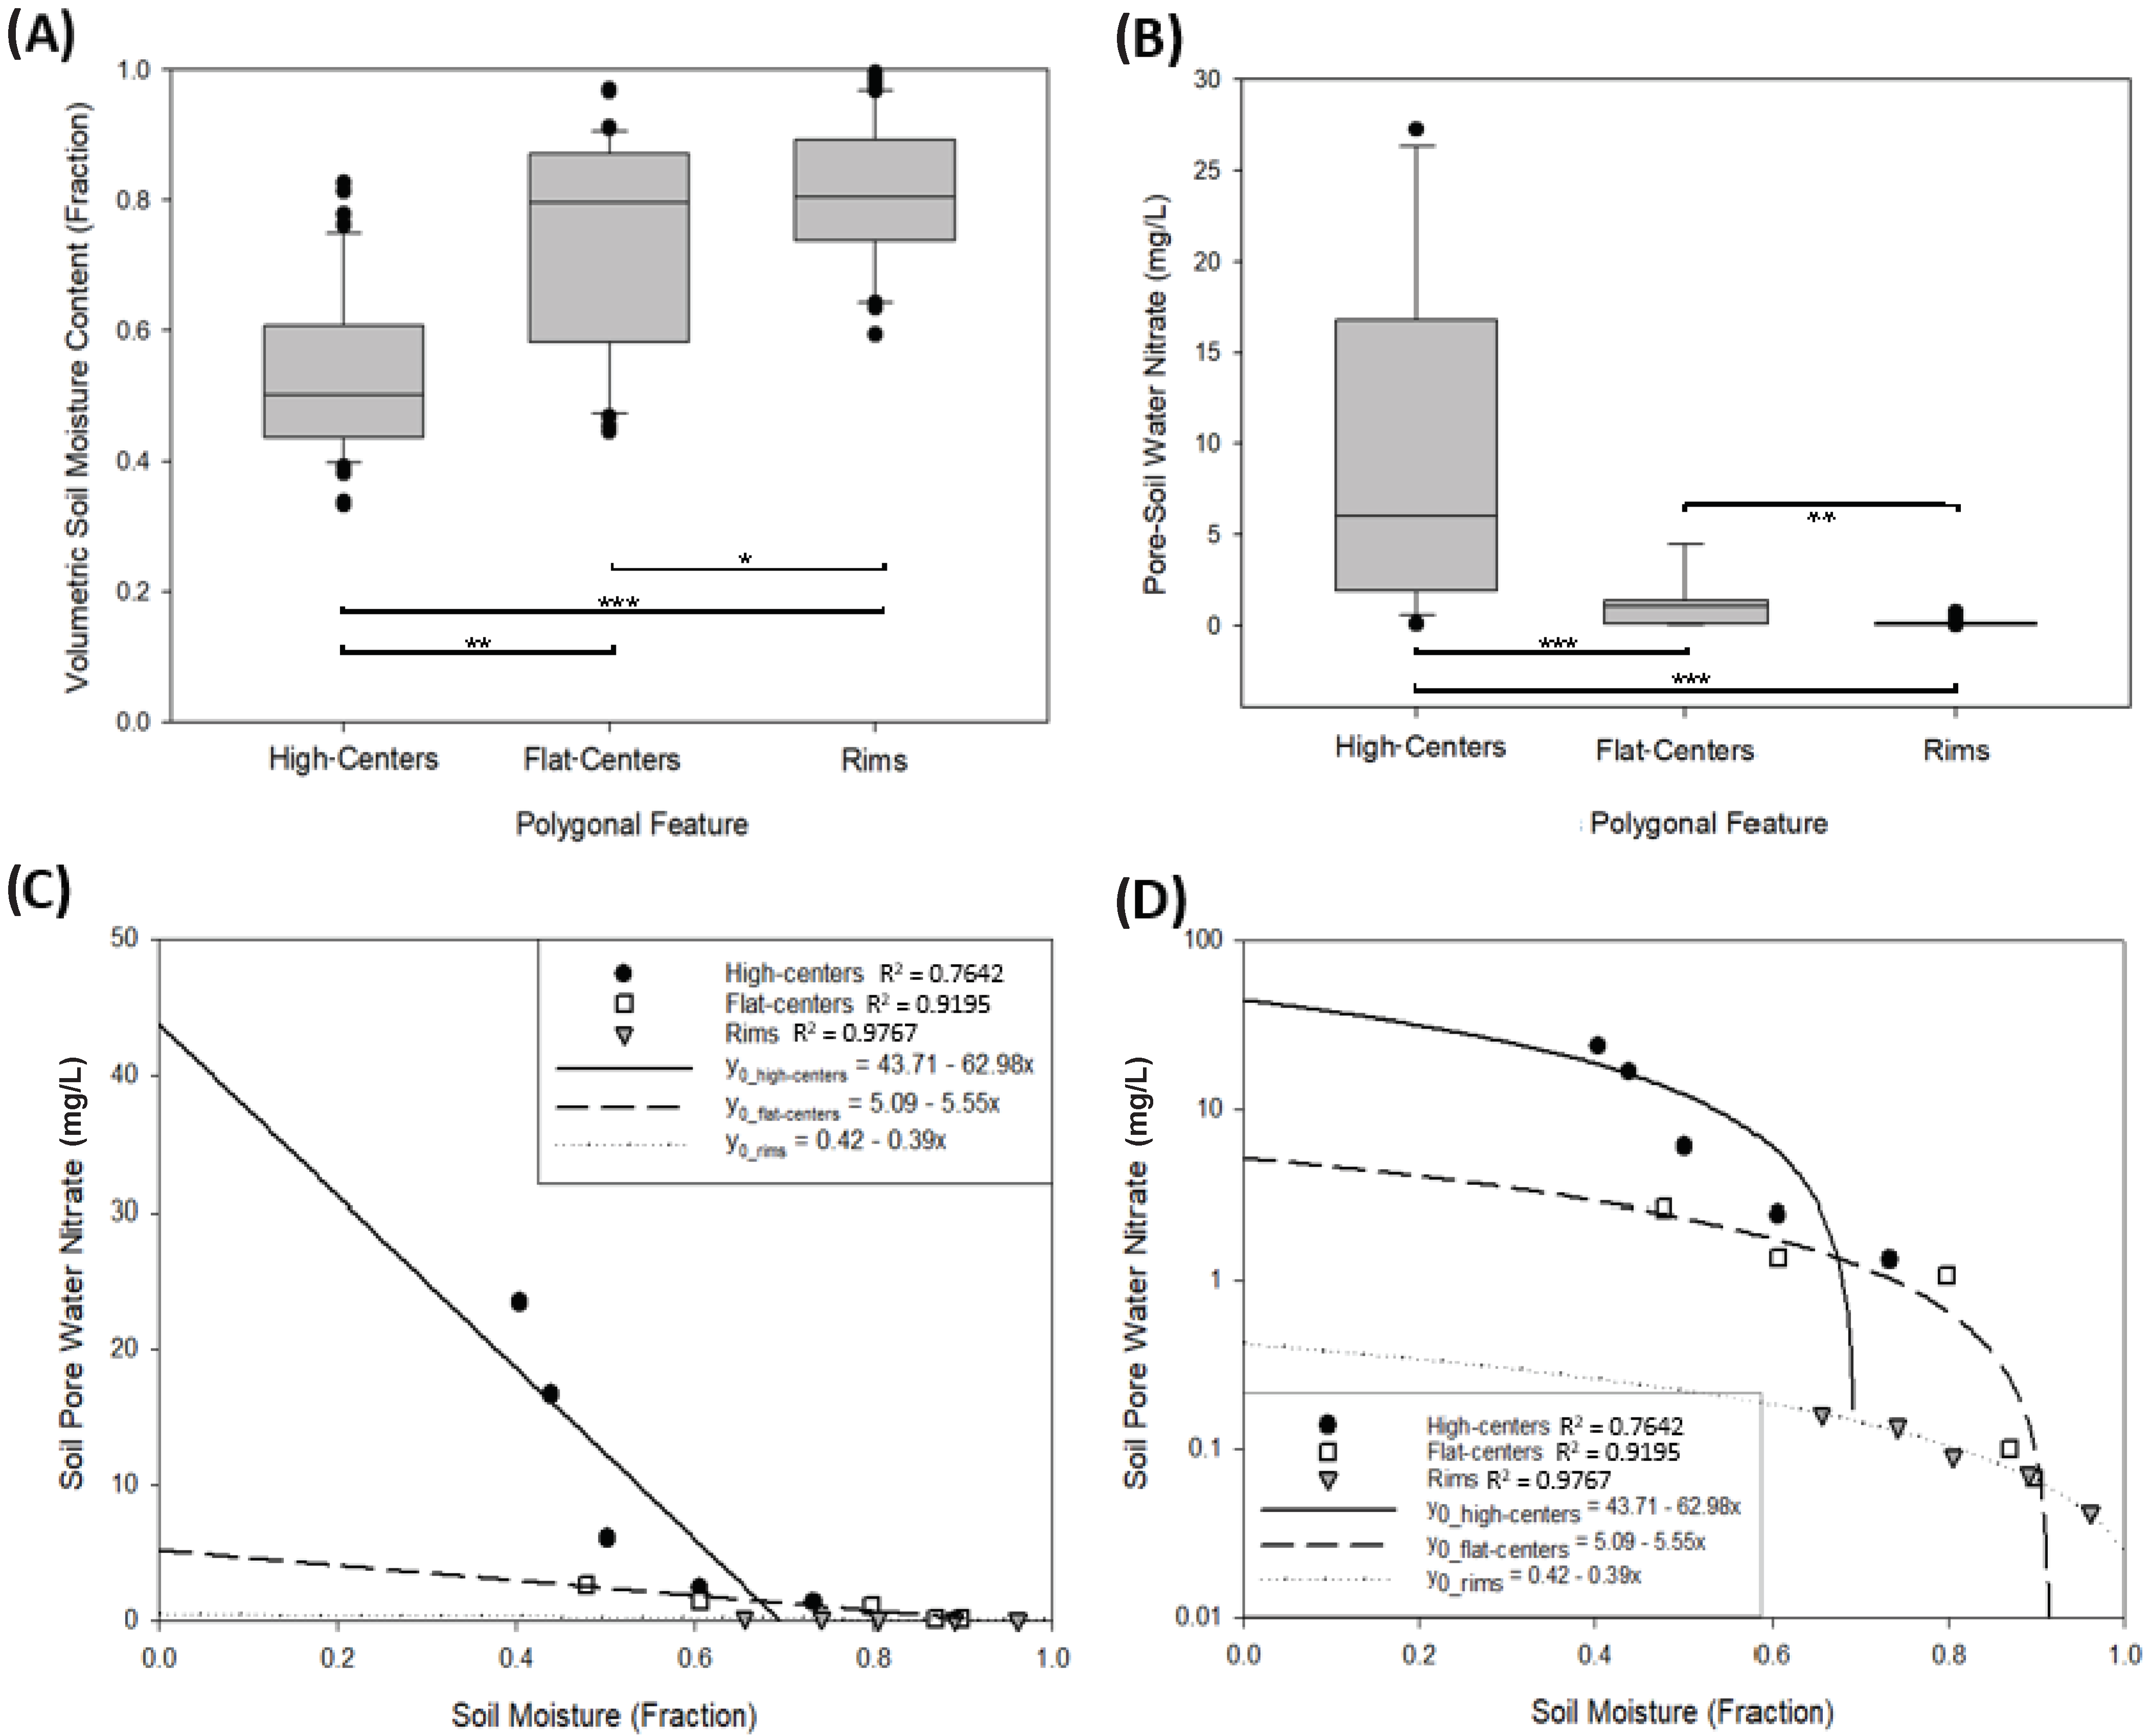
Our survey highlighted that NO3 concentrations and soil moisture content of the BEO polygonal features had a strong inverse correlation. This relationship was emphasized further when exploring the data with respect to microtopographic features (Figure 3A,B). We found that high-centers were the driest features and had the highest NO3 concentrations, rims were the wettest features and had the lowest NO3 concentrations, and flat-centers were intermediate for both soil moisture and NO3 concentrations. To further investigate these relationships, we plotted the quantiles (10%, 25%, 50%, 75%, and 90%) of soil moisture and NO3 concentrations and their regressions for each elevated polygon feature. The regressions demonstrated high levels of correlation between our parameters, where the soil moisture/NO3 relationships of rims had an R2 = 0.98, flat-centers had an R2 = 0.92, and high-centers had an R2 = 0.76 (Figure 3C,D). The quantiles of soil moisture and NO3 concentrations for all data, uncategorized by polygonal feature, did not produce as substantial of a regression relationship (R2 = 0.55).

3.2. NO3 Inventories from Study Area

The identified strong correlation between hydrogeomorphic features and NO3 concentration enabled the estimation of the NO3 inventory within our study area. While the statistical analysis (Figure 3) showed that microtopographical controls on soil moisture explained a significant portion of NO3 variability, other factors such as vegetation uptake likely explained the residual variation and were explored via the incorporation of various geospatial approaches. The four geospatial approaches were used to estimate the NO3 inventory (Figure 2), identify the total area coverage of high-centers, flat-centers, and rims in the study area, and incorporate additional controls on soil moisture-NO3 distributions (Table A2). The comparison of NO3 inventories calculated from the four geospatial approaches, and soil moisture and NO3 quantiles (Equation (1)) defined potential NO3 inventory ranges (based on assumptions that different quantiles are representative of the broader landscape) in the BEO. The integration of multiple geospatial approaches highlighted possible approach-based biases, with the acknowledgment that because of co-location sampling limitations and the use of quantiles, our calculated outcomes are approximation ranges and not absolute inventories.
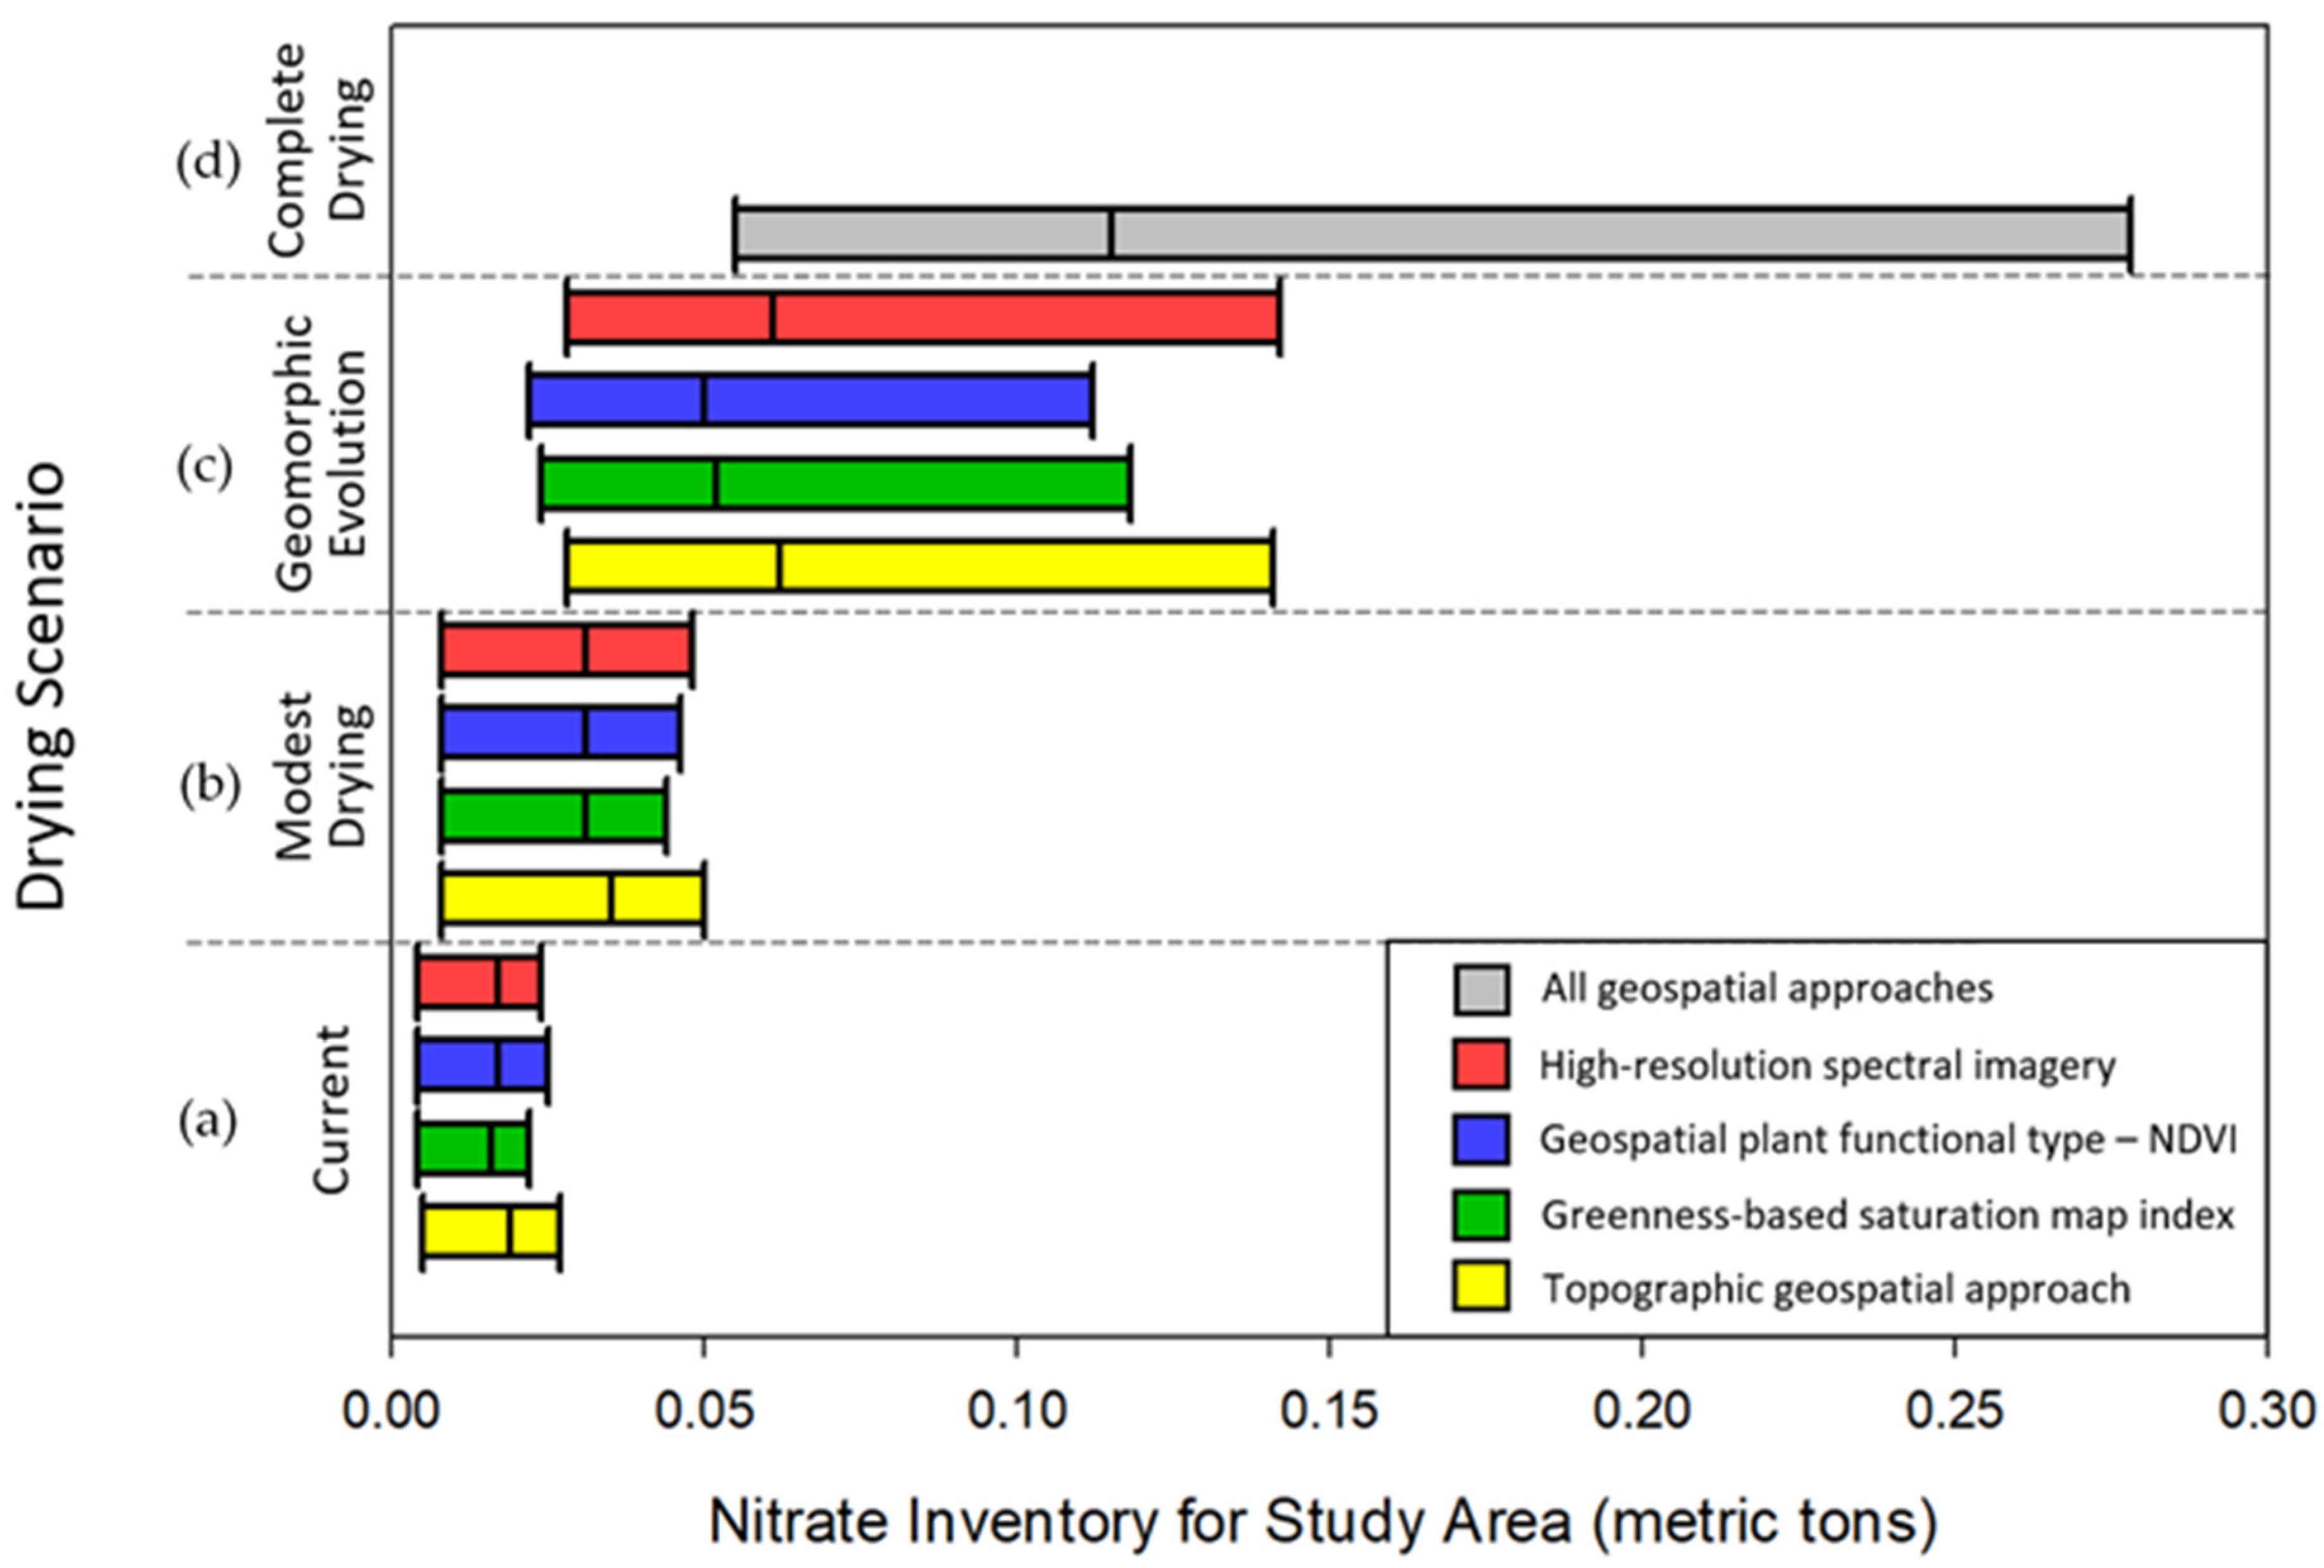
The ultimate minimum and maximum current NO3 inventory estimates resulting from our various quantile applications and four geospatial approaches were 0.008 and 0.028 metric tons, respectively (Figure 4a). The 50th quantile NO3 inventory estimates for the study area were 0.016, 0.014, 0.015, and 0.015 metric tons of NO3 for the topographic geospatial approach (Figure 2A), the combined topographic and greenness-based saturation map index approach (Figure 2B), the combined topographic and plant functional type approach (Figure 2C), and the combined topographic and high-resolution spectral imagery approach (Figure 2C), respectively (Figure 4a; Table A2).
Although all four of the approaches yielded similar distributions of unsaturated (i.e., NO3 production) with only a 13.5% or less difference between approaches (Figure 4a, Table A2), the application of the GIScorrection_feature (from Equation (1)) allowed for more representative inventories than relying on the assumption that all high-centers, flat-centers, and rims remain unsaturated. These differences may seem negligible but with our study area comprising only 0.191 km2, these minor differences would be amplified in a larger landscape and the application of multiple geospatial approaches could refine NO3 inventory estimations. Regardless of the geospatial approach used, the unsaturated area estimations were larger than saturated area estimations (Table A2) within our study site, so it is reasonable to suggest that the BEO is undergoing a large-scale transition from wet, low centered polygons to dry high-centered polygons and this degradation is likely already affecting NO3 inventories.

4. Discussion

Continued permafrost degradation in polygonal tundra landscapes will result in more extensive unsaturated zones, more efficient drainage, and shifts in polygon types, which will increase unsaturated soil volume and extent and correspondingly increase NO3- production. We acknowledge that dry microtopographic features will get drier, and wet microtopographic features will get wetter, but the wet features (rims and low centers) already produce negligible NO3- and were not included in our inventory calculations unless explicitly stated. From our defined relationship between elevated microtopographic feature, soil moisture content, and NO3- (Figure 2a–c), a decrease in soil saturation accompanying these hydrogeomorphic shifts was expected to cause an increase in NO3- production.
Our drying scenario approach was based on the established hydrogeomorphic evolution of microtopographic features with increased permafrost degradation (rims to flat-centers to high-centers [25,31]). Therefore, we inferred that thaw-related hydrogeomorphic changes will result in decreased near-surface (top 20 cm) soil moisture within the elevated microtopographic features within polygonal permafrost landscapes as projected by land models [47]. Although changes in soil moisture will likely be heterogeneous (e.g., wetter and drier) due to shifts in ground ice content, we made the assumption that hydrology will be largely dominated by first principles of polygonal landscape change trajectories of ice-wedge degradation and landscape drying observed over recent decades and projected across the pan-Arctic [25,47].
Because the drying of Arctic landscapes would increase the area coverage of unsaturated features and impact future NO3- inventories, we explored three potential drying scenarios related to permafrost degradation: 1) active layer deepening and expansion of unsaturated areas (i.e., ‘modest drying’); 2) geomorphic evolution of polygonal features; and 3) complete surface drying from increased drainage efficiency (likely not a realistic scenario but used to identify upper bounds of NO3- projections). Predicted inventories were based solely on production-driven changes as indicated by changing moisture content and did not consider changes related to the breakdown of previously frozen material (i.e., the ‘frozen feast’), or shifts in vegetation and microbial communities. Predicted inventories also focused solely on microtopographic drying and not on macrotopographic changes (e.g., the collapse of thermokarst features that could result in landscape wetting).
The ‘modest drying’ with a deepening active layer scenario depends on two considerations. First, we considered that seasonal (June to September) increases in unsaturated land coverage may roughly represent the magnitude of future inter-annual drying trends [27]. We compared green index imagery of the BEO from early summer 2013 to early fall 2015 and found a 15% increase in unsaturated land coverage (Figure 2B; equates to multiplying the Areafeature parameter in Equation (1) by 1.15). Second, because previous studies [48,49] found that changes in hydro geochemistry in permafrost regions correlated to thaw depth increase with increased Arctic warming, we considered an increased active layer thaw depth of an additional 6 cm [22], which increases the NO3- production depth from 20 to 26 cm for inventory calculations (modified Depth parameter in Equation (1)). The resulting increases in NO3 production from the ‘modest drying’ scenario produced a 50th quantile range of possible NO3 inventories of 0.035–0.038 metric tons of NO3 from our four geospatial approaches, which was 238–250% of the current NO3 estimations (Figure 4a,b, Table A2).
In the geomorphic evolution scenario, each polygonal feature shifted to the next driest polygonal feature in terms of moisture content and NO3 concentrations, except for rims. The geomorphic model of Jorgenson et al. [30] suggested rims would evolve to saturated troughs because of ice-wedge degradation, and thus would have negligible NO3. The total area covered by each geomorphic polygonal permafrost feature in this scenario was derived from Wainwright et al.’s [38] geomorphic map of the BEO landscape. In this scenario, troughs remain troughs with negligible NO3 concentrations, rims evolve to troughs, low-centers evolve to flat-center NO3 concentrations through topographic inversion, flat-centers evolve to high-center NO3 concentrations and high-centers remain at the same concentration range. Even though rims transition to troughs and become negligible in their NO3 contributions, low-centers which were formerly negligible in their NO3 contributions, evolve to flat-centers. The NO3 production of each ‘center’ feature increases in the ‘geomorphic evolution’ scenario (except for the high-centers). We observed a notable overall increase in the NO3 inventory potential of our landscape based on the combined evolution of polygonal microtopographic features (Figure 4c, Table A2). The resulting increases in NO3 production from the ‘modest drying’ scenario produced a 50th quantile range of possible NO3 inventories of 0.048–0.062 metric tons of NO3, which was 320–400% of the current NO3 estimations depending on the geospatial approach applied (Figure 4a,c).
In the extreme drainage ‘complete drying’ scenario, we assumed complete near-surface soil drainage [32] causing the entire region to become unsaturated with a NO3 production depth of 20 cm (the oxic depth would likely increase but we did not apply a depth correction factor in this scenario). Within this scenario, we applied high-center NO3 concentration ranges to the entire landscape. This extreme scenario is likely unrealistic but bounds the upper ranges of possible NO3 inventories within the BEO with various estimations depending on NO3 quantile applied in the calculation. The resulting complete drying 50th quantile NO3 inventory value was 0.122 metric tons of NO3, which was 763–871% of the current NO3 estimations depending on the geospatial approach applied (Figure 4a,d).
The NO3 inventory estimations provided above for all drying scenarios were based on the 50th quantile distributions of NO3 data within our designated microtopographic features. However, more conservative estimations of current and future inventories were calculated based on the 25th quantile distributions of NO3 data, and more generous estimations of current and future inventories were calculated based on the 75th quantile distributions of NO3 data (displayed as whisker ranges in Figure 4). Depending on which quantile and drying scenario were applied in any given future NO3 inventory estimation, an increase of 250–1000% of NO3 may be realized with projected climate warming and subsequent hydrogeomorphic evolution of polygonal permafrost landscapes.
The application of our three drying scenarios all produced a notable increase in NO3 inventories, with the modest drying/active layer deepening proxy scenario roughly doubling the current NO3 inventory, the geomorphic evolution scenario increased the current NO3 inventory by up to a factor of six, and the complete drying scenario increased the current NO3 inventory by roughly an order of magnitude (depending on quantile applied). While the modest drying/deepening active layer proxy scenario is more likely to occur in the near future than the complete drying scenario, these results suggest that increases in active layer thickness, the evolution of hydrologic processes, and landscape geomorphic reorganization associated with permafrost degradation will have a notable impact on NO3 production in regions dominated by polygonal permafrost.
The lack of a potential compensatory process to counter the increase in NO3 production would lead to an unprecedented accumulation of NO3 and would likely lead to increased microbial activity and shrubification [13,50]. Norby et al. [6] found that in dry conditions, plants are less able to utilize available NO3, resulting in NO3 accumulation. Thus, the excess NO3 would not only affect local ecosystems and species’ compositions [5] but it could also dramatically increase the primary productivity of streams, coastal environments, and oceans if NO3 is mobilized to aquatic systems from the landscape and if other nutrients are not limiting [3,12,13,18,21,22,37,51,52]. Scaling our study up to a larger region, if we assume that the entirety of the ~1000 km2 of polygonal terrain that comprises 53% of the Alaskan Arctic Coastal Plain [16], underwent the same drying evolution and NO3 production as the BEO, the potential increase in available NO3 in the Arctic would have immense consequences for ecosystem and climate feedbacks [2,19,22].
The preliminary constraints placed on anticipated hydrogeomorphic changes and associated NO3- availability in this study form a basis on which to build future investigations. Future research should include understanding how NO3- availability is shifting in other permafrost environments, macrotopographic evolution impacts on soil moisture and NO3- (e.g. thermokarst collapse), how new nitrogen resources might be utilized (including associated feedbacks with vegetation, microbial communities, etc.), and the proportion of local utilization versus export to streams and coastal areas. Such information will improve models of Arctic change and associated feedbacks to the carbon cycle in Global Climate Models, especially because permafrost N has immense climate feedback [53,54,55,56] and NO3- availability in tundra soils is crucial for predicting carbon storage [3,55,56].

5. Conclusions

The original and synthesized soil pore water NO3 and volumetric soil moisture observational data examined in this study showed that hydrogeomorphology is the dominant control on NO3 availability in the polygonal terrain of the BEO, and these findings are likely applicable to broader polygonal permafrost environments [18,19,57,58,59]. Through geospatial NO3 inventory estimations and drying scenarios, we demonstrated that changes in the hydrogeomorphology of Arctic polygonal tundra related to permafrost degradation could drive a substantial increase in future NO3 availability. We calculated the NO3 inventory of our study landscape and incorporated additional potential forcings by applying four geospatial approaches that utilized (1) microtopographic features, (2) a greenness-based saturation index, (3) plant functional types, and (4) a high-resolution spectral imagery derived wetness-index. We then applied three drying scenarios to our NO3 inventory estimates to assess potential future changes in NO3 availability, including (1) active layer deepening and expansion of unsaturated areas, (2) geomorphic evolution of polygonal features, and (3) complete surface drying from increased drainage efficiency. Regardless of the drying scenario applied, Arctic NO3 production will increase wherever soil drying due to hydrogeomorphic evolution occurs, with the magnitude of change dependent on the rate and extent of hydrologic evolution of the region and the baseline NO3 inventory of the system.
Depending on permafrost landscape classifications, there are three dominant climate-related controls on NO3 and N availability in permafrost environments: hydrogeomorphic change (this study and [7]), shrubification of the Arctic with N-fixing plant communities [4,10,11,12,13,58], and the thawing and release of previously frozen organic material [4,8]. All three processes will escalate and additively increase N and NO3 availability, suggesting that Arctic regions will experience a major shift in N availability from these three mechanisms as a result of permafrost degradation. Such increases would generate significant ecosystem feedback [37] and should be carefully considered within distinct permafrost classifications. From this study, we can state with confidence that the hydrogeomorphic evolution of polygonal permafrost will increase soil pore water NO3 within these landscapes with rising Arctic temperatures.

Author Contributions

Conceptualization, C.A.A., J.M.H., B.D.N. and C.J.W.; methodology, C.A.A., J.M.H., B.D.N., H.W., J.K., C.G.A., J.C. and B.D.; formal analysis, C.A.A.; investigation, C.A.A. and N.A.W.; resources, J.M.H., C.J.W. and S.D.W.; data curation, C.A.A.; writing—original draft preparation, C.A.A.; writing—review and editing, J.M.H., B.D.N., C.J.W., H.W., J.K., C.G.A., J.C., N.A.W., B.D. and S.D.W.; visualization, H.W., J.K., C.G.A., J.C. and B.D.; supervision, C.A.A., J.M.H., B.D.N., C.J.W. and S.D.W.; project administration, C.J.W. and S.D.W.; funding acquisition, C.J.W. and S.D.W. All authors have read and agreed to the published version of the manuscript.

Funding

This research was funded by the United States Department of Energy (DOE) Office of Science, Biological and Environmental Research program, as a part of the Next Generation Ecosystem Experiment, NGEE-Arctic. This manuscript has been authored (in part) by UT-Battelle, LLC, under contract DE-AC05-00OR22725 with the US Department of Energy (DOE). The US Government retains and the publisher, by accepting the article for publication, acknowledges that the US government retains a nonexclusive, paid-up, irrevocable, worldwide license to publish or reproduce the published form of this manuscript or allow others to do so, for US government purposes. DOE will provide public access to these results of federally sponsored research in accordance with the DOE Public Access Plan (http://energy.gov/downloads/doe-public-access-plan, accessed on 6 April 2022).

Institutional Review Board Statement

Not applicable.

Informed Consent Statement

Not applicable.

Data Availability Statement

All observational data used in this manuscript are publicly available. This manuscript uses data specific to the study area boundaries and microtopographic designations previously identified from five separate metadata files previously published under the NGEE-Arctic program. DOIs and hyperlinks are provided as follows: soil moisture and hydro geochemistry data from the 2012 and 2013 campaigns, https://doi.org/10.5440/1179130 (accessed on 11 October 2018), https://doi.org/10.5440/1126515 (accessed on 11 October 2018); hydro geochemistry data from the 2013 campaign, https://doi.org/10.5440/1226245 (accessed on 11 October 2018); original soil moisture and hydro geochemistry data from the 2016 and 2017 campaigns, https://doi.org/10.5440/1544779 (accessed on 11 October 2018); and LiDAR and aerial data from BEO, https://doi.org/10.5440/1136189, https://doi.org/10.5440/1167159 (Accessed on 7 May 2017).

Acknowledgments

We would like to thank the Ukpeaġvik Iñupiat Corporation for allowing us access to the Barrow Environmental Observatory and Barrow Arctic Research Center located in Utqiaġvik, AK, which is the ancestral land of the Iñupiat Peoples. We heartily thank members of LANL’s Geochemistry and Geomaterials Research Laboratory (especially George Perkins) for their assistance with generating the observational data in this manuscript. We thank Rusen Öktem for their contributions to the aerial imagery and concepts used for the greenness-based saturation index methodology. We thank Joel Rowland for conversations and guidance regarding the hydrogeomorphic drying approach used in this study. We also extend our thanks to all members of NGEE-Arctic who assisted with the fieldwork required to obtain original samples and previously published observational metadata for this manuscript.

Conflicts of Interest

The authors declare no conflict of interest. The funders had no role in the design of the study; in the collection, analyses, or interpretation of data; in the writing of the manuscript, or in the decision to publish the results.

Appendix A

Appendix A.1. Sources of Nitrate

Atmospheric deposition of NO3, microbial mineralization, and nitrification of soil organic matter are inputs of NO3 to Arctic soils. Isotopic analyses of NO3 samples from previous studies investigating BEO polygonal features indicate that the NO3 present in the BEO is predominantly derived from microbial nitrification and that atmospheric NO3 inputs are quickly turned over [22]. However, Arctic tundra ecosystems are N-limited overall [37,49]. NO3 variability within our study location can be partially attributed to plant community types, which have an important role in nitrogen fixation and production and consumption [12,17]. While our study environment is not experiencing shrubification, mosses and lichens slow N-mineralization rates but enhance fixation, and graminoids accelerate nitrogen turnover [7]. The availability and quality of soil organic matter to decomposers, the composition of the decomposer community, and the hydraulics present within microtopography will also be important factors.

Appendix A.2. Detailed Methods

Defining the Relationship between Soil Moisture and NO3

Because the statistical distributions of all our data showed a dominant inverse relationship between NO3 concentrations and soil moisture content (particularly emphasized when further categorized by polygonal feature), we employed an appropriate inverse statistical quantile regression that relied on the distribution of values rather than a direct linear regression. Thus, the application of an inverse statistical quantile distribution regression of the soil moisture and NO3 compositions for each polygonal feature accounted for sampling variability and allowed us to compare these parameters directly even with limited co-located samples.
Out of 145 NO3 concentrations and 336 soil moisture measurements that were collected from high-centers/flat-centers/rims over the four field campaigns, we only had 13 co-located samples due to logistical challenges and sampling limitations encountered in the field. Thus, we did not have enough co-located soil moisture and NO3 concentration samples to define a mathematical relationship between the two parameters. However, we were able to view the statistical distribution trends by taking the quartiles of all the moisture content data and NO3 concentration data of the differing microtopographic features to illustrate the general inverse relationship between the two parameters (Table A1; Figure 2C,D). Within the inverse quantile relationship we correlated:
  • The 0–10% distribution of NO3 with the 90–100% distribution of soil moisture;
  • The 10–25% distribution of NO3 with the 75–90% distribution of soil moisture;
  • The 25–50% distribution of NO3 with the 50–75% distribution of soil moisture;
  • The 50–75% distribution of NO3 with the 25–50% distribution of soil moisture;
  • The 75–90% distribution of NO3 with the 10–25% distribution of soil moisture;
  • The 90–100% distribution of NO3 with the 0–10% distribution of soil moisture.
Table A1. Statistical distribution breakdown of all NO3 concentrations and volumetric soil moisture content data (synthesized from the 2012, 2013, 2016, and 2017 field campaigns) by elevated polygonal microtopographic feature (rims, flat-centers, high-centers, and all features), including minimum value, the 10th, 25th, 50th, 75th, and 90th percentiles of data distribution, and maximum value. Q1 is equal to the 25th quantile of data distribution, Q2 is equal to the 50th quantile of data distribution, and Q3 is equal to the 75th quantile of data distribution.
FeatureParameternMin10%25%50%75%90%Max
RimsNO3 (mg/L)310.0220.0420.0700.0900.1350.1600.730
Volumetric soil moisture fraction1520.5940.6560.7420.8050.8900.9610.995
Flat-CentersNO3 (mg/L)490.0510.0660.0991.0521.3472.0004.442
Volumetric soil moisture fraction970.4450.4780.6060.7970.8700.8970.970
High-CentersNO3 (mg/L)650.0821.3202.3986.00016.60923.40027.260
Volumetric soil moisture fraction870.3330.4030.4380.5020.6050.7330.827
All FeaturesNO3 (mg/L)1450.0220.0510.0800.1200.6154.46027.260
Volumetric soil moisture fraction3360.3330.44310.5130.7320.8500.9030.995

Appendix A.3. Geospatial Methods

Assessing the distribution of features, we discretized the study area into zones of different levels of moisture content (and thus NO3 concentrations) based on our polygon feature-specific soil moisture-NO3 distributions and geospatial approaches. The resulting discretizations are shown in Figure 2, where the complexities of the polygonal microtopography, moisture proxies, and vegetation characteristics are readily apparent. All four of the geospatial approaches utilized in this study yielded similar distributions of saturated and unsaturated areas where there was a 4% or less difference between approaches (Table A2), suggesting that the estimates of moisture variability in the polygonal terrain are robust. This limited variability is largely due to our use of microtopographic designations (from [38]) to identify the distribution of NO3, with additional soil moisture-NO3 corrections on the inventory from the variability of plant community types [44,45], a greenness-based saturation index [41,42], and a high-resolution spectral imagery derived wetness-index [16,46] that were applied to our study area (Figure 2).
Possible complications with the use of multiple-geospatial approaches are that the geospatial datasets were not all collected during the same year or the same month/timeframe within a summer warming period. These temporal discrepancies may result in interannual or seasonal variations in the wet/dry areas predicted from each of these geospatial models. Additionally, the resolution of these geospatial models varies based on methodology. To account for possible biases from temporal and spatial resolution differences from any given approach, we report all the geospatial approach details as follows.

Appendix A.3.1. Topographic, Polygon Geomorphology-Based Saturation Map

Wainwright et al. [38] established that polygon type has a significant control on surface and subsurface properties (including soil moisture, ice-wedge density, ice content, and active layer thickness) in addition to carbon fluxes. A map distinguishing polygon types (i.e., low/flat/high-centered polygons) for the BEO was produced by Wainwright et al. [38]. For this study, this BEO region polygon geomorphology-based map was further sub-classified into microtopographic features (i.e., rims, centers, and troughs) within each polygon. Microtopography was extracted from LiDAR DEM, by removing the average elevation (i.e., macro topography) relative to the centers of polygons. The microtopographic high and low regions were then quantified by setting zero elevation as the threshold. The identified polygon features were defined as:
  • Troughs: microtopographic low regions along with the polygon boundaries;
  • Rims: high regions in flat- and low-centered polygons;
  • Low-centers: low regions within flat- and low-centered polygons; and
  • High-centers: high regions within high-centered polygons.
The combination of polygon types and sub features resulted in nine geomorphological classes: {troughs, rims, centers} in the flat- and low-centered polygons, and {troughs, centers} in the high-centered polygons (Figure 2A). Linking these classifications to soil moisture and saturation, regions of high topography were drier relative to regions of lower topography, and field observations suggested that soil moisture and surface inundation do not change profoundly after the initial snowmelt period. In particular, the spatial distribution of saturated areas remains constant throughout the growing season. Therefore, in this study, we assumed that the troughs and centers of low-centers polygons are saturated throughout the year.

Appendix A.3.2. Greenness-Based Saturation Map Index

This geospatial approach used an orthomosaic map reconstructed from images collected with a RGB (Red, Green, Blue) color digital camera mounted on a manned aircraft that flew at low altitude across the investigated site on 7 August 2013.
The greenness index (gI) map is computed from the orthomosaic as the following ratio:
gI(x,y) = G(x,y)/(R(x,y) + G(x,y) + B(x,y)),
where R, G, and B refer to the red, green, and blue chromatic channels, and (x,y) refer to the pixel position, respectively [41]. Although this is a pixel-based operation, the processing is performed over a lower resolution image that is decimated by a factor of four compared to the original orthomosaic. With very high-resolution aerial images, such as in Figure 2B, decimation (via low pass filtering with a cubic kernel) was preferred not only to decrease the size of data for reducing computational complexity but also to smooth out noise in the data (very high frequencies) that would otherwise result in excessive transitions. The final pixel size of the image was about 0.32 by 0.32 m. Application of a greenness index to a specific region allows for the extraction and defining of areas with vegetation, however, gI alone is not sufficient to identify wet regions without visible vegetation growth, such as the deep ponds. The saturation (sat) is defined for each pixel as:
sat = (max(R,G,B) − min(R,G,B))/max(R,G,B),
where max(R,G,B) and min(R,G,B) are metrics that help discriminate between wet and dry regions. To be more specific, ponds exhibit low vegetative coverage or saturation, and dry regions exhibit high intensities for max(R,G,B). Therefore, a basic classification can be performed by imposing the following rules:
  • (x,y) is likely to be pond if gI(x,y) < threshold_gI_l, or max(R,G,B) < threshold_mx_l, or sat(x,y) < threshold_sat;
  • (x,y) is likely to be vegetation if gI(x,y) > threshold_gI_h, or max(R,G,B) < threshold_mx_h;
  • If none of these criteria are met, (x,y) is likely to be dry.
The threshold values used in this study were obtained by ground-based observations. The aforementioned rules were used to generate binary masks to identify wet regions. A binary opening operation was applied to the wet mask to remove isolated pixels without interfering with the ‘dry’ regions.

Appendix A.3.3. Plant Functional Type (NDVI)

The Barrow Peninsula vegetation map describes the spatial distribution of seven distinct vegetation communities (aquatic graminoid, seasonally flooded graminoid, wet graminoid, moist graminoid, dry-moist graminoid, dry dwarf graminoid, dry dwarf shrub). These communities are associated with a moisture and micro topographic gradient and derived using a Non-metric Multidimensional Scaling (NMS) and proven methods [44]. This map was produced using a supervised classification (minimum-distance algorithm) of atmospherically corrected, orthorectified, and pan-sharpened multispectral Worldview-2 satellite imagery mosaic (spatial resolution of 0.5 m) during the peak growing season (4 August 2010. A Normalized Difference Vegetation Index (NDVI) was derived from the multispectral satellite dataset and added to the image stack to improve plant community classification [45]. The resulting map (Figure 2C) had a high classification accuracy of 77% (Kappa: 0.7347) based on a set of 482 independent ground-truth plots distributed across the peninsula that were associated with long-term ecological studies in the area [44,45].

Appendix A.3.4. High-Resolution Spectral Imagery:

Vegetation plays an important role in mediating the fine-scale variation in soil moisture in the Arctic ecosystem. In addition, local topography and soil properties lead to heterogeneous and fine-scale variations in soil moisture conditions. Diverse vegetation communities in the Arctic often exhibit an affinity towards available soil moisture and preferentially grow in regions with suitable topographic and moisture conditions. Thus, the distribution and abundance of vegetation communities are indicators of soil moisture conditions across the landscape. Langford et al. [46] developed a high-resolution distribution map of five dominant vegetation communities (wet tundra graminoid, dry tundra graminoid, forb, moss, and lichen) at the Barrow Environmental Observatory using multi-spectral data from WorldView-2 satellites and airborne LiDAR-derived elevation data. Wet and dry tundra graminoids especially showed preferential distributions towards the regions with high and low soil moisture, respectively. Using relative area distribution of wet and dry tundra graminoids (based on data from [46]) as a proxy, fractional saturated areas were calculated for the study area (Figure 2D).

Appendix A.4. NO3 Inventories

NO3 inventories (Table A2) of the study location were calculated using Equation (1), the NO3 and soil moisture quantiles defined in Table A1, the four geospatial approaches defined above and in Figure 2, and the drying scenarios defined in the discussion and Figure 4.
Table A2. Compilation of the remote-sensing geospatial approaches used to upscale our experimental NO3 concentration and soil moisture data to the larger BEO to predict current and potential future NO3 inventories (see Appendix A.3. for more in-depth method details). Predicted area percent coverage of unsaturated regions within our study site is listed for each geospatial approach. NO3 inventories calculated using each geospatial approach are displayed, calculated by Equation (1), using the median NO3 concentration data and soil moisture content data distribution values for each polygonal feature identified. Averages of estimations provide bounds on possible saturated versus unsaturated areas as identified by the different geospatial approaches.
Geospatial MethodTopographic Geospatial Approach
[38]
Greenness and Saturation Based Map
[41,42,43]
Plant Community Types—NDVI
[44,45]
High-Resolution Spectral Imagery
[16,46]
Average
Technique
Description
Microtopography was extracted from LiDAR DEM, by removing the average elevation relative to the centers of polygons to classify troughs, rims, low-centers, flat-centers, and high-centers.Color orthomosaic was used to infer greenness and saturation indexes that serve to identify saturated vs. unsaturated land cover.Total coverage by different plant communities that are associated with varying soil moisture regimes: wet graminoids, dry graminoids, forbs, lichens, and mosses. Classification based on sub-meter multi-spectral imagery and NDVI.Multi-spectral data from WorldView-2 satellites and airborne LiDAR-derived elevation data coupled with wet/dry graminoid distributions.-
% Area
Unsaturated
61.359.762.457.660.3
Current NO3 Inventory
(metric tons)
0.0160.0140.0150.0150.015
Modest Drying NO3 Inventory (metric tons)0.0380.0350.0360.0360.036
Geomorphic Evolution NO3 Inventory
(metric tons)
0.0620.0500.0480.0600.055
Complete
Drying NO3
Inventory
(metric tons)
0.1220.1220.1220.1220.122

References

  1. Jorgenson, M.T.; Harden, J.; Kanevskiy, M.; O’Donnell, J.; Wickland, K.; Weing, S.; Manies, K.; Zhuang, Q.; Shur, Y.; Striegl, R.; et al. Reorganization of vegetation, hydrology and soil carbon after permafrost degradation across heterogeneous boreal landscapes Environ. Res. Lett. 2013, 8. [Google Scholar] [CrossRef]
  2. O’Donnell, J.; Douglas, T.; Barker, A.; Guo, L. Changing biogeochemical cycles of organic carbon, nitrogen, phosphorus, and trace elements in Arctic rivers. In Arctic Hydrology, Permafrost and Ecosystems; Yang, D., Kane, D.L., Eds.; Springer: Cham, Denmark, 2021; pp. 315–348. [Google Scholar] [CrossRef]
  3. McClelland, J.W.; Stieglitz, M.; Pan, F.; Holmes, R.M.; Peterson, B.J. Recent changes in nitrate and dissolved organic carbon export from the upper Kuparuk River, North Slope, Alaska. J. Geophys. Res. 2007, 111, G04S60. [Google Scholar] [CrossRef]
  4. Salmon, V.G.; Soucy, P.; Mauritz, M.; Celis, G.; Natali, S.M.; Mack, M.C.; Schuur, E.A.G. Nitrogen availability increases in a tundra ecosystem during five years of experimental permafrost thaw. Glob. Chang. Biol. 2016, 22, 1927–1941. [Google Scholar] [CrossRef] [PubMed]
  5. Liu, X.-Y.; Koba, K.; Koyama, L.A.; Hobbie, S.E.; Weiss, M.S.; Inagaki, Y.; Shaver, G.R.; Giblin, A.E.; Hobara, S.; Nadelhoffer, K.J.; et al. Nitrate is an important nitrogen source for Arctic tundra plants. PNAS USA 2018, 115, 3398–3403. [Google Scholar] [CrossRef] [Green Version]
  6. Norby, R.J.; Sloan, V.L.; Iversen, C.M.; Childs, J. Controls on fine-scale spatial and temporal variability of plant available inorganic nitrogen in a polygonal tundra landscape. Ecosystems 2018, 22, 528–543. [Google Scholar] [CrossRef] [Green Version]
  7. Biasi, C.; Wanek, W.; Rusalimova, O.; Kaiser, C.; Meyer, H.; Barsukov, P.; Richter, A. Microtopography and plant-cover controls on nitrogen dynamics in hummock tundra. Arct. Antarct. Alp. Res. 2005, 37, 435–443. [Google Scholar] [CrossRef] [Green Version]
  8. Keuper, F.; van Bodegom, P.M.; Dorrepaal, E.; Weedon, J.T.; van Hal, J.; van Logtestijn, R.S.P.; Aerts, R. A frozen feast: Thawing permafrost increases plant-available nitrogen in subarctic peatlands. Glob. Chang. Biol. 2012, 18, 1998–2007. [Google Scholar] [CrossRef]
  9. Barnes, R.T.; Williams, M.W.; Parman, J.N.; Hill, K.; Caine, N. Thawing glacial and permafrost features contribute to nitrogen export from Green Lakes Valley, Colorado Front Range, USA. Biogeochemistry 2014, 117, 413–430. [Google Scholar] [CrossRef] [Green Version]
  10. Salmon, V.G.; Breen, A.L.; Kumar, J.; Lara, M.J.; Thornton, P.E.; Wullschleger, S.D.; Iversen, C.M. Alder distribution and expansion across a tundra hillslope: Implications for local N cycling. Front. Plant Sci. 2019, 10. [Google Scholar] [CrossRef]
  11. McCaully, R.E.; Arendt, C.A.; Newman, B.D.; Salmon, V.G.; Heikoop, J.M.; Wilson, C.J.; Sevanto, S.; Wales, N.A.; Perkins, G.B.; Marina, O.C.; et al. High temporal and spatial nitrate variability on an Alaskan hillslope dominated by alder shrubs. Cryosphere 2022, 16, 1889–1901. [Google Scholar] [CrossRef]
  12. Hiltbrunner, E.; Aerts, R.; Buhlmann, T.; Huss-Danell, K.; Magnusson, B.; Myrold, D.D.; Reed, C.; Sigurdsson, B.D.; Korner, C. Ecological consequences of the expansion of N2-fixing plants in cold biomes. Oecologia 2014, 176, 11–24. [Google Scholar] [CrossRef] [PubMed] [Green Version]
  13. Mekonnen, Z.A.; Riley, W.J.; Grant, R.F. Accelerated nutrient cycling and increased light competition will lead to 21st century shrub expansion in North American Arctic Tundra. J. Geophys. Res. Biogeosci. 2017, 123, 1683–1701. [Google Scholar] [CrossRef]
  14. Gamon, J.A.; Huemmrich, K.F.; Stone, R.S.; Tweedie, C.E. Spatial and temporal variation in primary productivity (NDVI) of coastal Alaskan tundra: Decreased vegetation growth following earlier snowmelt. Remote Sens. Environ. 2013, 129, 144–153. [Google Scholar] [CrossRef] [Green Version]
  15. Lara, M.J.; Nitze, I.; Grosse, G.; Martin, P.; McGuire, A.D. Reduced arctic tundra productivity linked with landform and climate change interactions. Sci. Rep. 2018, 8. [Google Scholar] [CrossRef] [PubMed]
  16. Lara, M.J.; McGuire, A.D.; Euskirchen, E.S.; Tweedie, C.E.; Hinkle, K.M.; Skurikhin, V.E.; Romanovsky, V.E.; Grosse, G.; Bolton, W.R.; Genet, H. Polygonal tundra geomorphological change in response to warming alters future CO2 and CH4 flux on the Barrow Peninsula. Glob. Chang. Biol. 2015, 21, 1634–1651. [Google Scholar] [CrossRef]
  17. Chapin, F.S.; Fetcher, N.; Kielland, K.; Everett, K.R.; Linkins, A.E. Productivity and nutrient cycling of Alaskan tundra: Enhancement by flowing soil water. Ecology 1988, 69, 693–702. [Google Scholar] [CrossRef]
  18. Binkley, D.; Stottlemyer, R.; Suarez, F.; Cortina, J. Soil nitrogen availability in some arctic ecosystems in northwest Alaska: Responses to temperature and moisture. Ecoscience 1994, 1, 64–70. [Google Scholar] [CrossRef]
  19. Stutter, M.I.; Billett, M.F. Biogeochemical controls on stream water and soil solution chemistry in a High Arctic environment. Geoderma 2003, 113, 127–146. [Google Scholar] [CrossRef]
  20. Frey, K.E.; McClelland, J.W.; Holmes, R.M.; Smith, L.C. Impacts of climate warming and permafrost thaw on the riverine transport of nitrogen and phosphorus to the Kara Sea. J. Geophys. Res. 2007, 112, G04S58. [Google Scholar] [CrossRef]
  21. Lafrenière, M.; Lamoureux, S.F. Seasonal dynamics of dissolved nitrogen exports from two High Arctic watersheds, Melville Island, Canada. Hydrol. Res. 2008, 39, 324–335. [Google Scholar] [CrossRef]
  22. Harms, T.K.; Jones, J.B. Thaw depth determines reaction and transport of inorganic nitrogen in valley bottom permafrost soils: Nitrogen cycling in permafrost soils. Glob. Chang. Biol. 2012, 18, 2958–2968. [Google Scholar] [CrossRef] [PubMed]
  23. Heikoop, J.M.; Throckmorton, H.M.; Newman, B.D.; Perkins, G.B.; Iversen, C.M.; Chowdhury, T.R.; Romanovsky, V.; Graham, D.E.; Norby, R.J.; Wilson, C.J.; et al. Isotopic identification of soil and permafrost nitrate sources in an Arctic tundra ecosystem. J. Geophys. Res. Biogeosci. 2015, 120, 1000–1017. [Google Scholar] [CrossRef]
  24. Newman, B.D.; Throckmorton, H.; Graham, D.E.; Hubbard, S.S.; Liang, L.; Wu, Y.; Heikoop, J.M.; Herndon, E.M.; Phelps, T.J.; Wilson, C.J.; et al. Microtopographic and depth controls on active layer chemistry in Arctic polygonal ground. Geophys. Res. Lett. 2015, 42, 1808–1817. [Google Scholar] [CrossRef]
  25. Liljedahl, A.K.; Boike, J.; Daanen, R.N.; Fedorov, A.N.; Frost, G.V.; Grosse, G.; Hinzman, L.D.; Iijma, Y.; Jorgenson, J.C.; Matveyeva, N.; et al. Pan-Arctic ice-wedge degradation in warming permafrost and its influence on tundra hydrology. Nat. Geosci. 2016, 9, 312–318. [Google Scholar] [CrossRef]
  26. Koch, J.C.; Jorgenson, M.T.; Wickland, K.P.; Kanevskiy, M.; Striegl, R. Ice wedge degradation and stabilization impact ater budgets and nutrient cycling in Arctic trough ponds. J. Geophys. Res: Biogeosci. 2018, 123, 2604–2616. [Google Scholar] [CrossRef]
  27. Hinzman, L.D.; Deal, C.J.; McGuire, A.D.; Mernild, S.H.; Polyakov, I.V.; Walsh, J.E. Trajectory of the Arctic as an integrated system. Ecol. Appl. 2013, 23, 1837–1868. [Google Scholar] [CrossRef]
  28. Walvoord, M.A.; Kurylyk, B.L. Hydrologic impacts of thawing permafrost—A review. Vadose Zone J. 2016, 15. [Google Scholar] [CrossRef]
  29. Leffingwell, E. Ground Ice Wedges: The dominant form of ground-ice on the north coast of Alaska. J. Geol. 1915, 23, 635–654. [Google Scholar] [CrossRef]
  30. Jorgenson, M.T.; Shur, Y.L.; Pullman, E.R. Abrupt increase in permafrost degradation in Arctic Alaska. Geophys. Res. Lett. 2006, 33, L02503. [Google Scholar] [CrossRef]
  31. Dafflon, B.; Hubbard, S.; Ulrich, C.; Peterson, J.; Wu, Y.; Wainwright, H.; Kneafsey, T.J. Geophysical estimation of shallow permafrost distribution and properties in an ice-wedge polygon-dominated Arctic tundra region. Geophysics 2016, 81, WA247–WA263. [Google Scholar] [CrossRef]
  32. Engstrom, R.; Hope, A.; Kwon, H.; Stow, D.; Zamolodchikov, D. Spatial distribution of near surface soil moisture and its relationship to microtopography in the Alaskan Arctic coastal plain. Hydrol. Res. 2005, 36, 219–234. [Google Scholar] [CrossRef]
  33. Woo, M.K.; Guan, X.J. Hydrological connectivity and seasonal storage change of tundra ponds in a polar oasis environment: Canadian High Arctic. Permafr. Periglac. Process. 2006, 17, 209–323. [Google Scholar] [CrossRef]
  34. Gersper, P.L.; Alexander, V.; Barkley, S.A.; Barsdate, R.J.; Flint, P.S. The soils and their nutrients. In An Arctic Ecosystem: The Coastal Tundra at Barrow, Alaska; Brown, J., Ed.; Dowden, Hutchinson and Ross: Stroudsburg, PA, USA, 1980; pp. 219–254. [Google Scholar]
  35. Seeberg-Elverfeldt, J.; Schlüter, M.; Feseker, T.; Kölling, M. Rhizon sampling of porewaters near the sediment-water interface of aquatic systems. Limnol. Oceanogr. Meth. 2005, 3, 361–371. [Google Scholar] [CrossRef]
  36. Romano, N. Soil moisture at local scale: Measurements and simulations. J. Hydrol. 2014, 514, 6–20. [Google Scholar] [CrossRef]
  37. Barsdate, R.J.; Alexander, V. The nitrogen balance of Arctic Tundra: Pathways, rates, and environmental implications. J. Environ. Qual. 1975, 4, 111–117. [Google Scholar] [CrossRef]
  38. Wainwright, H.M.; Dafflon, B.; Smith, L.J.; Hahn, M.S.; Curtis, J.B.; Wu, Y.; Ulrich, C.; Peterson, J.E.; Torn, M.S.; Hubbard, S.S. Identifying multiscale zonation and assessing the relative importance of polygon geomorphology on carbon fluxes in an Arctic tundra ecosystem. J. Geophys. Res. Biogeosci. 2015, 120, 788–808. [Google Scholar] [CrossRef]
  39. Wu, Y.; Ulrich, C.; Kneafsey, T.J.; Lopez, R.; Chou, C.; Geller, J.; McKnight, K.; Dafflon, B.; Soom, F.; Peterson, J.; et al. Depth-resolved physiochemical characteristics of active layer and permafrost soils in an Arctic polygonal tundra region. J. Geophys. Res. Biogeosci. 2018, 123, 1136–1386. [Google Scholar] [CrossRef] [Green Version]
  40. Hubbard, S.S.; Gangodagamage, C.; Dafflon, B.; Wainwright, H.; Peterson, J.; Gusmeroli, A.; Urlich, C.; Wu, Y.; Wilson, C.J.; Rowland, J.C.; et al. Quantifying and relating land-surface and subsurface variability in permafrost environments using LiDAR and surface geophysical datasets. Hydrogeol. J. 2013, 21, 149–169. [Google Scholar] [CrossRef]
  41. Dafflon, B.; Oktem, R.; Peterson, J.; Ulrich, C.; Tran, A.P.; Romanovsky, V.; Hubbard, S.S. Coincident aboveground and belowground autonomous monitoring to quantify covariability in permafrost, soil, and vegetation properties in Arctic tundra. J. Geophys. Res. Biogeosci. 2017, 122, 1321–1342. [Google Scholar] [CrossRef] [Green Version]
  42. Hobbie, J.; Shaver, G.; Rastetter, E.; Cherry, J.; Goetz, S.; Guay, K.; Gould, W.; Kling, G. Ecosystem responses to climate change at a Low Arctic and a High Arctic long-term research site. Ambio 2017, 46, 160–173. [Google Scholar] [CrossRef] [Green Version]
  43. Wainwright, H.M.; Oktem, R.; Dafflon, B.; Dengel, S.; Curtis, J.B.; Torn, M.S.; Cherry, J.; Hubbard, S.S. High-resolution spatio-temporal estimation of net ecosystem exchange in ice-wedge polygon tundra using in situ sensors and remote sensing data. Land 2021, 10, 722. [Google Scholar] [CrossRef]
  44. Villarreal, S.; Hollister, R.D.; Johnson, D.R.; Lara, M.J.; Webber, P.J.; Tweedie, C.E. Tundra vegetation change near Barrow, Alaska (1972–2010). Environ. Res. Lett. 2012, 7. [Google Scholar] [CrossRef]
  45. Andresen, C.G.; Lara, M.J.; Tweedie, C.E.; Lougheed, V.L. Rising plant-mediated methane emissions from arctic wetlands. Glob. Chang. Biol. 2017, 23, 1128–1139. [Google Scholar] [CrossRef] [PubMed]
  46. Langford, Z.; Kumar, J.; Hoffman, F.M.; Norby, R.J.; Wullschleger, S.D.; Sloan, V.L.; Iversen, C.M. Mapping Arctic Plant Functional Type distributions in the Barrow Environmental Observatory using WorldView-2 and LiDAR Datasets. Remote Sens. 2016, 8, 733. [Google Scholar] [CrossRef] [Green Version]
  47. Andresen, C.G.; Lawrence, D.M.; Wilson, C.J.; McGuire, A.D.; Koven, C.; Schaefer, K.; Jafarov, E.; Peng, S.; Chen, X.; Gouttevin, I.; et al. Soil moisture and hydrology projections of the permafrost region – A model intercomparison. Cryosphere 2020, 14, 445–459. [Google Scholar] [CrossRef] [Green Version]
  48. Keller, K.; Blum, J.D.; Kling, G.W. Geochemistry of soils and streams on surfaces of varying ages in Arctic Alaska. Arct. Antarct. Alp. Res. 2007, 39, 84–98. [Google Scholar] [CrossRef]
  49. Keller, K.; Blum, J.D.; Kling, G.W. Stream geochemistry as an indicator of increasing permafrost thaw depth in an arctic watershed. Chem. Geol. 2010, 273, 76–81. [Google Scholar] [CrossRef]
  50. Lipson, D.A.; Schmidt, S.K.; Monson, R.K. Links between microbial population dynamics and nitrogen availability in an alpine ecosystem. Ecology 1999, 85, 1623–1631. [Google Scholar] [CrossRef]
  51. Lecher, A.L.; Chien, C.-T.; Paytan, A. Submarine groundwater discharge as a source of nutrients to the North Pacific and Arctic coastal ocean. Mar. Chem. 2016, 186, 167–177. [Google Scholar] [CrossRef] [Green Version]
  52. Kendrick, M.R.; Huryn, A.D.; Bowden, W.B.; Deegan, L.A.; Findlay, R.H.; Hershey, A.E.; Peterson, B.J.; Benes, J.P.; Schuett, E.B. Linking permafrost thaw to shifting biogeochemistry and food web resources in an arctic river. Glob. Chang. Biol. 2018, 24, 5738–5750. [Google Scholar] [CrossRef]
  53. Billings, W.D.; Peterson, K.M.; Luken, J.O.; Mortensen, D.A. Interaction of increasing atmospheric carbon dioxide and soil nitrogen on the carbon balance of tundra microcosms. Oecologia 1984, 65, 26–29. [Google Scholar] [CrossRef] [PubMed]
  54. Schuur, E.A.G.; McGuire, A.D.; Schädel, C.; Grosse, G.; Harden, J.W.; Hayes, D.J.; Hugelius, G.; Koven, C.D.; Kuhry, P.; Lawrence, D.M.; et al. Climate change and the permafrost carbon feedback. Nature 2015, 520, 171–179. [Google Scholar] [CrossRef]
  55. Ramm, E.; Liu, C.; Wang, X.; Yue, H.; Zhang, W.; Pan, Y.; Schloter, M.; Gschwendtner, S.; Mueller, C.W.; Hu, B.; et al. The forgotten nutrient—The role of nitrogen in permafrost soils of Northern China. Adv. Atmos. Sci. 2020, 37, 793–799. [Google Scholar] [CrossRef]
  56. Ramm, E.; Liu, C.; Ambus, P.; Butterbach-Bahl1, K.; Hu, B.; Martikainen, P.J.; Marushchak, M.E.; Mueller, C.W.; Rennenberg, H.; Schloter, M.; et al. A review of the importance of mineral nitrogen cycling in the plant-soil-microbe system of permafrost-affected soils—changing the paradigm. Environ. Res. Lett. 2022, 17. [Google Scholar] [CrossRef]
  57. Yang, Z.-P.; Gao, J.-X.; Zhao, L.; Xu, X.-L.; Ouyang, H. Linking thaw depth with soil moisture and plant community composition: Effects of permafrost degradation on alpine ecosystems on the Qinghai-Tibet Plateau. Plant Soil 2013, 367, 687–700. [Google Scholar] [CrossRef]
  58. Finger, R.A.; Turetsky, M.R.; Kielland, K.; Ruess, R.W.; Mack, M.C.; Euskirchen, E.S. Effects of permafrost thaw on nitrogen availability and plant-soil interactions in boreal Alaskan lowland. J. Ecol. 2016, 104, 1542–1554. [Google Scholar] [CrossRef]
  59. Faucher, B.; Lacelle, D.; Davila, A.; Pollard, W.; Fisher, D.; McKay, C.P. Physicochemical and Biological Controls on Carbon and Nitrogen in Permafrost from an Ultraxerous Environment, McMurdo Dry Valleys of Antarctica. J. Geophys. Res. 2017, 122, 1293–2604. [Google Scholar] [CrossRef]
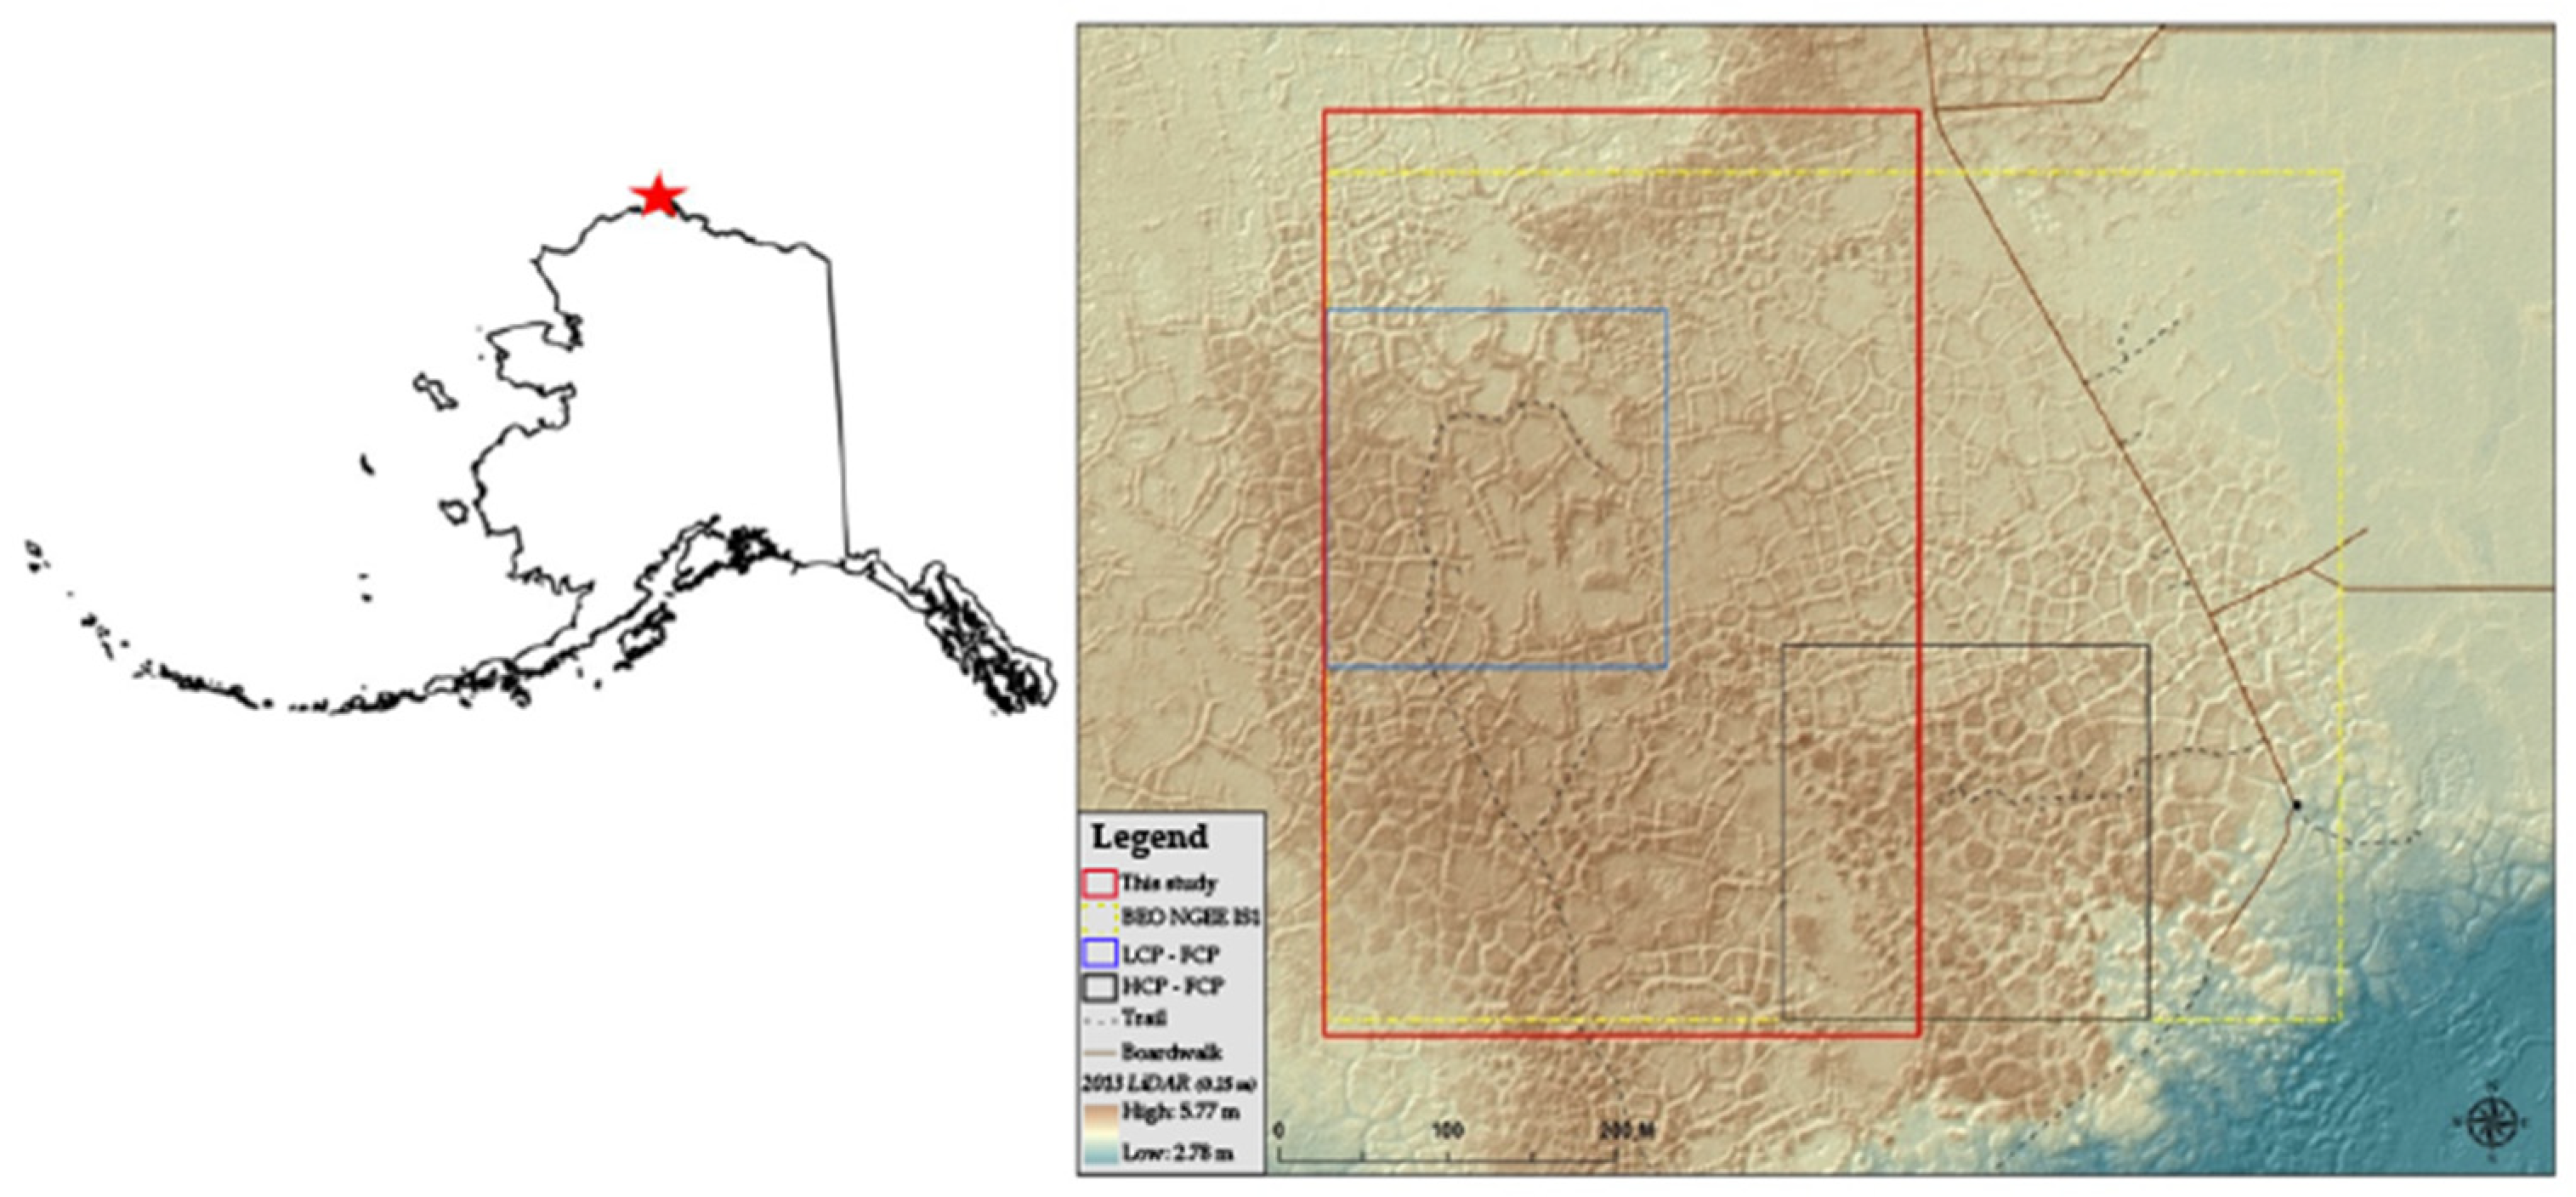
Figure 1. Map of the Barrow Environmental Observatory (BEO) polygonal tundra with LiDAR relief shading. Lefthand image shows the location of the BEO (red star) within AK, USA. A large dashed yellow box defines the broader BEO study site with the small blue box highlighting a predominantly low-centered polygon and flat-centered polygon region and the black box highlighting a predominately high-centered polygon and flat-centered polygon region. The red rectangle indicates the spatial extent of the nitrate inventory domain for this specific study, which is 0.191 km2.
Nitrogen 03 00021 g001
Figure 2. Study area discretized into: (A) geomorphic polygon types and features with a general relationship of unsaturated yellow regions and saturated blue regions, where 1 corresponds to LCP troughs (5.0% area), 2 corresponds to FCP troughs (16.1% area), 3 corresponds to HCP troughs (5.1% area), 4 corresponds to LCP centers (12.5% area), 5 corresponds to FCP centers (11.3% area), 7 corresponds to LCP rims (17.6% area), 8 corresponds to FCP rims (27.3% area), and 9 corresponds to HCP centers (5.1% area); (B) Color orthomosaic and its masked versions showing only unsaturated and saturated areas, respectively; (C) coverage of plant community type, where certain species are limited to saturated soils; and (D) a combination of topographic and vegetative remote observations identifying wetness fractions, where darker blues correspond to more saturated areas. See Appendix A for additional details on geospatial approaches.
Nitrogen 03 00021 g002
Figure 3. Ranges of moisture content (A) and NO3 concentration (B) distributed by unsaturated polygonal microtopographic features (high-centers, flat-centers, rims). The data used for the ranges displayed in (A,B) were not co-located but were distributions from each unsaturated feature for all NO3 and moisture data collected. The whisker extent and lines within the grey boxes indicate the 90%, 75%, 50%, 25%, and 10% statistical quantile distributions (see Table A1 for additional details), and statistical outliers are indicated by black circles. All p-values for pairwise comparisons between polygon features for (A,B) are <0.05, and asterisks displayed denote the level of significance for each comparison (*** indicates p ≤ 0.001; ** indicates p ≤ 0.01; * indicates p ≤ 0.05). (C,D) both show identical data and regressions with (C) displaying a linear y-axis scale, and (D) displaying a logarithmic y-axis scale for multiple visual perspectives. Both (C,D) show plots of the inverse statistical quantile distribution (see Table A1 for additional details) regressions of NO3 concentrations and soil moisture content for high-centers (black circles), flat-centers (open-squares), rims (grey triangles), and the linear regression equations for high-centers (solid line), flat-centers (dashed line), and rims (dotted line). Regression coefficients of determination are provided in the legends.
Nitrogen 03 00021 g003
Figure 4. Study site NO3 inventories based on current inventory (a) and possible future inventories resulting from our three drying scenarios: (b) modest drying with active layer deepening, (c) geomorphic evolution of polygonal features, and (d) complete drying. Each whisker represents the 25%, 50%, and 75% statistical quantile distributions utilized to calculate these inventories. The colors of the whiskers represent the four geospatial approaches estimates, where grey is used for the complete drying scenario as all geospatial outcomes are the same for this scenario.
Nitrogen 03 00021 g004
Publisher’s Note: MDPI stays neutral with regard to jurisdictional claims in published maps and institutional affiliations.