Abstract
Crop residue decomposition is fundamental for ecosystems, influencing carbon cycling, organic matter accumulation, and promoting plant development through nutrient release. Therefore, this study aimed to ascertain the rate of decomposition of four commonly cultivated crops (alfalfa, maize, avocado, and eucalyptus) along the northern coast of Lima (Huaral) and in the Ancash Mountain range (Jangas) areas. Decomposition rates were assessed using mass loss from decomposition bags measuring 15 × 10 cm, filled with 10–15 g of material tailored to each species, and buried at a depth of approximately 5 cm. Sampling occurred every three months over a year, totaling four sampling events with three replicates each, resulting in ninety-six experimental units. The findings demonstrate that the decomposition rates and the release of nutrients were markedly greater in Huaral for maize and avocado. In contrast, these rates were notably elevated in Jangas for alfalfa and eucalyptus. The leaf litter of avocado and eucalyptus (tree) had periods of accumulation and release of heavy metals such as Cd. The initial C/N ratio was one of the main factors related to the nutrient decomposition rate; in contrast, there were no significant relationships with soil properties at the study sites.
1. Introduction
Nutrients introduced into the soil, whether through synthetic or organic fertilizers, can be rapidly lost through leaching or volatilization [1]. If mineralization is slow, the availability of nutrients for plants may be insufficient, leading to poor crop growth and development [2]. Nutrients released from decomposing litter play a significant role in soil fertility. These nutrients remain available for plant absorption and do not leave the soil-plant system. Therefore, it is a vital factor in the nutrient cycle of terrestrial ecosystems [3]. The decomposing litter provides a favorable environment for soil microorganisms, increasing organic matter in the upper soil layers and providing nutrients for soil microorganisms [4].
The decomposition process of litter can be divided into two stages. The first stage involves the leaching of soluble compounds and the decomposition of hemicellulose and cellulose. The second stage is slower and results from the decomposition of recalcitrant compounds such as lipids, lignins, lignified carbohydrates, and tannins [5]. Litter with a higher C:N ratio (>20) takes longer to decompose. In contrast, litter with a high N concentration and low lignin (carbon) content is usually associated with faster litter decomposition, especially at the early stages of decomposition [6,7].
The C:N ratio is critical because carbon (C) assimilation is controlled by the C:N ratio of soil microbial biomass, which is generally 8:1. If the soil residual nitrogen (N) is greater than the N required for microbial decomposition, mineralization can occur. Otherwise, N will be immobilized and will not be available in the soil, reducing the decomposition rate of the leaf residues [8]. The application of organic N fertilizer, but not inorganic N fertilizer, increased the diversity of the bacterial community and the activities of soil enzymes, especially in ureolytic and chitinolytic bacterial communities [9]. Residues containing more than 1.5 to 1.7% N do not depend on soil mineral N to facilitate decomposition. However, most crop residues contain less than this critical level, so their decomposition rate is low [10].
Decomposition rates are primarily influenced by three factors: (a) environmental conditions (temperature, humidity, and soil quality), (b) chemical composition of litter (lignin, hemicellulose, phenolic compounds, allelopathic substances, N concentrations, P; C/N and N/P ratios) which varies depending on the crop, and (c) the diversity and abundance of decomposer fauna [11]. Studies conducted until the 2000s gave greater importance to the impact of climate on decomposition rates, proposing three main levels of control in the following hierarchical order: climate > litter chemistry > soil organisms [12]. However, recent studies indicate that the initial composition of litter plays a crucial role in their decomposition. The other two factors regulate the activities of decomposer organisms, and therefore, there is no independent factor on decomposition rates [13].
Bastian et al. [14] found significant differences in the structure of bacterial and fungal communities between the early (14 and 28 days) and late stages (56–168 days) of decomposition. Therefore, having a good diversity in the microbial population can contribute to litter decomposition. Rakhsh et al. [15] reported that residual C mineralization was significantly faster in pure sand than in soils containing 5% and 10% clay, indicating that soil texture affects the ability of soils to protect and store C.
Agricultural management influences the physical, chemical, and biological properties of the soil, therefore influencing the decomposition process. General microbial succession patterns during decomposition were similar among soils [16]. Decomposition by microbial communities is more affected by organic plot management than conventional management because of increased soil biomass and microbial activity [17,18]. The release of nutrients during decomposition can have important implications for soil management. This release process is essential because it maximizes nitrogen release and reduces the N that needs to be applied through fertilizers [19]. In areas degraded by anthropogenic activities, restoring the decomposition and mineralization process is essential since the lack of vegetation leads to the non-incorporation of plant residues, and, therefore, nutrient cycles are altered [20].
Understanding the drivers of decomposition rates provides the basis for developing models that predict how organic matter reserves in ecosystems will respond to disturbances such as climate change [21]. It also helps to understand the functioning of the ecosystem and establish management practices for the recovery of degraded areas and the maintenance of soil productivity [11]. This emphasizes the importance of considering local scale parameters, such as soil nutrient availability and characteristics, typically not incorporated in litter decomposition studies. These factors are essential for understanding local variations in the decomposition process [13]. The Peruvian territory has a wide variety of climatic conditions that support the cultivation of numerous crops. This study analyzed decomposition rates in two central regions of Peru, selected for their agricultural importance and contrasting agroclimatic features. The first region is situated in an alluvial valley in the upper Andes Mountain range, while the second is in the lower part of a coastal valley near the Pacific Ocean. These regions were deliberately selected because of their pronounced climatic contrasts, which offer an opportunity to compare the decomposition of plant residues under varying environmental conditions. Despite these differences, certain crops such as maize (Zea mays L.), alfalfa (Medicago indica L.), avocado (Persea americana Mill), and eucalyptus (Eucalyptus globulus) are common in both regions. The study evaluated the decomposition rate and nutrient liberation of these four crops in both regions using decomposition bags for one year.
2. Materials and Methods
This study was carried out in two Peruvian regions (Figure 1), a tropical montane dry forest (Jangas) in the Andean region (9°23′55.6″ S; 77°35′1.8″ W) and a subtropical desert (Huaral) on the coast (11°31′17.1″ S; 77°14′8.5″ W). The elevation of the two study sites ranged from 2865 to 2880 m for the Andean region and 125 to 135 m for the desert coast. Jangas has steep physiography (25–50%), an average annual temperature recorded at Yungay weather station (9°8′30.79″ S; 77°44′59.91″ W, 2466 m.a.s.l.) is 15.3 °C with a significant variation between the maximum and minimum temperature and the annual precipitation is about 616 mm per year with a drier season from May to August and two rainfall peaks in January to March. Huaral has slightly inclined physiography (0–4%), an average annual temperature recorded at EEA Donoso weather station (11°31′2.2″ S; 77°14′9.9″ W, 129 m.a.s.l.) is 20.3 °C varying little during the year and the annual precipitation is about 23.6 mm per year with a drier season from May to August and two rainfall peaks, generally in January to March (Figure 2).
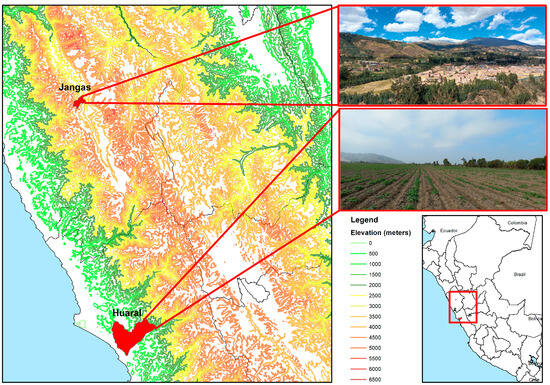
Figure 1.
Location of the two study areas: district of “Jangas” and district of “Huaral.”
In Huaral, the maize and alfalfa plots were irrigated with around 10,000 m3/ha of water and 15,000 m3/ha for the avocado fields, with irrigation occurring at least every 15 days. On the other hand, in Jangas, irrigation was limited to the dry season, with approximately 4500 m3/ha being applied to maize and alfalfa and 5000 m3/ha to avocado during the year. For these study sites, the soil varied from sandy loam to sandy clay loam, clay contents from 4 to 29%, pH (in water) from 7.4 to 7.8, organic matter content from 0.3 to 4.4%, and nitrogen content from 0.02 to 0.22%. The details of the soil analysis (0–30 cm) of the study sites are presented in Table 1.

Table 1.
Physical-chemical characterization of soils from each site.
Four representative crops were analyzed across agricultural properties in Jangas and Huaral: maize (annual), alfalfa (perennial pasture), avocado (fruit tree), and eucalyptus (forest species). Jangas is part of the province of Huaraz, which has 224 hectares of maize, 475 hectares of alfalfa, 37 hectares of avocado, and 47 hectares of registered eucalyptus plantations. In contrast, the Huaral province exhibits a markedly different agricultural profile. Maize dominates with 1510 hectares, while alfalfa cultivation is minimal at only 13 hectares. Notably, avocado trees thrive in Huaral, covering a vast 1711 hectares. Eucalyptus, however, is absent from registered plantations, indicating a lack of forestry utilization in the area, with its primary purpose serving as agricultural land boundaries [22,23].
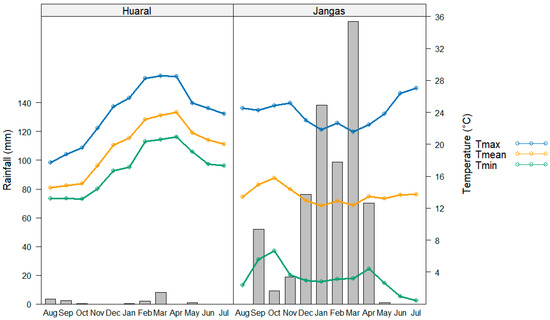
Figure 2.
Monthly mean temperatures (lines) and rainfall (bars) [24].
2.1. Litter Bag Incubation and K Decay Constants
The leaf litter was collected in the fields of the EEA Donoso. Non-leaf litter, such as small branches, was also collected since it is part of the litter that decomposes on the soil. The collected samples were washed and dried in an oven for 48 h at 70 °C and then placed in the litter bags. A portion of the dried leaf litter samples was ground into powder using a leaf shredder and passed through a 0.5 mm sieve. For metal analysis, ground samples were digested in nitric acid (HNO3) [25], and P, K, Fe, Cu, Zn, and Cd contents were quantified by inductively coupled plasma optical emission spectroscopy (ICP-OES, iCAP Series 7000, Thermo Scientific, Waltham, MA, USA). The C and N contents of the ground samples were determined using an autoanalyzer (LECO CN828, LECO Corporation, St. Joseph, MI, USA) according to [26,27] modified methods. The details of the analysis are presented in Table 2.
Table 2.
Chemical characterization of the analyzed leaf litter.
The litter bags were prepared by inserting 10 g of alfalfa, 12 g of avocado, and 15 g of maize and eucalyptus of the oven-dried leaf litterfall material into 10 × 15 cm bags made from nylon netting with a mesh size of 2 mm. Using a small spade, a labeled litter bag was installed at each corner of each litterfall place, and the bag was carefully inserted to a depth of 5 cm.
A Randomized Complete Block Design (RCBD) with a 4 × 2 × 4 factorial arrangement experimental design was used. Two factors were tested: (i) Four crops (alfalfa, maize, avocado, and Eucalyptus) and (ii) The two locations (Huaral and Jangas), with the different evaluation time points serving as blocks (0.25, 0.50, 0.75, and 1.0 years). In total, 96 litter bags were placed (Figure 3). Three bags were recovered from each trap after 90, 180, 270, and 365 days, respectively, and transported to the laboratory to perform the same analyses on the litter residues performed on the initial samples.
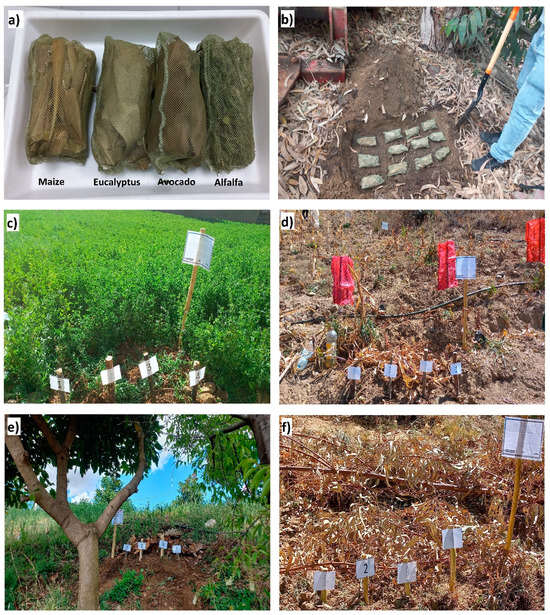
Figure 3.
(a) The litter bags that were used; (b) Installation of litter bags in the soil at a 5 cm depth; (c) Installation in the alfalfa plot; (d) Installation in the maize plot; (e) Installation in the avocado plot and (f) Installation in the eucalyptus plot.
The decomposition constants were derived by fitting the following exponential decay equation to litter bag weight loss data for each trap:
where Wt = dry weight of remaining litter at time t (year fraction), W0 = dry weight of litter at time 0, and k = litter decomposition decay rate constant (yr−1). This equation was fitted to the untransformed litter bag percentage weight remaining values using nonlinear regression analysis and the Y-intercepts forced through 100% (i.e., weight remaining at t = 0) [28].
Wt/W0 = 100e−kt
Additionally, the decay times T50 and T95 for which the dry weight reduced to 50% and 5% of the initial weight, respectively, were calculated, as performed elsewhere, by Equations (2) and (3), as follows:
The nutrients released from the needles were calculated using the formula:
where Nr represents the nutrients remaining due to litter decomposition (%), Wt = oven-dry mass at time t, W0 = is the initial dry weight, Ct = nutrient concentration at time t (mg∙kg−1), C0 = initial nutrient concentration (mg∙kg−1).
2.2. Statistical Analysis
The remaining biomass litter, C, N, P, K, Fe, Cu, Zn Cd, C:N ratios and proportion of decomposed C and N were subjected to analysis of variance (ANOVA) according to the following mathematical model:
where Yijk = Observed value of the dependent variable for the i-th type of crop, j-th place evaluated, and k-th time (block), μ = Overall mean of the experiment, αi = Effect of the iii-th type of crop, βj = Effect of the jjj-th place evaluated, γk = Effect of the k-th time (block), (αβ)ij = Interaction between the iii-th type of crop and the jjj-th place evaluated and, ϵijk = Random error associated with the observation Yijk. The Shapiro–Wilk and Levene tests were conducted to assess the assumptions of normality and homogeneity required variance analysis. Variables that did not meet these assumptions were log-transformed (Log10) before conducting the ANOVA. For variables showing an interaction between crops and sites, the Student’s t-test was performed to compare the behavior of each crop in the two sides evaluated throughout the study period. Spearman’s rank correlation and regression were used to relate decay constants with initial litter chemistry and soil physico-chemical properties. p values < 0.05 were considered significant R was used for Windows (R Core Team, Vienna, Austria, 2023).
Yijk = μ + αi + βj + γk + (αβ)ij +ϵijk
3. Results
3.1. Mass Loss of Leaf Litter on Different Sites and Crops
The exponential decay model (Figure 4) explained 92–99% of species litter bag weight loss. Meanwhile, k values varied from 0.91 (Eucalyptus, Huaral) to 4.55 (alfalfa, Huaral). The k factor shows significant differences in the decomposition rate in the four crops between the two sites analyzed (Table 3). The T95 (time to 95% weight loss) was more significant in the tree species since, in most cases, it would take more than two years (up to 3.29 for the Eucalyptus in Huaral) to reach a loss greater than 95% of the total biomass. On the other hand, herbaceous species need less than a year to achieve the same, with alfalfa taking the shortest time with 0.68 in Jangas (Table 3).
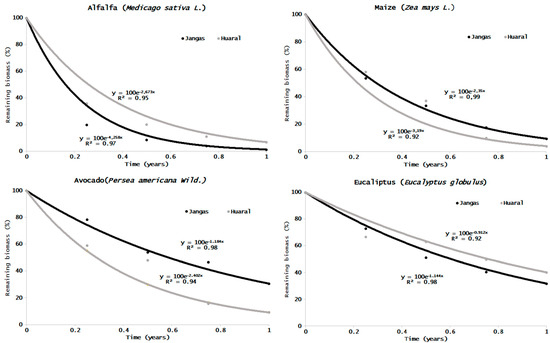
Figure 4.
Weight of litter bag remaining (as a percentage of initial weight) for each species and site against time (year fraction), and the fitted exponential decay curves (y = 100 e−kt) calculated using nonlinear regression (k values are given in Table 3).
Table 3.
Litter bag k decay constants, coefficient of determination (R2), half-life (T50), time to 95% weight loss (T95), remaining biomass percent by sites and species.
The variance analysis (Table 3) indicates a substantial interaction between the crops and the two locations evaluated, demonstrating a highly significant interaction in all instances. Moreover, while differences were observed among the various crops for all variables, significant differences between the two locations were not present in all variables (T50 and T95).
By the end of the study year, significant differences in the remaining biomass over time were observed for the four crops evaluated between the two locations. Alfalfa exhibited differences in remaining biomass from the outset, consistently maintaining these differences throughout the experiment, with Jangas showing lower remaining biomass. Significant differences emerged after six months for maize, with Huaral displaying a smaller remaining biomass. Both avocado and eucalyptus exhibited significant differences in remaining biomass, but only towards the end of the study.
3.2. Macro-Nutrients Release Dynamics
Since C constitutes the primary component of leaf biomass, its behavior is quite similar to biomass loss. Statistical differences were observed between the crop types and evaluation times but not between the evaluated locations. Nonetheless, an interaction between these two factors was evident (Table 4). The Student’s t-test performed for each crop at the two evaluated sites revealed that, for eucalyptus, no significant differences in C content were observed between the locations throughout the study. In contrast, for maize and avocado, significant differences emerged after mid-year, with lower C content remaining in Huaral for both crops. Significant differences were evident from the onset of this study for alfalfa, with consistently lower C content in Jangas across all evaluations (Figure 5a). As shown, the herbaceous crops released most of their C during the study period, whereas tree crops experienced a pronounced initial loss in the early months of the year, followed by a deceleration in the loss rate.
Table 4.
ANOVA p-values of C, N, P, and K throughout the year of study.
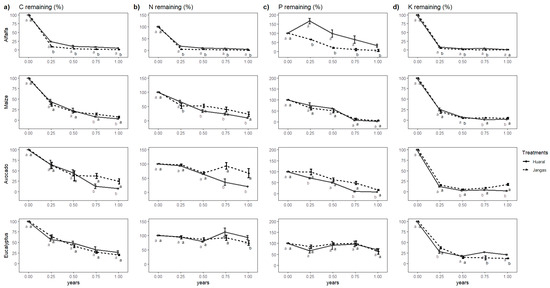
Figure 5.
(a) C remaining in four crops; (b) N remaining in the four crops; (c) P remaining in the four crops; (d) K remaining in the four crops. Different letters (a,b) indicate significant differences in the Student’s t-test.
Regarding N, significant differences were observed between the different crops and evaluation times but not between the evaluated sites. However, an interaction between the crops and evaluated sites was present (Table 4). By the end of the study, all crops showed significant differences in remaining N between the two sites evaluated. However, the site with more significant remaining N varied by crop. In Jangas, maize and avocado retained more N, whereas, in Huaral, alfalfa and eucalyptus had higher remaining N, as illustrated in Figure 5b, tree crops either accumulated or maintained their N levels, unlike C and biomass, which steadily decreased. On the other hand, herbaceous crops, particularly alfalfa, experienced a substantial loss of initial N.
The C/N ratio is a crucial indicator in the decomposition process of leaf litter. Table 5 shows that the significant differences between crops and evaluated sites were only observed in the initial evaluations, with all crops achieving a similar C/N ratio by the end of the year. The C/N ratio decreased from values greater than 25 to approximately 9 for maize, avocado, and eucalyptus. In contrast, the C/N ratio for alfalfa remained relatively unchanged after one year of testing. A detailed examination of the C/N ratio evolution, as depicted in Figure 6, reveals that all crops, except alfalfa, experienced a significant decrease in the first half of the study. The C/N ratio in the final two evaluations was similar, indicating stabilization of the C/N ratio after mid-year.
Table 5.
C/N ratio during the duration of the study (1 year).
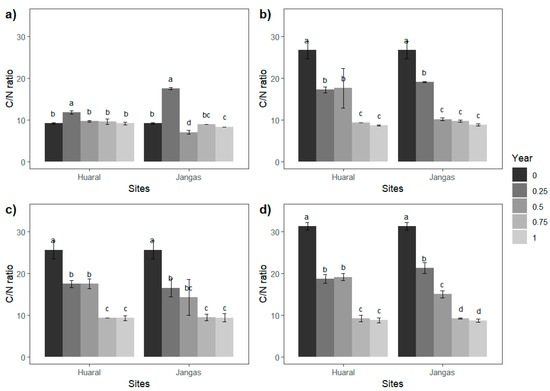
Figure 6.
(a) Alfalfa C/N; (b) Maize C/N; (c) Avocado C/N; (d) Eucalyptus C/N ratio. Different letters (a,b,c,d) indicate significant differences.
Regarding the other released nutrients, particularly phosphorus (P), the dynamics vary significantly across the site, crop, and evaluation time (Figure 5c and Table 4). For maize, P is released sustainably until the penultimate evaluation (9 months), and nearly all P has been released. Throughout this study, no significant differences in P release were observed between the evaluated sites, indicating similar behavior across locations. Eucalyptus exhibited a comparable lack of site-specific differences. However, unlike maize, eucalyptus did not show a sustained P release. Instead, it experienced a slight initial decrease, followed by sustained immobilization, and another decrease by the end of the evaluation year, resulting in approximately 63–71% P remaining. Significant differences were observed between the evaluated sites for avocado, with Huaral exhibiting less remaining P compared to Jangas. Similar to maize, a sustained decrease in P was noted in each litter bag, reaching levels of approximately 7–15%. In the case of alfalfa, significant differences between sites were also observed. Notably, in Huaral, there was a considerable immobilization of P, peaking at 166%, before dramatically decreasing to around 32%. Conversely, in Jangas, a consistent decrease was observed, ultimately reaching 6%.
The behavior of the remaining potassium (K) is illustrated in Figure 5d and Table 4. All evaluated crops showed a significant decrease in K within the first three months. For alfalfa, this decrease resulted in only 4–8% remaining K, while for eucalyptus, the decrease was less pronounced, with 28–37% remaining K. In the herbaceous crops (alfalfa and maize), almost all of the remaining K was released, with a more significant release in the case of alfalfa in Jangas, although both sites were equalized by the end of this study. In maize, the highest releases occurred in Huaral. For avocado, a slight accumulation of K was observed after six months in Jangas, a pattern not seen in Huaral, where nearly all K was released into the soil. Eucalyptus also showed some accumulation in the litter bags in Huaral, though less prominently than avocado.
3.3. Microelements Release Dynamics
The behavior of microelements throughout this study was highly variable for the four analyzed elements in the two sites evaluated (especially Cu and Zn, as shown in Table 4). The Student’s t-test performed for each crop at the two evaluated sites revealed differences between the two sites, as well as distinct periods of significant accumulation and loss. The Student t-test performed for each crop at the two sites evaluated shows differences between the sites evaluated and exhibits periods of substantial accumulation and loss (Figure 7a). For iron (Fe), significant accumulation was observed in all crops except alfalfa during the first sampling in the initial quarter of the evaluation year. Eucalyptus displayed particularly high immobilization levels, ranging from 679 to 723%. Avocado also showed significant immobilization, with levels between 220 and 246%, while maize in Jangas accumulated 190%, notably higher than the 90% observed in Huaral. Despite this initial immobilization, a sustained decline in Fe levels was noted towards the end of the year, with alfalfa and maize losing most of their Fe. In contrast, eucalyptus and avocado experienced a lower degree of Fe loss, retaining 56–66% and 9–56%, respectively. The trend of microelement release varied by location, with greater Fe release in maize and avocado observed in Huaral and alfalfa in Jangas.
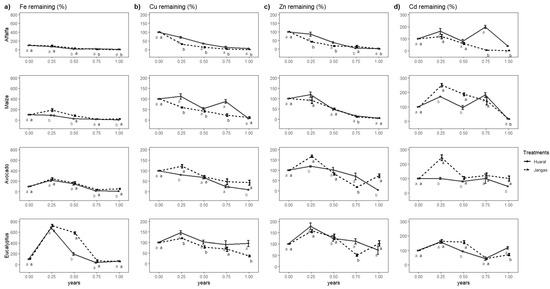
Figure 7.
(a) Fe remaining in four crops; (b) Cu remaining in the four crops; (c) Zn remaining in the four crops; (d) Cd remaining in the four. Different letters (a,b) indicate significant differences in. Student’s t-test.
For Cu, lower immobilization was observed across all crops compared to Fe (Figure 7b). Maize and alfalfa exhibited almost complete Cu release, with significant differences between the evaluated sites, showing more significant release in Jangas for both crops. Eucalyptus displayed consistent behavior across locations, with only a slight initial accumulation, resulting in Cu levels similar to the initial amount by the end of this study. However, avocado demonstrated more Cu release in Huaral than Jangas, without the initial accumulation seen in Huaral. Zn behavior in eucalyptus and avocado showed an initial accumulation followed by release and a subsequent new accumulation in Jangas towards the end of the study. However, this was only significant for avocado (Figure 7c). Herbaceous crops generally tended to release most of the analyzed elements, with alfalfa showing significantly higher release in Jangas than in Huaral.
The behavior of Cd differed across all crops, showing periods of immobilization and release throughout this study (Figure 7d). In alfalfa from Huaral, there were two periods of accumulation, which were not observed in Jangas, where a more significant release of Cd to the soil occurred. Similarly, maize in Huaral also exhibited two accumulation peaks, while in Jangas, there was a significant initial accumulation followed by a sustained decline, resulting in a significantly greater release of Cd compared with Huaral.
For avocado in Jangas, a large initial accumulation was followed by a decrease, reaching values similar to the initial ones by the end of this study. In Huaral, the Cd levels remained similar to the initial ones until the last part of the year, when the remaining Cd reached 46%, indicating a more significant release than in Jangas. Eucalyptus showed an initial accumulation in both locations, which lasted up to mid-year in Jangas before falling and then rising again at the end of the study, with significantly greater accumulation in Huaral.
3.4. Association between Exponential Decay Model with Soil and Litter Properties
Spearman’s correlation analysis reveals positive and negative relationships among certain variables (Figure 8). The evaluated soil parameters do not exhibit a significant relationship with the k factor. However, significant correlations are observed among the soil parameters themselves, including inverse relationships between silt, sand, and bulk density. Clay also shows a direct relationship with pH and bulk density, while bulk density is also directly related to pH.
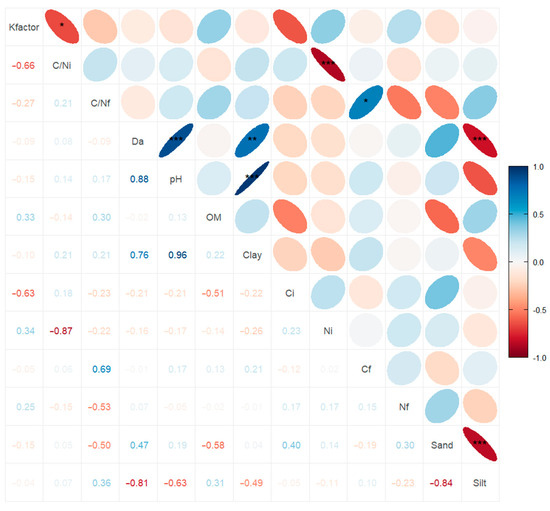
Figure 8.
Spearman association between exponential decay model (Kfactor) with other soil and litter parameters. C/Ni: Initial C/N; C/Nf: Final C/N; Da: Bulk density; OM: organic matter; Ci: Initial carbon; Ni: Initial nitrogen; Cf: Final carbon; Nf: Final nitrogen. *** = p-values < 0.001; ** p-values < 0.01; * p-values < 0.05.
The characteristics associated with the k factor are the chemical properties of the leaf residues. The initial C/N ratio, as does the initial N percentage, exhibits a significant inverse correlation with the k factor. Additionally, there is a direct relationship between the final C/N ratio and the final C percentage.
4. Discussion
The rapid decomposition of the leaf litter and resulting high k values found in alfalfa and maize are typical for herbaceous plants [6,29] and agroforestry systems [30]. The varying decomposition rates of different crops in the two evaluated sites suggest that climate, while significant, is not the sole determining factor since some crops had less decomposition in areas with more precipitation or higher temperatures; this is similar to what was reported by Negash et al. [31] and Rawlik et al. [29] who found no significant correlation between temperature and the k factor. Similarly, soil properties were not decisive since, for the same crop, the soil with a lower percentage of organic matter reported higher decomposition rates (alfalfa and eucalyptus). Therefore, a more detailed analysis is needed, considering factors such as microrelief, hydraulic conductivity, in situ temperature, and specific macrofauna to understand their influence on waste decomposition.
In Jangas, the four crops had an R² value closer to 1 than in Huaral, indicating that the equation better represents the decomposition of residues at that site (Figure 4). This could be attributed to the significantly larger temperature variation in Huaral, which is nearly 10 °C throughout the year, compared to Jangas. Despite these minor differences, the R² values exceeded 0.92 when using the single exponential model. This was higher than those reported in other studies, such as those by Rodríguez Pleguezuelo et al. [32], Naik et al. [5], Zheng et al. [33], and Demessie et al. [34], which primarily focused on various forest species. Consequently, there was no need to adjust these data to alternative decomposition models, such as those proposed by Rovira & Rovira [35].
The initial rapid mass loss (30–80% in 3 months) in all crops is attributable to the leaching and breakdown of readily soluble substances, non-lignified carbohydrates, and other labile fractions [36,37,38]. The more gradual mass loss in the latter stages is likely linked to the accumulation of recalcitrant fractions such as cellulose, lignin, fats, waxes, and tannin in leaf litter as decomposition progresses [5,37,39]. Litter bag studies prevent fragmentation and subsequent transport, and consequently, mass loss is primarily a result of microbial degradation of litter within the litter itself, thereby underestimating decay rates. Additionally, litter enters the soil in the form of undecomposed litter fragments (i.e., light fraction), which can initiate soil organic matter (SOM) aggregation and thus play a pivotal role in the C stabilization mechanisms [40,41].
The release of C follows a pattern similar to the weight loss of litter bags because of the high C content in all the litter samples (Table 2). Rubino et al. [42] reported that the ratio of C lost as CO2 to C input (SOM) was approximately 1:2, highlighting the importance of quantifying the contribution of C from litter to soils in decomposition studies. The results obtained in this study were consistent with those reported by Negash & Starr [31] for avocado and Rachid et al. [43] for eucalyptus in half-year studies. Similar studies on maize, such as those conducted by Chatterjee & Acharya [6] in 2020, reported a lower C release rate, with approximately 50% remaining at the year’s end. However, these studies were conducted in temperate zones of the USA. Ajwa & Tabatabai [44] found that alfalfa exhibited a more significant release of CO2 during decomposition than maize and soybeans in the first 30 days. This is attributed to alfalfa’s higher readily decomposable organic C fractions than maize and soybean. These findings support the results obtained for alfalfa in this study, which showed a significant release of C in the initial months of the studies. During decomposition, decomposers generally utilized C as an energy source, while N was assimilated into cellular proteins and other compounds. Consequently, as decomposition time increased, C levels decreased, and nutrients, particularly N, were released from the litter [45].
The dynamics of N release during decomposition exhibit phases of immobilization (net increase in content because of the incorporation of N from the surroundings into the litter) and release, varying significantly between species [33]. Herbaceous crops such as maize and alfalfa predominantly demonstrated N release, with a substantial portion of the initial N being released in the first months of this study. This contrasts with the findings of Chatterjee & Acharya [6], who reported N immobilization in maize during the winter in a temperate region of the USA. Additionally, litter with higher initial N content tends to release N more rapidly than litter with lower N content [46]. This explains why alfalfa, which has a high initial N content, released nearly all its N during the test, a similar result to that reported by Cowan et al. [47].
In tree species, N behavior differs, with immobilization or slower release depending on the species. This pattern is observed in studies such as Marinho et al. [48] and Rodriguez-Pleguezuelo et al. [32], who worked with different fruit species such as mango, cherimoya, loquat, and avocado, the latter showing behavior similar to that observed in Huaral. In Jangas, N accumulation was noted in the second half of the year, likely because of the larger remaining biomass (Figure 4), which facilitates microbial immobilization and fungal translocation [49]. Additionally, these immobilization periods coincide with months of low rainfall (April–July) (Figure 1). This trend is particularly evident in eucalyptus, which exhibited minimal N release throughout the year, especially during the penultimate evaluation. These findings are consistent with those of Goya et al. [50], who reported immobilization periods and generally low N release in eucalyptus species across three soil types.
Regarding the C/N ratio, the final evaluations revealed that the four studied crops ended with similar results across different locations (Table 3). Studies such as Chatterjee & Acharya [6], which assessed various crops, also found no significant differences between evaluated locations. Similarly, Demessie et al. [34] and Rodríguez Pleguezuelo et al. [32] reported different C/N values at the end of the study between crops. In most crops, the C/N ratio decreased over time, except in alfalfa, where an initial increase in C/N was observed, likely because of a more rapid initial loss of N than C, before subsequently decreasing and stabilizing by the end of this study. Soil can also play a crucial role, as the decomposing microbial community may require N more than C, thereby increasing the C/N ratio at certain times. This behavior has been observed in studies such as those by Leal et al. [20] and Goya et al. [50], where the same crop exhibited fluctuations in the C/N ratio during various evaluations depending on the soil conditions.
P exhibits similar behavior to N, as in the case of alfalfa and maize; no alternation between immobilization and release is observed, with P predominantly being released. However, in alfalfa grown in Huaral, there is significant initial immobilization, likely due to the high level of available P in Huaral soil (69.36 mg∙kg−1), which promotes initial immobilization [5]. This behavior is not observed in maize, despite the similarly high P levels in Huaral (68.54 mg∙kg−1). This discrepancy may be attributed to the different chemical composition of maize or varying microbial demands for P [51]. Conversely, the absence of immobilization in avocados throughout the study aligns with the findings by Reyes-Martín et al. [52], who reported continuous P release. These results are also supported by the increase in available P under avocado decomposition bags observed by Tamayo-Vélez et al. [53]. Eucalyptus, on the other hand, displays alternating phases of release and immobilization, similar to patterns reported by other researchers [50,54].
The behavior of K in the four crops differs from that of N and P, as there is a significant release in the initial months. This is attributed to potassium being a non-structural element susceptible to leaching losses [55]. Nonetheless, the differences between the evaluated sites follow similar trends toward weight loss. Both maize and alfalfa showed no K immobilization at the end of the year, consistent with findings by Isaac & Nair [36] for three fruit tree species. In other instances, a slight initial immobilization is followed by an almost complete release of K [5,30]. Only avocados in Jangas and eucalyptus in Huaral exhibited slight immobilization by the year’s end, a behavior also noted by Ribeiro et al. [54] for eucalyptus, albeit over a period twice as long.
The release of micronutrients in the litter bag after the period of great immobilization that can be observed in all crops except alfalfa can be attributed to changes in the chemical composition of the residues as decomposition progresses [30], as well as microbial oxidation of components and physical-biological fragmentation [5,56]. However, findings such as those by Asigbaase et al. [30] in cocoa stubble did not demonstrate predominant immobilization of Fe, Cu, and Zn throughout the study, releasing nearly all of these metals by the end of the study, similar to observations in alfalfa from both Huaral and Jangas. In contrast, other studies have shown that Fe, Cu, and Zn either maintain their initial amounts or undergo significant immobilization, as reported by Pourhassan et al. [51], Reyes-Martín et al. [52], and Goya et al. [50].
Cd presents a distinct behavior compared to other analyzed elements, as significant immobilization periods are observed in herbaceous and tree crops. However, by the end of the study, almost all Cd in alfalfa and maize has been released, mainly due to the minimal remaining biomass of these crops. The propensity for Cd accumulation in stubble is well-documented in studies such as Guarín et al. [57] in cocoa, even in soils with very low initial Cd content in the topsoil. Moreover, studies by Van Nevel et al. [58] and Yue et al. [59] in forest species have observed greater immobilization of metals, including Cd, in litter with low initial metal content, emphasizing the initial quality of stubble in defining its release and immobilization characteristics. This initial immobilization observed in alfalfa and maize (Table 2) can be attributed to these factors. Understanding the dynamics of immobilization and release of heavy metals such as Cd in each crop is crucial for crop development and subsequent commercialization in global markets.
The significant correlations align with the detailed analysis of each variable examined. The k factor showed a significant correlation solely with the initial C/N ratio of the litter, consistent with findings by Chatterjee et al. [6] and Yue et al. [59]. An inverse relationship between initial N and initial C/N ratio was observed, which is particularly relevant in crops such as alfalfa. Ultimately, the C/N ratio is primarily influenced by C content rather than N content. The results reaffirm that soil properties do not have a great effect on the decomposition rate.
The significant positive interaction observed between pH and clay content is of particular interest, contrasting with the findings of Elnajdi et al. [60], who did not observe significant relationships between these properties. This discrepancy may be attributed to the prevalence of saline soils in Huaral, where sodium influences pH levels [61]. The strong positive correlation between bulk density and clay content differs from the negative associations reported by Chaudhari et al. [62]. Conversely, the negative correlation between bulk density and silt content aligns with findings by Orjuela-Matta et al. [63]. Such variability in findings may stem from diverse factors affecting bulk density, including compaction, clay type, and the presence of agents such as C rates and organic matter [64].
5. Conclusions
The exponential decay model (k) used effectively explains the decomposition rate of the four crops, each exhibiting distinct behavior at the evaluated sites. The release of C, N, P, and K is closely correlated with the weight loss of each crop, underscoring the critical role of crop residues in nutrient cycling. This is particularly notable in herbaceous crops, which release a substantial portion of their nutrients, with alfalfa and eucalyptus showing the greatest release in Jangas and maize and avocado in Huaral. Microelements were susceptible to periods of immobilization and release over time, with tree species demonstrating a notable capacity to immobilize Cd. Decomposition rates are significantly influenced by the initial chemical composition of the stubble, especially the C/N ratio, and show no significant relationship with the soil variables analyzed. Climatic fluctuations potentially influence the results derived from a single year. Consequently, a long-term study that includes variables such as humidity and soil respiration is essential to provide a more comprehensive understanding of the complex process of stubble decomposition over time.
Author Contributions
T.S., conceptualization, methodology, validation, writing—original draft, visualization, investigation; J.R., conceptualization, methodology, writing—review; R.S., supervision, writing—review and editing, funding acquisition. All authors have read and agreed to the published version of the manuscript.
Funding
This research was funded by the INIA project “Mejoramiento de los servicios de investigación y transferencia tecnológica en el manejo y recuperación de suelos agrícolas degradados y aguas para riego en la pequeña y mediana agricultura en los departamentos de Lima, Áncash, San Martín, Cajamarca, Lambayeque, Junín, Ayacucho, Arequipa, Puno y Ucayali” CUI 2487112.
Institutional Review Board Statement
Not applicable.
Informed Consent Statement
Not applicable.
Data Availability Statement
The data presented in this study are available on request from the corresponding author.
Acknowledgments
The authors express their gratitude to Felix Gonzales, a farmer from the Jangas district, for his valuable participation and logistical support.
Conflicts of Interest
The authors have no conflicts of interest to declare.
References
- Jadon, P.; Selladurai, R.; Singh Yadav, S.; Vassanda Coumar, M.; Lal Dotaniya, M.; Kumar Singh, A.; Bhadouriya, J. Volatilization and Leaching Losses of Nitrogen from Different Coated Urea Fertilizers. J. Soil. Sci. Plant Nutr. 2018, 18, 1036–1047. [Google Scholar] [CrossRef]
- Grzyb, A.; Wolna-Maruwka, A.; Niewiadomska, A. Environmental Factors Affecting the Mineralization of Crop Residues. Agronomy 2020, 10, 1951. [Google Scholar] [CrossRef]
- Dubeux, J.C.B.; Sollenberger, L.E. Nutrient Cycling in Grazed Pastures; Elsevier Inc.: Amsterdam, The Netherlands, 2020; ISBN 9780128144749. [Google Scholar]
- Liu, J.; Ding, C.; Zhang, W.; Wei, Y.; Zhou, Y.; Zhu, W. Litter Mixing Promoted Decomposition Rate through Increasing Diversities of Phyllosphere Microbial Communities. Front. Microbiol. 2022, 13, 1009091. [Google Scholar] [CrossRef]
- Naik, S.K.; Maurya, S.; Mukherjee, D.; Singh, A.K.; Bhatt, B.P. Rates of Decomposition and Nutrient Mineralization of Leaf Litter from Different Orchards under Hot and Dry Sub-Humid Climate. Arch. Agron. Soil. Sci. 2018, 64, 560–573. [Google Scholar] [CrossRef]
- Chatterjee, A.; Acharya, U. Controls of Carbon and Nitrogen Releases during Crops’ Residue Decomposition in the Red River Valley, USA. Arch. Agron. Soil. Sci. 2020, 66, 614–624. [Google Scholar] [CrossRef]
- Hobbie, S.E. Plant Species Effects on Nutrient Cycling: Revisiting Litter Feedbacks. Trends Ecol. Evol. 2015, 30, 357–363. [Google Scholar] [CrossRef]
- Cabrera, M.L.; Kissel, D.E.; Vigil, M.F. Nitrogen Mineralization from Organic Residues. J. Environ. Qual. 2005, 34, 75–79. [Google Scholar] [CrossRef]
- Ouyang, Y.; Norton, J.M. Short-Term Nitrogen Fertilization Affects Microbial Community Composition and Nitrogen Mineralization Functions in an Agricultural Soil. Appl. Environ. Microbiol. 2020, 86, 1–15. [Google Scholar] [CrossRef]
- Alghamdi, R.S.; Cihacek, L. Do Post-Harvest Crop Residues in No-till Systems Provide for Nitrogen Needs of Following Crops? Agron. J. 2022, 114, 835–852. [Google Scholar] [CrossRef]
- de Freitas Frasson, J.M.; Rosado, J.L.O.; Elias, S.G.; Harter-Marques, B. Litter Decomposition of Two Pioneer Tree Species and Associated Soil Fauna in Areas Reclaimed after Surface Coal Mining in Southern Brazil. Rev. Bras. Cienc. Solo 2016, 40, 1–14. [Google Scholar] [CrossRef]
- Lavelle, P.; Blanchart, E.; Martin, A.; Martin, S.; Spain, A. A Hierarchical Model for Decomposition in Terrestrial Ecosystems: Application to Soils of the Humid Tropics. Biotropica 1993, 25, 130. [Google Scholar] [CrossRef]
- Bradford, M.A.; Berg, B.; Maynard, D.S.; Wieder, W.R.; Wood, S.A. Understanding the Dominant Controls on Litter Decomposition. J. Ecol. 2016, 104, 229–238. [Google Scholar] [CrossRef]
- Bastian, F.; Bouziri, L.; Nicolardot, B.; Ranjard, L. Impact of Wheat Straw Decomposition on Successional Patterns of Soil Microbial Community Structure. Soil. Biol. Biochem. 2009, 41, 262–275. [Google Scholar] [CrossRef]
- Rakhsh, F.; Golchin, A.; Beheshti Al Agha, A.; Alamdari, P. Effects of Exchangeable Cations, Mineralogy and Clay Content on the Mineralization of Plant Residue Carbon. Geoderma 2017, 307, 150–158. [Google Scholar] [CrossRef]
- Arcand, M.M.; Helgason, B.L.; Lemke, R.L. Microbial Crop Residue Decomposition Dynamics in Organic and Conventionally Managed Soils. Appl. Soil. Ecol. 2016, 107, 347–359. [Google Scholar] [CrossRef]
- Lori, M.; Symnaczik, S.; Mader, P.; De Deyn, G.; Gattinger, A. Organic Farming Enhances Soil Microbial Abundance and Activity—A Meta-Analysis and Meta-Regression. PLoS ONE 2017, 12, e0180442. [Google Scholar] [CrossRef]
- Martínez-García, L.B.; Korthals, G.; Brussaard, L.; Jørgensen, H.B.; De Deyn, G.B. Organic Management and Cover Crop Species Steer Soil Microbial Community Structure and Functionality along with Soil Organic Matter Properties. Agric. Ecosyst. Environ. 2018, 263, 7–17. [Google Scholar] [CrossRef]
- Martínez-García, L.B.; Korthals, G.W.; Brussaard, L.; Mainardi, G.; De Deyn, G.B. Litter Quality Drives Nitrogen Release, and Agricultural Management (Organic vs. Conventional) Drives Carbon Loss during Litter Decomposition in Agro-Ecosystems. Soil. Biol. Biochem. 2021, 153, 108115. [Google Scholar] [CrossRef]
- Leal, F.; Aburto, F.; Aguilera, N.; Echeverría, C.; Gatica-Saavedra, P. Forest Degradation Modifies Litter Production, Quality, and Decomposition Dynamics in Southern Temperate Forests. Front. Soil. Sci. 2023, 3, 1111694. [Google Scholar] [CrossRef]
- Bonan, G.B.; Hartman, M.D.; Parton, W.J.; Wieder, W.R. Evaluating Litter Decomposition in Earth System Models with Long-Term Litterbag Experiments: An Example Using the Community Land Model Version 4 (CLM4). Glob. Chang. Biol. 2013, 19, 957–974. [Google Scholar] [CrossRef]
- Servicio Nacional Forestal y de Fauna Silvestre Registro Nacional de Plantaciones Forestales Por Especies|Plataforma Nacional de Datos Abiertos. Available online: https://www.datosabiertos.gob.pe/dataset/registro-nacional-de-plantaciones-forestales-por-especies (accessed on 1 July 2024).
- Ministerio de Desarrollo Agrario y Riego Perfil Productivo Departamental. Available online: https://app.powerbi.com/view?r=eyJrIjoiOGQ0M2QxMmItZTUyOC00NDQ5LTlhZDQtOWNlZjJmYTJjMWFiIiwidCI6IjdmMDg0NjI3LTdmNDAtNDg3OS04OTE3LTk0Yjg2ZmQzNWYzZiJ9 (accessed on 1 July 2024).
- Servicio Nacional de Meterología e Hidrología (SENAMHI) Datos Historicos. Available online: https://www.senamhi.gob.pe/?p=estaciones (accessed on 18 April 2024).
- Zasoski, R.J.; Burau, R.G. A Rapid Nitric-Perchloric Acid Digestion Method for Multi-Element Tissue Analysis. Commun. Soil. Sci. Plant Anal. 1977, 8, 425–436. [Google Scholar] [CrossRef]
- ISO 10694; Soil Quality-Determination of Organic and Total Carbon after Dry Combustion (Elemental Analysis). ISO (International Organization for Standardization): Geneva, Switzerland, 1995.
- ISO 13878; Soil Quality-Determination of Total Nitrogen Content by Dry Combustion (Elemental Analysis). ISO (International Organization for Standardization): Geneva, Switzerland, 1998.
- Adair, E.C.; Hobbie, S.E.; Hobbie, R.K. Single-Pool Exponential Decomposition Models: Potential Pitfalls in Their Use in Ecological Studies. Ecology 2010, 91, 1225–1236. [Google Scholar] [CrossRef]
- Rawlik, M.; Kasprowicz, M.; Jagodziński, A.M.; Rawlik, K.; Kaźmierowski, C. Slope Exposure and Forest Stand Type as Crucial Factors Determining the Decomposition Rate of Herbaceous Litter on a Reclaimed Spoil Heap. Catena 2019, 175, 219–227. [Google Scholar] [CrossRef]
- Asigbaase, M.; Dawoe, E.; Sjogersten, S.; Lomax, B.H. Decomposition and Nutrient Mineralisation of Leaf Litter in Smallholder Cocoa Agroforests: A Comparison of Organic and Conventional Farms in Ghana. J. Soils Sediments 2021, 21, 1010–1023. [Google Scholar] [CrossRef]
- Negash, M.; Starr, M. Litter Decomposition of Six Tree Species on Indigenous Agroforestry Farms in South-Eastern Ethiopia in Relation to Litterfall Carbon Inputs and Modelled Soil Respiration. Agrofor. Syst. 2021, 95, 755–766. [Google Scholar] [CrossRef]
- Rodríguez Pleguezuelo, C.R.; Durán Zuazo, V.H.; Muriel Fernández, J.L.; Martín Peinado, F.J.; Franco Tarifa, D. Litter Decomposition and Nitrogen Release in a Sloping Mediterranean Subtropical Agroecosystem on the Coast of Granada (SE, Spain): Effects of Floristic and Topographic Alteration on the Slope. Agric. Ecosyst. Environ. 2009, 134, 79–88. [Google Scholar] [CrossRef]
- Zheng, J.; Guo, R.; Li, D.; Zhang, J.; Han, S. Nitrogen Addition, Drought and Mixture Effects on Litter Decomposition and Nitrogen Immobilization in a Temperate Forest. Plant Soil. 2017, 416, 165–179. [Google Scholar] [CrossRef]
- Demessie, A.; Singh, B.R.; Lal, R.; Strand, L.T. Leaf Litter Fall and Litter Decomposition under Eucalyptus and Coniferous Plantations in Gambo District, Southern Ethiopia. Acta Agric. Scand. B Soil. Plant Sci. 2012, 62, 467–476. [Google Scholar] [CrossRef]
- Rovira, P.; Rovira, R. Fitting Litter Decomposition Datasets to Mathematical Curves: Towards a Generalised Exponential Approach. Geoderma 2010, 155, 329–343. [Google Scholar] [CrossRef]
- Isaac, S.R.; Nair, M.A. Biodegradation of Leaf Litter in the Warm Humid Tropics of Kerala, India. Soil. Biol. Biochem. 2005, 37, 1656–1664. [Google Scholar] [CrossRef]
- Mohan Kumar, B. Litter Dynamics in Plantation and Agroforestry Systems of the Tropics—A Review of Observations and Methods. In Ecological Basis of Agroforestry; CRC Press: Boca Raton, FL, USA, 2007; pp. 181–216. [Google Scholar]
- Sari, R.R.; Rozendaal, D.M.A.; Saputra, D.D.; Hairiah, K.; Roshetko, J.M.; van Noordwijk, M. Balancing Litterfall and Decomposition in Cacao Agroforestry Systems. Plant Soil. 2022, 473, 251–271. [Google Scholar] [CrossRef]
- Fontes, A.G.; Gama-Rodrigues, A.C.; Gama-Rodrigues, E.F.; Sales, M.V.S.; Costa, M.G.; Machado, R.C.R. Nutrient Stocks in Litterfall and Litter in Cocoa Agroforests in Brazil. Plant Soil. 2014, 383, 313–335. [Google Scholar] [CrossRef]
- Singh, M.; Sarkar, B.; Sarkar, S.; Churchman, J.; Bolan, N.; Mandal, S.; Menon, M.; Purakayastha, T.J.; Beerling, D.J. Stabilization of Soil Organic Carbon as Influenced by Clay Mineralogy. In Advances in Agronomy; Academic Press Inc.: Cambridge, MA, USA, 2018; Volume 148, pp. 33–84. ISBN 9780128151792. [Google Scholar]
- Obalum, S.E.; Chibuike, G.U.; Peth, S.; Ouyang, Y. Soil Organic Matter as Sole Indicator of Soil Degradation. Environ. Monit. Assess. 2017, 189, 176. [Google Scholar] [CrossRef]
- Rubino, M.; Dungait, J.A.J.; Evershed, R.P.; Bertolini, T.; De Angelis, P.; D’Onofrio, A.; Lagomarsino, A.; Lubritto, C.; Merola, A.; Terrasi, F.; et al. Carbon Input Belowground Is the Major C Flux Contributing to Leaf Litter Mass Loss: Evidences from a 13C Labelled-Leaf Litter Experiment. Soil. Biol. Biochem. 2010, 42, 1009–1016. [Google Scholar] [CrossRef]
- Rachid, C.T.C.C.; Balieiro, F.C.; Peixoto, R.S.; Fonseca, E.S.; Jesus, H.E.; Novotny, E.H.; Chaer, G.M.; Santos, F.M.; Tiedje, J.M.; Rosado, A.S. Mycobiome Structure Does Not Affect Field Litter Decomposition in Eucalyptus and Acacia Plantations. Front. Microbiol. 2023, 14, 1106422. [Google Scholar] [CrossRef]
- Ajwa, H.A.; Tabatabai, M.A. Decomposition of Different Organic Materials in Soils; Springer: Berlin/Heidelberg, Germany, 1994; Volume 18. [Google Scholar]
- Zhang, J.; Li, H.; Zhang, H.; Zhang, H.; Tang, Z. Responses of Litter Decomposition and Nutrient Dynamics to Nitrogen Addition in Temperate Shrublands of North China. Front. Plant Sci. 2021, 11, 618675. [Google Scholar] [CrossRef]
- Hefting, M.M.; Clement, J.C.; Bienkowski, P.; Dowrick, D.; Guenat, C.; Butturini, A.; Topa, S.; Pinay, G.; Verhoeven, J.T.A. The Role of Vegetation and Litter in the Nitrogen Dynamics of Riparian Buffer Zones in Europe. Ecol. Eng. 2005, 24, 465–482. [Google Scholar] [CrossRef]
- Cowan, O.S.; Anderson, P.M.L. Litter Decomposition Variation across a Degradation Gradient and Two Seasons in a Critically Endangered Vegetation Type within the Fynbos Biome, South Africa. South. Afr. J. Bot. 2019, 121, 200–209. [Google Scholar] [CrossRef]
- Marinho, O.A.; Martinelli, L.A.; Duarte-Neto, P.J.; Mazzi, E.A.; King, J.Y. Photodegradation Influences Litter Decomposition Rate in a Humid Tropical Ecosystem, Brazil. Sci. Total Environ. 2020, 715, 136601. [Google Scholar] [CrossRef]
- Boberg, J.B.; Finlay, R.D.; Stenlid, J.; Ekblad, A.; Lindahl, B.D. Nitrogen and Carbon Reallocation in Fungal Mycelia during Decomposition of Boreal Forest Litter. PLoS ONE 2014, 9, e92897. [Google Scholar] [CrossRef]
- Goya, J.F.; Frangi, J.L.; Pérez, C.; Dalla Tea, F. Decomposition of Eucalyptus Leaf Litter Decomposition and Nutrient Release from Leaf Litter in Eucalyptus Grandis Plantations on Three Different Soils in Entre Ríos, Argentina. Bosque 2008, 29, 217–226. [Google Scholar] [CrossRef]
- Pourhassan, N.; Bruno, S.; Jewell, M.D.; Shipley, B.; Roy, S.; Bellenger, J.P. Phosphorus and Micronutrient Dynamics during Gymnosperm and Angiosperm Litters Decomposition in Temperate Cold Forest from Eastern Canada. Geoderma 2016, 273, 25–31. [Google Scholar] [CrossRef]
- Reyes-Martín, M.P.; Ortiz-Bernad, I.; Lallena, A.M.; San-Emeterio, L.M.; Martínez-Cartas, M.L.; Ondoño, E.F. Reuse of Pruning Waste from Subtropical Fruit Trees and Urban Gardens as a Source of Nutrients: Changes in the Physical, Chemical, and Biological Properties of the Soil. Appl. Sci. 2022, 12, 193. [Google Scholar] [CrossRef]
- Tamayo-Vélez, Á.; Osorio, N.W. Soil Fertility Improvement by Litter Decomposition and Inoculation with the Fungus Mortierella Sp. in Avocado Plantations of Colombia. Commun. Soil. Sci. Plant Anal. 2018, 49, 139–147. [Google Scholar] [CrossRef]
- Ribeiro, C.; Madeira, M.; Araújo, M.C. Decomposition and Nutrient Release from Leaf Litter of Eucalyptus Globulus Grown under Different Water and Nutrient Regimes. Ecol. Manag. 2002, 171, 31–41. [Google Scholar] [CrossRef]
- Sardans, J.; Peñuelas, J. Potassium Control of Plant Functions: Ecological and Agricultural Implications. Plants 2021, 10, 419. [Google Scholar] [CrossRef]
- Gupta, G.; Yadav, R.S.; Maurya, D. Decomposition of Different Litter Fractions in Agroforestry System of Central India. Int. J. Curr. Microbiol. Appl. Sci. 2017, 6, 1089–1097. [Google Scholar] [CrossRef]
- Guarín, D.; Martín-López, J.M.; Libohova, Z.; Benavides-Bolaños, J.; Maximova, S.N.; Guiltinan, M.J.; Spargo, J.; da Silva, M.; Fernandez, A.; Drohan, P. Accumulation of Cadmium in Soils, Litter and Leaves in Cacao Farms in the North Sierra Nevada de Santa Marta, Colombia. Geoderma Reg. 2024, 36, e00762. [Google Scholar] [CrossRef]
- Van Nevel, L.; Mertens, J.; Demey, A.; De Schrijver, A.; De Neve, S.; Tack, F.M.G.; Verheyen, K. Metal and Nutrient Dynamics in Decomposing Tree Litter on a Metal Contaminated Site. Environ. Pollut. 2014, 189, 54–62. [Google Scholar] [CrossRef]
- Yue, K.; Yang, W.; Tan, B.; Peng, Y.; Huang, C.; Xu, Z.; Ni, X.; Yang, Y.; Zhou, W.; Zhang, L.; et al. Immobilization of Heavy Metals during Aquatic and Terrestrial Litter Decomposition in an Alpine Forest. Chemosphere 2019, 216, 419–427. [Google Scholar] [CrossRef]
- Elnajdi, A.; Berland, A.; Haeft, J.; Dowling, C. Influence of Soil PH, Organic Matter, and Clay Content on Environmentally Available Lead in Soils: A Case Study in Muncie, Indiana, USA. Open J. Soil. Sci. 2023, 13, 414–430. [Google Scholar] [CrossRef]
- Bleam, W. Acid-Base Chemistry. In Soil and Environmental Chemistry; Elsevier: Amsterdam, The Netherlands, 2017; pp. 253–331. [Google Scholar]
- Chaudhari, P.R.; Ahire, D.V.; Ahire, V.D.; Chkravarty, M.; Maity, S. Soil Bulk Density as Related to Soil Texture, Organic Matter Content and Available Total Nutrients of Coimbatore Soil. Int. J. Sci. Res. Publ. 2013, 3, 1–8. [Google Scholar]
- Orjuela-Matta, H.M.; Rubiano-Sanabria, Y.; Camacho-Tamayo, J.H. Spatial Variability of Hydrodynamic Parameters in the Native Savanna of the Colombian Eastern Plains. Agron. Colomb. 2011, 29, 83–90. [Google Scholar]
- Al-Shammary, A.A.G.; Kouzani, A.Z.; Kaynak, A.; Khoo, S.Y.; Norton, M.; Gates, W. Soil Bulk Density Estimation Methods: A Review. Pedosphere 2018, 28, 581–596. [Google Scholar] [CrossRef]
Disclaimer/Publisher’s Note: The statements, opinions and data contained in all publications are solely those of the individual author(s) and contributor(s) and not of MDPI and/or the editor(s). MDPI and/or the editor(s) disclaim responsibility for any injury to people or property resulting from any ideas, methods, instructions or products referred to in the content. |
© 2024 by the authors. Licensee MDPI, Basel, Switzerland. This article is an open access article distributed under the terms and conditions of the Creative Commons Attribution (CC BY) license (https://creativecommons.org/licenses/by/4.0/).