Abstract
Monoculture systems depend on high nitrogen (N) fertilisation. Incorporating legumes into forage crops offers a sustainable alternative with agronomic and economic benefits. This study assesses the impact of legumes in fodder systems, evaluating yield, N use efficiency (NUE), and profitability while identifying the best cropping strategy under semi-arid conditions. The experiment, conducted at Herdade da Comenda, Elvas, Portugal, used a split–split-plot randomised block design to analyse N doses, forage species, and irrigation. Economic metrics, including costs, net revenue, return on investment, and risk analysis, were also assessed. Moderate N doses (120 kg ha−1) resulted in significantly higher NUE (15.67 kg kg−1 N) than higher doses (200 kg ha−1), which yield only 1.40 kg kg−1 N (p < 0.05), particularly in mixed fodder crops. Irrigation improved N absorption, crop nutrition, and yield, leading to higher profitability despite increased initial costs. Agronomically, irrigation and N doses influenced yield and nutrient uptake, while no significant differences were observed between different forage crops in terms of yield or NUE. Economically, the irrigated mixed crop showed the highest return on investment (ROI = 247.37 EUR ha−1), whereas ryegrass presented lower financial risk (BE = 2213.24 kg ha−1) due to lower establishment costs. Yield was the strongest predictor of net profit (R2 = 0.89). Looking ahead, optimising N management, irrigation strategies, and mixed grass–legume crops will be crucial to maximising economic returns while minimising environmental impacts.
Keywords:
management; environment; grass–legume; net revenue; yield; modelling; profitability; data-analysis 1. Introduction
Farmers usually resort to excessive nitrogen (N) fertilisation to ensure high productivity, contributing to the contamination of aquifers. The European Union has regulated this issue through Directive 91/676/EEC [1], which sets limits on nitrogen doses to be applied to crops in nitrate-vulnerable zones, obliging good agricultural practices to be adopted. One way to mitigate the negative impacts of excessive N fertilisation is by adopting mixed cropping systems, particularly those involving legumes, which enhance N fixation and soil health. The use of legumes in forage mixed crops has emerged as a sustainable alternative, bringing both agronomic and economic benefits. Intercropping systems generally show higher overall productivity per unit land area compared to monocultures, due to better resource utilisation in terms of space, light, and nutrients [2,3,4]. They benefit from biological N fixation, which can lead to significant cost savings and environmental benefits [2,3,5]. Legumes in intercropping improve soil health by enhancing microbial activity and enzyme functions, increasing soil organic carbon, total soil N, and microbial biomass, which are beneficial for nutrient cycling, soil fertility, and long-term soil health [6,7].
Long-term sustainability is supported by the reduced need for chemical fertilisers and improved soil structure [4,6]. Studies have shown that intercropping can improve N use efficiency (NUE) and reduce N losses through volatilisation and runoff [2]. Mixed cropping systems, such as grass–legume mixtures, enhance soil nitrogen levels and improve soil physical properties, leading to better water infiltration and soil tilth [8,9]. Intercropping systems have been shown to improve water use efficiency (WUE), which is crucial in arid and semi-arid regions [10,11].
Mixed crop systems often result in higher net profits compared to monocultures [12]. Although intercropping has several economic implications, particularly in terms of labour and resource management, it can offer economic advantages over monoculture systems. Generally, the success of intercropping systems depends on the careful management of crop combinations, seeding densities, and timing, which can be complex and require more knowledge and planning [13,14]. While intercropping can increase overall productivity, individual crop yields may be reduced due to competition for resources. For example, groundnut yields were reduced when intercropped with cereal fodders like pearl millet and sorghum [15]. However, intercropping systems often offer economic advantages by allowing multiple crop harvests and more efficient use of land. This is often quantified using the land equivalent ratio (LER), which compares the productivity of intercropping to sole cropping. An LER greater than 1 indicates that intercropping is more efficient and can help offset production costs, even when individual crop yields decline [16]. Some authors affirm that despite the increased labour requirements, the overall economic benefits often outweigh these additional costs [17].
To determine the best strategy for crop selection, irrigation, and N dose in challenging Mediterranean edaphoclimatic conditions, several factors need to be considered, including water availability, crop type, and the efficient use of N. In Mediterranean regions, selecting crop types must consider climatic challenges such as droughts and high evapotranspiration. Local landraces and cultivars adapted to these conditions often perform better [18,19]. High temperatures can significantly impact crop yields. Crops like oats and barley have shown varying degrees of adaptation to high temperatures and drought conditions [18,19]. Early flowering and maturity can help crops avoid the most severe heat and drought periods. For example, certain oat landraces and durum wheat cultivars have been selected for their early flowering traits [18,20]. In terms of water management, supplemental and deficit irrigation can help mitigate the effects of low rainfall. Efficient irrigation practices are essential for crops like wheat and barley to maintain yields under water-limited conditions [21,22]. Ref. [23], for example, integrating early sowing, minimum tillage, and efficient weed control can optimise crop productivity under changing climatic conditions [21,22].
Considering these challenges, this study adopts an integrated approach to assess the agronomic and economic impact of incorporating legumes into fodder crops. Specifically, it aims to (1) analyse the influence of these systems on productivity, forage quality, and NUE; (2) investigate their economic feasibility by comparing costs and benefits with conventional annual ryegrass monocultures; and (3) identify optimal cropping strategies by evaluating the complex interactions among crop selection, irrigation regime, and N dose, particularly within the challenging edaphoclimatic conditions of the Mediterranean region. Furthermore, this research aims to elucidate the synergistic relationships between key agronomic and economic variables, providing foundational insights for the development of more sustainable and profitable forage production systems and informing the design of future predictive models for N fertilisation management.
2. Materials and Methods
The methodology of this study had three main components. The first was the implementation of the crop response plot experiments as described in [24]. This implementation considered three main factors to be varied: crop (monoculture of annual ryegrass vs. grass–legume mixed fodder crop), irrigation (irrigated vs. rainfed) and three N levels to be tested (N0, N1, N2), applied as ammonium nitrate (27% N). In this way, several possible combinations were analysed.
The second component was the manual collection of samples to assess the plant fresh matter, which were then oven-dried at 65 °C for 72 h until showing a constant weight to assess the plant dry matter (PDM) in kilograms per hectare (kg ha−1). The samples were ground and sieved using a 1 mm mesh sieve, and plant N content (PNC; %) was analysed by the Kjeldahl method [25]. With these parameters, we calculated key agronomic variables, including yield per hectare plant N content (PNC), plant N content per unit area (PNCy), crude protein (CP), crude protein per unit area (CPy), N uptake (NUp), N uptake efficiency (NUpE), N use efficiency (NUE), and N nutrition index (NNI), which reflect crop productivity, N utilisation efficiency, and the N nutritional status of the crops (described in more detail in Section 2.2 Agronomic Variables).
The third component of this study analysed the economic and profitability indicators of the crop response plots experiments (described in more detail in Section 2.3 Economic Variables and 2.4 Profitability Metrics).
2.1. Installation of Field Experiments
The experimental trials [24] were conducted at Herdade da Comenda—Innovation Centre of the National Institute for Agricultural and Veterinary Research (INIAV), located in Caia, Elvas, Portugal (38°53′38.52′ N and 7°3′19.01′ W), between 7 November 2022 and 14 April 2023 (158 days). The experimental field is situated within the Caia irrigation perimeter. According to the FAO classification, the predominant soil of the field is a Luvisol that corresponds to Pag and Sr Mediterranean soil categories [26].
The experimental site is characterised by a Csa climate, according to the Köppen–Geiger classification [27]. The average monthly temperature (Tm; °C) and rainfall (P; mm) for the climatological normal (1971–2000) [28] and for the specific test period of the study are presented in Table 1. During the test period, the total seasonal precipitation amounted to 378.5 mm, calculated from the sum of monthly rainfall shown in Table 1.

Table 1.
Average monthly temperature (Tm; °C) and rainfall (P; mm) for the climatological normal (1971–2000) and the test period.
The experiment followed a split–split-plot randomised block design [29,30]. The main block received three N topdressing levels using ammonium nitrate (27% N), which were applied in addition to a uniform basal application of 27.6 kg N ha−1 from a compound fertiliser:
- N0—0 kg fertiliser ha−1 (0 kg N ha−1);
- N1—120 kg fertiliser ha−1 (32.4 kg N ha−1);
- N2—200 kg fertiliser ha−1 (54 kg N ha−1).
These top dressings were applied 84 days after seeding (DAS). The sub-blocks had two different forage crop types:
- Annual ryegrass monoculture;
- Mixed crop of annual ryegrass and clovers.
The sub-sub-blocks included two irrigation management scenarios:
- Rainfed;
- Irrigated.
Under irrigated management, water was applied at key phenological stages (sowing, ryegrass tillering, and ryegrass stem elongation) until the soil reached field capacity. Each plot measured 2 × 8 m (Figure 1), and each treatment combination was replicated 4 times, totalling 48 plots.

Figure 1.
Location and design of the experiments field [24].
All plots were set up in a flat location to avoid the potential influence of the runoff of water or nutrients. Regarding the plot allocation and randomisation process, the main plots (forage crop types) were systematically arranged adjacent to each other across the experimental field. Full randomisation at this level was not performed due to the significant logistical requirements associated with seeding operations for distinct crop types. Within each main plot, the subplots (irrigation treatments) were also systematically arranged adjacent to each other. These subplots were consistently laid out within each of the four physical replicates per crop type, which was necessary due to the substantial logistical demands of managing the large-scale irrigation systems. The sub-sub-plots (N fertiliser doses: N0, N1, N2) were randomised within each experimental block. Each block was defined by a unique combination of crop type and irrigation treatment, and a complete set of these randomised N fertiliser doses was replicated four times across the study area.
The crops of (i) annual ryegrass and (ii) mixed crop forage based on annual ryegrass and clovers (Table 2), were sown separately with an inter-row distance of 0.18 m and a depth of 0.01 m. The sowing doses were 1400 seeds m−2 for annual ryegrass and 4070 seeds m−2 for mixed crop [31], seeded on 7 November 2022. This corresponds to approximately 50 kg ha−1 and 80 kg ha−1, respectively. For each 16.2 m−2 experimental plot, approximately 81 g and 129.6 g of seed were applied. Before sowing, on 28 October 2022, phosphorus (16.1 kg P2O5 ha−1) and potassium (13.8 kg K2O ha−1) were applied as a granular NPK 12-7-6 fertiliser, along with 27.6 kg ha−1 of N, evenly distributed across all plots to ensure uniform crop emergence. Irrigation was also applied evenly at this time, using a sprinkler system. This irrigation was carried out until the soil reached field capacity and allowed the crop to emerge. Weeds and diseases were controlled following good experimental practices.
Table 2.
Species, cultivars, and seed doses for seeding.
For irrigation treatments, the effective plant rooting depth was 0.40 m. Soil field capacity (FC) was determined to be 0.18 cm3 cm−3, based on the direct field drainage method. This information guided the irrigation scheduling to ensure the soil reached field capacity at key phenological stages. Irrigation requirements were determined based on soil moisture deficits monitored via soil humidity sensors. A total of 100 mm of water was supplied to the irrigated plots throughout the growing season. Consequently, the total season moisture (gross) received by the irrigated plots was approximately 492.8 mm, comprising 100 mm of applied irrigation and 392.8 mm of seasonal precipitation.
2.2. Agronomic Variables
Plants were cut 5 cm above the ground in a sub-sampling area (1 m × 1 m) at the northernmost point of each plot, next to stem elongation, when the ryegrass is ready to be cut for hay. In total, 48 samples were collected. These samples included all vegetation above the cutting height within the area, allowing for the estimation of yield (kg ha−1). The samples were dried in an oven at 60 °C until they reached a constant dry weight (approximately 24–48 h). After drying, the samples were weighed to determine the PDM. They were then ground and analysed using the Kjeldahl method [25] to estimate the PNC (%). This process collected the PDM-PNC data pair for each plot. In this way, it was possible to calculate the yield amount of N per unit area (PNCy; kg N ha−1).
Once the N content of the plants was known, their crude protein (CP; %) content was calculated using Equation (1):
where CP is the crude protein content in the plants and PNC is the N content estimated by the Kjeldhal method. This calculation also makes it possible to calculate the yield amount of CP per unit area (CPy; kg CP ha−1).
CP (%) = PNC × 6.25,
Ref. [24], in this study, N uptake (NUp), use efficiency of fertilised N (NUpE), and NUE were considered. Finally, the N nutrition index (NNI) was also used as an indicator of the crop’s N nutritional status. In summary, all the agronomic variables analysed are shown in Table 3.
Table 3.
Summary of agronomic variables considered.
2.3. Economic Variables
To produce fodder crops, fixed costs (FC) and variable costs (VC) were necessary. Within the fixed costs, land costs were considered. The cost assumed was 173 EUR ha−1, according to [32], which is the average value used in the European Union—27 countries (from 2020).
Variable costs include input costs and operating costs. Note that neither basal fertiliser costs nor forage harvesting costs were considered. To isolate the effect of the variables under study (crop, irrigation and N dose), only the variable costs adjacent to the operations of interest were considered. In addition, in the case of basal fertiliser, it was applied equally to all the plots and therefore influenced them all equally. And in the case of harvesting, this is a process applied to crops that can vary greatly from situation to situation, and very different strategies or operations can be chosen at very different costs, depending on the purpose of the production, the animal species for which it is intended, and the manager and their knowledge/strategy, among others. For this reason, and because the harvesting operation comes after all the operations under study in this paper, harvesting costs were not considered. The summary of values considered for the assumed variable costs are shown in Table 4.
Table 4.
Summary of the VCs considered (EUR ha−1).
The VC assumed includes the sum of the costs of seeding, water, and top-dressing fertilisation, including the respective inputs. The FC includes the VC plus the price of the land. So, these are the first two economic indicators considered: VC and FC.
By dividing the total cost per ha by yield, we get the value of the production cost per unit of forage (UNIyield). And by applying the same concept but dividing the production cost per unit of CP produced per ha, we get the production cost of each unit of CP (UNICP). These four indices allow us to frame the scenarios analysed in terms of production costs.
As for income, the forage value was given according to the current market that pays for the product based on quantity. In this case, the value assumed for the fodder was 0.20 EUR kg−1 [33]. Multiplying the yield by the sale value of the fodder gave the revenue per ha (REV; EUR ha−1) (Equation (2)).
where REV is the revenue in euros per ha and yield is the productivity of fodder per ha, in kg ha−1.
REV = Yield × Market price per unit,
The summary of the economic variables considered is presented in Table 5.
Table 5.
Summary of economic variables considered.
2.4. Profitability Metrics
Profitability metrics were calculated for the different plots to economically analyse the different G × E × M scenarios studied. Firstly, the net revenue margin (REVnet) was calculated, according to Equation (3):
where REVnet is the net revenue margin in EUR per ha, REV is the revenue in EUR per ha, FC is the fixed costs in EUR per ha, and VC is the variable costs in EUR per ha.
REVnet = REV − (FC + VC),
The return on investment (ROI) was then calculated as the return on capital invested, using Equation (4).
where ROI is the return on investment in EUR per ha, FC is the fixed costs in EUR per ha, VC is the variable cost in EUR per ha, and REVnet is the net revenue in EUR per ha.
Finally, the break-even point (BE) was calculated using Equation (5) to calculate the yield needed to cover costs.
In summary, the three profitability indicators are presented in Table 6.
Table 6.
Summary of profitability metrics considered.
2.5. Model Economic Risks
To assess the interactions and synergies between the agronomic, economic, and profitability variables under study, a correlation matrix was drawn up.
To quantify the degree and direction of associations between the variables, Spearman’s rank correlation coefficient (rs) was employed. This non-parametric method was chosen because it does not assume normality in the data and is robust for analysing monotonic non-linear relationships, common in biological and economic datasets, as well as being less sensitive to outliers. The correlation matrix allowed for the identification of interdependencies between the different productive and economic factors.
The statistical significance of the Spearman’s correlations was determined by calculating p-values. To control the family-wise error rate arising from multiple comparisons within the correlation matrix, the Bonferroni correction was applied. Correlations were considered statistically significant at an alpha level of p < 0.05.
Sensitivity analysis was carried out to assess the impact of the different variables on the net profits of the two crops analysed. With the main objective of knowing the influence of changes in the main economic variables on REVnet (EUR ha−1), the factors that have the greatest impact on profitability in the different scenarios studied were analysed. Variations in REVnet (EUR ha−1) were analysed in response to different levels of change in the selected variables (−20%, −10%, 10%, and 20%). These variations were applied proportionally to the average values of the variables to simulate scenarios of reduction and increase in the factors analysed. These percentages were chosen as they represent standard and widely accepted ranges in agricultural economic analyses, reflecting typical, yet plausible, variability in market conditions and operational costs. This approach allowed us to evaluate the stability of our economic outcomes under different potential future scenarios.
2.6. Tools for Implementation
A statistical and inferential analysis was carried out to begin analysing the general data, including the coefficient of variation (CV) and standard deviation (SD) to quantify data variability and dispersion, and interquartile analysis to examine data distribution and identify potential outliers. The raw agronomic and economic data collected from the field underwent statistical and inferential analysis. Outliers were identified and removed using the interquartile range (IQR) method, specifically by excluding data points falling below Q1—(1.5 × IQR) or above Q3 + (1.5 × IQR). This outlier exclusion process was applied independently to each variable. This analysis was performed in RStudio©v.2023.4.3.2 with the R©psych Package v. 2.4.3 CRAN Repository [34,35]. The data were then grouped by crop, irrigation management, N dose, and the dependent variables (the parameters yield, PNC, PNCy, CP, CPy, NUp, NUpE, NUE, NNI, VC, FC, UNIyield, UNICP, REV, REVnet, ROI, and BE).
The Shapiro–Wilk test was applied to each dependent variable as a normality test. Variables with a non-normal distribution were analysed using the Kruskal–Wallis test, and those with a normal distribution were analysed using ANOVA. The post hoc analyses that followed the Kruskal–Wallis test used Dunn’s test in RStudio©v.2023.4.3.2 with the R©dunn.test Package v. 1.3.6 CRAN Repository [34,36].
The correlation coefficients were classified according to their intensity and statistical significance. The sensitivity analysis was carried out using appropriate mathematical models to simulate the responses of the economic variables. The results were presented graphically to facilitate the interpretation and comparison of the impacts between the different scenarios evaluated.
3. Results
3.1. Variations in Agronomic, Economic, and Profitability Variables
The statistical and inferential analysis of the raw data from the field agronomic data collected and the crop account led to the identification and removal of outliers using the IQR method, resulting in Table 7, presenting the data after this outlier management process. The number of samples considered for each variable varied, ranging from 29 to 45, as a direct result of the variable-specific outlier exclusion. This table summarises the descriptive statistics of the variables analysed, including the number of samples considered, minimum, median, average, and maximum values, as well as the SD and CV.
Table 7.
Inferential and descriptive statistics of the agronomic and economic variables of the crop management strategies tested.
Table 7 shows considerable variation in the agronomic variables analysed, suggesting that different management strategies have a significant impact on yield and nutrient use efficiency. Yield shows a median of 3133.8 kg ha−1 and a CV of 30.0%, which indicates moderate variability. The N content in the plant, represented by PNC and PNCy, shows less variation in the percentage N content (CV = 15.3%) compared to the amount of N expressed per unit area (CV = 33.3%), indicating that the way of expressing the N content in plants is more sensitive to management practices according to the amount of N per unit area.
The variables related to N utilisation efficiency (NUp, NUpE, and NUE) showed extremely high variations, especially NUE, with a CV of 295.1%. This indicates that N utilisation efficiency varied drastically between the different treatments. NUp also showed high variability (CV = 33.3%), while NUpE had an average value of 190.6%.
Finally, the NNI had a median of 1.0, which indicates that, on average, the plants were within the optimum nitrogen nutrition range. However, with a CV of 24.1%, there are indications that nutrition varied between treatments. This information is corroborated by the minimum NNI value of 0.5 and the maximum value of 1.4, demonstrating the occurrence of undernourished and overnourished plants.
The results shown in Table 7 indicate that VC has an average value of 275.0 EUR ha−1, with a minimum of 145.4 EUR ha−1 and a maximum of 401.2 EUR ha−1, while FC has an average of 444.0 EUR ha−1, with values varying between 314.4 EUR ha−1 and 570.2 EUR ha−1. The dispersion of FC is relatively low, with a CV of 18.2 per cent, indicating less variability between treatments, especially when compared to VC. VC has a CV of 29.4%, which means that the main variations in the crop account are mainly in VC, i.e., in the production factors analysed, such as seed, irrigation water, and nitrogen fertiliser. Of all the agronomic and economic variables studied, only VC and FC showed a normal distribution of data.
UNIyield has an average of 0.1 EUR kg−1 yield, with a standard deviation of 0.1, indicating low variation. UNICP, on the other hand, has an average of 1.7 EUR kg−1 CP, ranging from 0.8 EUR kg−1 CP to 3.1 EUR kg−1 CP, with a CV of 32.9 per cent, suggesting greater variation between treatments.
REV shows an average of 602.8 EUR ha−1, with a minimum of 229.4 EUR ha−1 and a maximum of 962.6 EUR ha−1, with a SD of 181.0 EUR ha−1 and a CV of 30.0%.
3.2. Normality Test and Significance Tests
Table 8 shows the results of the normality test Shapiro–Wilk applied to each variable, allowing the most appropriate significance test to be chosen to assess the effects of the factors studied. Variables that did not follow a normal distribution were analysed using the non–parametric Kruskal–Wallis test, while those that met the normality criterion were subjected to an analysis of variance (ANOVA). Significance tests were carried out for the factors crop (crop), irrigation (irrigation), and N treatment (Nt), as well as for the interactions between these factors. Statistical significance values are indicated with the codes ***p < 0.001, **p < 0.05, and *p < 0.1.
Table 8.
Results of the normality test and significance test for the agronomic and economic variables under study.
According to Table 7, the crop factor was not significant for any of the agronomic variables. Irrigation, on the other hand, proved to have a highly significant effect (p < 0.01) on crop productivity, as well as on PNCy, CPy, NUp, and NNI. This indicates that the availability of water directly influenced productivity, N absorption by the plants, and, consequently, the amount of N produced per unit, as well as the N nutritional status of the crops.
To summarise, Table 7 shows that some of the interactions between the factors evaluated were statistically significant. The interaction between crop and irrigation showed moderate effects on productivity, PNCy, CPy, and NUp. The interaction between crop and N dose revealed significant differences for PNC and CP, suggesting that different crops respond differently to the N doses applied. The interaction between irrigation and N fertilisation proved to be relevant for most of the variables, except for NUpE and NUE, highlighting the importance of water availability in the N use by plants. Finally, the triple interaction (crop × irrigation × Nt) had a more limited effect, with only a one-off influence on PNCy, CPy, and NUp.
3.3. Post Hoc Tests
3.3.1. Agronomic Variables
The main results of the post hoc analysis, focusing on the agronomic variables that exhibited statistically significant effects of the Nt’s or their interaction with crop type, are presented in Table 9.
Table 9.
Results of the post hoc test with more significance for the agronomic variables under study.
The Nt factor had a highly significant influence (p < 0.01) on the variables related to CP and PNC, demonstrating that the different N fertilisation treatments have a direct impact on the N content in the plants. In addition, the different nitrogen fertiliser treatments also affected all the other variables with some significance, apart from NUpE. In other words, the absorption efficiency of the fertilised N was not significantly influenced by the different doses of N applied. According to the results of the post hoc test shown in Table 8, there is a very high significance (p = 0.004) for the PNC and CP variables between the null dose of N application (N0) and the 200 kg ha−1 dose (N2). This significance is also very high when we specify these two doses in the forage-mixed crop. In the case of NUE, the significance is high (p = 0.081) only between treatments N1 and N2.
Table 10 presents the descriptive statistics of the agronomic and economic variables, categorised by Nt, crop type, and crop type and Nt interaction following the results presented in Table 8.
Table 10.
Descriptive statistics of key agronomic variables categorised by Nt and by crop type and Nt interaction.
Regarding CP, the analysis of Table 10 reveals that increasing N fertilisation generally led to higher CP percentages. For instance, the mean CP for N2 (11.90%) was higher than N0 (9.93%), and the mean CPy for MIX.N2 (12.19%) was higher than MIX.N0 (9.72%). This trend in CP content directly reflects the CPy, with similar patterns observed across treatments.
For NUE, Table 10 shows a wide range of values, including negative observations (minimum = −45.69 kg kg−1 N), particularly highlighting variability across N treatments. The intermediate N1 treatment exhibited the highest mean NUE (15.67 kg kg−1 N), while the higher N2 treatment showed a considerably lower mean NUE (1.40 kg kg−1 N).
In terms of yield, Table 10 indicates clear differences between irrigation and Nt interactions. The Irrigated.N1 scenario demonstrated greater mean production (3047.70 kg ha−1) compared to the Rainfed.N2 scenario (1959.12 kg ha−1), indicating a positive effect of irrigation combined with an intermediate N level on forage yield.
The patterns observed for PNCy and NUp generally mirrored each other, suggesting that N absorption closely aligns with the concentration of N within the plant. For instance, the mean PNCy for Irrigated.N1 was 53.05 kg N ha−1 while for Rainfed.N0 it was 34.28 kg N ha−1. Similarly, mean NUp for Irrigated.N1 was 53.05 kg N ha−1 and for Rainfed.N0 it was 34.28 kg N ha−1.
Analysis of the NNI showed variation across treatments. The irrigated scenario with the highest dose of N (Irrigated.N2) had a mean NNI of 1.17, indicating N sufficiency or slight excess, while the rainfed scenario with zero dose (Rainfed.N0) showed a lower mean NNI of 0.79, consistent with N deficiency. This indicates that watering and N fertilisation directly influenced the nitrogen status of the plants. Overall, the irrigated scenario with the intermediate dose of N (Irrigated.N1) consistently showed favorable means for most agronomic variables analysed, often outperforming rainfed scenarios with both minimum and maximum nitrogen doses, as comprehensively detailed in Table 9.
3.3.2. Economic Variables
Analysing the economic variables related to the different irrigation treatments and N doses made it possible to identify significant interactions between these factors. Table 11 shows the main results of the post hoc test for the economic variables under study, highlighting the most relevant comparisons and their respective statistical significance values.
Table 11.
Results of the post hoc test with some significance for the economic variables under study.
Table 12 presents the descriptive statistics for key economic variables, categorised by Nt and the interactions between crop type and irrigation scenario and, also, crop type and N treatment.
Table 12.
Descriptive statistics of key economic variables categorised by Nt, interactions of crop type with irrigation scenarios, and interaction of crop type with N treatment.
Regarding FC, the data indicates that FC generally increased with higher nitrogen fertilisation levels. For instance, the mean FC for the N2 treatment was 495.05, higher than that for N0 at 397.03. When considering the interaction of crop type and nitrogen, the mixed crop with N2 (MIX.N2) showed the highest mean FC at 555.16, while ryegrass monoculture with no nitrogen (RG.N0) had the lowest at 329.4.
In terms of UNICP, the N1 treatment showed a lower mean cost of 1.43 per kg of CP, compared to 1.99 for the N2 treatment. Further analysis across specific crop–nitrogen interactions indicates that ryegrass monoculture with the intermediate N1 dose (RG.N1) had the lowest mean UNICP (1.22 EUR kg−1 of CP) when compared to MIX.N0 (1.97 EUR kg−1) and RG.N2 (2.19 EUR kg−1). This suggests a more cost-effective protein production at the intermediate N level, particularly for the ryegrass monoculture.
For the UNIyield, the ryegrass monoculture with the intermediate N1 dose (RG.N1) demonstrated the lowest mean cost at 0.11 EUR kg−1 of forage. This compares favorably to MIX.N0 at 0.16 EUR kg−1 and MIX.N2 at 0.17 EUR kg−1, highlighting the economic efficiency of the RG.N1 management strategy in terms of forage biomass production.
These detailed economic metrics provide a quantitative basis for evaluating the financial implications of different management strategies on forage production.
3.3.3. Profitability Variables
To continue the financial analysis, Table 13 shows the results of the statistical comparisons for the profitability variables NETrev, ROI, and BE. These indicators make it possible to assess the economic viability of the different experimental conditions, highlighting significant differences between the treatments. The p-adjusted values indicate the level of statistical significance of the comparisons made. Each line shows a comparison between different experimental conditions, with the p-adjusted value indicating the statistical significance of the differences observed.
Table 13.
Results of the post hoc test with some significance for the profitability variables under study.
Table 14 presents the descriptive statistics for key profitability variables, categorised by nitrogen treatment, irrigation scenario, and their interactions, providing insights into the economic performance of different management strategies.
Table 14.
Descriptive statistics of key profitability variables categorised by Nt, interactions of irrigation scenario and N treatment, and interactions of crop type and irrigation scenario.
Regarding REVnet, the intermediate N dose (N1) yielded a substantially higher mean REVnet of 233.92 EUR ha−1 compared to N2 (68.92 EUR ha−1). The interaction between irrigation and N fertilisation also significantly influenced REVnet. The Irrigated.N1 scenario showed a mean REVnet of 259.72 EUR ha−1, indicating strong profitability. In contrast, the Rainfed.N2 scenario resulted in a negative mean REVnet of −11.56 EUR ha−1, suggesting economic losses under these conditions.
For ROI, the highest mean ROI was observed in the mixed crop under irrigated conditions (MIX.Irrigated), with a mean of 247.37 EUR ha−1. Ryegrass under irrigated conditions (RG.Irrigated) also showed a positive mean ROI of 87.63 EUR ha−1. Both rainfed scenarios, MIX.Rainfed (78.21 EUR ha−1) and RG.Rainfed (84.57 EUR ha−1), exhibited lower mean ROIs compared to their irrigated counterparts, highlighting the positive economic impact of irrigation.
Analysis of the BE point, which represents the yield required to cover costs, indicates variability across crop and irrigation interactions. MIX.Irrigated had the highest mean BE point (3924.35 EUR ha−1), while RG.Irrigated showed a lower mean BE point (2213.24 EUR ha−1). This suggests that ryegrass under irrigation might require less production to cover its costs compared to the mixed crop under irrigation.
3.4. Variables Synergies
The correlation matrix (Figure 2) shown uses Spearman’s coefficient to assess the relationships between the different variables in the study. The intensity and direction of the correlations are represented by a colour scale, where red tones indicate positive correlations and blue tones indicate negative correlations.
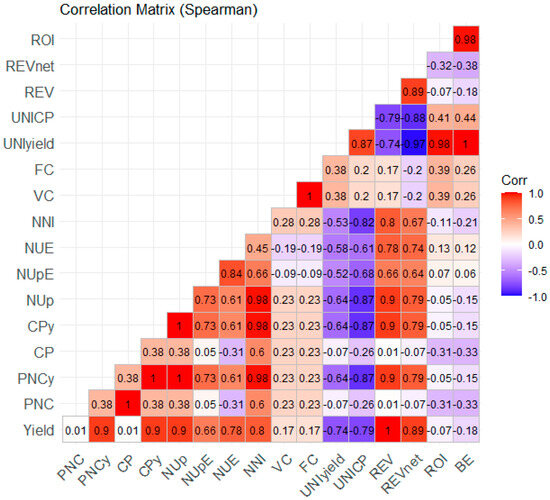
Figure 2.
Correlation matrix of the relationships between different variables under study.
It should be emphasised that there are some very interesting correlations between scientific agronomic variables. There is a very high exposure between PNCy in quantity per unit area and yield (R2 = 0.9), but there is no exposure between PNC in plant content and yield (R2 = 0.01). Productivity also finds very strong correlations with NUp (R2 = 0.9), NUE (R2 = 0.78), and NNI (R2 = 0.8). These values demonstrate the relationship between the productivity and nutritional quality of forages, their capacity and efficiency of N absorption, and consequently their nutritional status. In the case of nutritional status in N, it is also highly correlated with PNCy (R2 = 0.98) and NUp (R2 = 0.98).
Regarding the costs and production components, it is observed that VC and FC have no relationship with the variables studied, while UNIyield and UNICP have a strong positive correlation (0.87), demonstrating that the unit costs of forage follow the unit costs of CP. This reveals the similarity between both in terms of relationships with the other study parameters, although the correlations are always more emphasised in relation to UNICP. For example, while UNIyield shows a weak correlation with NNI (−0.53), UNICP shows a strong negative correlation (−0.82). UNICP still presents good correlations with yield (−0.79), CPy (−0.87), and REVnet (−0.88). The only parameter with which UNIyield presents a superior correlation is with REVnet, where it presents a correlation of −0.97, and with ROI (0.98).
Overall, the splendor matrix reveals that REVnet is strongly influenced by gross revenue per ha (0.89) and by UNIyield (−0.97) and UNICP (−0.88). Higher costs reduced profit, while NUp (0.79) and NUE (0.79) moderately impacted economic performance.
The ROI shows a very high demonstration with UNIyield (0.98) and BE (0.98), showing that an increase in the unit production cost of forage is associated with an increase in the return on investment and consequently an increase in the break-even point of the crop account. BE also exhibits perfect transparency with UNIyield (R2 = 1).
3.5. Sensitivity Analysis
The sensitivity analysis presented in the graphs assesses the impact of the different variables on net profits for the two crops analysed: ryegrass (Figure 3a) and mixed crop (Figure 3b). The graphs show how variations in the variables affect net revenue (EUR), considering different levels of change (−0.2, −0.1, 0.1 and 0.2).
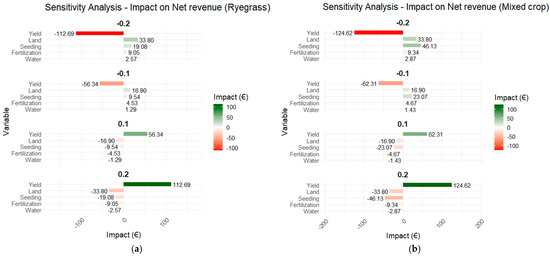
Figure 3.
(a) Sensitivity analysis of ryegrass; (b) Sensitivity analysis of mixed crop.
In the case of ryegrass, it is observed that yield is a variable that has the greatest negative impact, especially for reductions of −0.2 and −0.1, resulting in drops of EUR 112.69 and EUR 56.34 ha−1, respectively. In contrast, increases of 0.1 and 0.2 in productivity generate significant financial gains (56.34 and 112.69 EUR ha−1). The other variables, such as the cost of land, seeds, fertilisers, and water, have smaller impacts, but follow a similar trend: reductions lead to losses and increases result in gains, although to a lesser extent.
For the mixed crop, the pattern is similar, but with a slightly more pronounced impact of the yield variable, where a reduction of −0.2 results in a loss of 124.62 EUR ha−1, while an increase of 0.2 generates a gain of 124.62 EUR ha−1. The impact of the other variables tends to be greater, and the cost of the seed takes on a greater proportion, to the extent that it becomes the second largest influencer.
4. Discussion
4.1. Management’s Impact on Agronomic Variables
Our findings revealed that total CP production per unit area exhibited considerable variation, strongly suggesting that growing conditions significantly influence this critical forage quality parameter. This sensitivity is consistent with observations by other authors, such as Fiorentini et al. [37] and Silva et al. [24], who corroborate the importance of the method used to quantify N content in plants, indicating that expressions like amount per unit area are more reflective of management impacts on overall nutrient accumulation [24,37].
The analysis of N utilisation efficiency parameters, including NUpE and NUE, is critical given that some values even showed negative results, directly implying possible N losses within the system. These losses could occur through various processes such as volatilisation or leaching. Such observations critically reinforce one of the main challenges in N management, consistent with Govindasamy et al. [38], who emphasised the low efficiency of N use in agricultural systems due to significant environmental losses. The substantial variability observed in NUp, NUpE, and especially NUE clearly indicates that effective management strategies are crucial for optimising N assimilation by plants and mitigating environmental impacts [38].
Furthermore, the analysis of the NNI revealed that while plants, on average, achieved optimum N nutrition, the wide range observed across treatments, by the minimum NNI value of 0.5 and the maximum value of 1.4, clearly demonstrated instances of both under- and over-nourished plants. This range clearly demonstrated instances of severe N deficiency (NNI = 0.5), where N supply critically limited growth, to states of N luxury consumption or potential over-fertilisation (NNI = 1.4), where N was in excess of plant demand. Even though plants, on average, achieved optimum N nutrition, the observed variability highlights the significant challenge of achieving uniform and efficient N nutrition across diverse management strategies, particularly for forage crops, which have dynamic N requirements throughout their growth cycle. The occurrence of both N-deficient and N-excess states directly points to specific management regimes resulting in imbalanced N uptake, impacting not only potential yield and forage quality but also resource use efficiency and environmental sustainability through potential N losses. This highlights the challenge of achieving uniform N nutrition and points to specific management regimes leading to imbalanced N uptake. Our study firmly establishes the paramount importance of irrigation as a management factor that significantly influences crop productivity and key N-related agronomic variables. These findings are strongly corroborated by extensive literature emphasising the fundamental role of water in enhancing N use efficiency and overall crop agronomic performance [39,40,41,42]. For instance, Zhu et al. [42] observed that precision irrigation positively impacted yield and N productivity by improving soil moisture distribution and root development, thereby facilitating N absorption. Similarly, Farhadi et al. [39] highlighted the synergistic effect of moderate irrigation and high N doses in maximising biomass yield and irrigation water use efficiency (IWUE) in sorghum, underscoring the vital interaction between these two factors. In water-scarce regions, the impact of reliable water supply on increasing forage production and quality is well-documented [41], reinforcing our observation that consistent water availability is crucial for robust plant growth and efficient N utilisation. Consistent with Kamran et al. [40], who found that intermediate irrigation combined with moderate N doses led to superior yields and resource use in alfalfa, our results collectively confirm that integrated irrigation and N fertilisation strategies, especially at moderate application rates, are fundamental for optimising productivity and key agronomic efficiency indices, including NUp, CPy, and NNI [39,40,41,42].
In practical terms, our findings on N fertilisation indicate a substantial crop response in CP production per unit area when comparing no N application to a high N dose, a response particularly pronounced within the intercropped forage system. This highlights a critical threshold for N fertilisation to achieve the desired protein yields. However, when evaluating NUE, applying the highest N dose was not the most efficient strategy. Instead, the intermediate dose (120 kg ha−1) proved to be significantly more efficient than the maximum dose tested (200 kg ha−1). This aligns with Kamran et al. [40], who also observed that moderate N application (150 kg N ha−1) in combination with moderate irrigation optimised productivity, forage quality, and NUE, often outperforming higher N doses. Therefore, our results strongly advocate for the selection of an intermediate N dose, such as the 120 kg ha−1 used in this study, especially within intercropped systems, to achieve a critical balance between maximising forage production and ensuring sustainable nitrogen use [40].
The observed statistical significance of various interactions among the evaluated factors further underscores the complexity of optimising forage production in semi-arid environments. Specifically, interactions between crop type and N dose, and between irrigation and N fertilisation, revealed important differential responses. For instance, the significant interaction between crop type and N dose for PNC and CP suggests that different forage crops possess distinct responses to varying N application rates, indicating that a “one-size-fits-all” N fertilisation approach is not optimal. Similarly, the relevance of the irrigation × N fertilisation interaction for most variables (except NUpE and NUE) highlights the critical interdependency of water availability and N use by plants. While the triple interaction (crop × irrigation × N) had a more limited, localised influence, these findings collectively emphasise that both irrigation and nitrogen fertilisation, individually and in combination, play a fundamental role in shaping crop productivity and N nutritional status. Critically, these interactions reinforce that optimised management strategies must jointly consider water availability and applied N levels to achieve superior agronomic outcomes and resource efficiency. This is consistent with findings by Kamran et al. [40] and Worqlul et al. [41], who also stressed the necessity of integrated management in similar contexts. The detailed post hoc analysis, which revealed significant pairwise differences (e.g., between N0.MIX and N2.MIX for PNC and CP), was crucial to precisely understand how specific crop systems respond to varying N levels. The statistical significance of these comparisons (e.g., p-adjusted = 0.022 for N0.MIX vs. N2.MIX for PNC and CP) highlights a robust effect of N application within the mixed crop system, providing valuable insights for targeted fertilisation recommendations [40,41].
Overall, our data strongly emphasise that the intricate interactions between crop type, fertiliser dose, and irrigation method are pivotal determinants of forage productivity and nutrient use efficiency in semi-arid regions. Recognising and understanding these interactions is not merely academic; it is essential for developing optimised management strategies that enhance production, minimise resource waste, and ultimately maximise profitability. These findings underscore the imperative to integrate efficient agronomic practices with monitoring and genetic improvement technologies to mitigate environmental impacts associated with inefficient N use, as also advocated by Govindasamy et al. [38].
4.2. Management’s Impact on Economic Variables
The economic performance of forage crops is intrinsically linked to management strategies, particularly fertilisation and irrigation, as evidenced by the detailed analysis of cost and profitability metrics (Table 11 and Table 12).
Our results demonstrate that increasing N fertilisation generally impacts production costs. As shown in Table 11, FC tended to increase with higher nitrogen doses; for instance, the mean FC for N2 (495.05) was higher than for N0 (397.03). This increase in cost with higher N application is consistent with findings by other authors who also highlight associated environmental costs [43,44]. Furthermore, the interaction between crop type and N level also influenced FC, with mixed crops at higher N doses exhibiting higher FC (e.g., MIX.N2 at 555.16) compared to ryegrass monocultures at lower N (e.g., RG.N0 at 329.4).
While forage yield is often valued by quantity per hectare, assessing quality introduces greater price variation. This study reveals that although the unit cost of forage production (UNIyield) showed relatively less variation across managements, the UNICP exhibited more pronounced differences. This implies a fundamental distinction in cost drivers: the cost of producing a kg of forage appears more dependent on the type of crop, whereas the cost of producing a kg of CP is more closely tied to the applied N dose. Consistent with this, UNICP was notably lower for the intermediate N1 treatment (1.43 EUR kg−1 of CP) compared to N2 (1.99 EUR kg−1). Specifically, ryegrass monoculture with the intermediate N1 dose (RG.N1) demonstrated the most cost-effective protein production (1.22 EUR kg−1 of CP) among the Crop_Nt interactions, while the maximum N dose (RG.N2 at 2.19 EUR kg−1) and MIX.N0 (1.97 EUR kg−1) showed higher UNICP.
The UNIyield variable showed notable differences, particularly in interactions involving crop type (Table 11). Irrigated mixed crops were among the most expensive to produce per unit of forage, while irrigated ryegrass was among the cheapest. Dryland mixed crops also had a higher unit forage production cost compared to irrigated ryegrass. This suggests that irrigation and crop choice are strong determinants of forage production efficiency. The ryegrass with the intermediate N dose (RG.N1) consistently emerged as a highly efficient scenario, being relatively cheaper to manage per unit of forage (UNIyield) and also achieving a lower cost per unit of CP. However, increasing the N dose to the maximum (N2) in ryegrass led to a substantial increase in UNICP. This emphasises that variations in N application and crops directly influence production costs, underscoring the importance of optimised management for cost efficiency and profitability. This aligns with findings by Leal et al. [45] that different forage crops inherently impact production systems differently [45].
4.3. Management’s Impact on Profitability Variables
Analysing the profitability metrics (Table 13) further elucidates these management impacts. REVnet exhibited strong responsiveness to irrigation and nitrogen fertilisation. The Irrigated.N1 scenario consistently yielded the highest REVnet (mean 259.72), indicating its superior economic viability. Conversely, the Rainfed.N2 scenario resulted in a negative mean REVnet (−11.56), highlighting the economic risks associated with high N application under rainfed conditions. Similarly, the ROI was highest for irrigated mixed crops (mean 247.37), further affirming the profitability benefits of irrigation. BE analysis also revealed that while irrigated mixed crops had a higher BE point (3924.35), irrigated ryegrass had a lower BE point (2213.24), implying it requires less yield to cover costs under irrigation. These trends in REVnet, ROI, and BE closely follow those observed for the agronomic variables, indicating that total revenue per hectare is primarily driven by efficient irrigation and fertilisation management strategies.
REVnet’s mean and median show that the net profit margin per ha is around EUR 148.3, but it varies widely (CV = 115.7%), ranging from a negative income (expense) of -EUR 223.6 ha−1 to a maximum of EUR 471.7 ha−1. These results show the impact of management decisions on crop profitability. Similarly, the ROI shows very large variations (CV = 111.7%), suggesting that some strategies were considerably more profitable than others. Some even represented an ROI of 424.6 EUR ha−1, but others showed a negative ROI of −167.9 EUR ha−1. To complement these indicators, BE indicates that the average break-even point of the scenarios analysed is around 2600 kg ha−1 but can reach a maximum of 7003.4 kg ha−1. This large possible variation in the data is easily seen in the CV, which shows a value of 72.6%.
In the case of REVnet, the results presented in Table 2 show that although the net margin of the crop account of the strategies analysed had the irrigation factor as significant, it was the Nt factor that was the most significant in isolation. The irrigation x Nt interaction was also highly significant. For example, there is a statistically significant difference between the N1 and N2 treatments (P.adj = 0.041), as well as between an irrigated system with N1 fertilisation and a rainfed system with N2 fertilisation (P.adj = 0.033). In other words, the intermediate dose of fertilisation made it possible to achieve the highest net revenue, especially in the case of irrigated crops.
In the case of ROI, the results suggest that both the crop and the irrigation regime and the interactions between them significantly affect profitability. Comparisons between irrigated systems of both crops show relevant differences (P.adj = 0.045), as well as the distinctions between irrigated and rainfed intercropping systems (P.adj = 0.038) and between rainfed ryegrass, which presents the lowest ROI value, and irrigated intercropping (P.adj = 0.028). Finally, in the case of breaking even (BE), there is a significant difference between intercropping and ryegrass under irrigated conditions (P.adj = 0.019) but also between irrigated intercropping and rainfed ryegrass (P.adj = 0.072).
In general, the median REVnet increases as the fertilisation level increases, with treatment N1 (moderate fertilisation) presenting the best average results. However, data variability also increases, especially at level N2 (highest fertilisation), indicating that the ROI is more uncertain in this scenario.
The interaction between fertilisation and the crop also suggests important differences. In the mixed crop system, REVnet values are generally higher than in the ryegrass system. In particular, the MIX_N1 treatment presents the highest median net revenue, suggesting that this is a more economically viable management. On the other hand, treatments with N2 present greater dispersion, indicating that although they result in higher revenues in some cases, they also present greater economic risk. Additionally, the annotation “ns” (not significant) in one of the graphs suggests that some differences between treatments are not statistically relevant. This reinforces the need to consider not only the mean values, but also the variability of results when making decisions about agricultural management. These results are in line with what some authors claim. Considering that variability in agricultural management decisions is essential for optimising crop yields and resource use efficiency [46,47], technological advancements in precision agriculture and data-driven decision-making support this approach by providing tools to manage spatial and temporal variability effectively [48]. Adapting management practices to account for variability can mitigate risks and enhance the sustainability of agricultural systems [49].
The results indicate that fertilisation has a positive effect on net revenue, especially at moderate application levels (N1). Among the systems evaluated, irrigated mixed crop presented the highest ROI, showing that, despite the higher costs associated with seed and irrigation, the economic return justifies the investment, configuring it as the most advantageous option from a financial point of view. On the other hand, ryegrass systems, both irrigated and rainfed, presented lower ROIs and less variability, suggesting a more limited profitability, although with greater stability. The rainfed intercropping demonstrated a higher ROI than the ryegrass systems but still below the irrigated intercropping, indicating that the absence of irrigation compromises part of the potential return. These data reinforce the central role of irrigation in maximising economic returns, especially in the context of intercropping systems. However, the decision on the production system to be adopted must consider not only the ROI but also the sustainability of costs and the predictability of results over time.
BE analysis reinforces this complexity. The irrigated intercropping system has the highest BE among treatments, reflecting the need for substantial revenue to cover total costs, mainly due to investment in food security. In contrast, irrigated and rainfed ryegrass systems record the lowest breakeven points, which indicates reduced costs, variations, and therefore lower financial risk. Rainfed mixed crop occupies a position with lower total costs compared to the irrigated version but is still relevant due to the cost of seeds.
In summary, ryegrass systems present lower financial risk, as they need lower revenues to cover their costs, while the mixed crop irrigated system, despite having a higher break-even point, can be more profitable if production meets or exceeds these limits.
4.4. Variables Synergies
Refs. [50,51,52,53], optimising agricultural management necessitates a comprehensive understanding of the complex interdependencies among agronomic, economic, and environmental variables. Such synergistic relationships are pivotal for enhancing crop productivity and ensuring sustainable profitability. It is widely acknowledged that escalating production costs in agricultural systems can significantly diminish overall profitability [50]. This challenge is frequently exacerbated by volatile input prices, including those for seeds and fertilisers, which directly influence operational financial outcomes.
Furthermore, critical plant physiological indicators such as NUp and NUE are fundamental to achieving a balance between robust crop productivity, favourable economic returns, and environmental sustainability [51]. Empirical evidence consistently demonstrates a strong positive correlation between heightened agricultural productivity and increased net revenue [52], suggesting that advancements in productivity can concurrently boost profitability and contribute to reduced environmental impact. The strategic adoption of advanced agricultural technologies and practices, including precision agriculture and genetic interventions, has been shown to further amplify both productivity and profitability [53].
To elucidate these intricate relationships and their implications within our forage production system, we conducted a comprehensive correlation analysis, presented in Figure 2, which quantifies the intensity and direction of these observed synergies using Spearman’s coefficient.
Several key correlations were observed. A very strong positive relationship was found between plant nitrogen content per unit area (PNCy) and yield (R2 = 0.9), indicating that higher N accumulation in the biomass directly translates to increased forage production. Conversely, PNC in total plant dry mass showed virtually no correlation with yield (R2 = 0.01), emphasising that the quantity of N accumulated per unit area, rather than its percentage concentration, primarily drives productivity. Furthermore, forage productivity exhibited very strong correlations with NUp (R2 = 0.9), NUE (R2 = 0.78), and NNI (R2 = 0.8). These findings underscore the critical role of the crop’s capacity and efficiency in N absorption and its nutritional status in determining overall productivity and the nutritional quality of forages. The strong correlation of NNI with both PNCy (R2 = 0.98) and NUp (R2 = 0.98) further reinforces NNI’s utility as a robust indicator of the plant’s N status, directly impacting its ability to contribute to yield and nutrient cycling. The importance of NUp and NUE for balancing crop productivity, economic return, and environmental sustainability is thus corroborated [51].
Analysing the relationships between the cost and production components revealed distinct patterns. Interestingly, VC and FC showed no notable correlation with the other variables studied. However, the unit costs of production, UNIyield (cost per kg of forage) and UNICP (cost per kg of crude protein) exhibited a strong positive correlation (0.87). This suggests that an increase in the cost of producing a kg of forage is generally accompanied by an increase in the cost of producing a kg of protein, highlighting the similarity in their underlying cost drivers. However, correlations were consistently more pronounced for UNICP, implying a greater sensitivity to other parameters. For instance, while UNIyield showed a weak negative correlation with NNI (−0.53), UNICP displayed a strong negative correlation (−0.82) with NNI. This indicates that better N nutritional status (higher NNI) is more strongly associated with a reduction in the unit cost of protein. Moreover, UNICP exhibited notable negative correlations with yield (−0.79), CPy (−0.87), and REVnet (−0.88), reinforcing the principle that higher unit production costs negatively impact overall profitability [50].
Overall, the synergy matrix clearly demonstrates that REVnet is profoundly influenced by its strong positive correlation with gross revenue per hectare (0.89) and strong negative correlations with unit costs, specifically UNIyield (−0.97) and UNICP (−0.88). This highlights that controlling unit production costs is paramount for maximising net revenue. While NUp and NUE moderately impacted economic performance (a 0.79 correlation with REVnet), their fundamental link to productivity makes them indirectly vital for economic returns. Consistent with this, the ROI exhibited a very high positive correlation with UNIyield (0.98) and the BE point (0.98). This implies that in the context of forage production, an increase in the unit production cost of forage (UNIyield) is associated with an increase in both the return on investment and the break-even point. This positive relationship between ROI and unit costs may suggest that higher investment in management practices, while increasing unit costs, leads to a proportionally greater increase in revenue or product value, thereby boosting ROI. The perfect correlation (R2 = 1) between BE and UNIyield further solidifies this direct relationship, indicating that higher unit production costs necessitate a higher yield to achieve profitability. These findings reinforce that higher agricultural productivity is strongly correlated with higher REVnet [52] and that advanced agricultural technologies and practices, including optimised nutrient management, can further amplify both productivity and profitability.
4.5. Sensibility Analysis
The analysis unequivocally demonstrates that yield is the most sensitive and determining variable for net profit for both ryegrass and mixed crop systems. This indicates that even minor variations in forage yield can substantially alter the financial performance of these crops. This pronounced impact of yield on net profit is primarily attributable to the prevailing market mechanism, where the final product is remunerated on a per-kilogram basis (EUR kg−1). Conversely, other input variables such as land, seeds, fertilisers, and water, while integral to the production system, exerted a comparatively smaller but still relevant influence on the overall cost and revenue composition. It is pertinent to consider that if the market valuation of forage were to shift towards quality-based pricing rather than solely quantity, the relative sensitivities of these variables could significantly change. Therefore, future studies should analyse the influence of market-driven quality-based pricing on the economic sensitivities of forage production systems [54,55,56,57,58,59].
4.6. Practical Implications
The results of this study provide valuable information for decision-making in agricultural management, especially about fertilisation, integrity, and choice of production system. The joint analysis of agronomic and economic aspects demonstrated that the interaction between these factors significantly influences productivity and profitability, highlighting essential points for the optimisation of agricultural practices.
4.6.1. Fertilisation Strategies to Maximise Profitability
The data suggest that N fertilisation has a positive effect on yield and economic returns, especially at moderate levels (N1). However, high levels of fertilisation (N2) presented greater variability in returns, reducing greater economic risk without guaranteeing higher levels of productivity or net profit margin. Therefore, producers must consider strategies that balance maximising productivity with financial stability, avoiding excessive nitrogen applications that may compromise the ROI.
4.6.2. Importance of Irrigation in Profitability
The results showed that supervision has a significant impact on productivity and ROI, becoming an essential factor for consolidated production systems. Although the costs of supervision are high, the financial return justifies the investment, especially when combined with optimised fertilisation practices and responsive crops. However, producers operating in regions with water restrictions should carefully evaluate the cost–benefit of monitoring and may consider efficient water management systems to reduce waste and maximise the use of available resources.
4.6.3. Comparison Between Mixed and Individual Fodder Crops
Irrigated mixed crops presented the best financial indicators, while extreme systems presented lower risk due to reduced costs. The choice between the two must consider not only potential profit but also the stability of returns, environmental risks, and long-term forecasts. Diversification, combined with knowledge of local soil and climate conditions, can promote greater productivity and economic resilience.
4.6.4. Role of Yield as a Key Indicator
Yield stands out as the main variable determining profitability. In this context, precision agriculture emerges as a strategic tool to monitor the spatial variability of plots and improve the management of a specific site. Through technologies such as sensors, GPS mapping, and georeferenced analyses, it is possible to know, in detail, the productive, economic, and profitability parameters at each point on the plot. This approach allows inputs to be applied in a differentiated way, maximising economic returns in more productive areas and reducing losses in less responsive areas.
4.6.5. Results Application to Optimise Agricultural Management
The results of this study can be used to develop predictive models that help farmers make decisions. By considering variables such as total cost, fertilisation, guidance, and ROI, it is possible to create guidelines to optimise investments and minimise risks. Furthermore, the observation matrix highlights the importance of monitoring variables such as unit cost and NUE, allowing more precise adjustments in management strategies.
4.7. Modelling N Fertilisation of Fodder Crops Based on Agronomic, Economic, and Profitability Variables
Optimising N fertilisation in forage production systems is a complex challenge, conventionally approached through agronomic models focused on maximising yield or NUE. However, a holistic decision-making framework for sustainable agriculture necessitates integrating economic and profitability considerations. Based on our study’s findings, the critical variables to consider for developing comprehensive N fertilisation models in forage systems emphasise the indispensable role of economic and profitability metrics alongside agronomic parameters.
What are the best variables to consider for creating an N fertilisation model in forage systems?
Our correlation analysis (Figure 2) reveals that yield, PNCy, NUp, NUE, and NNI are fundamental agronomic variables for predicting forage system response to N fertilisation. The strong positive correlations observed between yield and NUp (R2 = 0.9), NUE (R2 = 0.78), and NNI (R2 = 0.8), as well as between NNI and PNCy (R2 = 0.98) and NUp (R2 = 0.98), confirm their direct relevance to biomass accumulation and nutrient status. Furthermore, the sensitivity analysis (Section 3.5) unequivocally identified yield as the most critical variable impacting net profit, further emphasising the need to model its economic outcome. Therefore, any robust N fertilisation model must accurately account for these interactions to predict the agronomic benefits of N application.
Are economic and profitability variables important in modelling N fertilisation, rather than solely agronomic variables?
Our results strongly argue that economic and profitability variables are not merely important but indispensable for robust N fertilisation models. Agronomic models primarily optimise for biological outcomes (e.g., maximising yield or NUE), but farmers’ decisions are fundamentally driven by financial viability and sustainability. As highlighted in Section 3.3.2., high N fertilisation levels (N2) can present greater economic risk despite potential yield benefits, demonstrating that agronomic optima do not always align with economic optima.
Crucially, our study highlights that purely agronomic models, while valuable, may not fully capture the economic realities faced by farmers. The integration of economic and profitability variables is paramount. Our findings demonstrate strong negative correlations between unit production costs (UNIyield: −0.97 with REVnet; UNICP: −0.88 with REVnet) and overall profitability. This underscores that decisions on N application, which directly influence these unit costs, are ultimately economic decisions. For instance, the intermediate N1 dose, while potentially not achieving absolute maximum yield in all scenarios, consistently emerged as highly cost-effective in terms of UNICP and UNIyield (Table 12), leading to superior REVnet (Table 14). This suggests that a model solely optimising for agronomic maxima might overlook scenarios that are more financially optimal.
The significant positive correlations of ROI with UNIyield (0.98) and BE point (0.98), and the perfect correlation of BE with UNIyield (R2 = 1) further reinforce the direct link between unit production costs and profitability indicators. While the positive relationship between ROI and unit costs may seem counter-intuitive, it implies that certain N management strategies, while increasing the cost per unit of product, may lead to a proportionally greater increase in product value or revenue, thereby enhancing overall return on investment. This complex interplay necessitates that models move beyond simple input–output yield functions.
A model that does not incorporate costs, revenues, and profitability metrics (in this case, REVnet, ROI, and BE) provides only a partial picture and risks generating recommendations that are biologically sound but economically unviable or sub-optimal for the farmer. By integrating these financial dimensions, N fertilisation models can provide more realistic and sustainable decision-support tools for farmers, guiding them towards practices that balance high productivity with optimised financial returns, ultimately contributing to the resilience of agricultural systems.
What variables do we have to measure to create such models?
To develop effective and comprehensive N fertilisation models, key measurements should extend beyond traditional agronomic parameters. Essential data inputs for such models include the following variables presented in Table 15.
Table 15.
Key variables for integrated N fertilisation models in forage systems.
5. Conclusions
This study successfully integrated agronomic and economic analyses to provide a comprehensive framework for optimising forage production strategies. Our findings unequivocally demonstrate that mixed fodder crops with legumes, particularly when implemented in irrigated systems and with moderate N fertilisation doses (N1), represent a highly efficient approach. These strategies consistently promoted significant gains in productivity (e.g., yielding over 3980 kg ha−1 forage and 690 kg ha−1 crude protein for irrigated mixed crops at N1), enhanced forage quality, and improved NUE (e.g., achieving NUE around 0.54), confirming the substantial potential of legumes to enhance the performance of forage systems, especially within challenging Mediterranean edaphoclimatic environments.
From an economic perspective, the analysis clearly established yield as the most decisive factor for profitability, with a strong positive correlation (R2 = 0.89) between productivity and net revenue. Irrigated mixed crop systems, particularly with moderate N, exhibited the best financial performance, evidenced by the highest mean net revenue margin (REVnet) of approximately 260 EUR ha−1 and ROI of over 247. In contrast, scenarios like rainfed crops with high N fertilisation resulted in significantly lower, or even negative, REVnet (around −12 EUR ha−1). The study also highlighted the importance of balancing potential returns with stability and risk; while ryegrass monoculture systems might offer less overall profitability, they provided greater predictability of results and often achieved lower unit costs (e.g., UNIyield as low as 0.11 EUR kg−1 forage for ryegrass at N1). This emphasises that defining the most appropriate management practices requires a careful equilibrium between investment, expected return, and inherent variability within each specific production context.
Crucially, this research identifies key agronomic, economic, and profitability variables essential for developing more sophisticated integrated N fertilisation models for forage systems. By moving beyond traditional agronomic optima to incorporate unit costs, net revenue, return on investment, and break-even points, future models can offer more realistic and economically viable decision-support tools.
In summary, the data obtained from this study are instrumental in informing on-the-ground decision-making, charting a course towards more sustainable, profitable, and resilient agricultural practices. Aligning crop choice, irrigation regime, and optimal fertilisation doses with local environmental conditions and specific production objectives will maximise not only economic results but also the overall efficiency and long-term sustainability of agricultural systems.
Author Contributions
Conceptualisation, L.S., S.B., F.C.L., B.M., S.F., M.S., J.S., P.D., C.F., F.C., P.F. and L.A.C.; methodology, L.S., S.B. and L.A.C.; software, L.S. and S.B.; validation, L.S., S.B. and L.A.C.; formal analysis, L.S., S.B., M.S., C.F. and P.F.; investigation, L.S.; resources, F.C.L., B.M., S.F., J.S., P.D., F.C. and L.A.C.; data curation, L.S., S.B., M.S., C.F. and P.F.; writing—original draft preparation, L.S.; writing—review and editing, L.S., S.B., F.C.L., B.M., S.F., M.S., J.S., P.D., C.F., F.C., P.F. and L.A.C.; visualisation, L.S., S.B., F.C.L., B.M., S.F., M.S., J.S., P.D., C.F., F.C., P.F. and L.A.C.; supervision, F.C.L., B.M., S.F., J.S., P.D., F.C. and L.A.C.; project administration, L.A.C.; funding acquisition, F.C.L., B.M., S.F., J.S., P.D., F.C. and L.A.C. All authors have read and agreed to the published version of the manuscript.
Funding
The APC was funded by national funds through the Fundação para a Ciência e a Tecnologia, I.P. (Portuguese Foundation for Science and Technology) by the project UIDB/05064/2020 (VALORIZA—Research Centre for Endogenous Resource Valorization), by national funds from Fundação para a Ciência e a Tecnologia (FCT), Portugal, through the research unit UIDP/04035/2020 (GeoBioTec), and by National Funds through the FCT—Foundation for Science and Technology under the Project UIDB/05183.
Data Availability Statement
The original contributions presented in the study are included in the article; further inquiries can be directed to the corresponding authors.
Acknowledgments
This study was conducted as part of Luís Silva’s PhD thesis on Agroindustrial Technologies. The authors would like to thank the National Institute for Agricultural and Veterinary Research (INIAV) for providing the experimental field and the crops installed under the GEEBovMit Project—LA 3.3-PRR-C05-i03-I-000027-LA3.3—Mitigation of GHG emissions in beef cattle production—pastures, forages and natural additives. The authors would also like to thank the GeoBioTec, VALORIZA research centres, and to MED (https://doi.org/10.54499/UIDB/05183/2020; https://doi.org/10.54499/UIDP/05183/2020) and CHANGE (https://doi.org/10.54499/LA/P/0121/2020).
Conflicts of Interest
The authors declare no conflicts of interest. The funders had no role in the design of the study; in the collection, analyses, or interpretation of data; in the writing of the manuscript; or in the decision to publish the results.
Abbreviations
The following abbreviations are used in this manuscript:
| N | Nitrogen |
| NUE | Nitrogen use efficiency |
| WUE | Water use efficiency |
| UAV | Unmanned aircraft vehicle |
| E | Environment |
| M | Management |
| PDM | Plant dry matter |
| PNC | Plant nitrogen content |
| INIAV | National Institute for Agricultural and Veterinary Research |
| RG | Annual ryegrass |
| MIX | Grass–legume mixed crop |
| PNCy | Plant nitrogen content by unit of area |
| CP | Crude protein |
| CPy | Crude protein by unit of area |
| NUp | Nitrogen uptake |
| NUpE | Use efficiency of fertilised nitrogen |
| NNI | Nitrogen nutrition index |
| FC | Fixed cost |
| VC | Variable cost |
| UNIyield | Production cost per unit of forage |
| UNICP | Production cost per unit of crude protein |
| REV | Revenue |
| REVnet | Net revenue margin |
| ROI | Return on investment |
| BE | Break even |
| SD | Standard deviation |
| CV | Coefficient of variation |
| Nt | Nitrogen treatment |
| IWUE | Irrigation water use efficiency |
References
- Council of the European Union. Council Directive 91/676/EEC of 12 December 1991 Concerning the Protection of Waters against Pollution Caused by Nitrates from Agricultural Sources. 1991. Available online: http://data.europa.eu/eli/dir/1991/676/oj (accessed on 1 March 2025).
- Wang, Y.; Zhang, Y.; Zhang, H.; Yang, Z.; Zhu, Q.; Yan, B.; Fei, J.; Rong, X.; Peng, J.; Luo, G. Intercropping-Driven Nitrogen Trade-off Enhances Maize Productivity in a Long-Term Experiment. Field Crops Res. 2022, 287, 108671. [Google Scholar] [CrossRef]
- Iqbal, M.A.; Hamid, A.; Ahmad, T.; Siddiqui, M.H.; Hussain, I.; Ali, S.; Ali, A.; Ahmad, Z. Forage Sorghum-Legumes Intercropping: Effect on Growth, Yields, Nutritional Quality and Economic Returns. Bragantia 2019, 78, 82–95. [Google Scholar] [CrossRef]
- Ginwal, D.S.; Kumar, R.; Ram, H.; Dutta, S.; Arjun, M.; Hindoriya, P.S. Fodder Productivity and Profitability of Different Maize and Legume Intercropping Systems. Indian J. Agric. Sci. 2019, 89, 1451–1455. [Google Scholar] [CrossRef]
- Li, X.-F.; Wang, P.; Tian, X.-L.; Dong, N.; Li, L. Complementarity for Nitrogen Use in Maize/Faba Bean Intercropping with Inoculation. Plant Soil 2024, 506, 343–357. [Google Scholar] [CrossRef]
- Marcos-Pérez, M.; Sánchez-Navarro, V.; Zornoza, R. Intercropping Systems between Broccoli and Fava Bean Can Enhance Overall Crop Production and Improve Soil Fertility. Sci. Hortic. 2023, 312, 111834. [Google Scholar] [CrossRef]
- Shen, X.; Liu, Y.; Li, X.; Li, L. Effect of Intercropping with Legumes at Different Rates on the Yield and Soil Physicochemical Properties of Cyperus esculentus L. in Arid Land. Front. Plant Sci. 2024, 15, 1351843. [Google Scholar] [CrossRef]
- Lal, B.; Sarkar, S.; Kumawat, P.K.; Gautam, P.; Meena, R.L.; Sharma, S.C.; Sahoo, A. Enhancement in Fodder Productivity and Quality of Feather Pennisetum Grass by Intercropping with Groundnut. J. Plant Nutr. 2024, 47, 2339–2359. [Google Scholar] [CrossRef]
- Saleem, A.; Malik, A.M.; Hassan, N.U.; Qamar, I.A. Effect of Common Vetch (Vicia sativa L.) Legume on Growth and Yield of Rye Grass (Lolium multiflorium L.). Pak. J. Agric. Res. 2019, 32, 675–683. [Google Scholar] [CrossRef]
- Luo, C.L.; Duan, H.X.; Wang, Y.L.; Liu, H.J.; Xu, S.X. Complementarity and Competitive Trade-Offs Enhance Forage Productivity, Nutritive Balance, Land and Water Use, and Economics in Legume-Grass Intercropping. Field Crops Res. 2024, 319, 109642. [Google Scholar] [CrossRef]
- Zhang, H.; Shi, W.; Ali, S.; Chang, S.; Jia, Q.; Hou, F. Legume/Maize Intercropping and N Application for Improved Yield, Quality, Water and N Utilization for Forage Production. Agronomy 2022, 12, 1777. [Google Scholar] [CrossRef]
- Raza, M.A.; Zhiqi, W.; Yasin, H.S.; Gul, H.; Qin, R.; Rehman, S.U.; Mahmood, A.; Iqbal, Z.; Ahmed, Z.; Luo, S.; et al. Effect of Crop Combination on Yield Performance, Nutrient Uptake, and Land Use Advantage of Cereal/Legume Intercropping Systems. Field Crops Res. 2023, 304, 109144. [Google Scholar] [CrossRef]
- Renjith, P.S.; Radhakrishnan, S.K.; Patel, A. Grass-Legume Intercropping for Enhancing Quality Fodder Production in Drylands; Springer Nature: Singapore, 2023; ISBN 9789811991592. [Google Scholar]
- Lithourgidis, A.S.; Dordas, C.A.; Damalas, C.A.; Vlachostergios, D.N. Annual Intercrops: An Alternative Pathway for Sustainable Agriculture. Aust. J. Crop Sci. 2011, 5, 396–410. [Google Scholar]
- Ghosh, P.K. Growth, Yield, Competition and Economics of Groundnut/Cereal Fodder Intercropping Systems in the Semi-Arid Tropics of India. Field Crops Res. 2004, 88, 227–237. [Google Scholar] [CrossRef]
- Mead, R.; Willey, R.W. The Concept of a ‘Land Equivalent Ratio’ and Advantages in Yields from Intercropping. Exp. Agric. 1980, 16, 217–228. [Google Scholar] [CrossRef]
- Midega, C.A.O.; Salifu, D.; Bruce, T.J.; Pittchar, J.; Pickett, J.A.; Khan, Z.R. Cumulative Effects and Economic Benefits of Intercropping Maize with Food Legumes on Striga Hermonthica Infestation. Field Crops Res. 2014, 155, 144–152. [Google Scholar] [CrossRef]
- Canales, F.J.; Montilla-Bascón, G.; Gallego-Sánchez, L.M.; Flores, F.; Rispail, N.; Prats, E. Deciphering Main Climate and Edaphic Components Driving Oat Adaptation to Mediterranean Environments. Front. Plant Sci. 2021, 12, 780562. [Google Scholar] [CrossRef] [PubMed]
- Tsivelikas, A.L.; Ben Ghanem, H.; El-Baouchi, A.; Kehel, Z. Single-Plant Selection at Ultra-Low Density Enhances Buffering Capacity of Barley Varieties and Landraces to Unpredictable Environments and Improves Their Agronomic Performance. Front. Plant Sci. 2022, 13, 838536. [Google Scholar] [CrossRef]
- Rossini, A.; Ruggeri, R.; Belocchi, A.; Rossini, F. Response of Durum Wheat Cultivars to Climate Change in a Mediterranean Environment: Trends of Weather and Crop Variables at the Turn of 21st Century. J. Agron. Crop Sci. 2024, 210, e12786. [Google Scholar] [CrossRef]
- Jacobsen, S.-E.; Jensen, C.R.; Liu, F. Improving Crop Production in the Arid Mediterranean Climate. Field Crops Res. 2012, 128, 34–47. [Google Scholar] [CrossRef]
- Ruiz-Ramos, M.; Ferrise, R.; Rodríguez, A.; Lorite, I.J.; Bindi, M.; Carter, T.R.; Fronzek, S.; Palosuo, T.; Pirttioja, N.; Baranowski, P.; et al. Adaptation Response Surfaces for Managing Wheat under Perturbed Climate and CO2 in a Mediterranean Environment. Agric. Syst. 2018, 159, 260–274. [Google Scholar] [CrossRef]
- Sillero-Medina, J.A.; González-Pérez, J.; Hueso-González, P.; González-Fernández, J.J.; Hormaza-Urroz, J.I.; Ruiz-Sinoga, J.D. Effect of Different Deficit Irrigation Regimens on Soil Moisture, Production Parameters of Mango (Mangifera indica L.), and Spectral Vegetation Indices in the Mediterranean Region of Southern Spain. Remote Sens. Appl. 2025, 37, 101415. [Google Scholar] [CrossRef]
- Silva, L.; Barbosa, S.; Lidon, F.C.; Santos-Silva, J.; Conceição, L.A. Measuring the Influence of Key Management Decisions on the Nitrogen Nutritional Status of Annual Ryegrass-Based Forage Crops. Agronomy 2024, 14, 1817. [Google Scholar] [CrossRef]
- Kjeldahl, J. Neue Methode Zur Bestimmung Des Stickstoffs in Organischen Körpern. Fresenius’ Z. Für Anal. Chem. 1883, 22, 366–382. [Google Scholar] [CrossRef]
- Cardoso, J. A Classificação de Solos de Portugal. Boletim de Solos do SROA 1974, 17, 14–46. [Google Scholar]
- Köppen, W. Versuch Einer Klassifikation Der Klimate, Vorzugsweise Nach Ihren Beziehungen Zur Pflanzenwelt. Geogr. Z. 1900, 6, 593–611. Available online: http://www.jstor.org/stable/27803924 (accessed on 25 February 2025).
- Instituto de Meteorologia, I.P. Ministério Da Ciência, Tecnologia e Ensino Superior, Lisboa. 2009.
- Oral, E. Effect of Nitrogen Fertilization Levels on Grain Yield and Yield Components in Triticale Based on AMMI and GGE Biplot Analysis. Appl. Ecol. Environ. Res. 2018, 16, 4865–4878. [Google Scholar] [CrossRef]
- Perez, C.M.; Juliano, B.O.; Liboon, S.P.; Alcantara, J.M.; Cassman, K.G. Effects of Late Nitrogen Fertilizer Application on Head Rice Yield, Protein Content, and Grain Quality of Rice. Cereal Chem. 1996, 73, 556–560. [Google Scholar]
- Ryan-Salter, T.P.; Black, A.D. Yield of Italian Ryegrass Mixed with Red Clover and Balansa Clover. Proc. N. Z. Grassl. Assoc. 2012, 74, 201–207. [Google Scholar] [CrossRef]
- Eurostat, the statistical office of the E.U. Agricultural Land Renting Prices for One Year by Region; Eurostat, the statistical office of the E.U.: Luxembourg, 2025. [Google Scholar]
- EDIA. Anuário Agricola de Alqueva 2024; Direção de Economia da Água e Promoção do Regadio—Departamento de Planeamento e Economia da Água: Beja, Portugal, 2025. [Google Scholar]
- R Core Team. R: A Language and Environment for Statistical Computing; R Foundation for Statistical Computing: Vienna, Austria, 2023. [Google Scholar]
- William, R. Package Psych, 2.4.12; CRAN: Boston, MA, USA, 2024. [Google Scholar] [CrossRef]
- Alexis, D. Package Dunn.Test, 1.3.5; CRAN: Boston, MA, USA, 2024. [Google Scholar] [CrossRef]
- Fiorentini, M.; Zenobi, S.; Orsini, R. Remote and Proximal Sensing Applications for Durum Wheat Nutritional Status Detection in Mediterranean Area. Agriculture 2021, 11, 39. [Google Scholar] [CrossRef]
- Govindasamy, P.; Muthusamy, S.K.; Bagavathiannan, M.; Mowrer, J.; Jagannadham, P.T.K.; Maity, A.; Halli, H.M.; Sujayananad, G.K.; Vadivel, R.; Das, T.K.; et al. Nitrogen Use Efficiency—A Key to Enhance Crop Productivity under a Changing Climate. Front. Plant Sci. 2023, 14, 1121073. [Google Scholar] [CrossRef]
- Farhadi, A.; Paknejad, F.; Golzardi, F.; Ilkaee, M.N.; Aghayari, F. Effects of Limited Irrigation and Nitrogen Rate on the Herbage Yield, Water Productivity, and Nutritive Value of Sorghum Silage. Commun. Soil. Sci. Plant Anal. 2022, 53, 576–589. [Google Scholar] [CrossRef]
- Kamran, M.; Yan, Z.; Jia, Q.; Chang, S.; Ahmad, I.; Ghani, M.U.; Hou, F. Irrigation and Nitrogen Fertilization Influence on Alfalfa Yield, Nutritive Value, and Resource Use Efficiency in an Arid Environment. Field Crops Res. 2022, 284, 108587. [Google Scholar] [CrossRef]
- Worqlul, A.W.; Dile, Y.T.; Schmitter, P.; Bezabih, M.; Adie, A.; Bizimana, J.-C.; Srinivasan, R.; Lefore, N.; Clarke, N. Constraints of Small-Scale Irrigated Fodder Production and Nutrition Assessment for Livestock Feed, a Case Study in Ethiopia. Agric. Water Manag. 2021, 254, 106973. [Google Scholar] [CrossRef]
- Zhu, Y.; Zhang, H.; Li, R.; Zhu, W.; Kang, Y. Precision Irrigation Scheme Enhances Oat and Alfalfa Seed Yield as Well as Water and Nitrogen Use Efficiency by Regulating Nitrogen Levels and Root Distribution: Field Evidence from Hulunbuir. Irrig. Sci. 2025, 43, 285–303. [Google Scholar] [CrossRef]
- Yang, Q.; Ma, J.; Yang, F.; Zheng, H.; Lu, Z.; Qiao, F.; Zhang, K.; Gong, H.; Men, X.; Li, J.; et al. The Hidden Indirect Environmental Effect Undercuts the Contribution of Crop Nitrogen Fertilizer Application to the Net Ecosystem Economic Benefit. J. Clean. Prod. 2023, 426, 139204. [Google Scholar] [CrossRef]
- Li, X.; Noor, H.; Noor, F.; Ding, P.; Sun, M.; Gao, Z. Effect of Soil Water and Nutrient Uptake on Nitrogen Use Efficiency, and Yield of Winter Wheat. Agronomy 2024, 14, 819. [Google Scholar] [CrossRef]
- Leal, V.N.; Santos, D.D.C.; Paim, T.D.P.; Santos, L.P.D.; Alves, E.M.; Claudio, F.L.; Calgaro Junior, G.; Fernandes, P.B.; Salviano, P.A.P. Economic Results of Forage Species Choice in Crop–Livestock Integrated Systems. Agriculture 2023, 13, 637. [Google Scholar] [CrossRef]
- Joshi, K.; Lachaud, M.A.; Solís, D.; Alvarez, S. Impacts of Climatic Variability on Agricultural Total Factor Productivity Growth in the Southern United States. Environments 2022, 9, 129. [Google Scholar] [CrossRef]
- de Assis Silva, S.; de Souza Lima, J.S.; Santos, N.T. Spatial and Temporal Variability Analysis; Springer International Publishing: Cham, Switzerland, 2022; ISBN 9783031145339. [Google Scholar]
- Hegedus, P.B.; Maxwell, B.D.; Mieno, T. Assessing Performance of Empirical Models for Forecasting Crop Responses to Variable Fertilizer Rates Using On-Farm Precision Experimentation. Precis. Agric. 2023, 24, 677–704. [Google Scholar] [CrossRef]
- Jain, M.; Naeem, S.; Orlove, B.; Modi, V.; DeFries, R.S. Understanding the Causes and Consequences of Differential Decision-Making in Adaptation Research: Adapting to a Delayed Monsoon Onset in Gujarat, India. Glob. Environ. Change 2015, 31, 98–109. [Google Scholar] [CrossRef]
- Franco, C.; Matheus, A.S.; Anunciatto, K.M.; Guzatti, N.C. Costs Profitability in Agriculture: A Multicase Study in Soybean Production in Diamantino/MT. Custos E Agronegocio 2015, 11, 167–188. [Google Scholar]
- Liu, Y.; Heuvelink, G.B.M.; Bai, Z.; He, P.; Xu, X.; Ma, J.; Masiliūnas, D. Space-Time Statistical Analysis and Modelling of Nitrogen Use Efficiency Indicators at Provincial Scale in China. Eur. J. Agron. 2020, 115, 126032. [Google Scholar] [CrossRef]
- Lamkowsky, M.; Oenema, O.; Meuwissen, M.P.M.; Ang, F. Closing Productivity Gaps among Dutch Dairy Farms Can Boost Profit and Reduce Nitrogen Pollution. Environ. Res. Lett. 2021, 16, 124003. [Google Scholar] [CrossRef]
- Reddy, M.B.; Sravani, P.; Kumar, S.; Rajawat, M.V.S.; Jaiswal, D.K.; Dhar, S.; Azman, E.A.; Garg, K.; Kumar, S. Nitrogen Use Efficiency Reimagined: Advancements in Agronomic, Ecophysiological, and Molecular Strategies. J. Plant Nutr. 2025, 48, 1577–1603. [Google Scholar] [CrossRef]
- Thakur, S.; Singh, R.; Kaur, J.; Sharma, M.; Pandit, K.; Kaur, S.; Kaur, S. Abiotic Stress in Plants: An Overview. Bentham Science Publishers: Sharjah, United Arab Emirates, 2021; ISBN 9781681087900. [Google Scholar]
- Snyder, A.; Calvin, K.; Clarke, L.; Edmonds, J.; Kyle, P.; Narayan, K.; Di Vittorio, A.; Waldhoff, S.; Wise, M.; Patel, P. The Domestic and International Implications of Future Climate for U.S. Agriculture in GCAM. PLoS ONE 2020, 15, e0237918. [Google Scholar] [CrossRef]
- Fleming, K.; Nagel, P. Changing the Cost of Farming: New Tools for Precision Farming: A White Paper. In Thermosense: Thermal Infrared Applications XL; SPIE: Bellingham, WA, USA, 2018; Volume 10661. [Google Scholar]
- Jaradat, A.A.; Weyers, S.L. Statistical Modeling of Yield and Variance Instability in Conventional and Organic Cropping Systems. Agron. J. 2011, 103, 673–684. [Google Scholar] [CrossRef]
- Kinnunen, P.; Heino, M.; Sandström, V.; Taka, M.; Ray, D.K.; Kummu, M. Crop Yield Loss Risk Is Modulated by Anthropogenic Factors. Earth’s Future 2022, 10, e2021EF002420. [Google Scholar] [CrossRef]
- Hoffmann, M.P.; Haakana, M.; Asseng, S.; Höhn, J.G.; Palosuo, T.; Ruiz-Ramos, M.; Fronzek, S.; Ewert, F.; Gaiser, T.; Kassie, B.T.; et al. How Does Inter-Annual Variability of Attainable Yield Affect the Magnitude of Yield Gaps for Wheat and Maize? An Analysis at Ten Sites. Agric. Syst. 2018, 159, 199–208. [Google Scholar] [CrossRef]
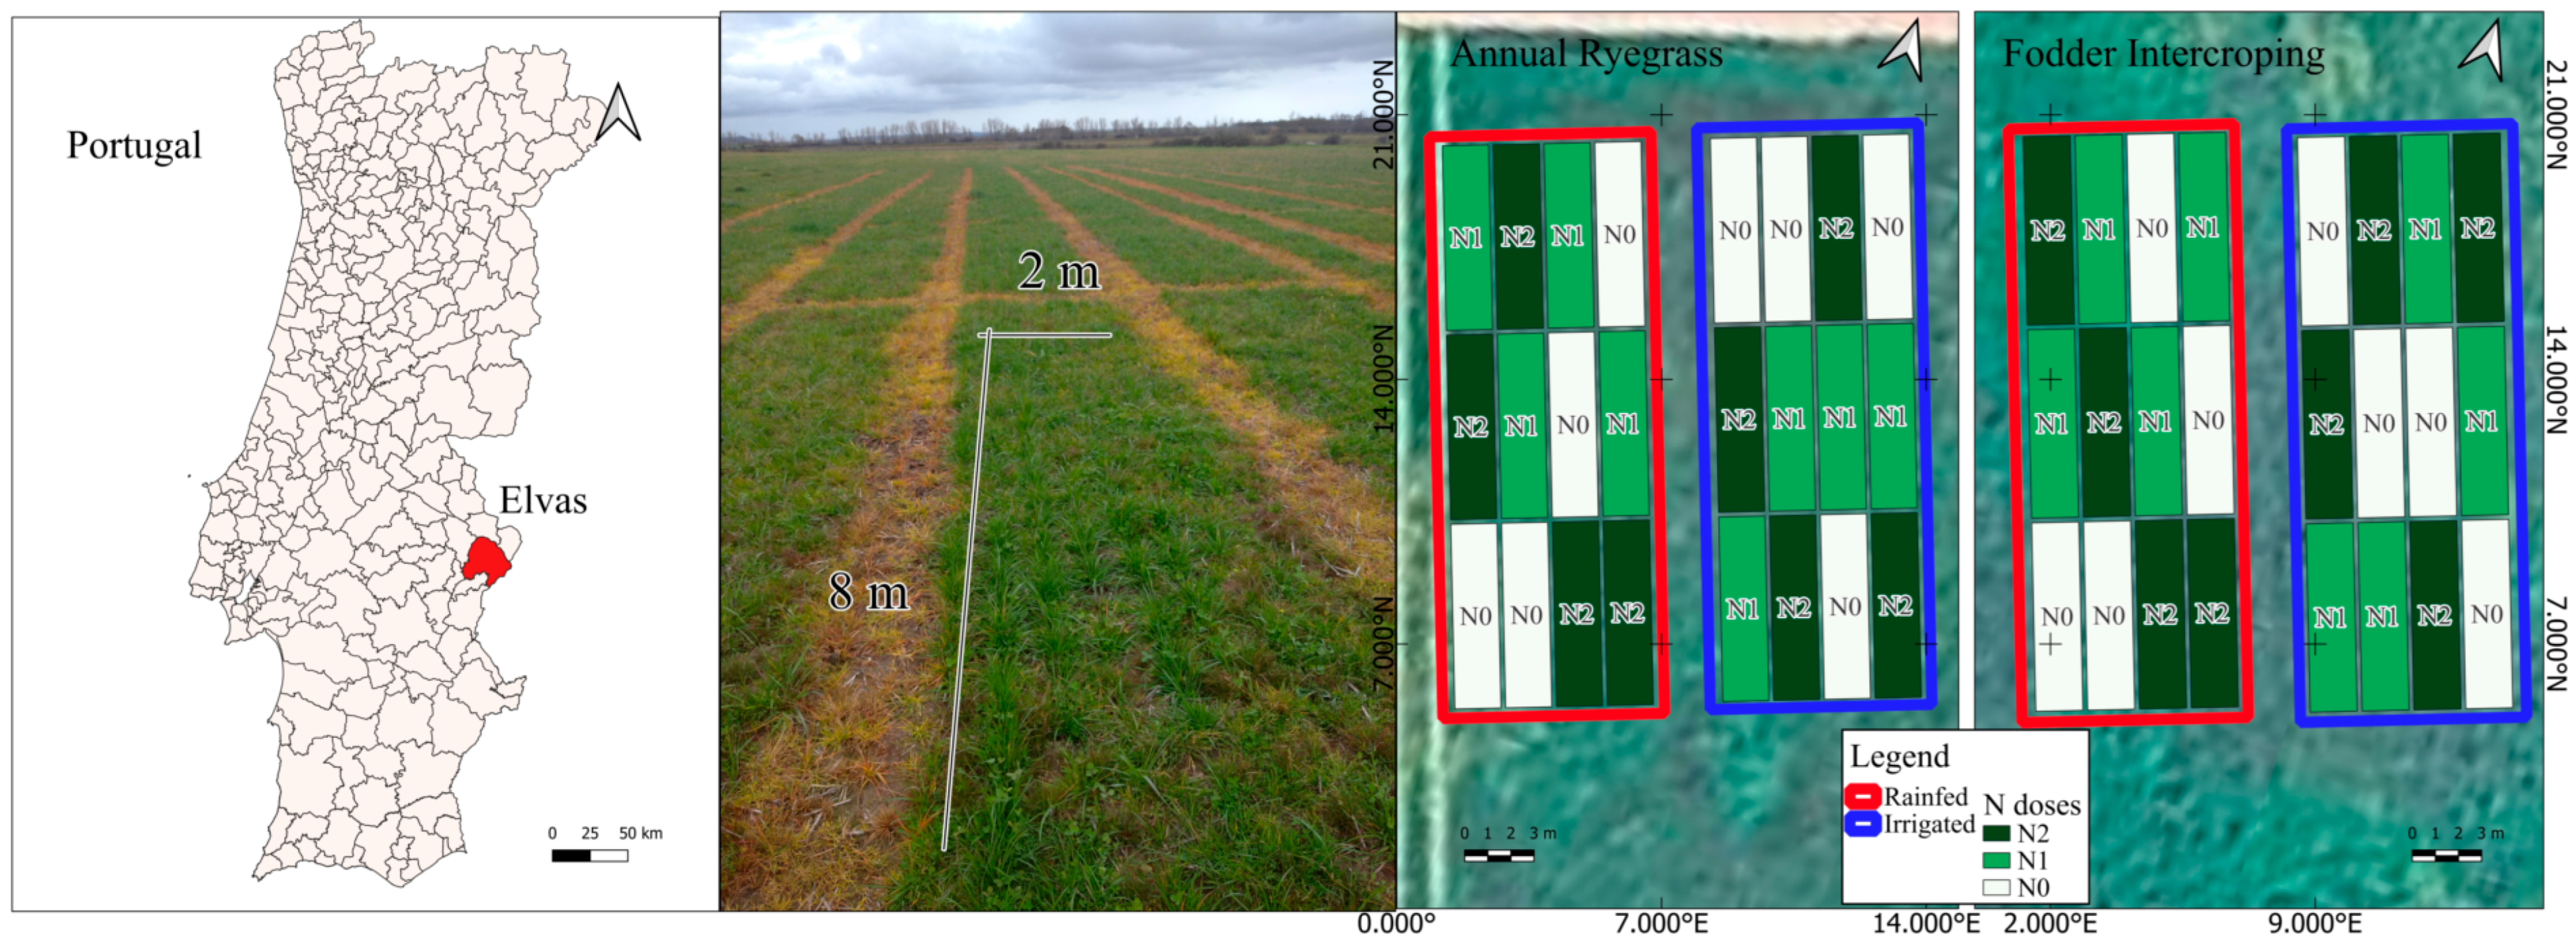
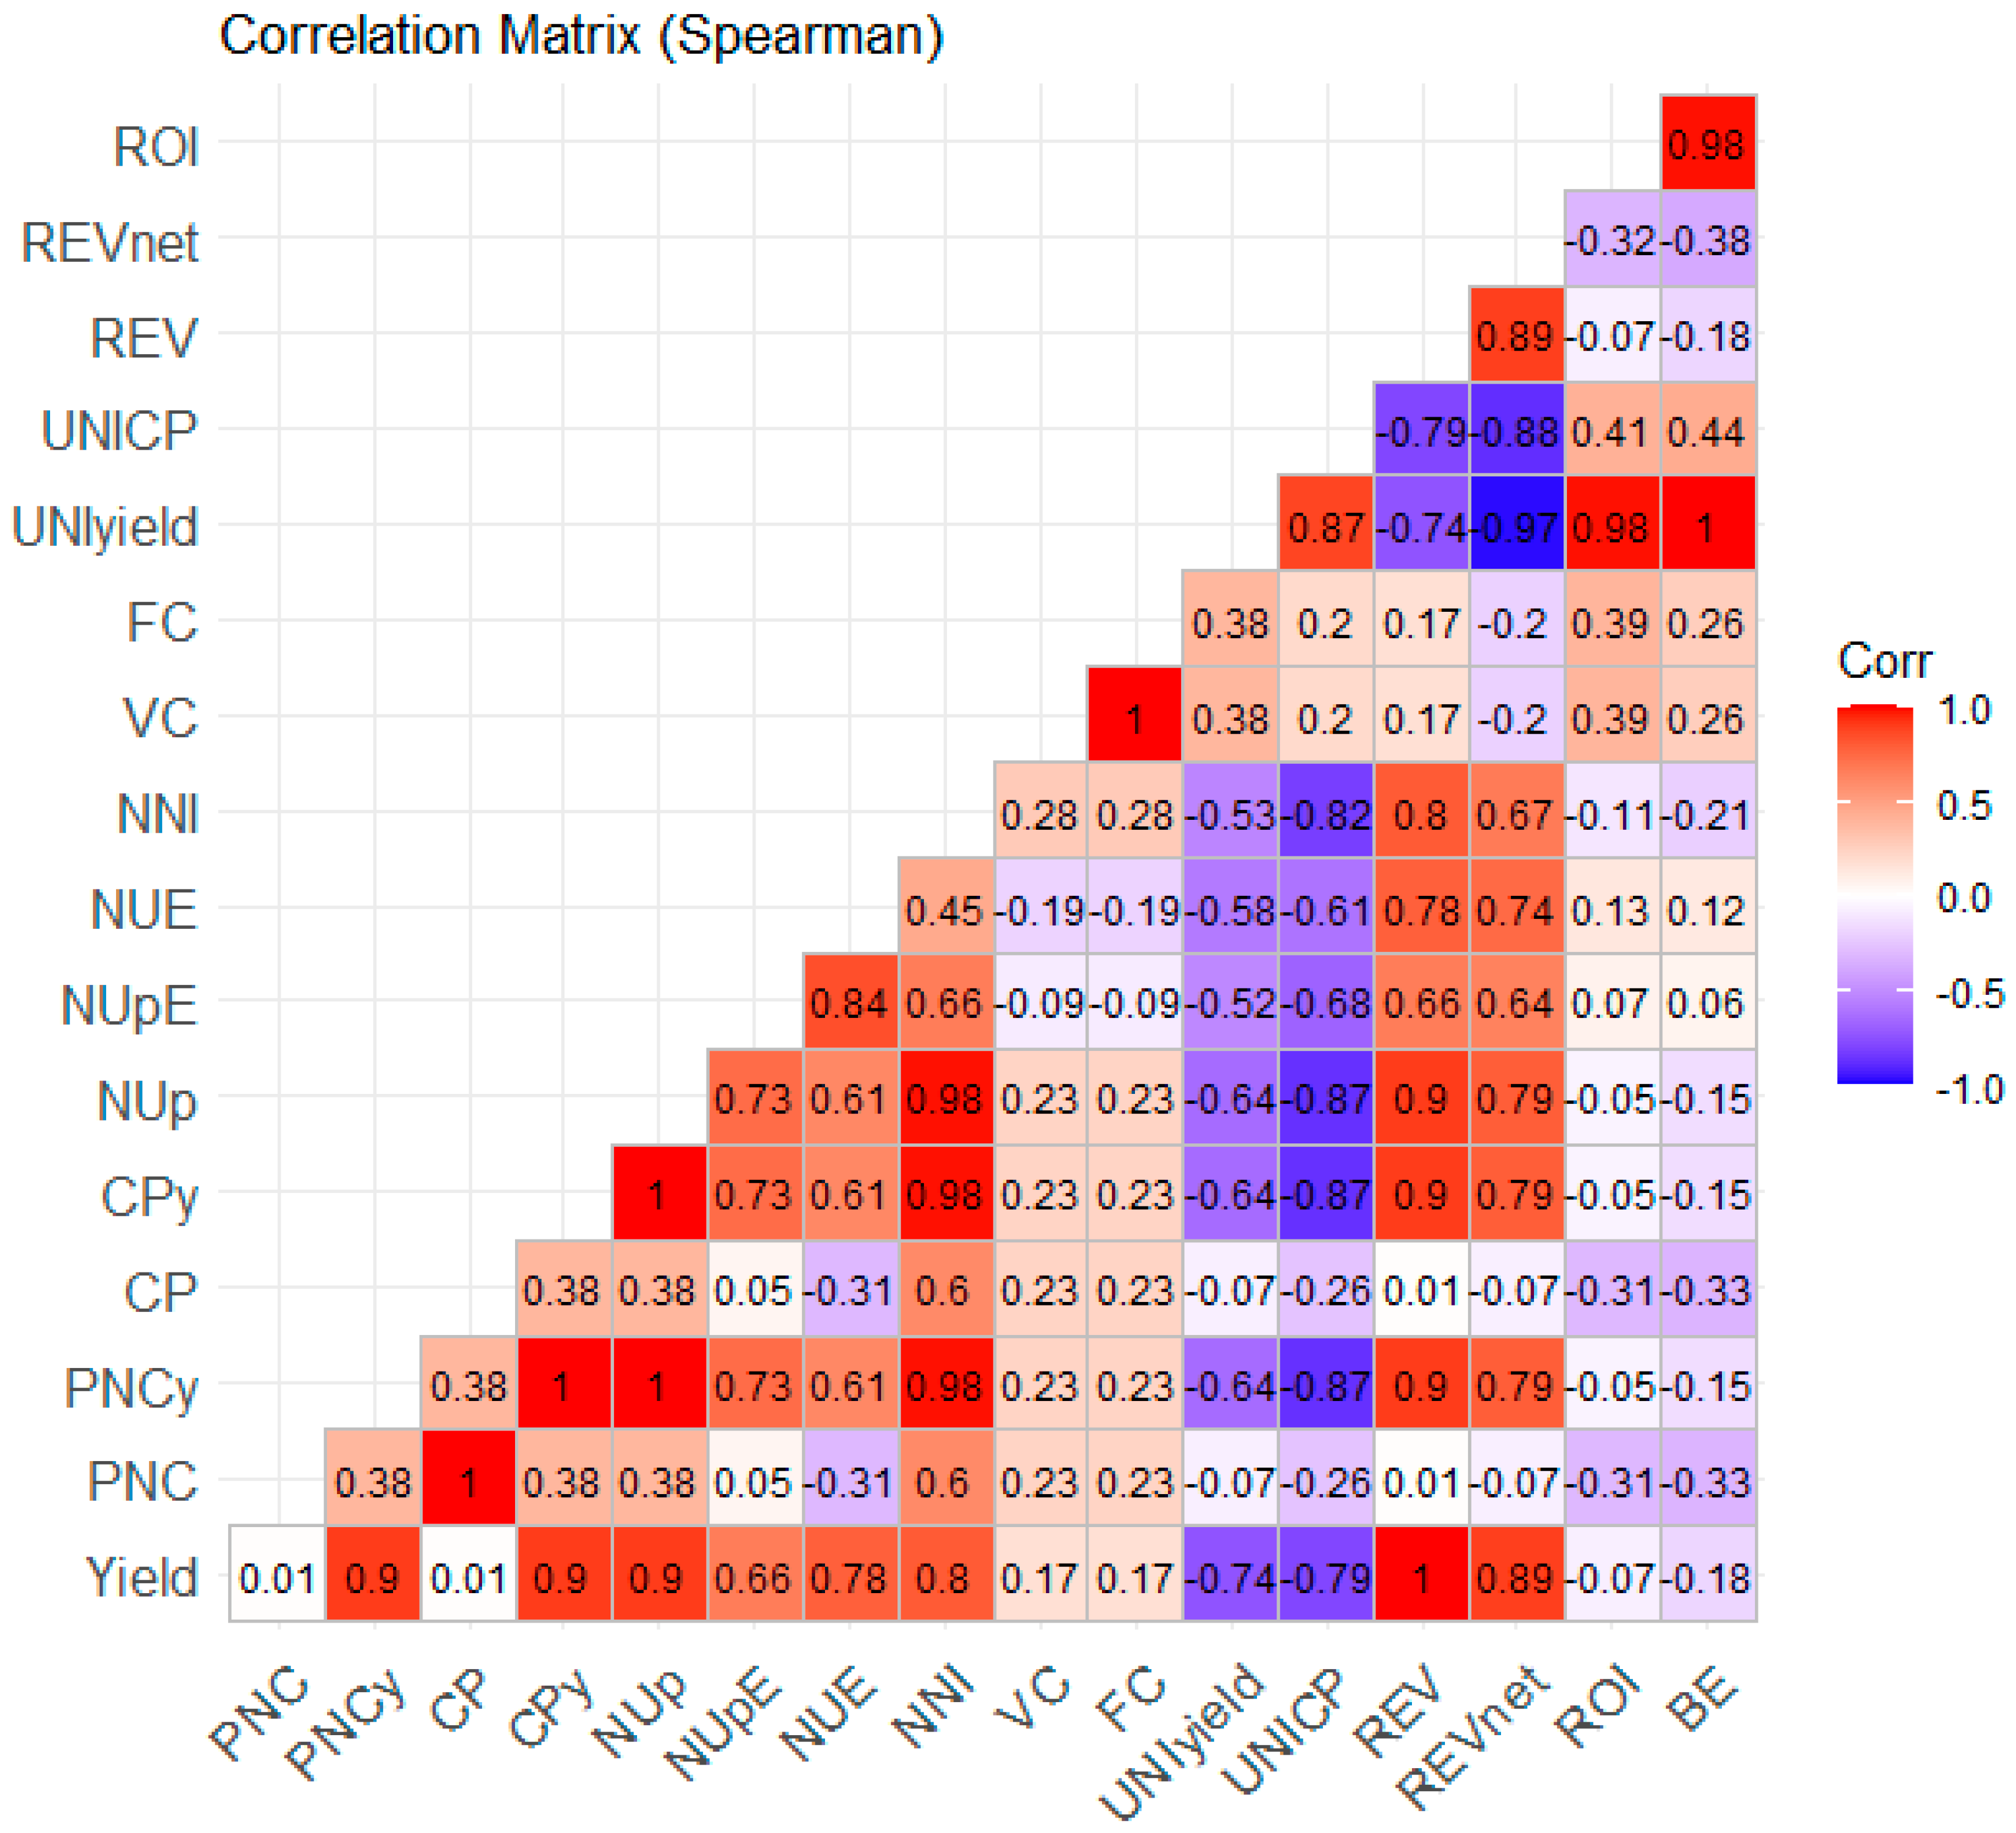
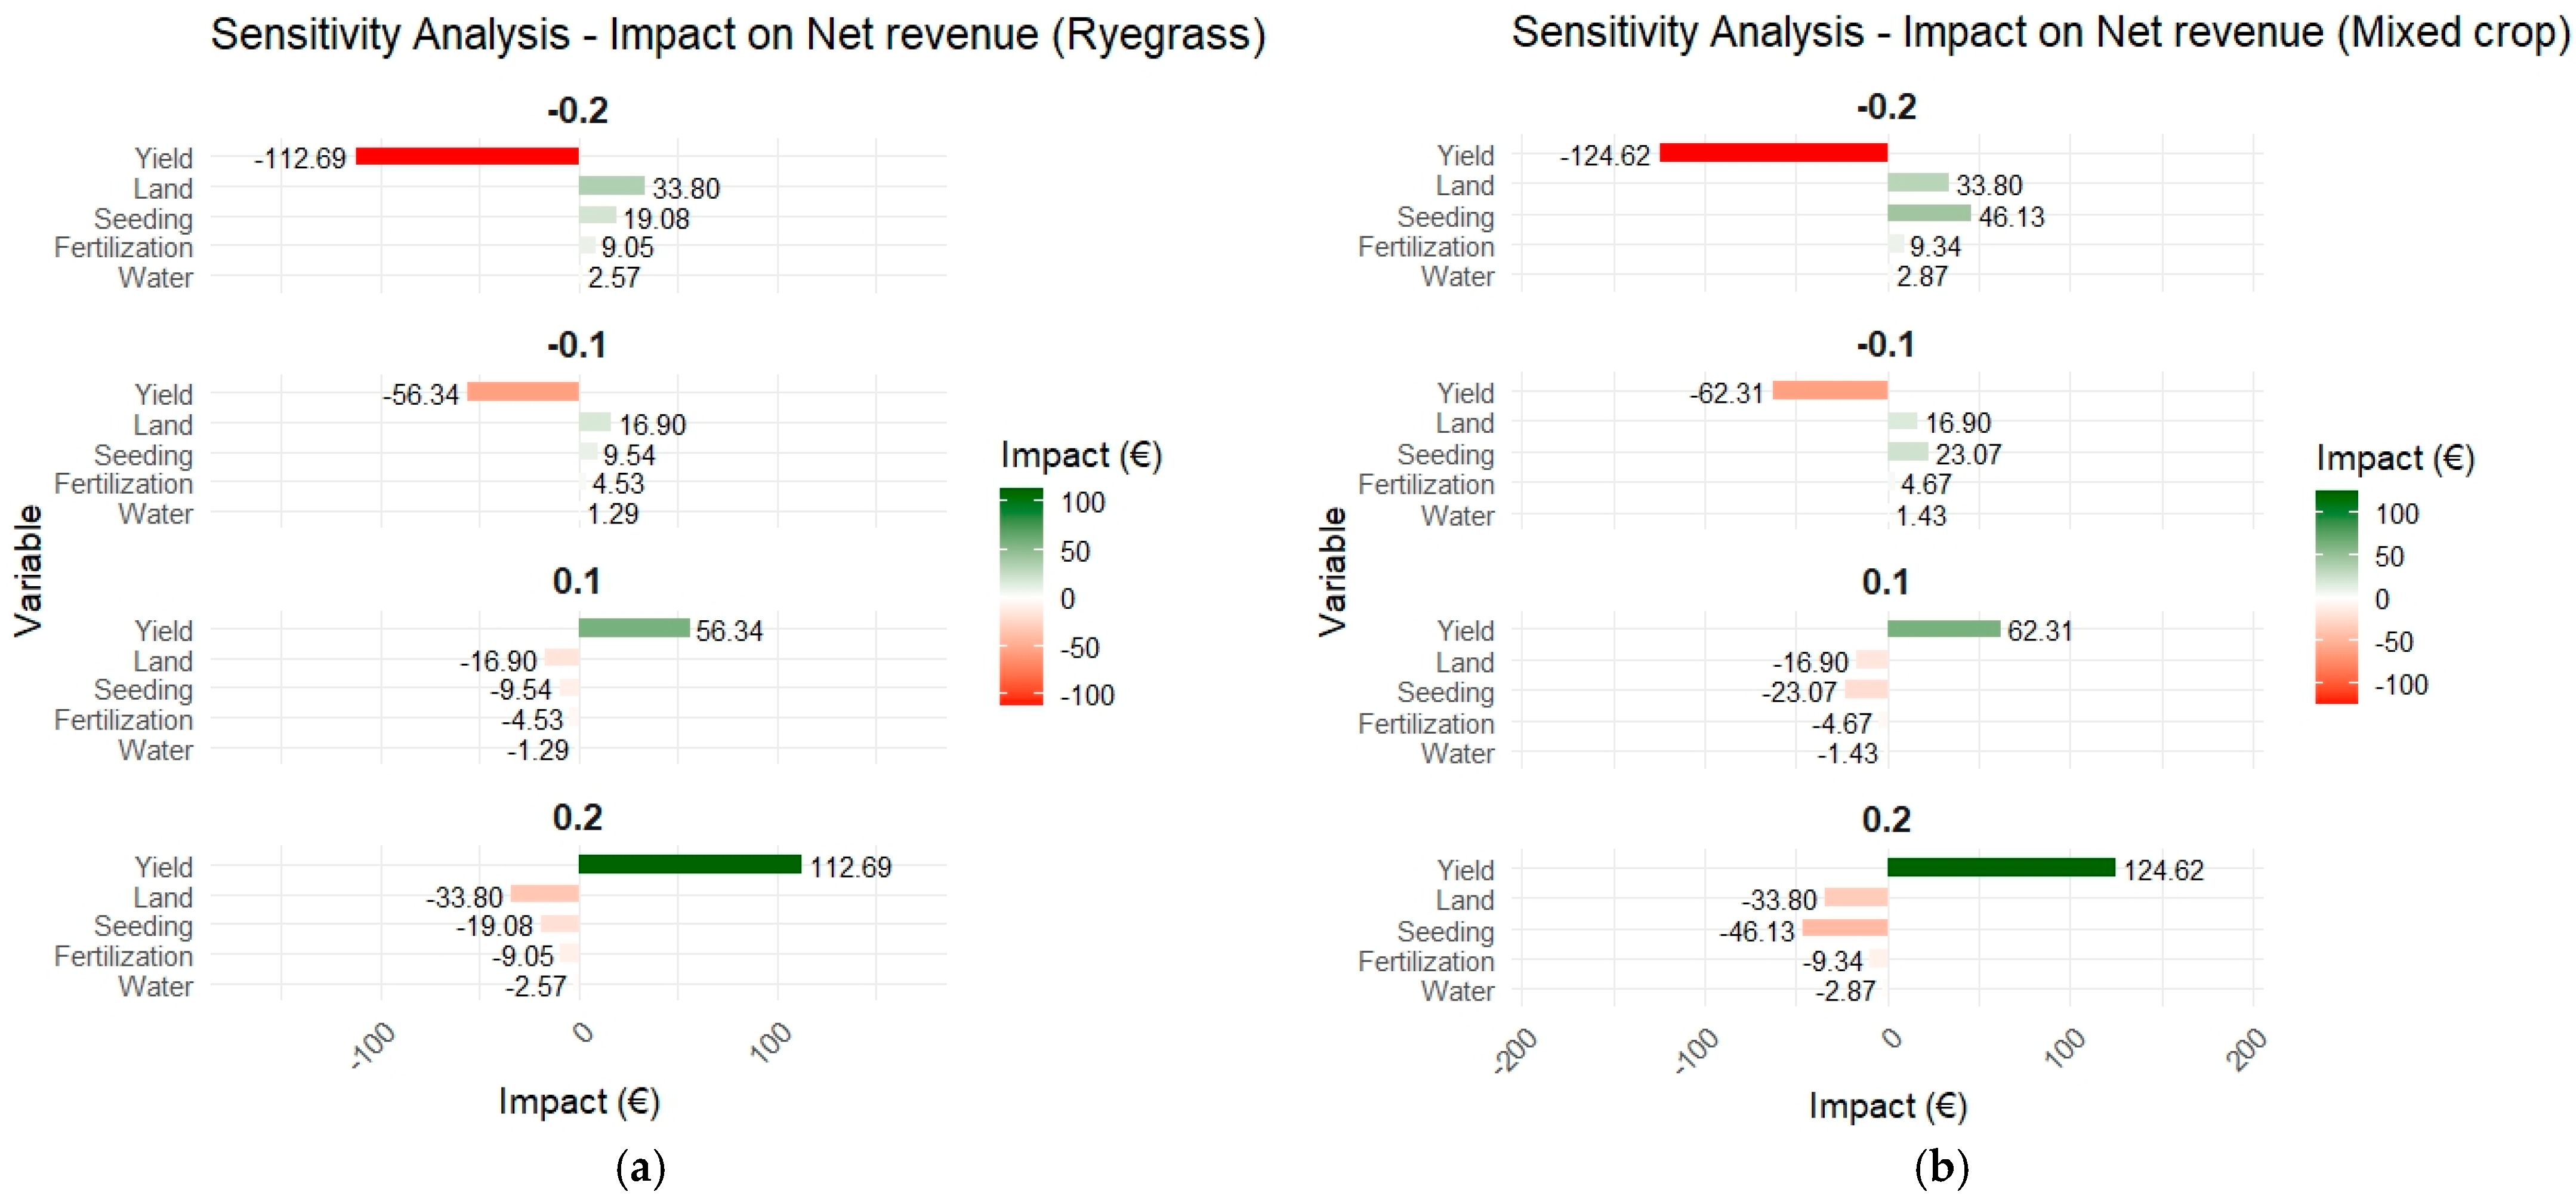
Disclaimer/Publisher’s Note: The statements, opinions and data contained in all publications are solely those of the individual author(s) and contributor(s) and not of MDPI and/or the editor(s). MDPI and/or the editor(s) disclaim responsibility for any injury to people or property resulting from any ideas, methods, instructions or products referred to in the content. |
© 2025 by the authors. Licensee MDPI, Basel, Switzerland. This article is an open access article distributed under the terms and conditions of the Creative Commons Attribution (CC BY) license (https://creativecommons.org/licenses/by/4.0/).