Proceeding Paper

Electromagnetic Characterization and Simulation of a Carbonate Buffer System on a Microwave Biosensor †

1
Center for Integrated Sensor Systems, Danube University Krems, Krems an der Donau, Austria
2
AIT Austrian Institute of Technology GmbH, 1220 Vienna, Austria
*
Author to whom correspondence should be addressed.
Presented at the Eurosensors 2017 Conference, Paris, France, 3–6 September 2017.
Proceedings 2017, 1(4), 276; https://doi.org/10.3390/proceedings1040276
Published: 17 August 2017
(This article belongs to the Proceedings of Proceedings of Eurosensors 2017, Paris, France, 3–6 September 2017)

Abstract

:
In order to develop a fast, sensitive and easy-to-produce biosensor, a high-quality microwave split-ring resonator is going to be developed. In the final sensing device, a blood sample will be placed as a droplet on the sensitive area of the sensor. In case of specific target biomolecules binding a shift in resonance frequency will be induced due to the effective permittivity change. This shift in resonance frequency depends on the concentration of biomolecules and is therefore quantitative. The aim of this work is to find a position for the bio-functionalization that provides a measurable frequency shift when the analyte is added. Different areas are tested experimentally and via simulations. Two buffer solutions are used which have to be characterized in terms of its electromagnetic properties in advance. This preliminary study should pave the way for the measurements in real human samples such as serum or plasma.

1. Introduction

In this work, two slightly different structures, the one-sided interdigital centered-gap split-ring resonator (SRR) and the two-sided interdigital centered-gap SRR, will be improved to increase their quality factor (Q-factor) in order to obtain a high-quality biosensor. The two-sided interdigital centered-gap SRR structure is shown in Figure 1. Its size is in the range of millimeters and its resonance frequency is in the microwave range.
At resonance, the electric field of the resonator is concentrated at the interdigital structure marked by the black rectangle shown in Figure 2. This area is very sensitive to changes in permittivity. For sensor applications, a part of the biosensor will be bio-functionalized to enable specific binding of molecules. The binding of the molecules leads to a change in electric permittivity of the resonator which results to a shift of the resonance frequency. Since this shift directly depends on the load of biomolecules, the concentration of biomolecules can be determined by measuring the frequency shift.
The biofunctionalization of the sensor will be performed locally by employing the inkjet printing technology. With the inkjet printing, dextran based hydrogel precursor solutions with receptor molecules can be placed very precisely on the sensor surface. After UV crosslinking, biomolecules can diffuse into the hydrogel matrix, which leads to a change of the refractive index or permittivity above the sensor [1,2]. To find the best position for bio-functionalization, preliminary studies using two buffer solutions were performed. For the simulation part of the study, the buffer solutions have to be characterized in terms of their electromagnetic properties. The Principle of Reflection Method [3] is used to calculate complex permittivity, electric conductivity and loss tangent of the buffer solutions. After the electromagnetic characterization, 1 μL of the buffer droplet will be simulated at different positions on the sensitive in the high-frequency simulation software HFSS (ANSYS Inc., Canonsburg, PA, USA).

2. Materials and Methods

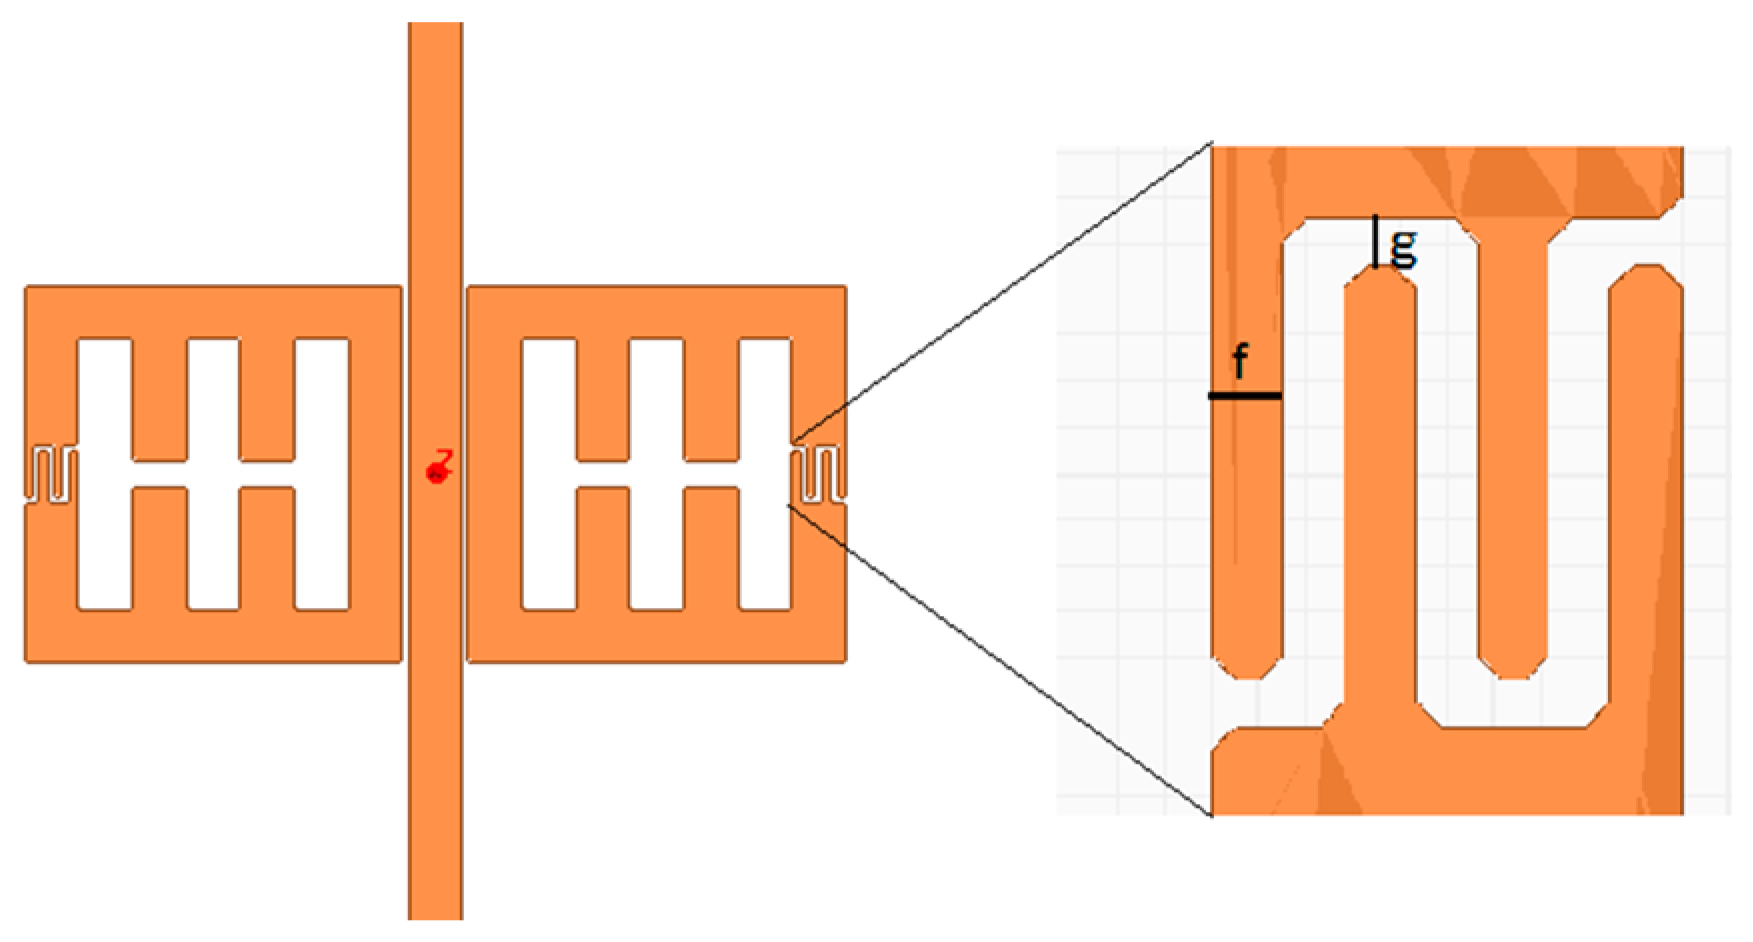
2.1. Improvement of the Geometry

Parts of this chapter have already been presented in [4] and have been reproduced with permission of the coauthors. Content which was not generated by the author is explicitly denoted. The geometry is improved such that the quality factor Q of the resonator is increased. The Q-factor can be calculated using following formula:
Q = f 0 f 3 d B ,
where f 0 denotes the resonant frequency and f 3 dB denotes the 3dB-bandwidth around the resonant frequency. The geometric parameters which influence the Q-factor are the resonator width, the gap size and the geometry of the interdigital element [5]. Using a simulation model in HFSS, the gap size and resonator width of the two-sided interdigital centered-gap SRR were varied, whereas the interdigital gap size and the interdigital width were kept constant at 0.3 mm and 0.2 mm, respectively. The results of the simulations show that the highest Q-factor was at a resonator width of 2.5 mm and a gap size of 4 mm. From the simulations we got a maximum Q-factor of 252.4. The next step was the variation of the parameters which determine the interdigital structure, the interdigital gap and the interdigital width. The Q-factor could be further increased to 257.1 with an interdigital gap size of 0.2 mm and an interdigital width of 0.45 mm. A one-sided interdigital centered-gap split-ring resonator (Figure 2) with the same sizes offers a slightly decreased Q-factor of 244.6. The resonant frequency of the two-sided resonator (Figure 1) accounts for 1.7545 GHz; the resonant frequency of the one-sided structure is slightly higher at 1.7817 GHz. The one-sided structure has been manufactured to perform experiments later on. The resonance frequency of the manufactured structure is measured with a network analyzer. It accounts for 1.78 GHz with a Q-factor of 155.6. The difference to the simulations may be due to idealizations in the boundary conditions used in the simulation model.

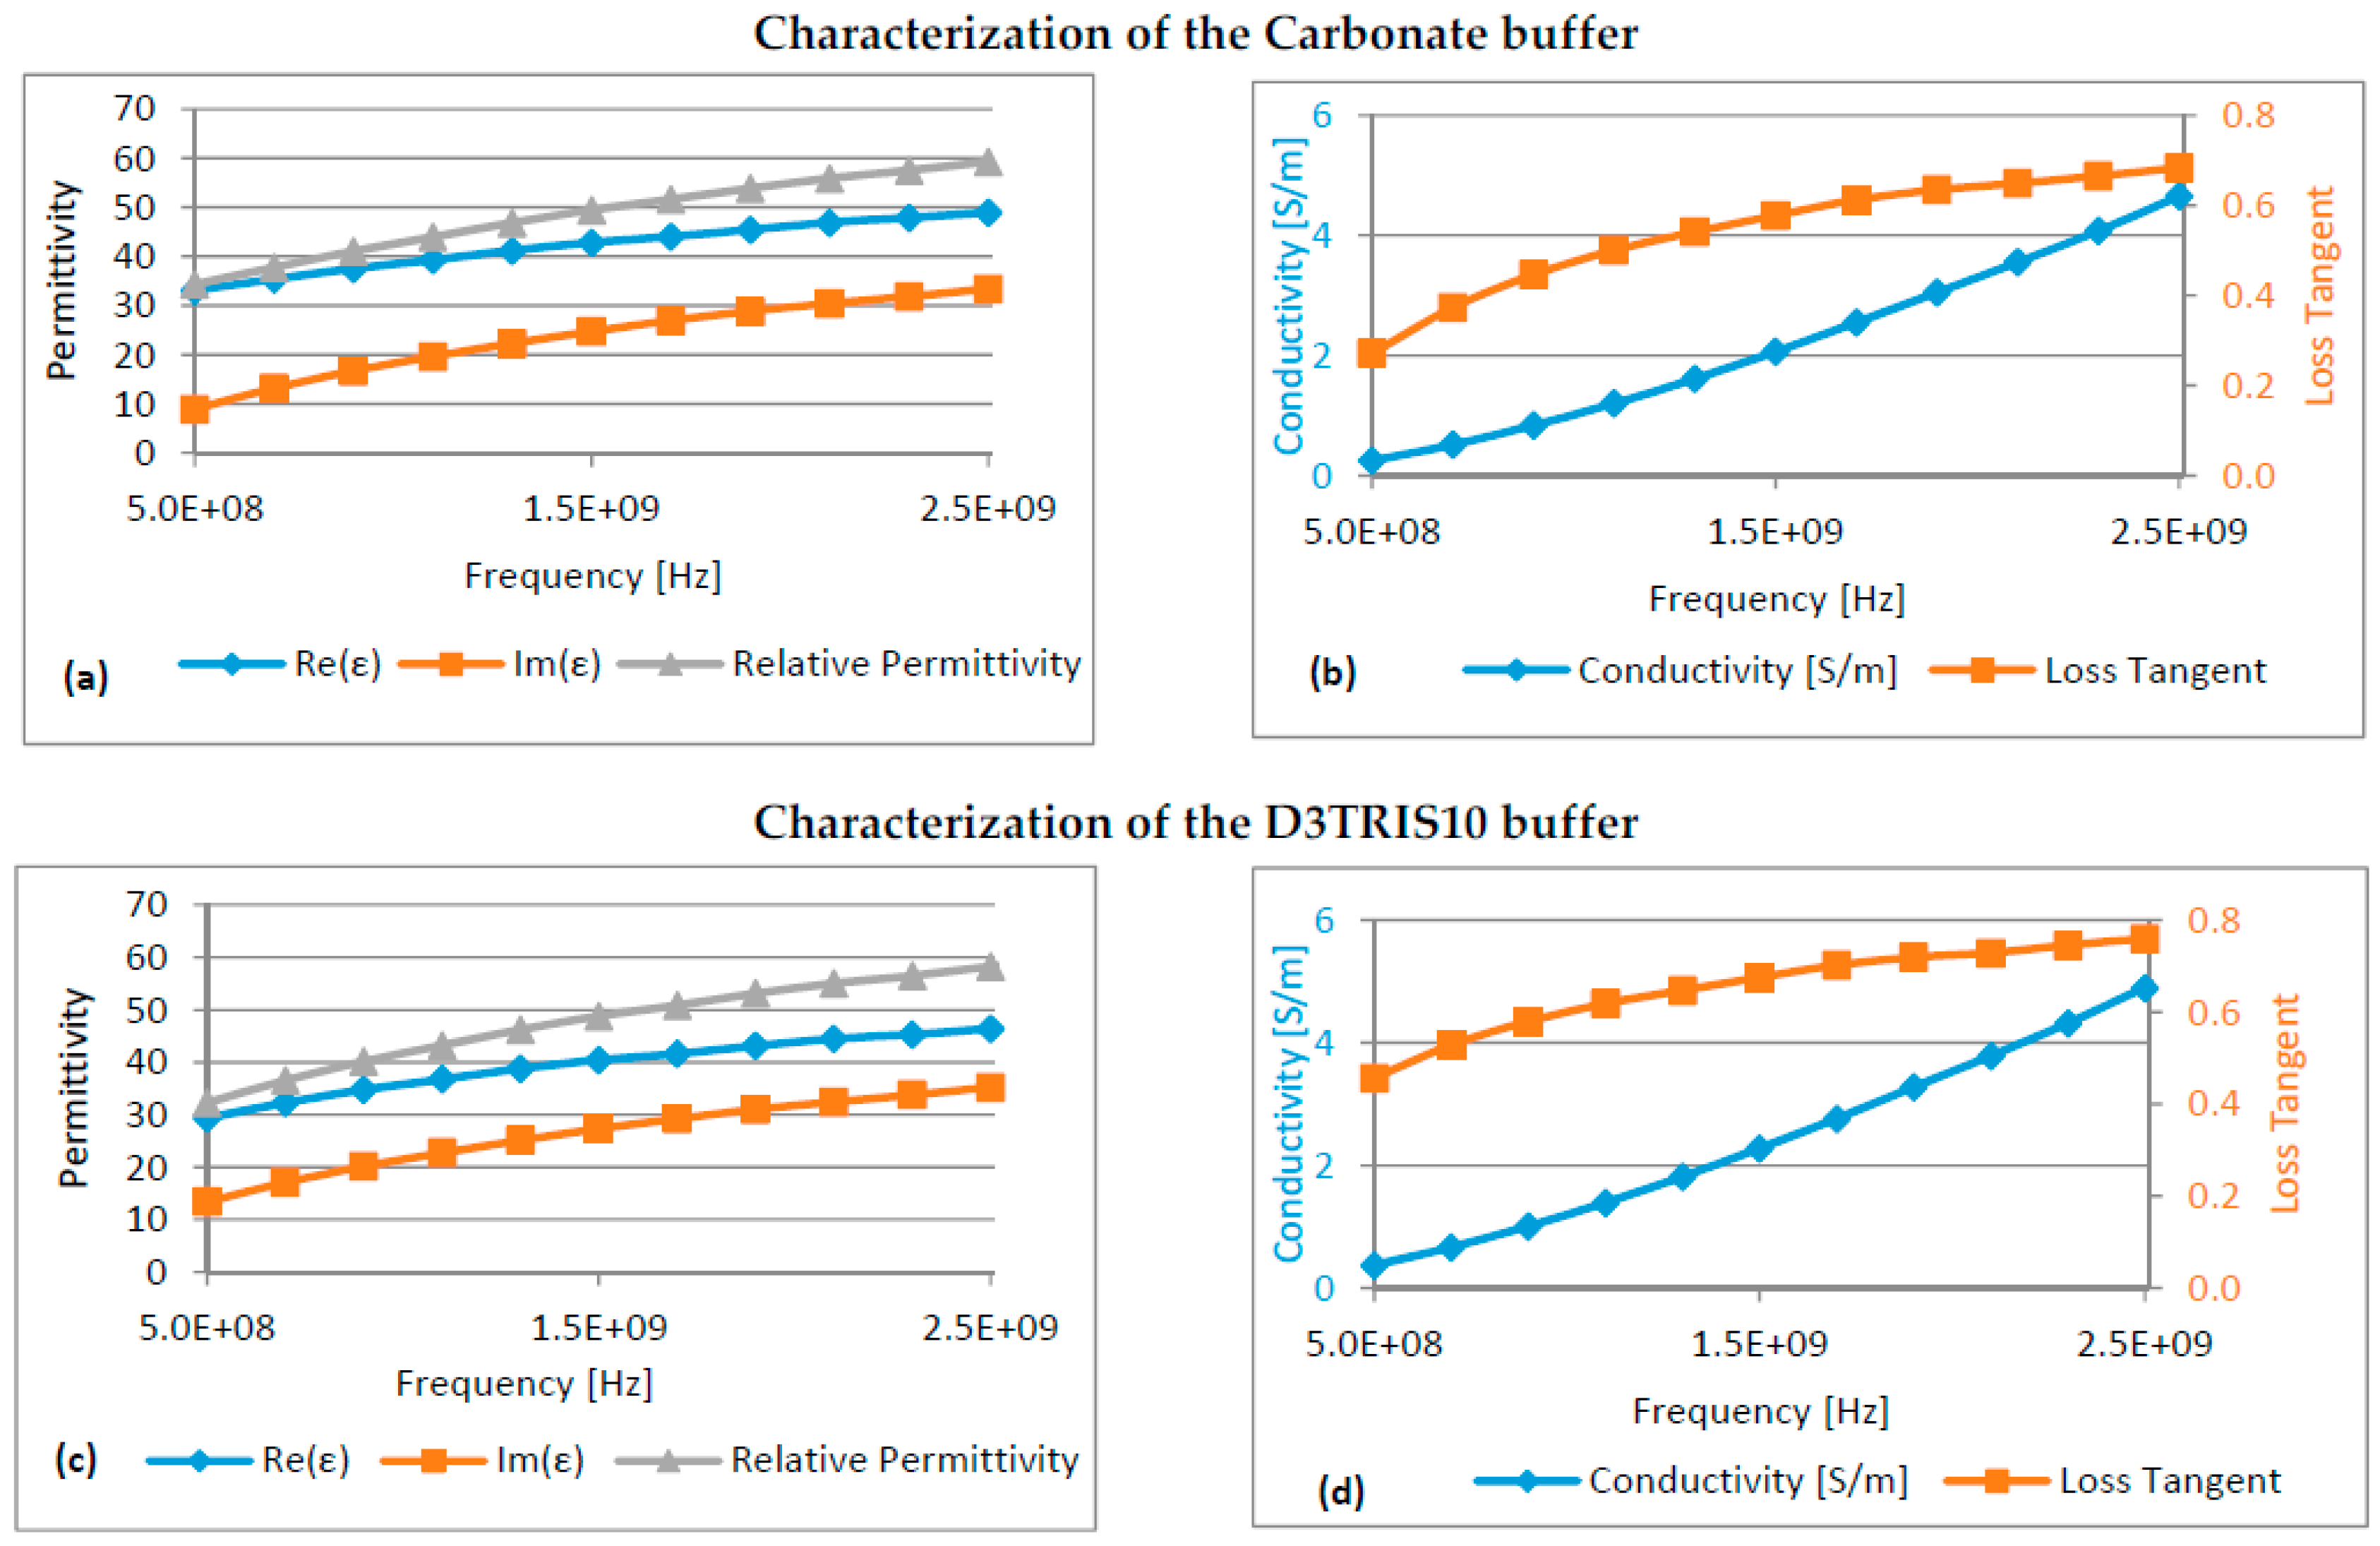
2.2. Characterization of the Buffer Droplet

The carbonate buffer (25 mM carbonate, 100 mM NaCl, 3.2 mM CaCl2) provides similar properties as the liquid fraction of blood regarding salt concentrations and pH values; the D3TRIS10 (5% w/w dextran in 10 mM TRIS) buffer provides similar properties like the hydrogel used for the bio-functionalization. To perform simulations with 1 μL of the buffer placed on different positions of the resonator, its electromagnetic properties have to be examined. The Principle of Reflection Method [3] is used. The results are shown in Figure 3:

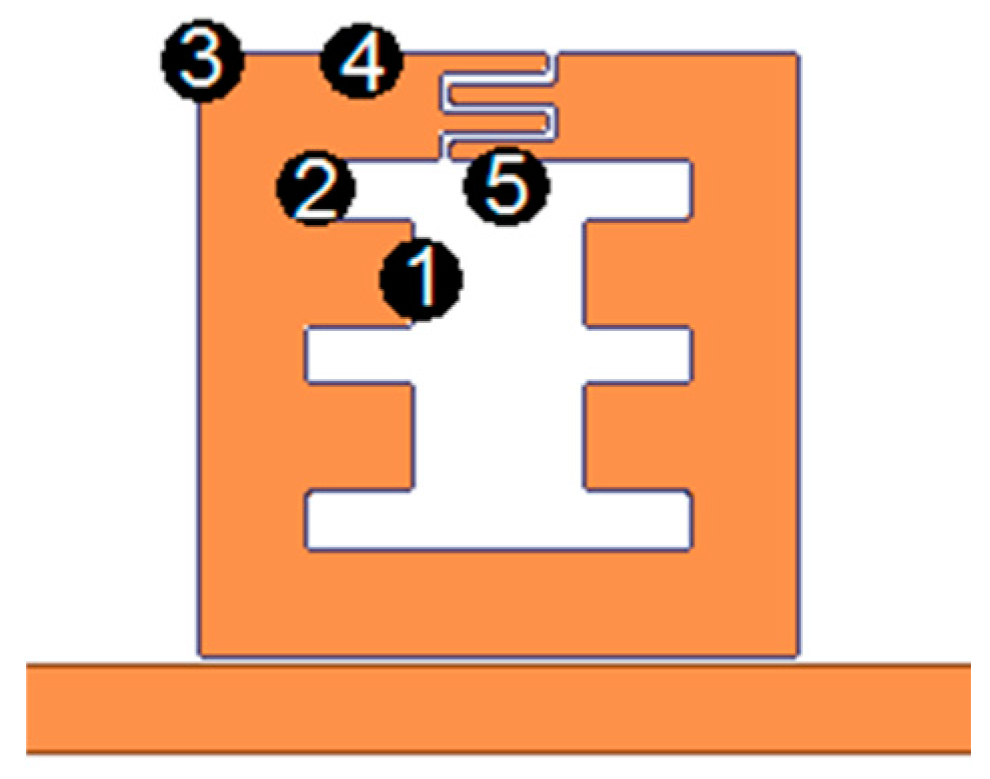
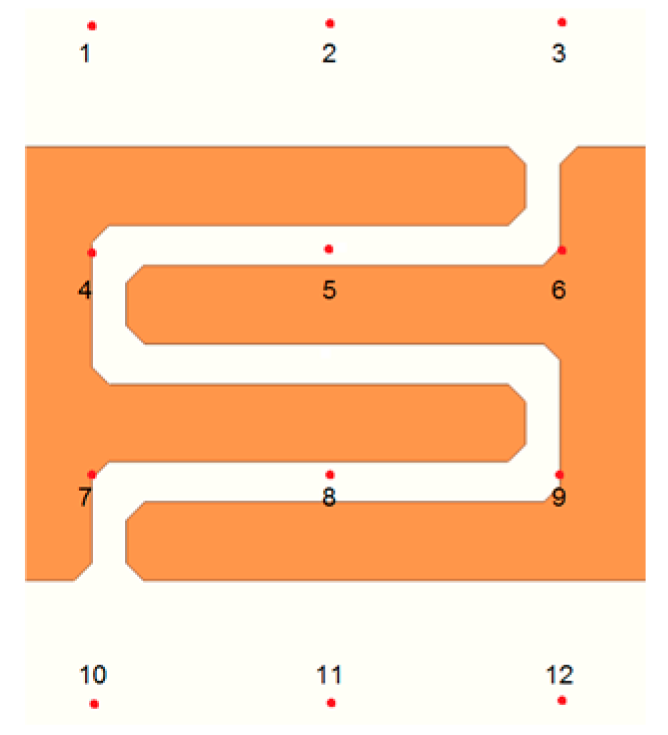
2.3. Positioning of the Buffer Droplet

If the buffer droplet is placed in the middle of the sensitive area, a short circuit is formed. To find a position of the bio-functionalization, at which a high frequency shift is provided without formation of a short circuit, experiments are performed with 1 μL of the D3TRIS10 buffer placed at different areas of the resonator. The positions are shown in Figure 4. All positions result in a measurable frequency shift. The highest frequency shift is reached at position 5 accounting for 47 MHz. Subsequently, simulations are performed with 1 μL of the buffer droplet placed on different parts of the most sensitive area shown in Figure 5.
The droplet is defined to be cylindrical with a radius of 1.2 mm. All simulations are performed for both the carbonate and the D3TRIS10 buffer. At eight positions, the buffer droplet leads to the formation of a short circuit. Only positions 2, 3, 10 and 11 still provide a signal. Positions 2 and 11 provide the highest frequency shifts. The results are shown in Table 1.

3. Discussion

A high-quality microwave SRR has been designed with a high Q-factor of 155.6. For biosensor application, the sensitive part of the SRR has to be bio-functionalized. To find an appropriate position for the bio-functionalization, a preliminary simulation study is performed with two buffer solutions. The carbonate buffer is similar to blood regarding salt concentration and pH value; the D3TRIS10 buffer is similar to the hydrogel matrix used for the bio-functionalization. Both buffer solutions are characterized in terms of their complex permittivity, electric conductivity and loss tangent using the Principle of Reflection Method. The results of the characterization were used to perform simulations in the high-frequency simulation software HFSS. Different positions for the cylindrical buffer droplet with a volume of 1 μL and a radius of 1.2 mm were tested. It was figured out that in many cases the buffer droplet leads to formation of a short circuit because of its high loss in the gigahertz range. Two positions were found that provide a high frequency shift without formation of a short circuit. Position 11 offers the highest frequency shift averaged over the buffer solutions and therefore was chosen to be the better one. The shift of resonant frequency accounts for over 30 MHz for both buffer solutions which corresponds to about 1.7%.

Acknowledgments

The authors would like to thank the NÖ Forschungs- und Bildungsges.m.b.H. (NFB) for financially supporting the project (LSC13-023).

Conflicts of Interest

The authors declare no conflict of interest. The founding sponsors had no role in the design of the study; in the collection, analyses, or interpretation of data; in the writing of the manuscript, and in the decision to publish the results.

References

  1. Strasser, F.; Melnik, E.; Muellner, P.; Jiménez-Meneses, P.; Nechvile, M.; Koppitsch, G.; Lieberzeit, P.; Laemmerhofer, M.; Heer, R.; Hainberger, R. Preparation of Mach-Zehnder interferometric photonic biosensors by inkjet printing technology. In Proceedings of the SPIE Optics and Optoelectronics, Prague, Czech Republic, 24–27 April 2017. [Google Scholar]
  2. Melnik, E.; Strasser, F.; Muellner, P.; Heer, R.; Mutinati, G.C.; Koppitsch, G.; Lieberzeit, P.; Laemmerhofer, M.; Hainberger, R. Surface Modification of Integrated Optical MZI Sensor Arrays Using Inkjet Printing Technology. Procedia Eng. 2016, 168, 337–340. [Google Scholar] [CrossRef]
  3. Zajicek, R.; Oppl, L.; Vrba, J. Broadband measurement of complex permittivity using reflection method an coaxial probes. Radioengineering 2008, 17, 14–19. [Google Scholar]
  4. Wagner, L.-M.; Voglhuber-Brunnmaier, T.; Brandl, M. Optimization of a Biosensor Device based on a microwave Split-Ring Resonator. In Proceedings of the Conference on Micro- and Nano-Engineering (MNE2016), Vienna, Austria, 19–23 September 2016. [Google Scholar]
  5. Reinecke, T.; Walter, J.-G.; Kobelt, T.; Ahrens, A.; Scheper, T.; Zimmermann, S. Biosensor based on a split-ring resonator. In Proceedings of the Sensors 2017, Nuremberg, Germany, 30 May–1 June 2017. [Google Scholar]
Figure 1. Structure of the two-sided interdigital centered-gap split-ring resonator with interdigital gap g and interdigital width f.
Proceedings 01 00276 g001
Figure 2. Electric field of the one-sided interdigital centered-gap slit-ring resonator at resonance simulated in the high-frequency simulation software HFSS. The electric field is concentrated at the interdigital element marked by the black rectangle.
Proceedings 01 00276 g002
Figure 3. Electromagnetic characterization: (a,c): Real part and imaginary part of complex permittivity and relative permittivity; (b,d): Conductivity (S/m) and loss tangent.
Proceedings 01 00276 g003
Figure 4. Experimentally tested positions of the D3TRIS10 buffer.
Proceedings 01 00276 g004
Figure 5. Different positions of the basis center of the buffer droplet marked by red dots.
Proceedings 01 00276 g005
Table 1. Results of the simulations with two different buffer solutions on different parts of the sensitive area.
D3TRIS10Carbonate
211211
Δ f (MHz)30.430.930.730.4
Δ f (%)1.711.731.721.71
Publisher’s Note: MDPI stays neutral with regard to jurisdictional claims in published maps and institutional affiliations.

