Microstructure for Thermal Impedance Spectroscopy for Biofuel Composition Measurement †
by
Bo Jiang
1,*, 
Mohammadamir Ghaderi
1,
Andre Bossche
1,
Jaco H. Visser
2 and
Reinoud F. Wolffenbuttel
1 1
Electronic Instrumentation Lab., Department of microelectronics, Faculty of EEMCS, Delft University of Technology, Delft, 2628 CD, The Netherlands
2
Ford Motor Company, Research and Advanced Engineering, Dearborn, MI-48124, USA
*
Author to whom correspondence should be addressed.
†
Presented at the Eurosensors 2017 Conference, Paris, France, 3–6 September 2017.
Proceedings 2017, 1(4), 396; https://doi.org/10.3390/proceedings1040396
Published: 17 August 2017
(This article belongs to the Proceedings of Proceedings of Eurosensors 2017, Paris, France, 3–6 September 2017)
Abstract
:Thermal impedance spectroscopy has been investigated as a non-destructive technique to determine the composition of ternary mixtures of biofuels. The principle of the thermal conductivity detector has been extended for measuring both the thermal conductivity and the thermal capacity of biofuel in the range between 1 to 100 Hz, using an AC-operated polysilicon heater for injecting a sinusoidal heat flux, and another polysilicon strip at a well-defined spacing or thermopile sensors for measuring the in-phase and quadrature components of the resulting AC temperature difference.
1. Introduction
For a quick start and clean and efficient operation of Flex-Fuel Vehicles, the composition of the biofuel must be continuously monitored. The composition of E85 fuel is assumed to be composed of 85% ethanol and 15% gasoline. However, a small amount of water is often present in E85. The amount of the water in E85 cannot be reliably detected using state-of-the-art capacitive fuel-line sensors. Earlier work on including water composition measurement was based on electrical impedance spectroscopy using the electrical conductivity and the dielectric permittivity [1]. However, operation up to the GHz range is required for unambiguous detection of all three components.
2. Structure Design Process
In this work, the thermal impedance of the mixtures of ethanol, gasoline, and water (EGW), as determined by their specific thermal conductivities and thermal capacities (listed in Table 1), is investigated for biofuel composition measurement.
The initial structure is shown in Figure 1 and is basically a Thermal Conductivity Detector (TCD) for operation in a liquid [2]. A specially textured surface results in a localized hydrophilic surface, which is used for containing the fuel [3,4].
The circuit for driving the heater ensures a sinusoidal heat flux despite the non-linear relation between heat flux (Jh(ω)) and electric current. The thermal impedance is defined as the ratio between Jh(ω) and ΔT(ω).The simplified circuit representation of the fuel is a current-driven parallel RC circuit, which is in parallel to the RC circuit of the sensor structure, as shown in Figure 1b. The design has been optimized to result in an efficient heat flux into the fuel over the entire range of possible fuel compositions, despite the parasitic thermal impedance of the sensor structure and the substrate (i.e., Rsensor > Rfuel and Csensor < Cfuel).
2.1. Heat Flux Efficiency
Sensor operation critically depends on the efficient injection of heat into the fuel. For this reason a silicon nitride membrane is used, which combines a relatively low thermal conductivity (20 W/mK) as compared to silicon (34 W/mK) substrate with the opportunity to locally remove the substrate by under-etching. A nitride thickness of 0.6 μm is used as a compromise between thermal isolation and membrane strength. Different heights of under-etch are investigated, as shown in Figure 2.
The second critical design property is the lateral spacing between the heater and symmetric sensors. Simulation results are shown in Figure 3. As sensor operation is based on measurement of the temperature difference, the lateral spacing should be large enough to cover the area over which there is still a gradient. However, the figure indicates that a lateral spacing larger than 100 μm in the thermocouple (or a more distant position of the second polysilicon strip) would not be useful.
2.2. Design Structures
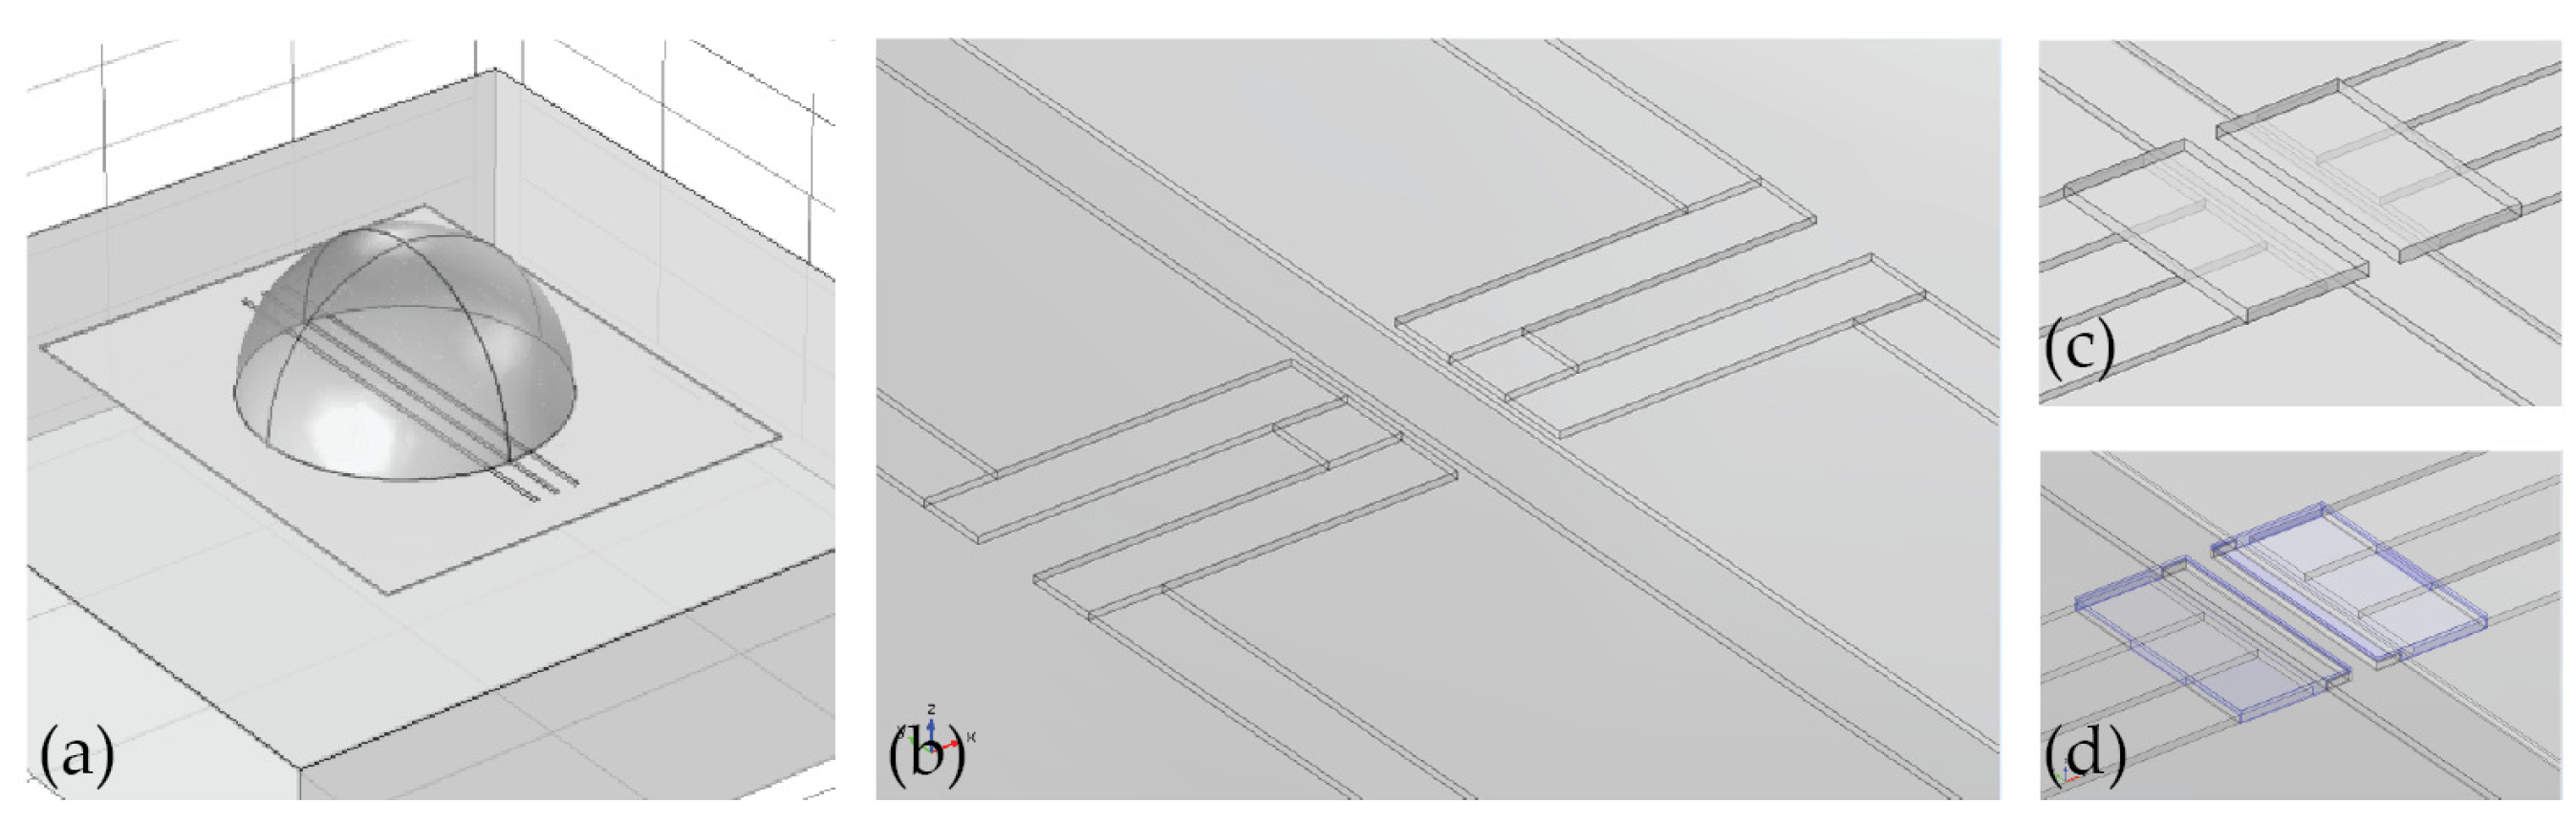
Two types of structures were designed; both having a central heater/resistive temperature sensor, but the first type has an additional thermally sensitive resistor (Figure 4a), and the second type has a thermopile temperature sensor, as shown in Figure 4b.
The thermopile design is a compromise between the thermal conductivity of the legs and the total Seebeck voltage. Devise conductance should be designed to be negligible compared to the thermal conductance of the biofuel. Placing the hot junction directly on top of the heater would result in a more complex process, thus metal pads are used instead for spreading heat to the hot junction (Figure 4c). However, this metal pad is also directly in thermal contact with the biofuel, thus reducing the temperature gradient. Coating the metal pad with an insulating layer proved a suitable solution (Figure 4d).
3. Simulation Results
As indicated in Table 1, the RC product of the system can be used to calculate the time constant of the system. The thermal conductivity and heat capacity in the thermal domain can be regarded as resistor and capacitor respectively and determine the liquid-specific low-pass cut-off frequency in a frequency scan. In thermal domain, resistance (R) and capacitance (C) can be regarded as
and
where k is the thermal conductivity of the liquids, and can be regarded as electrical resistivity in resistance definition; L is the effective length where temperature reaches to its −3 dB point which varies for different liquids; A is the cross-sectional area of thermal conduct. is the heat capacity at constant pressure; is the density of liquids; and V is effective volume of heat transfer. Therefore, the cut-off time constant can be calculated though the thermal properties of each liquids. The cut-off time constants of ethanol, gasoline, water, and air were calculated as 0.11 s, 0.195 s, 0.0469 s and 0.0033 s respectively. Calculations reveal a cut-off frequency for ethanol, gasoline and water at 9.09 Hz, 5.13 Hz and 21.32 Hz respectively.
4. Fabrication Process
The fabrication is based on surface micromachining on 4-inch silicon wafers (Figure 5). Firstly, a 5 μm PECVD SiO2 layer is deposited for use as the sacrificial layer, which is followed by the deposition of a 500 nm thick LPCVD SiN and 300 nm thick polysilicon layers for use as the membrane and device layer respectively. Several patterning, implantation and etching were performed to realize the heaters and sensors. A passivation layer (100 nm SiN) is deposited and patterned to realize the contact openings. Subsequently, aluminum was deposited and patterned for the interconnects. Finally, the SiN layer was patterned with an array of openings, which were used to enable access of the sacrificial etchant.
5. Conclusions
This paper introduces thermal impedance spectroscopy as a versatile concept for liquid fuel sensing application. The design of optimized sensor structures is presented. Simulations confirm the potential for uniquely determining the water, ethanol and gasoline concentrations using a frequency scan in the 1–100 Hz range. Finite element simulation results have been used for designing a suitable MEMS sensor. Fabrication is on-going. Future work includes characterization on actual biofuels.
Author Contributions
B.J.: design and evaluation, M.G.: fabrication, A.B., J.V. and R.F.W. concept and system definition.
Acknowledgments
This research was supported by a grant from the Ford Poling Challenge. No funds were received for covering the costs to publish in open access.
Conflicts of Interest
The authors declare no conflict of interest. The founding sponsors had no role in the design of the study; in the collection, analyses, or interpretation of data; in the writing of the manuscript, and in the decision to publish the results.
References
- Middelburg, L.M.; de Graaf, G.; Ghaderi, M.; Bossche, A.; Bastemeijer, J.; Visser, J.H.; Soltis, R.E.; Wolffenbuttel, R.F. Optical spectroscopy for biofuel composition sensing. Procedia Eng. 2016, 168, 55–58. [Google Scholar] [CrossRef]
- Park, B.K.; Yi, N.; Park, J.; Kim, D. Note: Development of a microfabricated sensor to measure thermal conductivity of picoliter scale liquid samples. Rev. Sci. Instrum. 2012, 83, 106102. [Google Scholar] [CrossRef] [PubMed]
- Yoshimitsu, Z.; Nakajima, A.; Watanabe, T.; Hashimoto, K. Effects of surface structure on the hydrophobicity and sliding behavior of water droplets. Langmuir 2002, 18, 5818–5822. [Google Scholar] [CrossRef]
- Gao, J.; Zhao, J.; Liu, L.; Xue, W. Dimensional effects of polymer pillar arrays on hydrophobicity. Surf. Eng. 2016, 32, 125–131. [Google Scholar] [CrossRef]
Figure 1.
(a) Cross section of the structure: a p-type polysilicon strip (red block) is used as both heater and resistive temperature sensor, while another two polysilicon strips (light yellow blocks) at a well-defined spacing from the heater is used to enable temperature difference sensing and (b) electrical analogy of the thermal system.

Figure 2.
Heat flux into ethanol as a function of lateral position of the structure shown in the insert. The bottom of the heater is used as the vertical reference position for the y-axis. The under-etched cavity (width in μm) is assumed to be sealed and filled with air.
Figure 2.
Heat flux into ethanol as a function of lateral position of the structure shown in the insert. The bottom of the heater is used as the vertical reference position for the y-axis. The under-etched cavity (width in μm) is assumed to be sealed and filled with air.

Figure 3.
The lateral temperature distribution of the structure shown in the insert in case the under-etched cavity is filled with air, and the biofuel is pure ethanol (distances in μm).
Figure 3.
The lateral temperature distribution of the structure shown in the insert in case the under-etched cavity is filled with air, and the biofuel is pure ethanol (distances in μm).

Figure 4.
(a) Three parallel polysilicon strips are placed on the surface of silicon oxide, with the heater in the middle and two symmetric sensors on either side and (b) thermopile with the hot junction close to the heater and the cold junction away from the heater (c) metal pads connecting the heater and the hot junction and (d) coated metal pad.

Figure 5.
Fabrication process: (a) deposition of the SiO2, SiN, and polysilicon layers; (b) patterning, etching, and doping of the polysilicon layer; (c) passivation and deposition and patterning of the interconnects; (d) patterning of the sacrificial access holes; (e) sacrificial etching of the SiO2 layer.


Table 1.
Thermal Properties of EGW at room temperature.
| Liquid | Thermal Cond. [W/(mK)] | Specific Heat Capacity [kJ/(kgK)] |
|---|---|---|
| Ethanol | 0.179 | 2.443 |
| Gasoline | 0.15 | 2.22 |
| Water | 0.58 | 4.182 |
| E85 | 0.175 | 2.41 |
| Air | 0.026 | 1.005 |
Publisher’s Note: MDPI stays neutral with regard to jurisdictional claims in published maps and institutional affiliations. |
© 2017 by the authors. Licensee MDPI, Basel, Switzerland. This article is an open access article distributed under the terms and conditions of the Creative Commons Attribution (CC BY) license (https://creativecommons.org/licenses/by/4.0/).
Share and Cite
MDPI and ACS Style
Jiang, B.; Ghaderi, M.; Bossche, A.; Visser, J.H.; Wolffenbuttel, R.F. Microstructure for Thermal Impedance Spectroscopy for Biofuel Composition Measurement. Proceedings 2017, 1, 396. https://doi.org/10.3390/proceedings1040396
AMA Style
Jiang B, Ghaderi M, Bossche A, Visser JH, Wolffenbuttel RF. Microstructure for Thermal Impedance Spectroscopy for Biofuel Composition Measurement. Proceedings. 2017; 1(4):396. https://doi.org/10.3390/proceedings1040396
Chicago/Turabian StyleJiang, Bo, Mohammadamir Ghaderi, Andre Bossche, Jaco H. Visser, and Reinoud F. Wolffenbuttel. 2017. "Microstructure for Thermal Impedance Spectroscopy for Biofuel Composition Measurement" Proceedings 1, no. 4: 396. https://doi.org/10.3390/proceedings1040396