1. Introduction
Bioelectrical sensors are of high interest due to non-invasive label-free techniques for in vitro monitoring of biological events and due to simplicity and fast response in real time. Presently, there are two analytic approaches which employ either optical or electronic signal processing [
1]. Both these approaches reached state of the art in a transducer type which converts a stimulus-induced cellular response into the quantifiable signal (i.e., biosensor signal). From the broad family of electronic systems, impedance measurements seem to be one of the simplest and still a powerful method for monitoring cellular signals during the cell cultivation. As presented in many reports, the monitored impedance signal is sensitive not only to ionic currents but also to cell growth stages (i.e., cell attachment, spreading, shape, proliferation, differentiation and communication) [
2].
Diamond is proposed as a promising material for life science and regenerative medicine due to its biocompatibility, chemical stability and favorable combination of optical, mechanical and electrical properties. In addition, its surface can be covalently terminated by specific atoms or molecules which control the cell occupation, adhesion and cell differentiation [
3]. In our previous studies, we have already introduced an optically transparent surface-conductive diamond thin film as a functional layer in impedance sensors for biological studies [
4] and recognition of gas and chemical molecules [
5,
6]. In this study, an impedance sensor with the functional diamond layer deposited on gold interdigitated electrodes is employed to electrically and optically monitor the activity of adipose-derived stem cells.
2. Materials and Methods
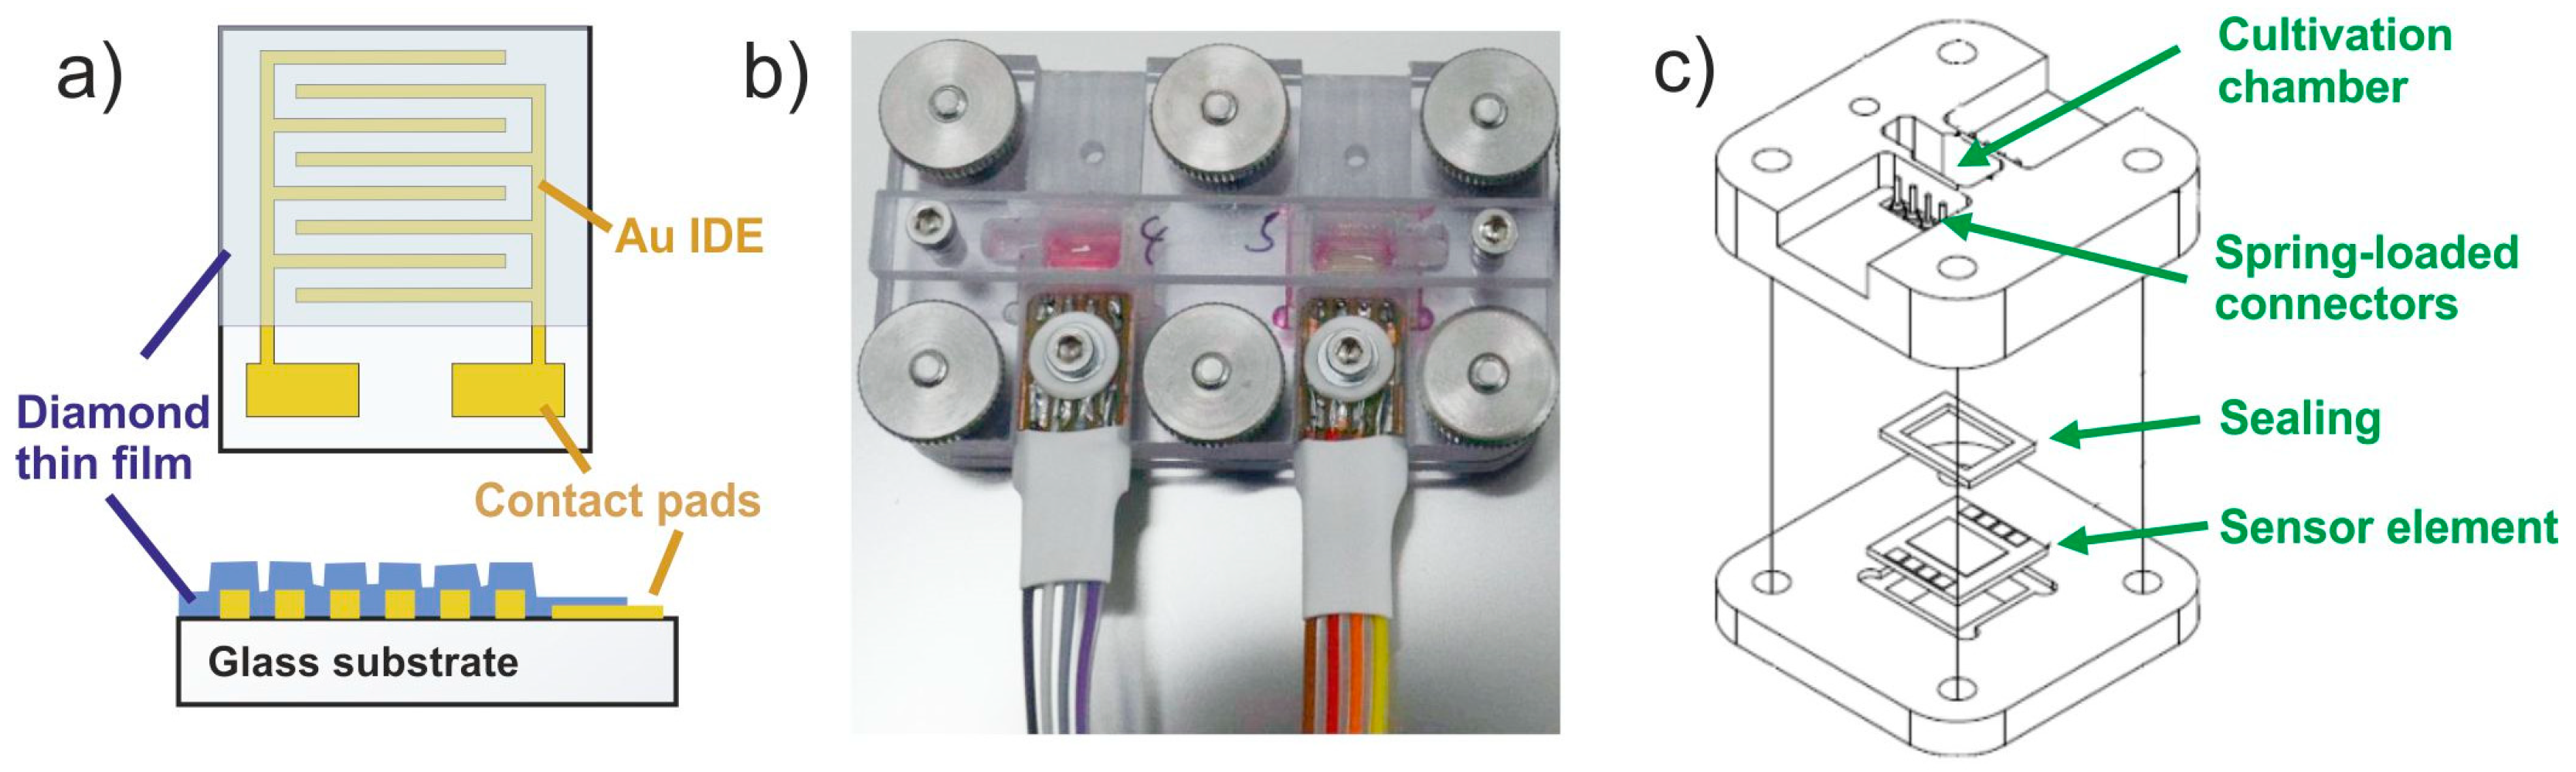
The transducer of the sensor is represented by metal composite interdigitated electrodes (IDEs) (10 nm Ti and 80 nm Au) evaporated on a quartz substrate (Corning XG) (
Figure 1a). The width/gap of electrode periodicities was 200 µm. Samples were coated with approx. 100 nm thick diamond layer using a linear antenna pulsed microwave plasma chemical vapor deposition system [
7]. The deposition conditions were as follows: microwave power 2 × 1700 W, pressure 0.1 mbar, gas mixture 200/5/20 sccm of H
2/CH
4/CO
2, temperature 400 °C and process time 50 h.
The impedance measurements were performed in chambers designed for the static cultivation (
Figure 1b,c) with integrated unit for optical monitoring of cells during their cultivation. The cultivation area was 0.7 cm
2 with 500 µL reservoir for medium. The adipose-derived stem cells (ASC) (i.e., human cells isolated from lipoaspirate obtained by liposuction) were seeded into the chamber with an initial density approx. 28,000 cells/cm
2 in a DMEM medium with 10% of fetal bovine serum (FBS). Then the chambers were installed into time-lapse microscope system and connected to vector impedance analyzer (Bode 100, OMICRON electronics GmbH). The impedance spectra were collected in a frequency range from 100 Hz to 50 kHz for 27 h cultivation.
Simultaneously to these experiments, reference measurements with the same cultivation conditions were performed with an xCELLigence sensor (Roche Applied Science) which uses circular-shape Au IDE structures [
2]. This system provides the so-called cell index defined as (Z
i-Z
0)/const, where Z
i is the impedance measured at time
i and Z
0 is the starting impedance. Here the measurement frequencies are limited to three discrete frequencies: 10 kHz, 25 kHz, and 50 kHz.
3. Results and Discussion
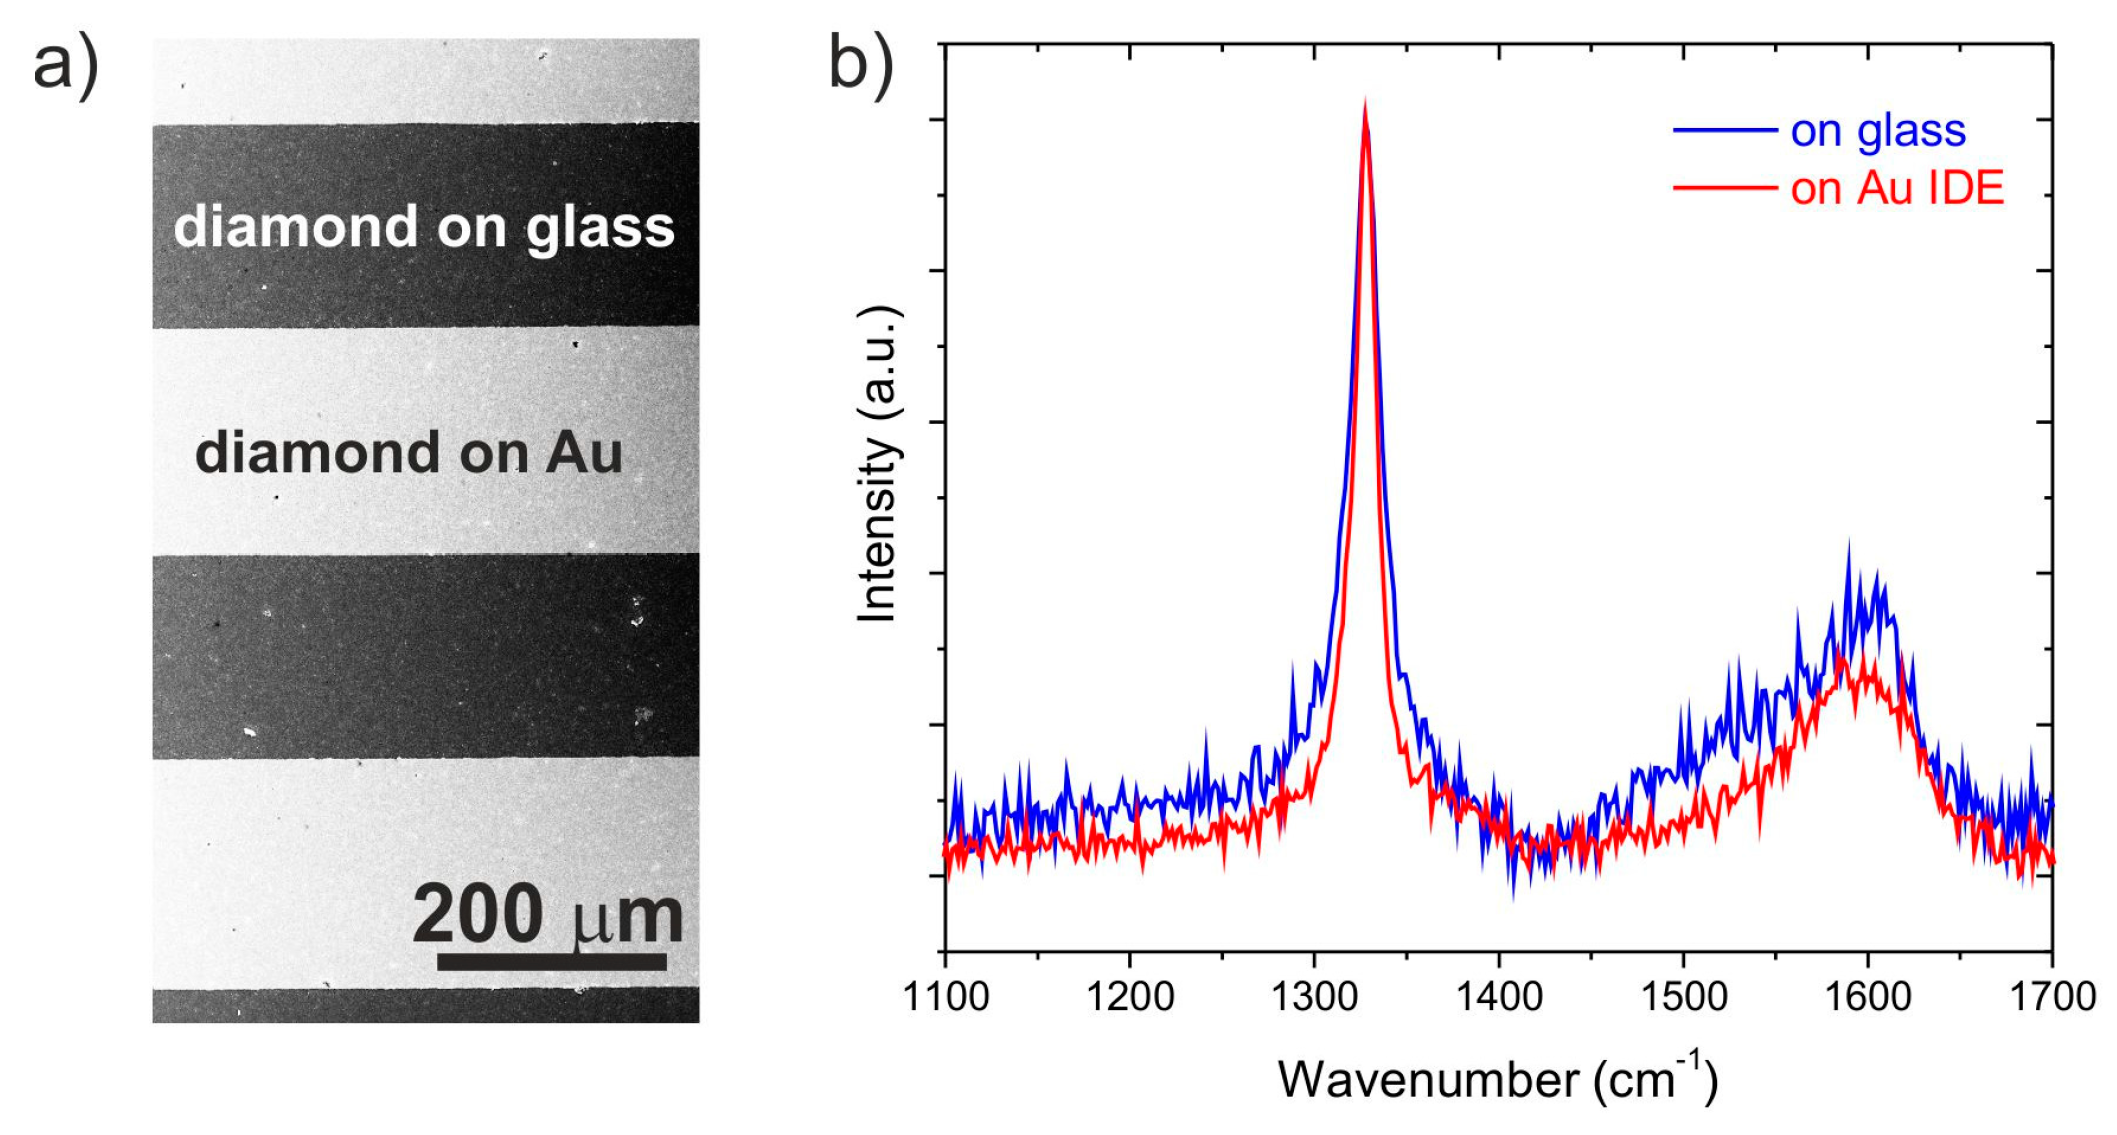
Figure 2a shows SEM image of a diamond film grown on the active sensor area. The whole sensor area was homogenously covered with the diamond thin film with thickness approx. 100 nm. The brighter regions represent the diamond film grown on Au IDEs and darker regions correspond to the film grown on the quartz substrate. The diamond character of the deposited film was confirmed by Raman spectra measured at two different positions: on a quartz substrate and Au layer (i.e., on interdigitated electrodes). Both Raman spectra were similar and had typical features of CVD diamond films [
8]. The spectra consist of a sharp diamond-peak centered at ~1332 cm
−1 which is attributed to sp
3 carbon bonds. Broad bands centered at 1350 cm
−1 (D-band) and at ~1590 cm
−1 (G-band) are related to sp
2 carbon bonds which are commonly localized at grain boundaries (
Figure 2b).
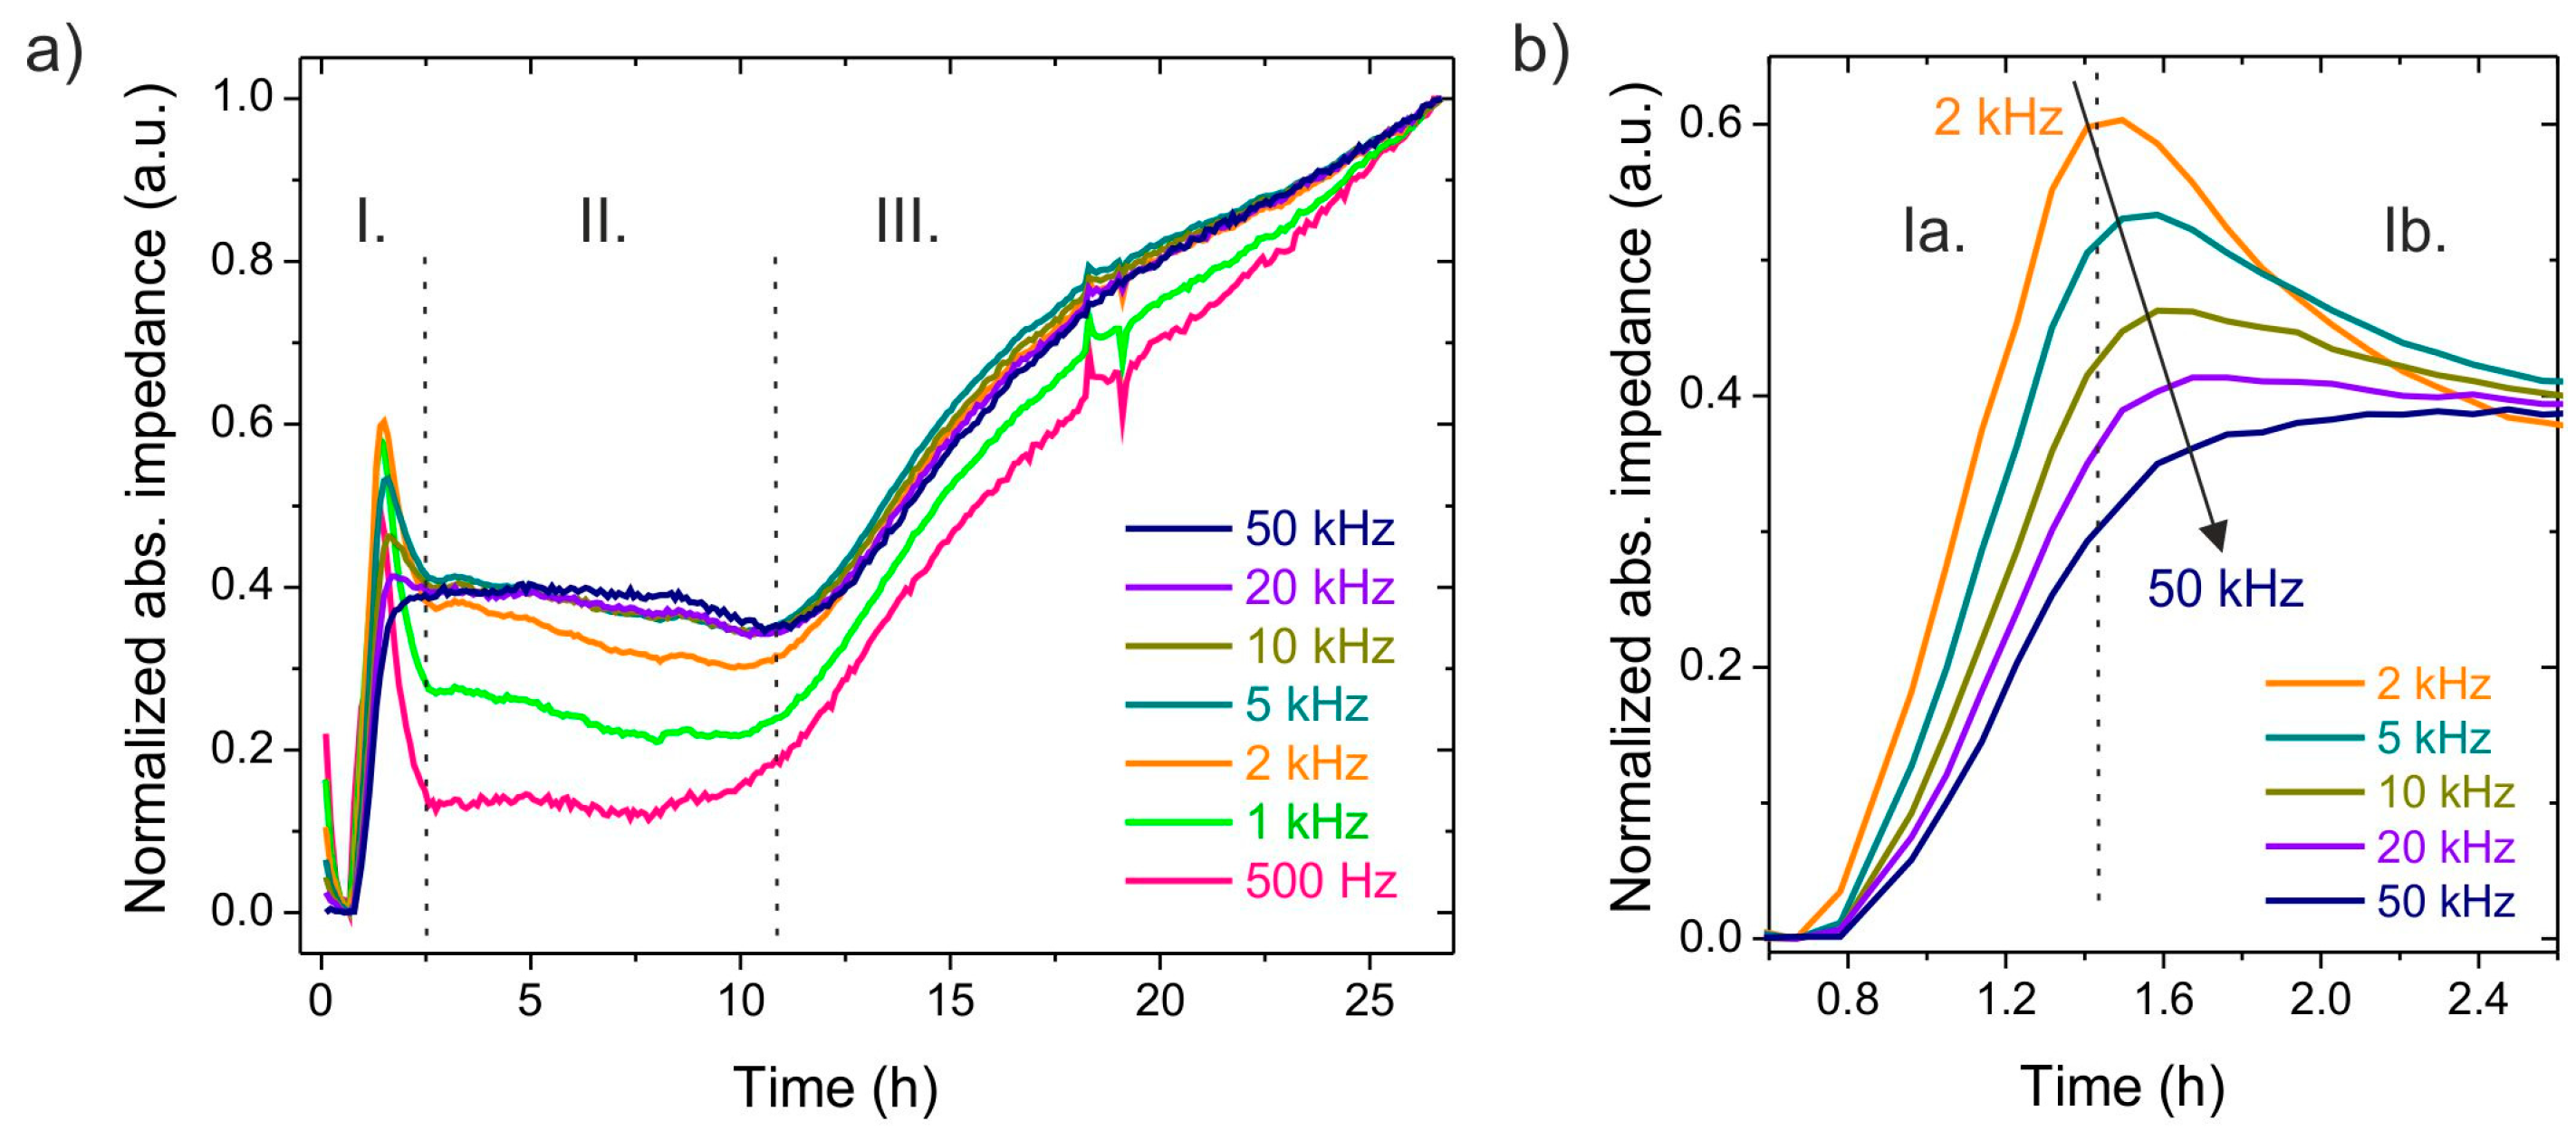
Figure 3 shows normalized absolute impedance spectra (|Z|) of the diamond coated Au sensor during ASC cells cultivation in the medium. Spectra are plotted for frequencies varied from 500 Hz to 50 kHz. Three different regions can be distinguished. In the first region (up to ~2.5 h), a sharp increase of |Z| followed by a short decrease is observed at low frequencies (see detail view in
Figure 3b). For the cultivation time from 2.5 to 11 h (region II.), the normalized impedance spectra saturated and have a constant value. In the last region (time > 11 h), the normalized impedance increased monotonously reaching nearly the same value after 25 h (
Figure 3a).
The rapid increase of |Z| at the beginning of measurements (region I) should be attributed to the temporary period, during which the cells are added to the cultivation medium, they are falling down and are deposited onto the sensor active area. During this temporary period, they can migrate on and start to adhere to the substrate. If the initial number of added cells is enough low and there is still reaming a space between them on the sensor area, the cells will proliferate, causing a gradual yet steady increase in |Z|. When the cells reach confluence, the |Z| value is at a constant value (region II), reflecting the fact that the monitored active sensor area, which is in touch with bulk media, is fully covered. The increase of |Z| in the region III should reflect change in the cultivation medium (e.g., due to the medium evaporation or the change in pH caused by cell metabolic activity, etc.).
The only difference between |Z| measured at different frequencies was observed in the first region related to the peak intensity (at ~1.4 h). As abovementioned, this |Z| peak maximum is related to the fully covered sensing surface by cells [
9]. While at low frequencies (i.e., 500 Hz or 1 kHz,
Figure 3a) this peak was significant, its intensity decreases with increasing frequencies and disappeared at high frequencies (50 kHz) (
Figure 3b). At low frequencies, most of the electrical current flow through the solution channels under and between adjacent cells, while at higher frequencies, current capacitively couples and directly flow through the insulating cell membranes. It is known that the high-frequency impedance measurements are preferably affected by the cell coverage, whereas the low frequency measurement reflects changes in the space either under or between the cells [
9,
10]. Thus, the decrease of the |Z| observed at lower frequencies in the region II should be related to the changed cell morphology, cell adhesion or even it should be also caused by the cell delamination from the diamond surface. To note, reference measurements performed by the xCelligence system (not shown here) showed similar dependences as measurements provided on the diamond-based impedance sensors.

 ,
, 


