Abstract
The application of sub-terahertz waves is being considered as a method to view the corrosion status of internal steel bars. In this study, reflectance intensities were measured for six specimens with different moisture contents using electromagnetic waves from 7.5 to 17.5 GHz. The results showed that the differential reflectance intensity decreased with increasing water content. An equation for estimating the water content at a cover thickness of 10 mm was also calculated. Regarding chloride ion content, no common trend was observed, and it was confirmed that there was a trend in the amount of chloride ions at each cover thickness.
1. Introduction
Buildings and civil engineering structures made of reinforced concrete are important components of social infrastructure, and preventive maintenance before deterioration becomes apparent is important for long-term, safe use. Corrosion of steel bars inside concrete is the main cause of deterioration of RC structures, and current nondestructive evaluation methods have limitations in accuracy. The application of sub-terahertz waves [1] is being considered as a method for evaluating rebar corrosion. Hamasaki [2] visualized the rebar and evaluated its corrosion state, and confirming that the rebar could be visualized with a cover thickness up to about 50 mm. Deeper cover thickness measurements are needed for application to actual structures. This study proposes a non-destructive and non-contact method using sub-terahertz waves for estimating the corrosion status of steel bars. It also aims to expand the use of sub-terahertz waves measurement for quantifying water content and chloride ions.
2. Experimental Setup and Methodology
2.1. Measurement Equipment
An overview of the sub-terahertz wave measurement system in reflection measurement is shown in Figure 1.
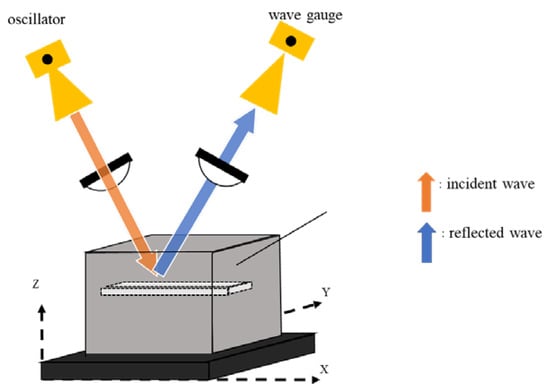
Figure 1.
Measurement system in reflection measurement.
The equipment used to transmit terahertz waves was a microwave vector signal generator, which can transmit frequencies from 7.5 GHz to 24 GHz.
2.2. Test Specimen Details
The mix proportion of concrete is shown in Table 1. The geometries of the test specimens are shown in Figure 2. As shown in the table and figure, a test specimen measuring 100 × 100 × 125 mm was prepared.

Table 1.
Mix proportion of concrete specimens.
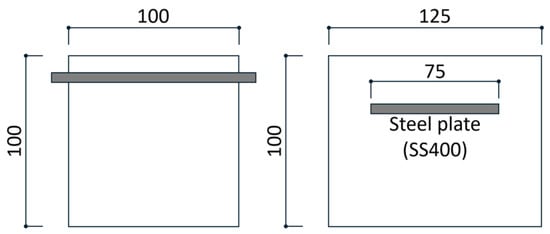
Figure 2.
Geometries of specimens.
The mix design parameters were as follows: maximum coarse aggregate size of 20 mm, slump of 18 cm, water cement ratio of 0.55 and air content of 4.5%. A 5 mm thick SS400 polished steel plate was embedded inside the test specimen.
2.3. Experimental Conditions
Measurements were performed using electromagnetic wave with frequencies ranging from 7.5 to 24 GHz, which are referred in this study as sub-terahertz waves. To evaluate water content, concrete specimens with zero chloride ion content was used. Conversely, to evaluate chloride ion content, specimens in an air-dry state (approximately 2% water content) were used. The surface reflected waves were measured using concrete specimens without an embedded steel plate.
3. Results and Discussion
3.1. Experimental Results: Water Content
The results of the sub-terahertz measurements for the specimen with a cover thickness of 10 mm are shown in Figure 3a. Figure 3b shows the 1 GHz moving average of the data in Figure 3a, which smooths out fluctuations and highlights the overall trend. The results of the surface reflection measurements for the specimen for the same specimen are shown in Figure 3c, and the relationship between frequency and differential reflection intensity for the specimen with for the same specimen is shown in Figure 3d.
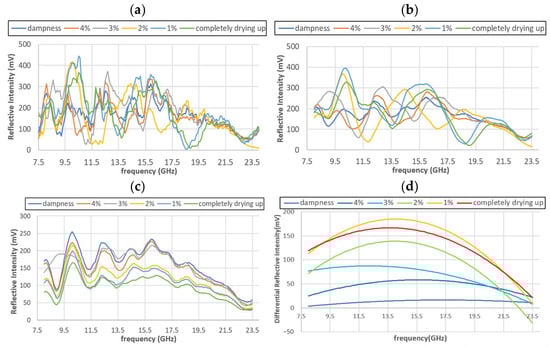
Figure 3.
(a) Relationship between reflection intensity and frequency (raw data). (b) Relationship between reflection intensity and frequency (moving average between 1 GHz). (c) Relationship between surface reflection intensity and frequency (moving average between 1 GHz). (d) Relationship between differential reflection intensity and frequency.
Reflection intensity refers to the reflection of terahertz waves from the steel plate inside the test specimen. Surface reflection intensity refers to terahertz waves reflected from the surface of the test specimen. Figure 3b shows that the peak position is shifted due to the change in moisture content. From Figure 3c, it can be seen that there is no deviation in the peak position in the surface reflection measurement. This suggests that moisture content changed the permeation velocity inside the concrete and due to the difference in refractive index caused by changes in dielectric constant, which caused the displacement. Due to the peak misalignment, the difference between the simple reflection measurement results and the surface reflection measurement results does not accurately measure the reflection intensity from the steel plate inside the concrete. The effect of moisture content and differential reflection intensity for each frequency is shown in Figure 3d. From the diagram, it can be seen that the differential reflection intensity varies in a broad peak. Also, the differential reflectance intensity decreases with increasing moisture content. The difference in differential reflectance intensity produced by the difference in moisture content is influenced by the moisture content. The wider the difference in differential reflection intensity, the larger the difference is considered to be. The 13.5 GHz and 15.5 GHz frequency bands are particularly susceptible. On the other hand, the effect of moisture content is small at 20 GHz, where the difference in differential reflection intensity produced by changes in moisture content is small.
From Figure 4a, the difference in differential reflectance intensity is small between the results for the dry state and 1% moisture content. Therefore, the estimation of moisture content is conducted excluding the dry state. Approximate equations were calculated from the relationship between moisture content and differential reflectance intensity for each frequency. The results are shown in Figure 4b.
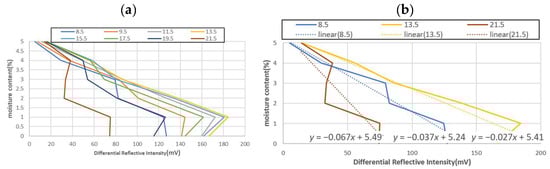
Figure 4.
(a) Relationship between differential reflection intensity and moisture content at different frequencies. (b) Relationship between differential reflectance intensity and moisture content at different frequencies, including approximate equations.
All approximate equations have an intercept of about 5.4, with different slopes. From these results, the water content of the specimen with a cover thickness of 10 mm can be obtained using Equation (1). The differential reflectance intensity of the specimens with a cover thickness of 10 m at 13.5 GHz was found to be small with the change in cover thickness.
where
- z: moisture content (%)
- : Frequency (GHz)
- : differential reflection intensity (mV)
3.2. Experimental Results: Chloride Ion
For chloride ions, the differential reflection intensity is maximum at 13.5 GHz for a cover thickness of 10 mm. For a cover 20 mm thick, the differential reflectance is maximum at 1.2 kg/m3 of chloride ions at all frequencies and minimum at 0.6 kg/m3. For a 30 mm cover thickness, the maximum was observed at 0.6 kg/m3 and the minimum at 1.2 kg/m3.
4. Conclusions
In this study, reflection measurements were performed on specimens using sub-terahertz waves from 7.5 to 24 GHz, and a formula was obtained to estimate the water content from the frequency and differential reflection intensity for a cover thickness of 10 mm. The trend of change in chloride ion content at each cover thickness was also checked. This result contributes to the realization of nondestructive estimation of moisture content using sub-terahertz waves.
Author Contributions
Methodology, K.T. and K.I.; Formal analysis, K.T., S.A. and R.K.; Investigation, K.T. and S.A.; Writing—Original Draft, S.A.; Writing—Review & Editing, D.S., T.N. and A.T.; Supervision, H.H. and T.T. All authors have read and agreed to the published version of the manuscript.
Funding
This research received no external funding.
Institutional Review Board Statement
Not applicable.
Informed Consent Statement
Not applicable.
Data Availability Statement
The data that support the finding of this study are available from the corresponding author upon reasonable request.
Conflicts of Interest
Author D.S. is employed by the company Constec Engi, Co. The remaining authors declare that the research was conducted in the absence of any commercial or financial relationships that could be construed as a potential conflict of interest.
References
- Kobayashi, C.; Nishiwaki, T.; Tanabe, T.; Oohashi, T.; Hamasaki, H.; Hikishima, S.; Tanak, A.; Arita, K.; Fujii, S.; Sato, D.; et al. Non-destructive testing of reinforced concrete structures using Sub-terahertz reflected waves. Dev. Built Environ. 2024, 18, 100423. [Google Scholar] [CrossRef]
- Hamasaki, H.; Hikishima, S.; Tanabe, T.; Sato, D.; Nishiwaki, T.; Kurashina, R. Study on Non-Destructive and Non-contact Evaluation Method for Rebar Corrosion in Concrete Using Sub-Terahertz Waves. J. JSEM 2024, 24, 50–58. (In Japanese) [Google Scholar]


Disclaimer/Publisher’s Note: The statements, opinions and data contained in all publications are solely those of the individual author(s) and contributor(s) and not of MDPI and/or the editor(s). MDPI and/or the editor(s) disclaim responsibility for any injury to people or property resulting from any ideas, methods, instructions or products referred to in the content. |
© 2025 by the authors. Licensee MDPI, Basel, Switzerland. This article is an open access article distributed under the terms and conditions of the Creative Commons Attribution (CC BY) license (https://creativecommons.org/licenses/by/4.0/).