Method for Estimation of CO2 Gains from Persons in Builidings †


Abstract
:1. Introduction
2. Material and Method
3. Results and Discussion
4. Conclusions
Author Contributions
Acknowledgments
Conflicts of Interest
References
- Śmiełowska, M.; Marć, M.; Zabiegała, B. Indoor air quality in public utility environments—A review. Environ. Sci. Pollut. Res. Int. 2017, 24, 11166–11176. [Google Scholar] [CrossRef] [PubMed]
- ASHRAE Standard 62-2001; ASHRAE: Atlanta, GA, USA, 2001.
- Luo, M.; Zhou, X.; Zhu, Y.; Sundell, J. Revisiting an overlooked parameter in thermal comfort studies, the metabolic rate. Energy Build. 2016, 118, 152–159. [Google Scholar] [CrossRef]
- Orava, J.; Nuutila, P.; Lidell, M.E.; Oikonen, V.; Noponen, T.; Viljanen, T.; Scheinin, M.; Taittonen, M.; Niemi, T.; Enerbäck, S.; et al. Different Metabolic Responses of Human Brown Adipose Tissue to Activation by Cold and Insulin. Cell Metab. 2011, 14, 272–279. [Google Scholar] [CrossRef]
- Persiliy, A.; de Jonge, L. Carbon dioxide generation rates for building occupants. Indoor Air 2017, 27, 868–879. [Google Scholar] [CrossRef] [PubMed]
- Ainsworth, B.E.; Haskell, W.L.; Herrmann, S.D.; Meckes, N.; Bassett, D.R., Jr.; Tudor-Locke, C.; Greer, J.L.; Vezina, J.; Whitt-Glover, M.C.; Leon, A.S. The Compendium of Physical Activities Tracking Guide. Healthy Lifestyles Research Center, College of Nursing & Health Innovation, Arizona State University. 2011. Available online: https://sites.google.com/site/compendiumofphysicalactivities/ (accessed on 16 October 2018).
- Ainsworth, B.E.; Haskell, W.L.; Herrmann, S.D.; Meckes, N.; Bassett, D.R., Jr.; Tudor-Locke, C.; Greer, J.L.; Vezina, J.; Whitt-Glover, M.C.; Leon, A.S. Compendium of physical activities: A second update of codes and met values. Med. Sci. Sports Exerc. 2011, 43, 1575–1581. [Google Scholar] [CrossRef] [PubMed]
- Krawczyk, D.A.; Rodero, A.; Gładyszewska-Fiedoruk, K.; Gajewski, A. CO2 concentration in naturally ventilated classrooms located in different climates—Measurements and simulations. Energy Build. 2016, 129, 491–498. [Google Scholar] [CrossRef]
- VIPSKILLS Project (Virtual and Intensive Course Developing Practical Skills of Future Engineers. Strategic Partnerships Erasmus +)—e-Laboratories. Available online: http://vipskills.pb.edu.pl/e-labs (accessed on 16 October 2018).

| Volume (m3) | Number of people | ACH (h−1) | Outdoor Pressure (hPa) | Outdoor Temperature (K) | Outdoor CO2 Concentration (ppm) | Indoor Presure (hPa) | Indoor Temperture (K) | |
|---|---|---|---|---|---|---|---|---|
| Meeting RoomMeasurments 1 | 215 | 23 | 0.37 | 1000 | 262 | 400 | 1000 | 291.5 |
| Meeting RoomMeasurments 2 | 318.8 | 55 | 0.55 | 1020 | 269 | 390 | 1020 | 295 |
| Computer Laboratory 1 | 212.6 | 14 | 0.33 | 975 | 266 | 400 | 977 | 297 |
| Computer Laboratory 2 | 215 | 15 | 0.3 | 1017 | 270 | 390 | 1017.5 | 298 |
| Project Room | 217 | 17 | 0.4 | 976 | 264 | 400 | 976 | 297 |
| Slope m (ppm/h) | g without ACH (g/h) | g without ACH (L/s) | g with ACH (g/h) | g with ACH (L/s) | |
|---|---|---|---|---|---|
| Meeting Room-Measurments 1 | 2115 ± 36 | 35.4 ± 0.6 | 0.00501 ± 0.00009 | 32.5 ±0.6 | 0.0046 ± 0.00009 |
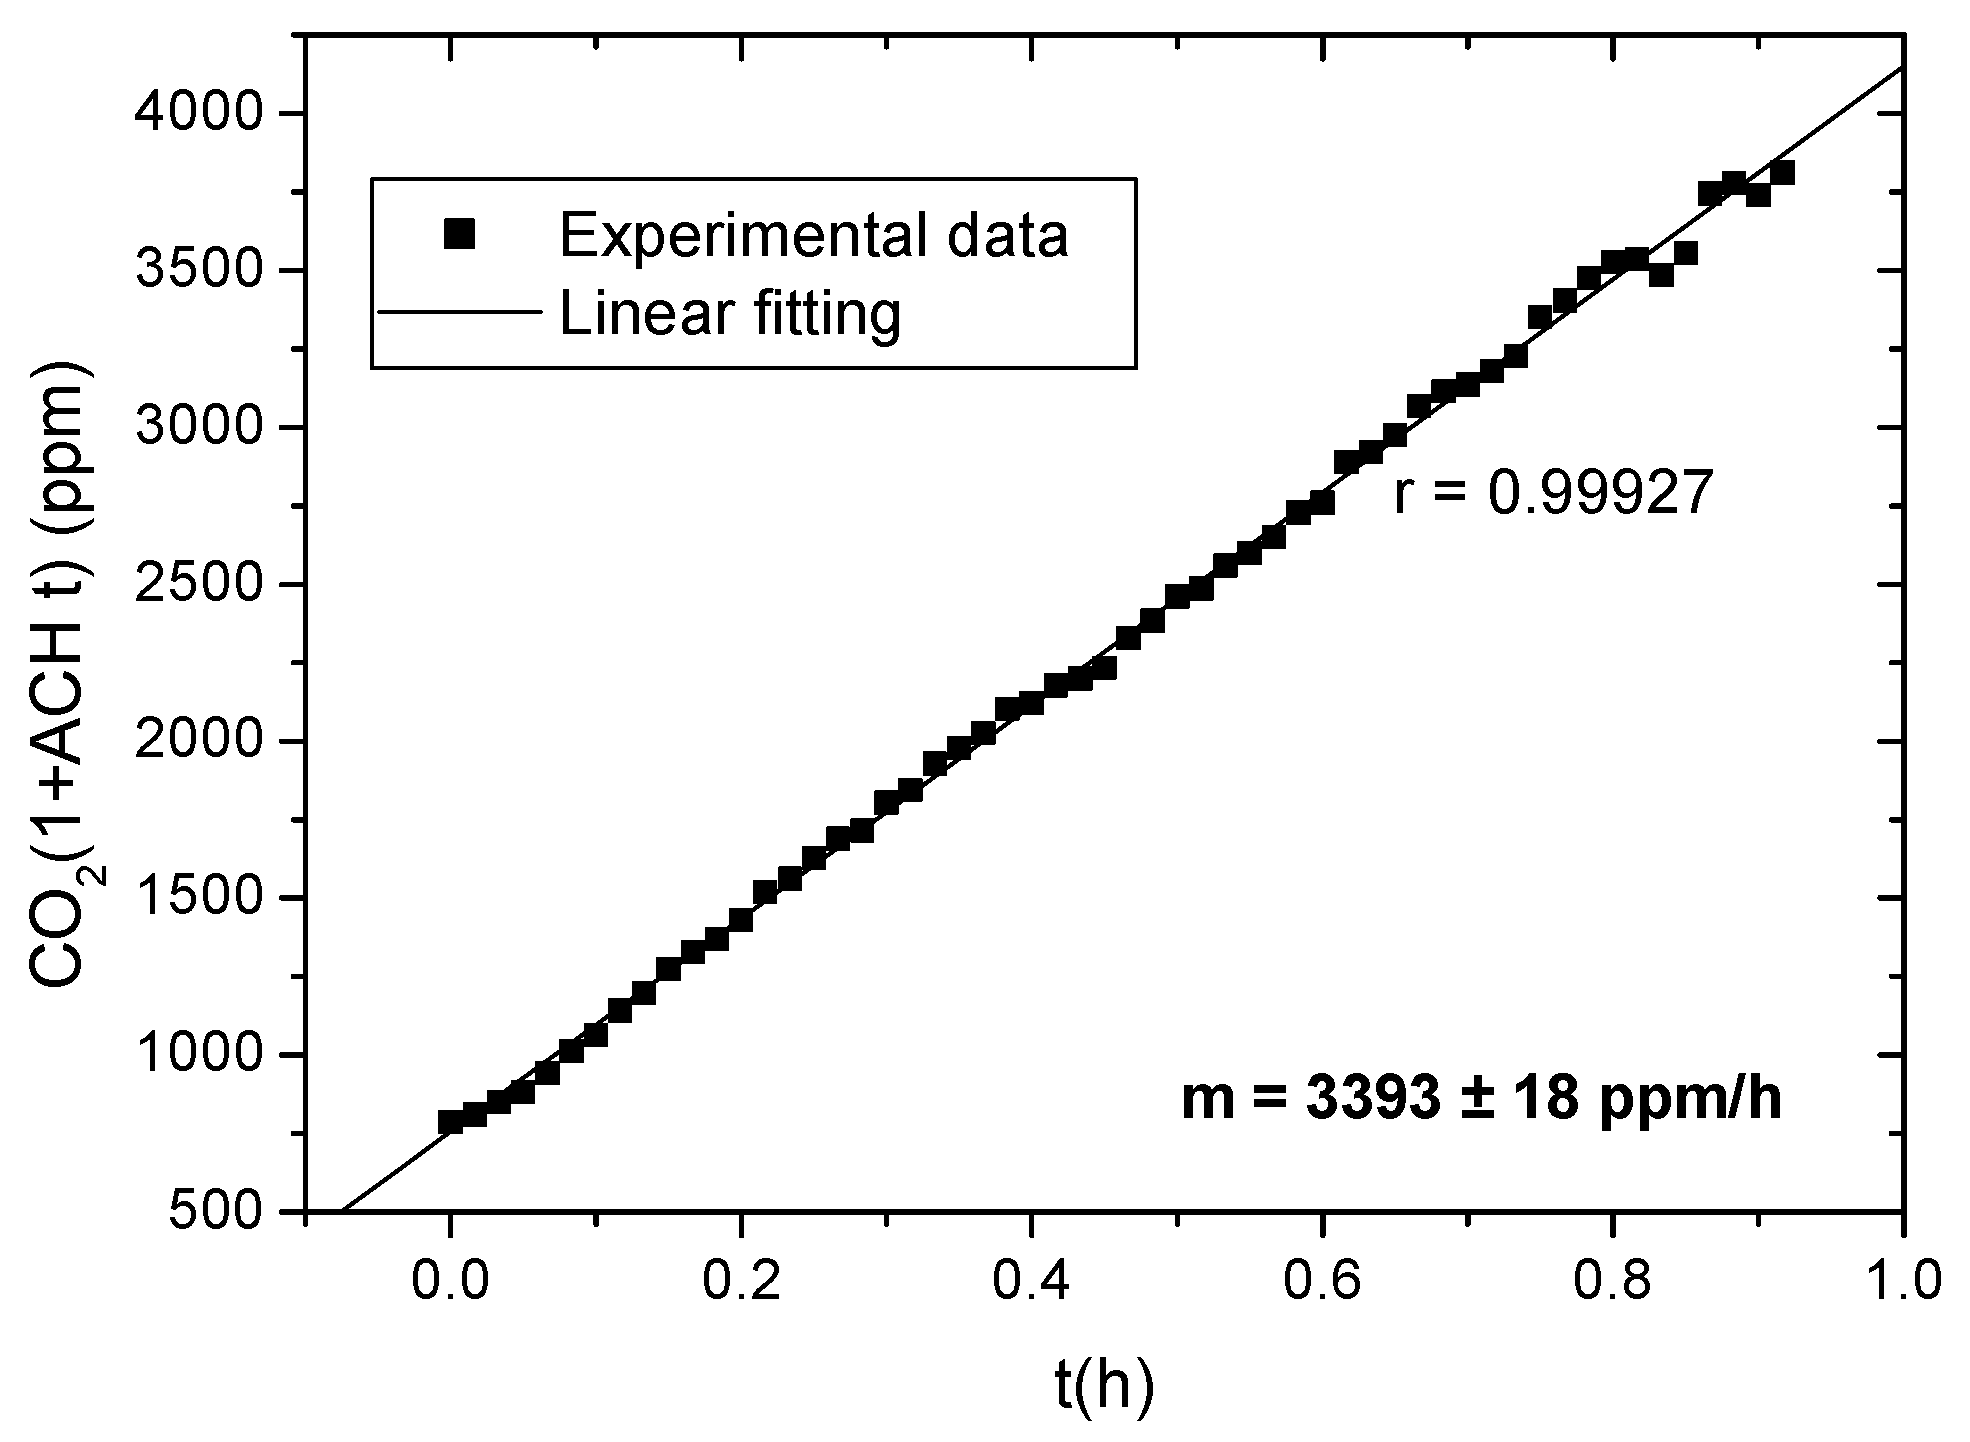
| Meeting Room -Measurments 2 | 3393 ± 18 | 34.87 ± 0.18 | 0.00493 ± 0.00003 | 32.45 ± 18 | 0.00459 ± 0.00003 |
| Computer Laboratory 1 | 1365 ± 11 | 36.10 ± 0.29 | 0.00510 ± 0.00004 | 32.16 ± 0.29 | 0.00455 ± 0.00004 |
| Computer Laboratory 2 | 1286± 11 | 33.32 ± 0.28 | 0.00471 ± 0.00004 | 29.98 ± 0.28 | 0.00424 ± 0.00004 |
| Project Room | 1646 ± 28 | 35.74 ± 0.61 | 0.00505 ± 0.00009 | 31.84 ± 0.61 | 0.00450 ± 0.00009 |
Publisher’s Note: MDPI stays neutral with regard to jurisdictional claims in published maps and institutional affiliations. |
© 2018 by the authors. Licensee MDPI, Basel, Switzerland. This article is an open access article distributed under the terms and conditions of the Creative Commons Attribution (CC BY) license (https://creativecommons.org/licenses/by/4.0/).
Share and Cite
Rodero, A.; Krawczyk, D.A. Method for Estimation of CO2 Gains from Persons in Builidings. Proceedings 2018, 2, 1309. https://doi.org/10.3390/proceedings2201309
Rodero A, Krawczyk DA. Method for Estimation of CO2 Gains from Persons in Builidings. Proceedings. 2018; 2(20):1309. https://doi.org/10.3390/proceedings2201309
Chicago/Turabian StyleRodero, Antonio, and Dorota Anna Krawczyk. 2018. "Method for Estimation of CO2 Gains from Persons in Builidings" Proceedings 2, no. 20: 1309. https://doi.org/10.3390/proceedings2201309
APA StyleRodero, A., & Krawczyk, D. A. (2018). Method for Estimation of CO2 Gains from Persons in Builidings. Proceedings, 2(20), 1309. https://doi.org/10.3390/proceedings2201309