Proceeding Paper

Combining Water Indices for Water and Background Threshold in Landsat Image †

1
Department of Civil Engineering, Kangwon National University, Chuncheon 24341, Korea
2
Institute of Forestry, Pokhara Campus, Tribhuwan University, Pokhara 33700, Nepal
*
Author to whom correspondence should be addressed.
Presented at the 4th International Electronic Conference on Sensors and Applications, 15–30 November 2017; Available online: https://sciforum.net/conference/ecsa-4.
Proceedings 2018, 2(3), 143; https://doi.org/10.3390/ecsa-4-04902
Published: 14 November 2017

Abstract

:
Accurate and frequent update of surface water has been made possible by remote sensing technology. Index methods are mostly used for surface water estimation which separates the water from background based on a threshold value. Generally threshold is a fixed value but can be challenging in case of shades, hills, forest and urban areas. In such case, determination of threshold is done manually which is subjective and areal variation. In order to widen the difference between water and background with easier threshold selection, a combination of multiple water indices can be used. This could widen the gap between classes and the threshold sensitivity can be minimized. In this study, we summed Normalized Difference Water Index (NDWI), Modified NDWI, Water Ratio Index and Normalized Difference Vegetation Index to form a new raster and explore the efficiency of thresholding compared to individual indices on Landsat 8 Operational Land Imager (OLI) image of Nepal. The combined index showed much better separation of water with background and can be further used for automated binary classification of surface water. The process could be very useful in mapping surface water accurately.

1. Introduction

Remote Sensing is a rapidly growing space technology that has been providing significant solutions in the areas of natural resource management and environmental assessments. Accurate and frequent update of surface water has been made possible by these remote sensing technologies.
Numerous water extraction algorithms have been developed and applied for remotely sensed imageries. Statistical pattern recognition techniques including supervised that uses ground truth data [1,2,3,4] and unsupervised classification methods that first searches for endmembers [2,4,5]. Among them, index methods such as Normalized Difference Water Index (NDWI) [6], Modified NDWI (MNDWI) [7], Water Ratio Index [8], Normalized Difference Vegetation Index [9] and others are mostly used for surface water estimation which separates the water and background based on a threshold value. Generally thresholds have fixed value of either 0 or 1 but are challenging in case of shades, hills, forest, urban areas and even coastal lines [10,11].
In such case, determination of threshold is done manually which is subjective and can cause a lot variation in area. In order to widen the difference between water and background and ease the threshold selection, a combination of multiple water indices can be used. This could widen the gap between classes and the threshold sensitivity can be minimized.
In this study, we summed NDWI, MNDWI, WRI and NDVI to form a new raster and explore the efficiency of thresholding compared to individual indices on Landsat 8 Operational Land Imager (OLI) image of Nepal.

2. Experiments

2.1. Test Site

A geographical area bounded between latitude 28°11′27.65′′ N to 28°14′12.64′′ N and longitude 83°54′53.75′′ E to 83°58′16.79′′ E was selected as a test site. The area bounds Phewa Lake, located at an altitude of 742 m in famous tourist city Pokhara. It is most popular and second largest among seven lakes in Pokhara as a tourist spot and many commercial activates happens around them. It covers around 4.43 sq. km. area and has an average depth of 8.6 m and maximum 24 m. The source of the water in these lakes is mostly from monsoon rain and the seepage from the surrounding mountains. The lake is gradually filling up and surface area and volume is decreasing with urban activates around it. One side of the lake is steep sloped dense forest and other side is dense urban area.

2.2. Data

In the study, we used the Level 1 Terrain Corrected (L1T) data acquired by Landsat 8 available from USGS GLOVIS portal. The acquired image of test site was from 1 November 2016. Figure 1 shows the location map with Landsat 8 OLI pansharpened image of the study area.

2.3. Method

In Environment for Visualizing Images (ENVI) software, as a pre-processing step, radiometric calibration was performed and thus converting the digital numbers into at-satellite reflectance. The sub-images containing the lakes area were extracted using the Area of Interest tool in ENVI for economic data size and processing time. Images pre-georeferenced to Universal Transverse Mercator zone 45 North projection using WGS-84 datum were exported into Geographic Tagged Image File Format (GeoTIFF) underwent Fast Line-of-sight Atmospheric Analysis of Hypercubes (FLAASH) atmospheric correction for further analysis.
After pre-processing, the image was used to calculate NDVI, NDWI, and MNDWI indices and then water map according to Table 1. All the water indices were summed to create a final raster that is used for derivation of final water map in the study area with different thresholds.

3. Results and Discussion

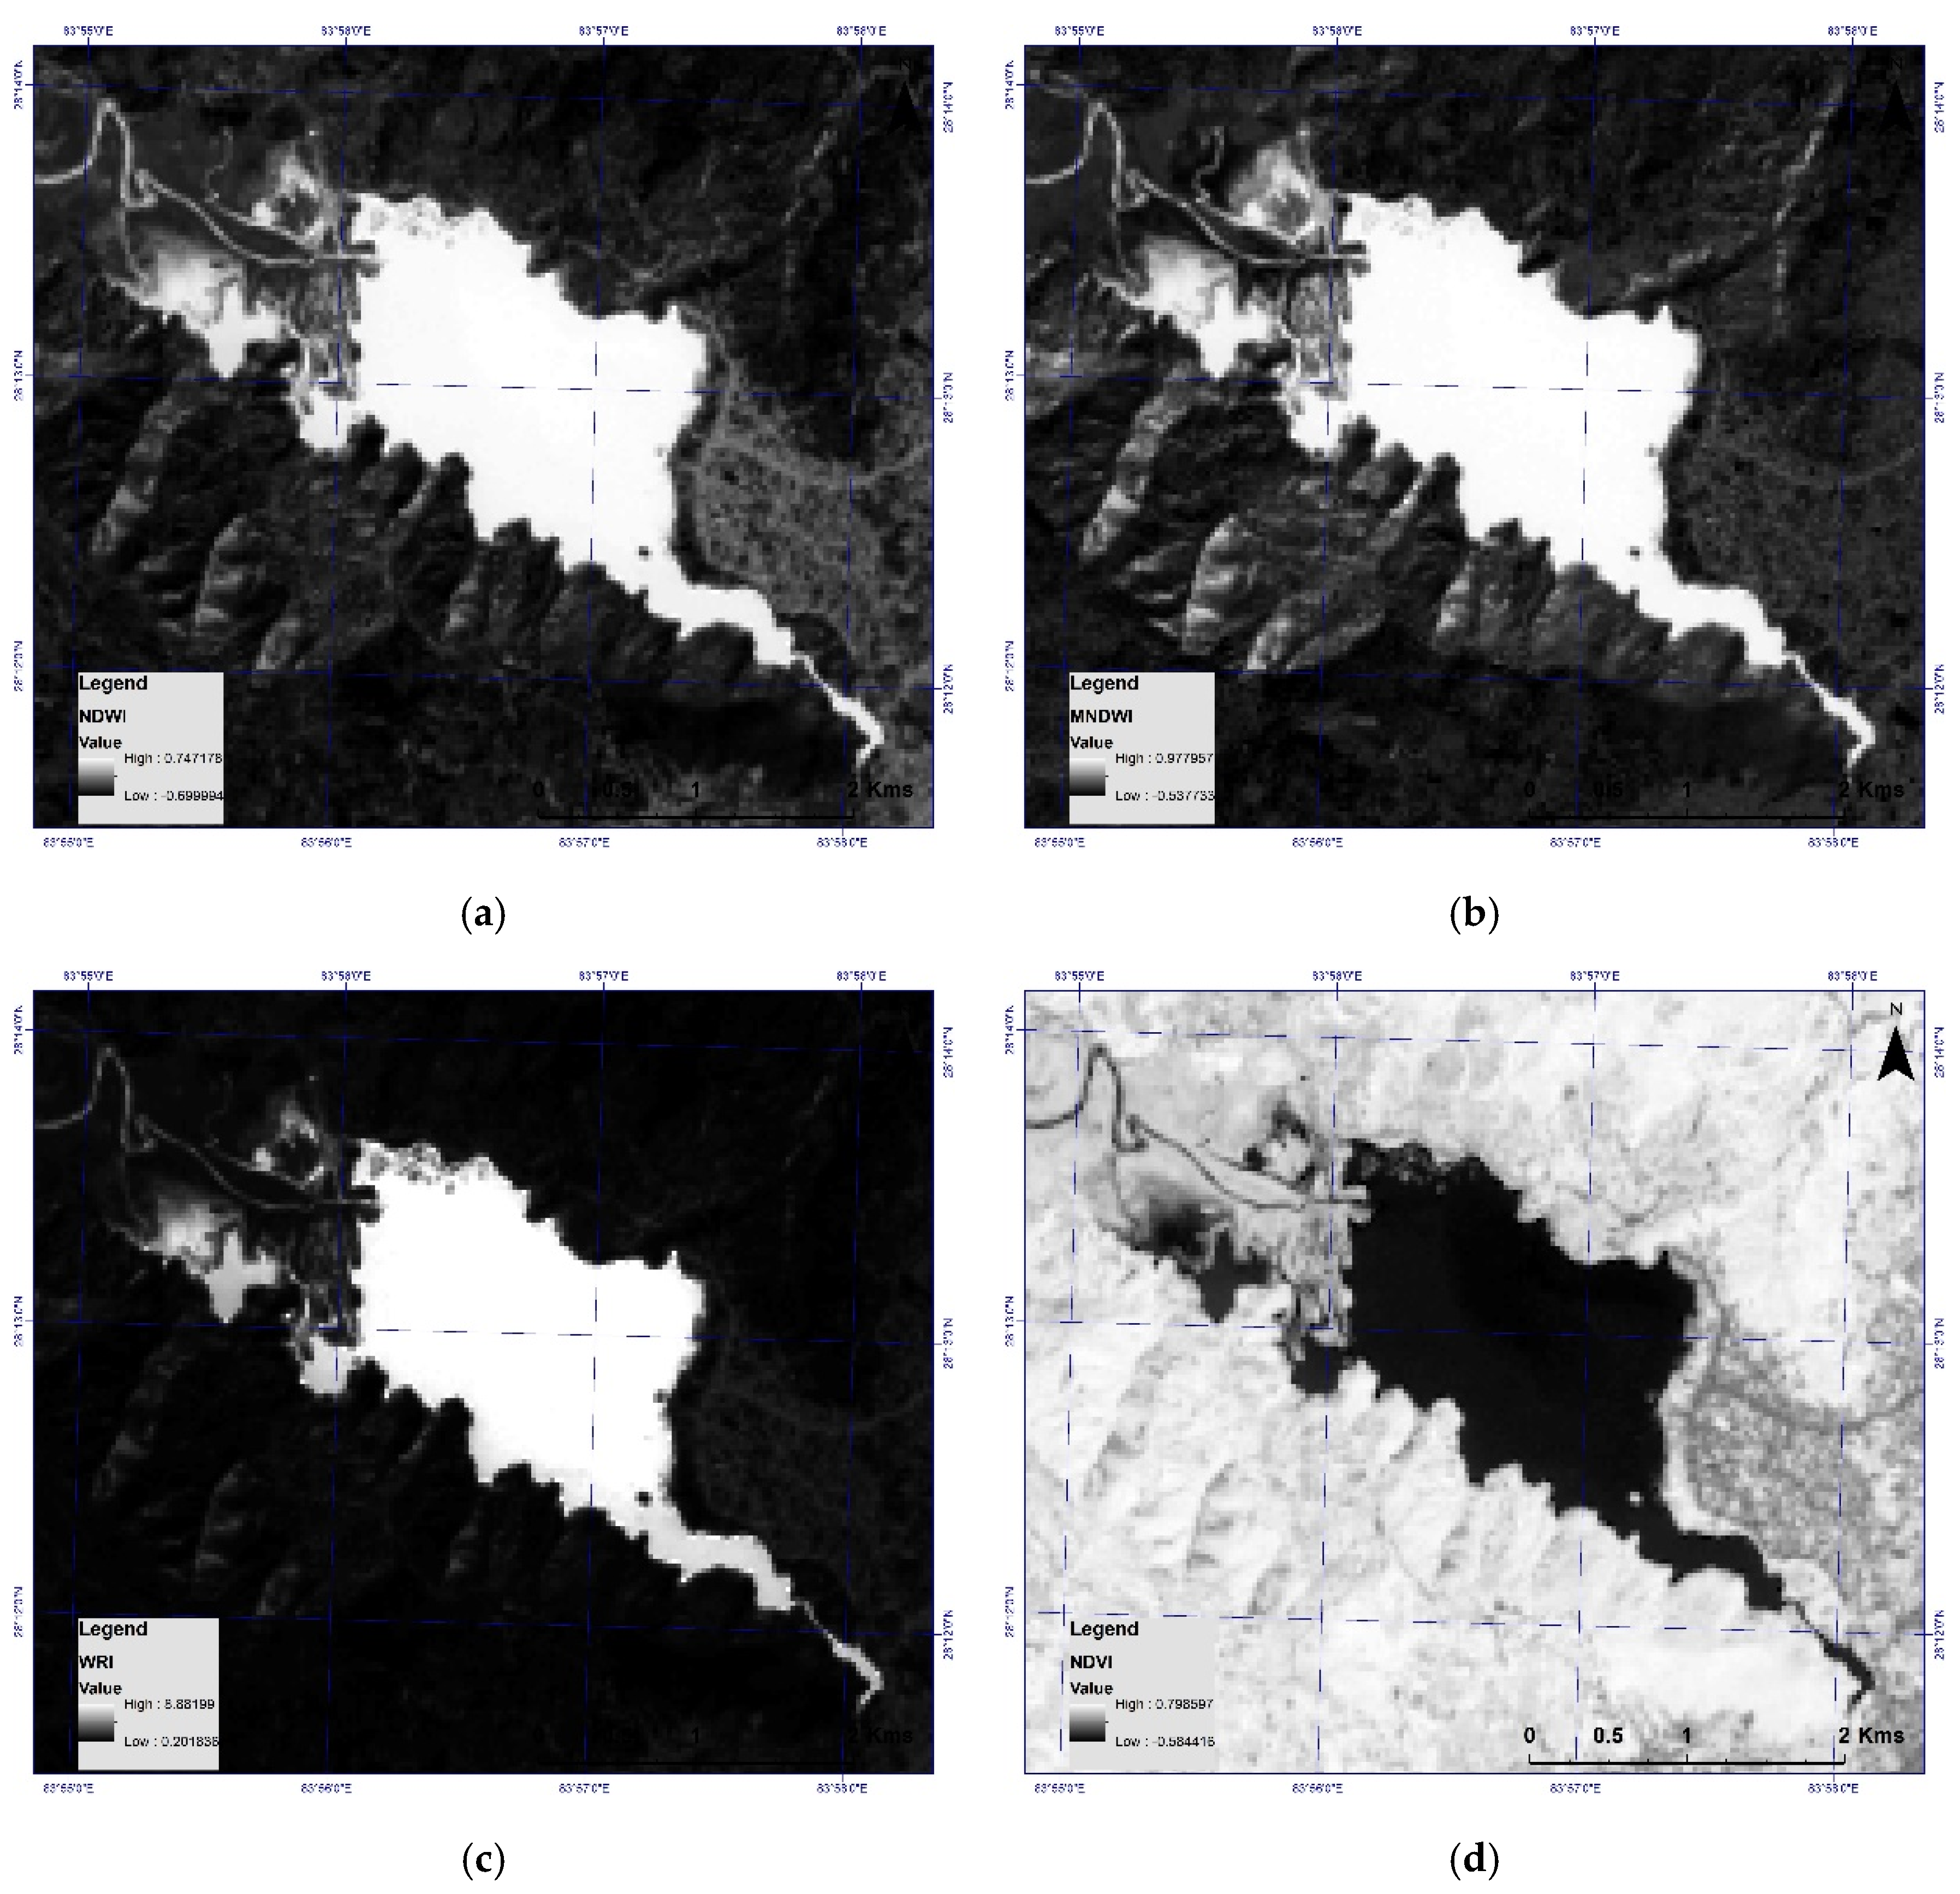
First, the surface water using the selected four index methods were derived according to the threshold values in Table 1. Figure 2 shows the resulted indices map derived from Landsat OLI image using the four indices.
In Figure 3, we can see that the resulting water maps along with histogram of the distribution of pixel values. The default threshold value used for these indices shows that NDVI is well able to separate the water based on zero threshold. Similarly, the NDWI and WRI were able to separate the water bodies well along with some errors in the hills shades and forest areas. The worst performance was shown by the MNDWI, which actually requires extra effort from the expert to separate the water from the shadows, hill shades and dense forests.
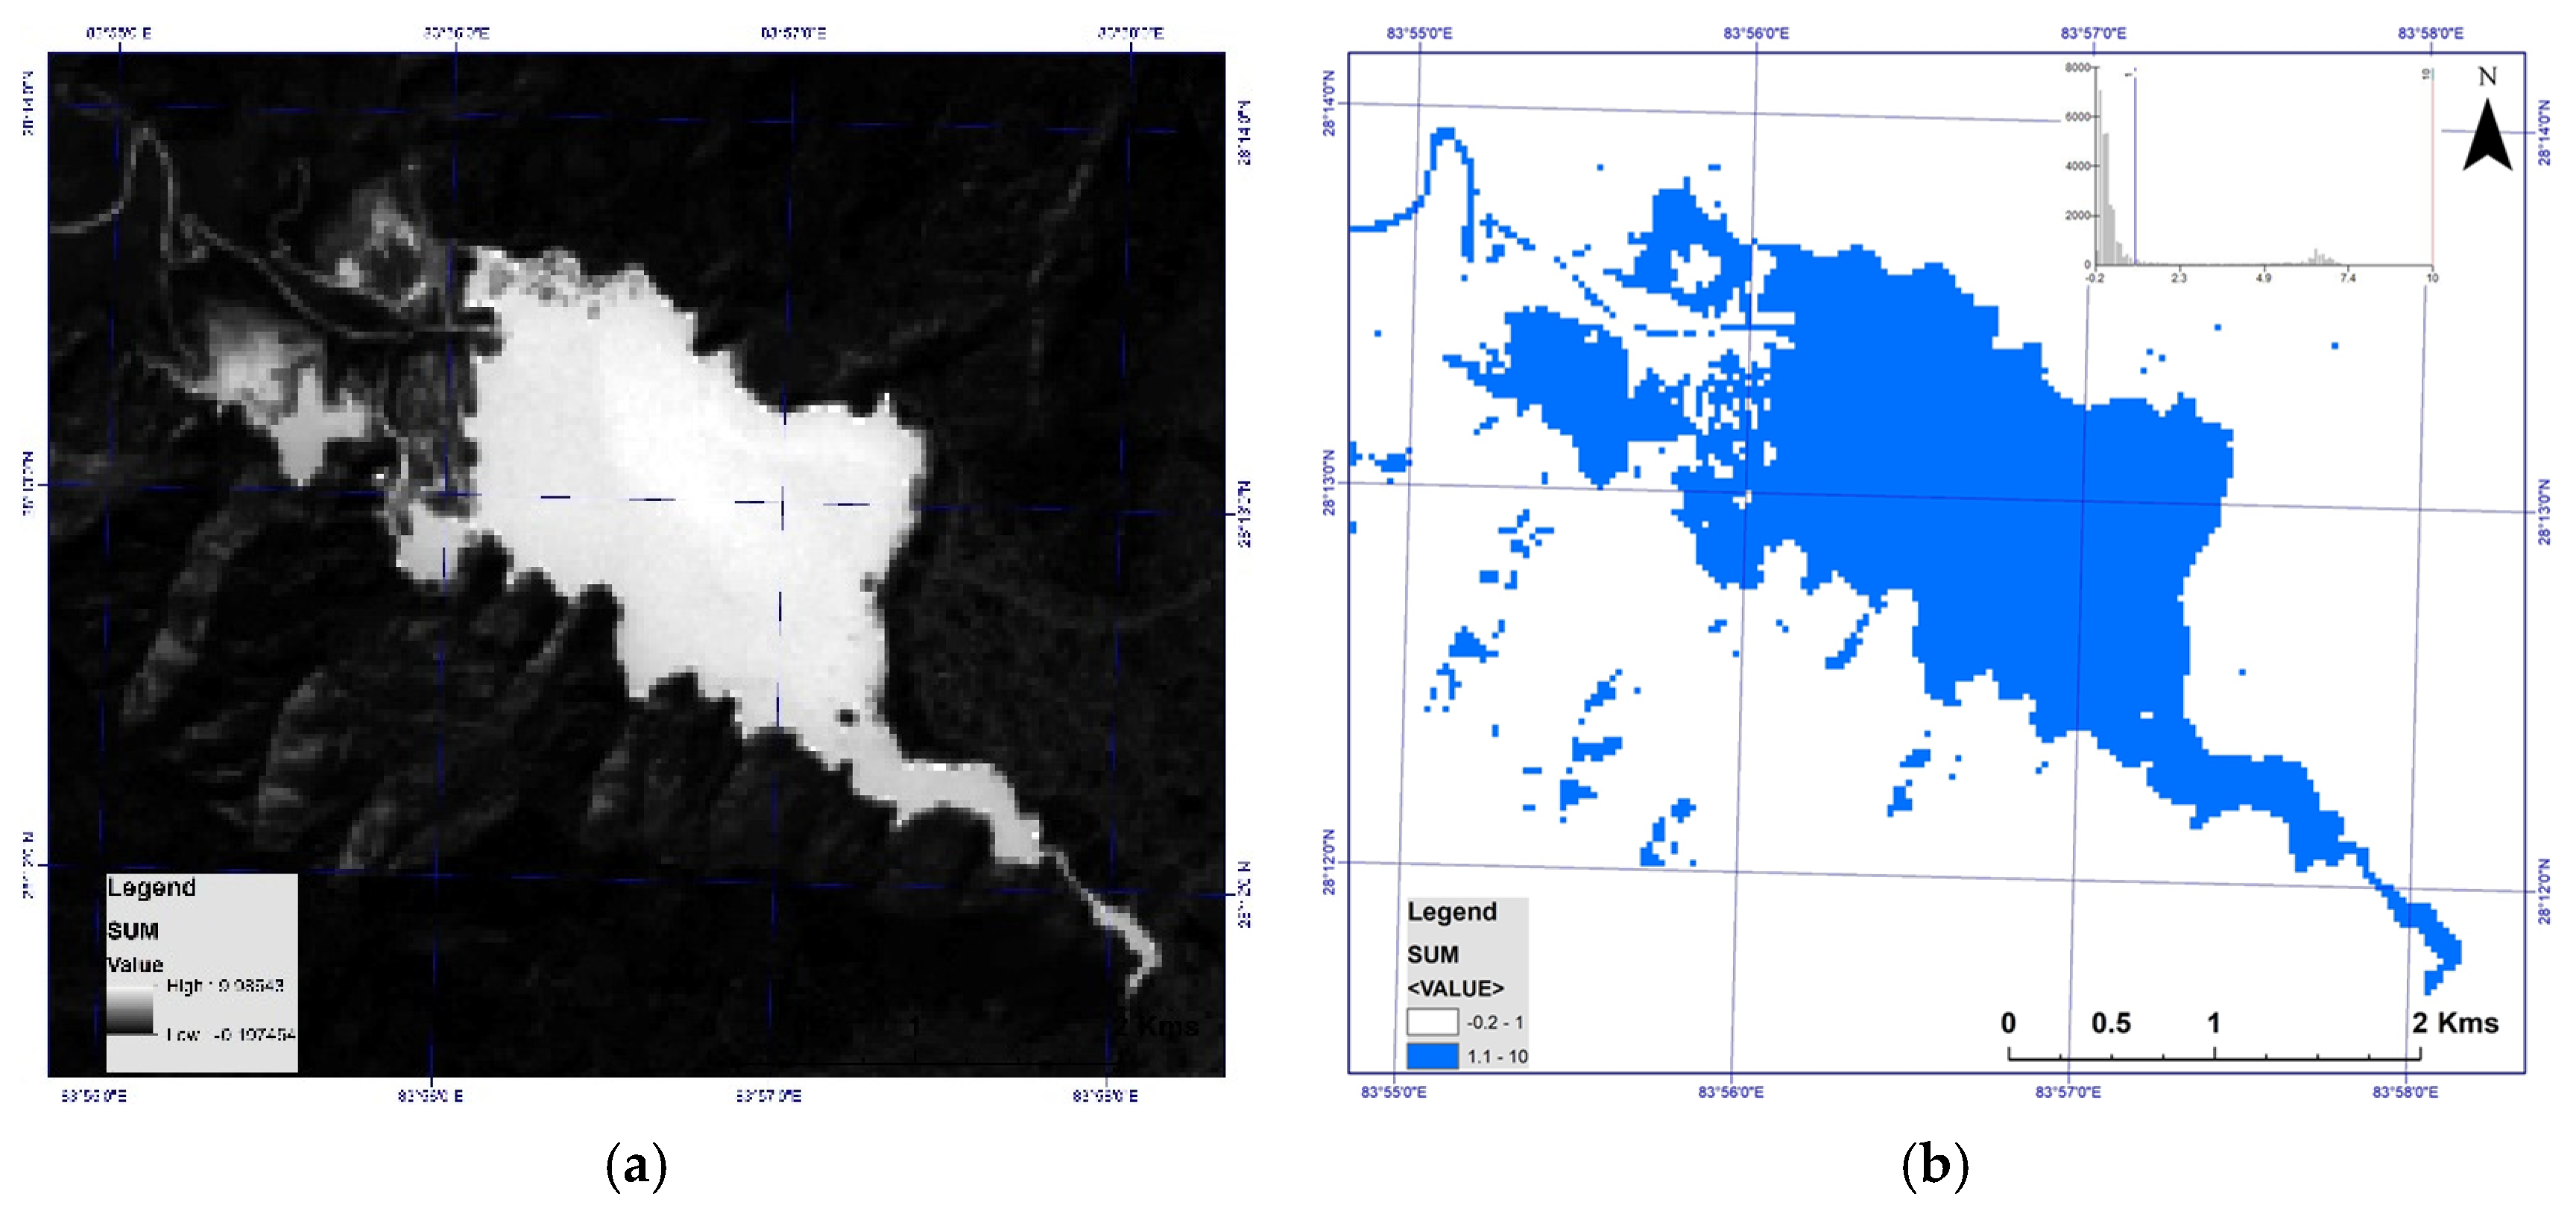
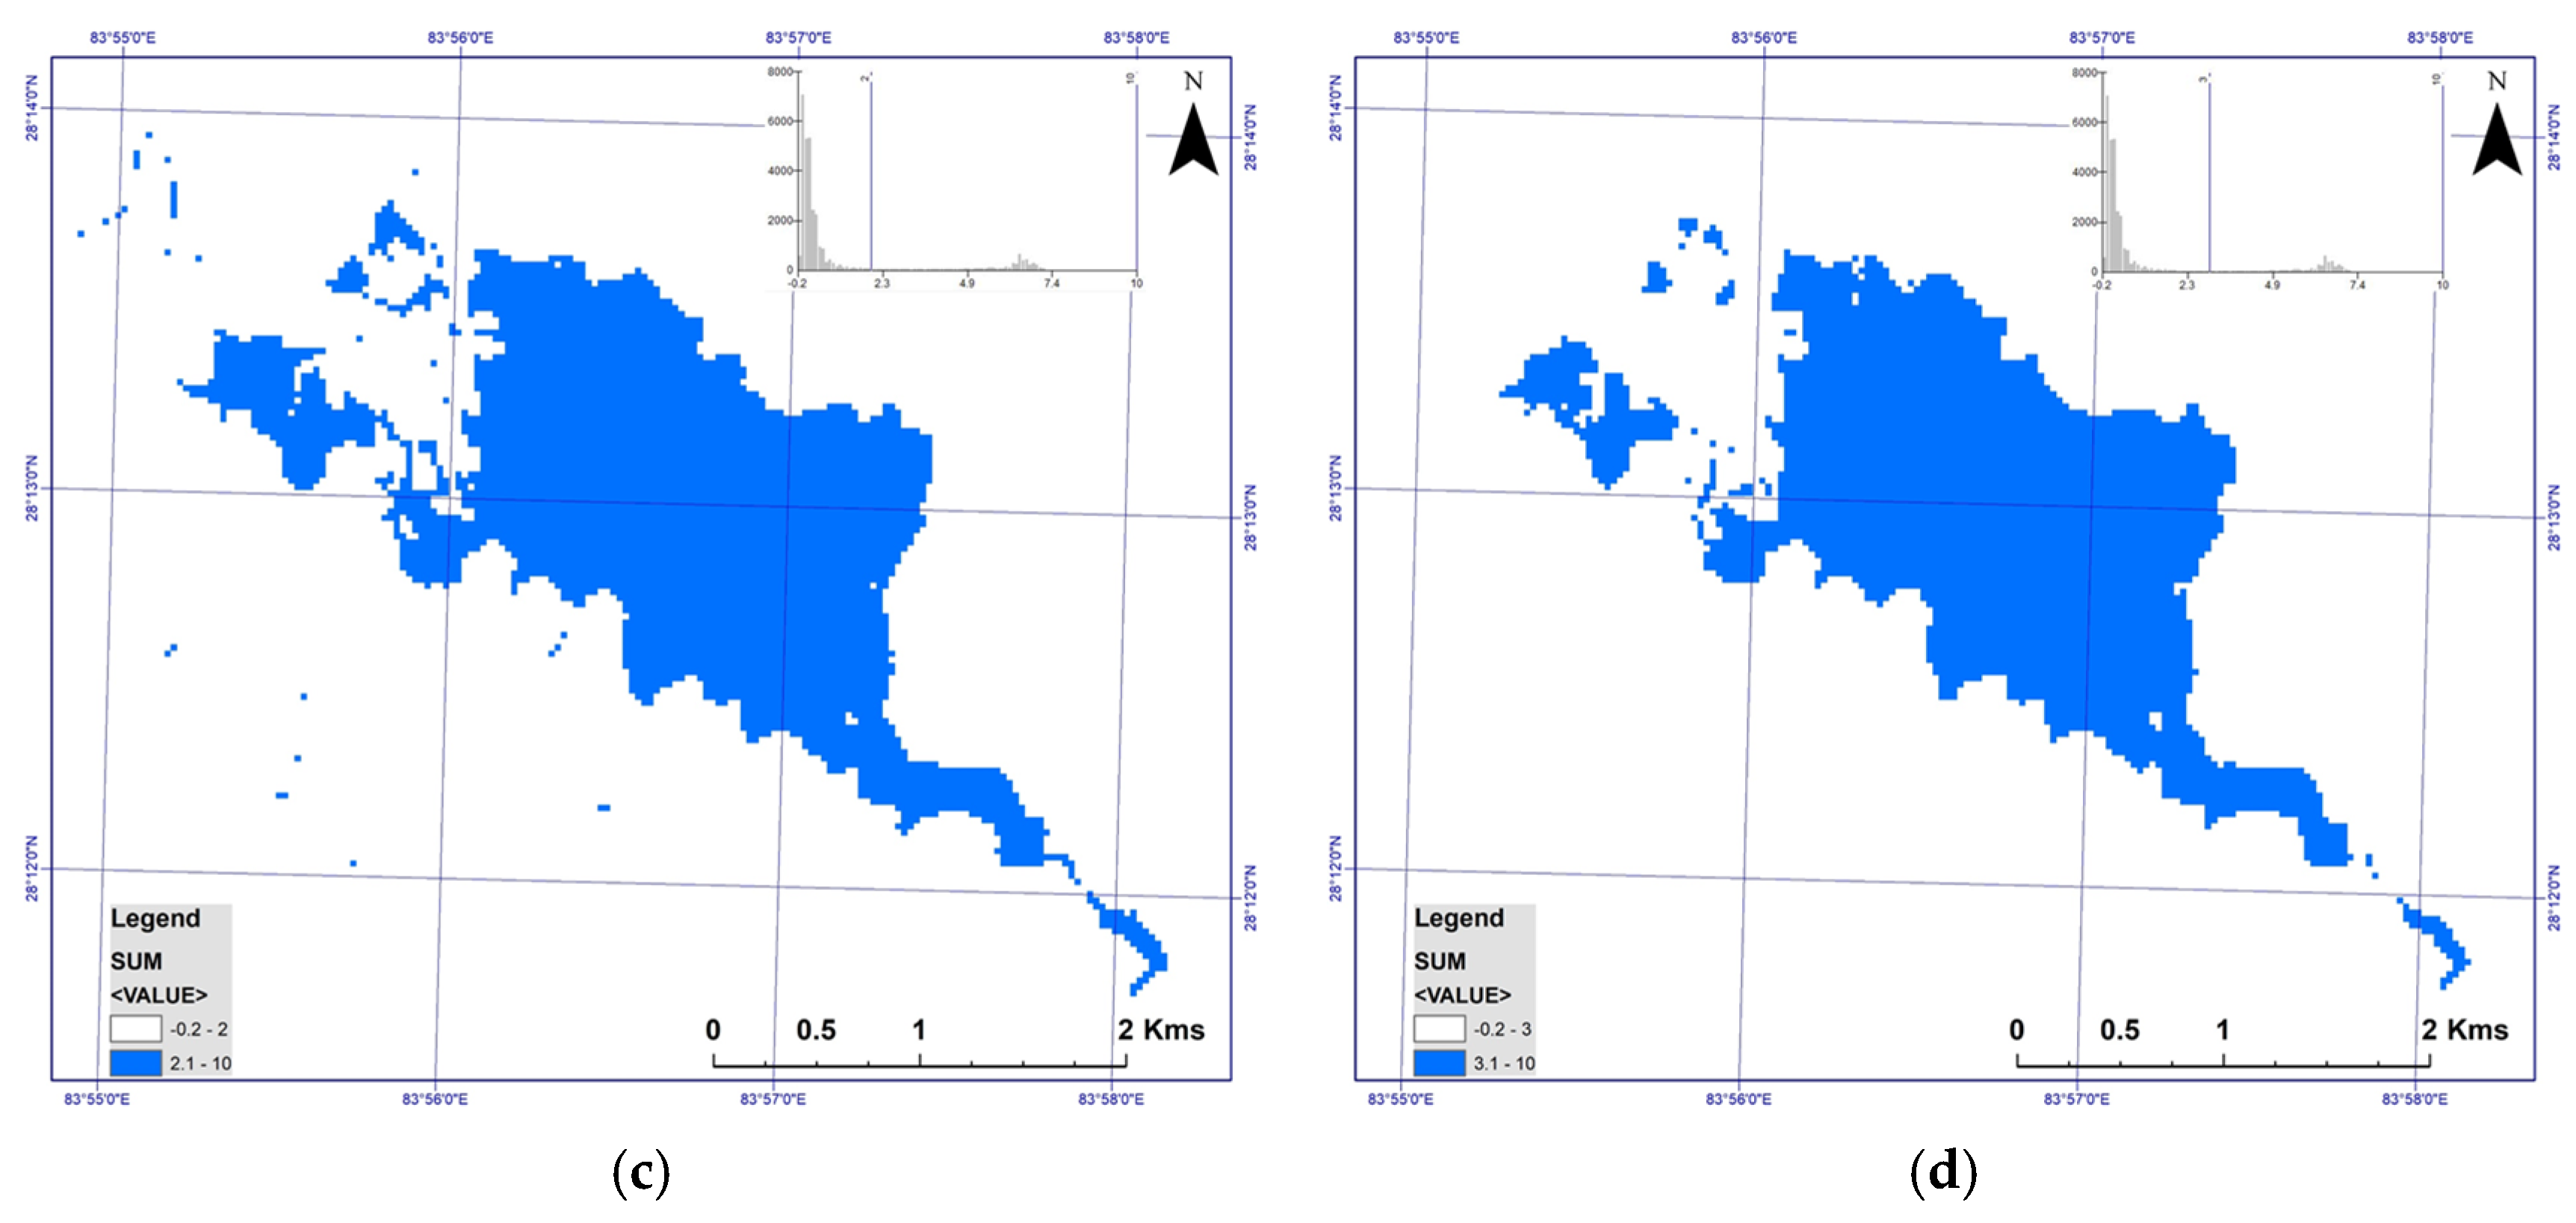
Figure 4 shows the result of the sum of all the four indices and the water map derived based on the three threshold value of 1, 2 and 3. In threshold value 1, the map is more similar to the MNDWI but focused only on denser shadows. The threshold 2 is able to separate water of lake as well as the drainage following into it. However, in case of threshold 3, only the lake was separated not the nearby drainage. The result seems clearer compared to rest of the derived water maps. In the histogram of the water maps in right top corner of the Figure 4b–d, we can see that the separation is very large compared to the individual indices in Figure 3.

4. Conclusions

In this study, a combination of four indices: NDWI, MNDWI, WRI and NDVI were used to derive the water map around Phewa Lake of Pokhara, Nepal using Landsat 8 OLI image. After pre-processing, each index was derived and summed up to form new raster. The summed index was tried for three different thresholds for the extraction of water in the study area. Result shows that the threshold 2 can be used for better water separation compared to 1 or 3. In addition, the index sum raster can be further used for automated binary classification of surface water. The process could be very useful in mapping surface water accurately.

Conflicts of Interest

The authors declare no conflict of interest.

References

  1. Acharya, T.D.; Lee, D.H.; Yang, I.T.; Lee, J.K. Identification of Water Bodies in a Landsat 8 OLI Image using a J48 Decision Tree. Sensors 2016, 16, 1075. [Google Scholar] [CrossRef] [PubMed]
  2. Karpatne, A.; Khandelwal, A.; Chen, X.; Mithal, V.; Faghmous, J.; Kumar, V. Global Monitoring of Inland Water Dynamics: State-of-the-Art, Challenges, and Opportunities. In Computational Sustainability; Lässig, J., Kersting, K., Morik, K., Eds.; Springer: Cham, Switzerland, 2016; pp. 121–147. [Google Scholar]
  3. Tulbure, M.G.; Broich, M. Spatiotemporal Dynamic of Surface Water Bodies using Landsat Time-Series Data from 1999 to 2011. ISPRS J. Photogramm. Remote Sens. 2013, 79, 44–52. [Google Scholar] [CrossRef]
  4. Nath, R.K.; Deb, S.K. Water-Body Area Extraction from High Resolution Satellite Images-an Introduction, Review, and Comparison. Int. J. Image Process. 2010, 3, 353–372. [Google Scholar]
  5. Sivanpillai, R.; Miller, S.N. Improvements in Mapping Water Bodies using ASTER Data. Ecol. Inform. 2010, 5, 73–78. [Google Scholar] [CrossRef]
  6. McFEETERS, S.K. The use of the Normalized Difference Water Index (NDWI) in the Delineation of Open Water Features. Int. J. Remote Sens. 1996, 17, 1425–1432. [Google Scholar] [CrossRef]
  7. Xu, H. Modification of Normalised Difference Water Index (NDWI) to Enhance Open Water Features in Remotely Sensed Imagery. Int. J. Remote Sens. 2006, 27, 3025–3033. [Google Scholar] [CrossRef]
  8. Shen, L.; Li, C. Water Body Extraction from Landsat ETM Imagery using Adaboost Algorithm. In Proceedings of the 18th International Conference on Geoinformatics, Beijing, China, 18–20 June 2010; pp. 1–4. [Google Scholar]
  9. Rouse, J.W.; Haas, R.H.; Schell, J.A.; Deering, D.W. Monitoring Vegetation Systems in the Great Plains with ERTS (Earth Resources Technology Satellite). In Proceedings of the Third Earth Resources Technology Satellite Symposium, Greenbelt, ON, Canada, 10–14 December 1973; pp. 309–317. [Google Scholar]
  10. Acharya, T.D.; Yang, I.T.; Subedi, A.; Lee, D.H. Change Detection of Lakes in Pokhara, Nepal using Landsat Data. Proceedings 2017, 1, 17. [Google Scholar]
  11. Acharya, T.D.; Yang, I.T.; Lee, D.H. Water Index Based Coastline Detection from Landsat Images. In Proceedings of the 2017 Conference of the Korean Society for Geospatial Information Science, Seoul, Korea, 25–26 May 2017; pp. 187–188. [Google Scholar]
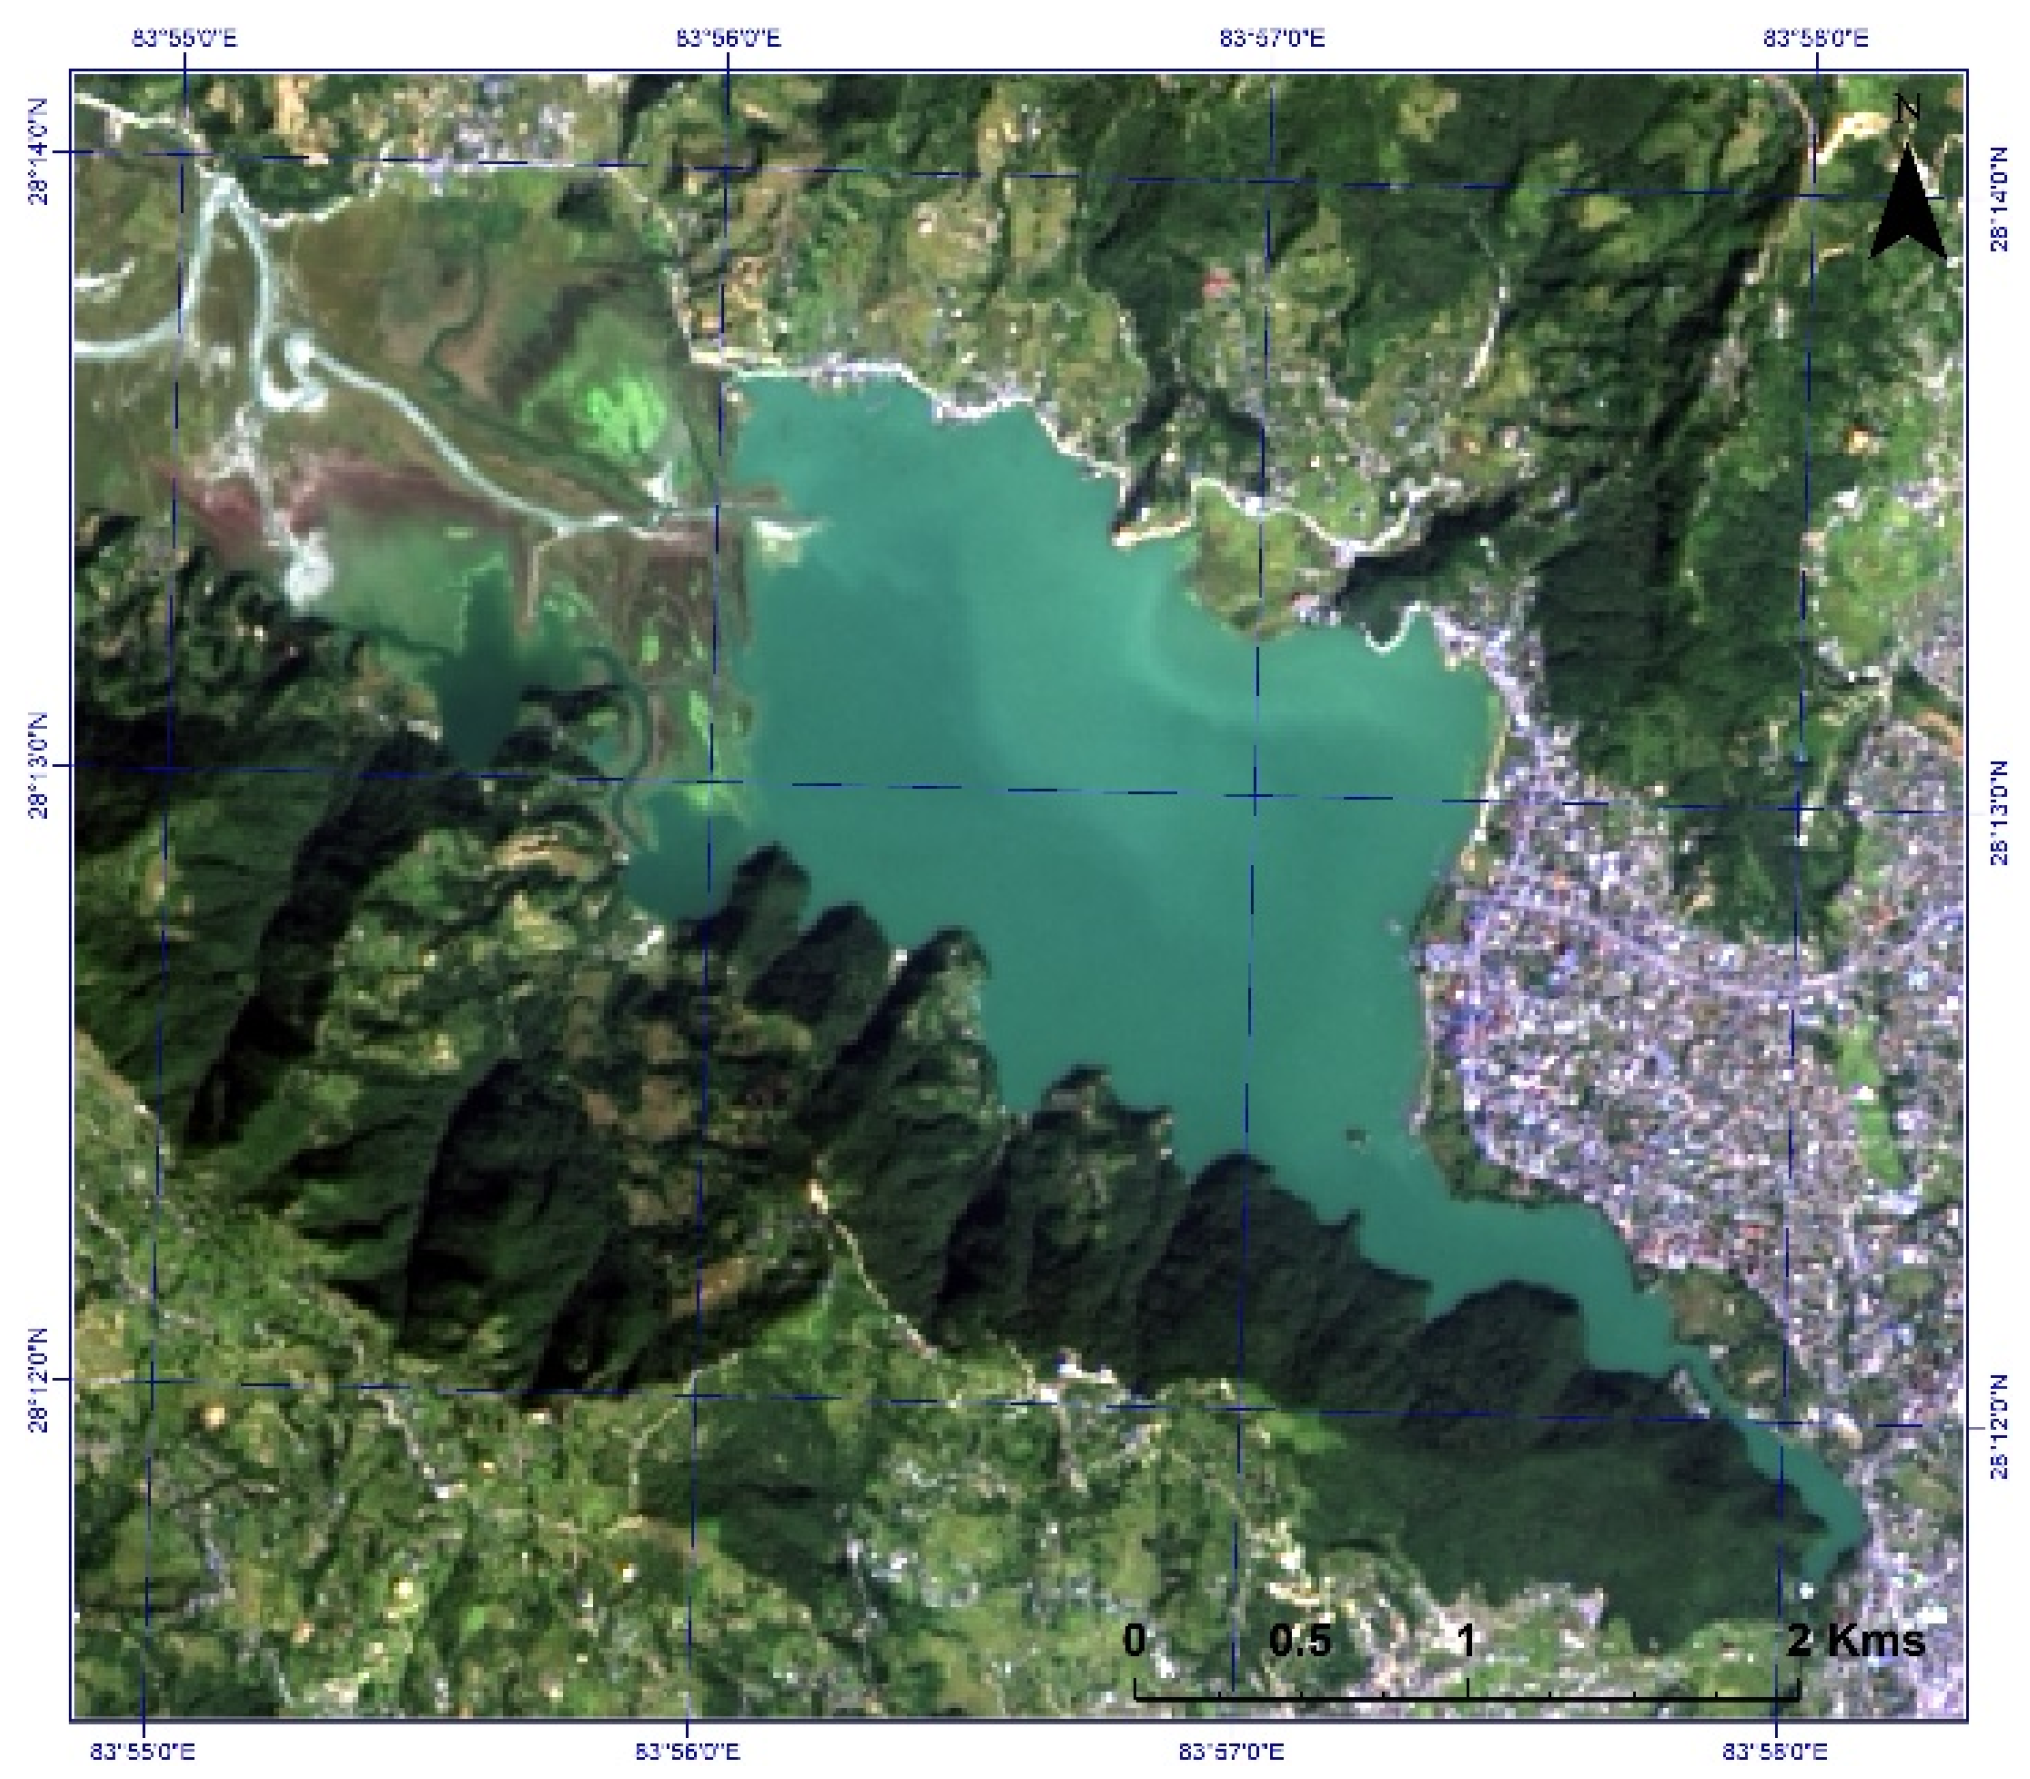
Figure 1. The geographical locations of study area: Phewa Lake in Pokhara, Nepal.
Proceedings 02 00143 g001
Figure 2. Water indices from Landsat 8 OLI image: (a) NDWI; (b) MNDWI; (c) WRI; (d) NDVI.
Proceedings 02 00143 g002
Figure 3. Water bodies from Landsat 8 OLI image: (a) NDWI; (b) MNDWI; (c) WRI; (d) NDVI.
Proceedings 02 00143 g003
Figure 4. Result of sum of indices & threshold from Landsat 8 OLI image: (a) Index; (b) 1; (c) 2; (d) 3.
Proceedings 02 00143 g004aProceedings 02 00143 g004b
Table 1. Formulae of spectral Indices and their threshold applied in the study area.
S. No.Spectral IndicesFormulaThresholdRef.
1Normalized Difference Water Index (NDWI)(Green − NIR)/(Green + NIR)0[6]
2Modified Normalized Difference Water Index (MNDWI)(Green − SWIR)/(Green + SWIR)0[7]
3Water Ratio Index (WRI)(Green + Red)/(NIR + SWIR1)1[8]
4Normalized Difference Vegetation Index (NDVI)(NIR − Red)/(NIR + Red)0[9]
Publisher’s Note: MDPI stays neutral with regard to jurisdictional claims in published maps and institutional affiliations.