Filtering Capability of Porous Pavements †


Abstract
:1. Introduction
2. Background
2.1. Porous Pavements Structures
2.2. Pollutants
2.3. Water Quality Released into the Environment
3. Methodology
3.1. Materials
3.1.1. Porous Asphalt Mixtures
3.1.2. Porous Layers
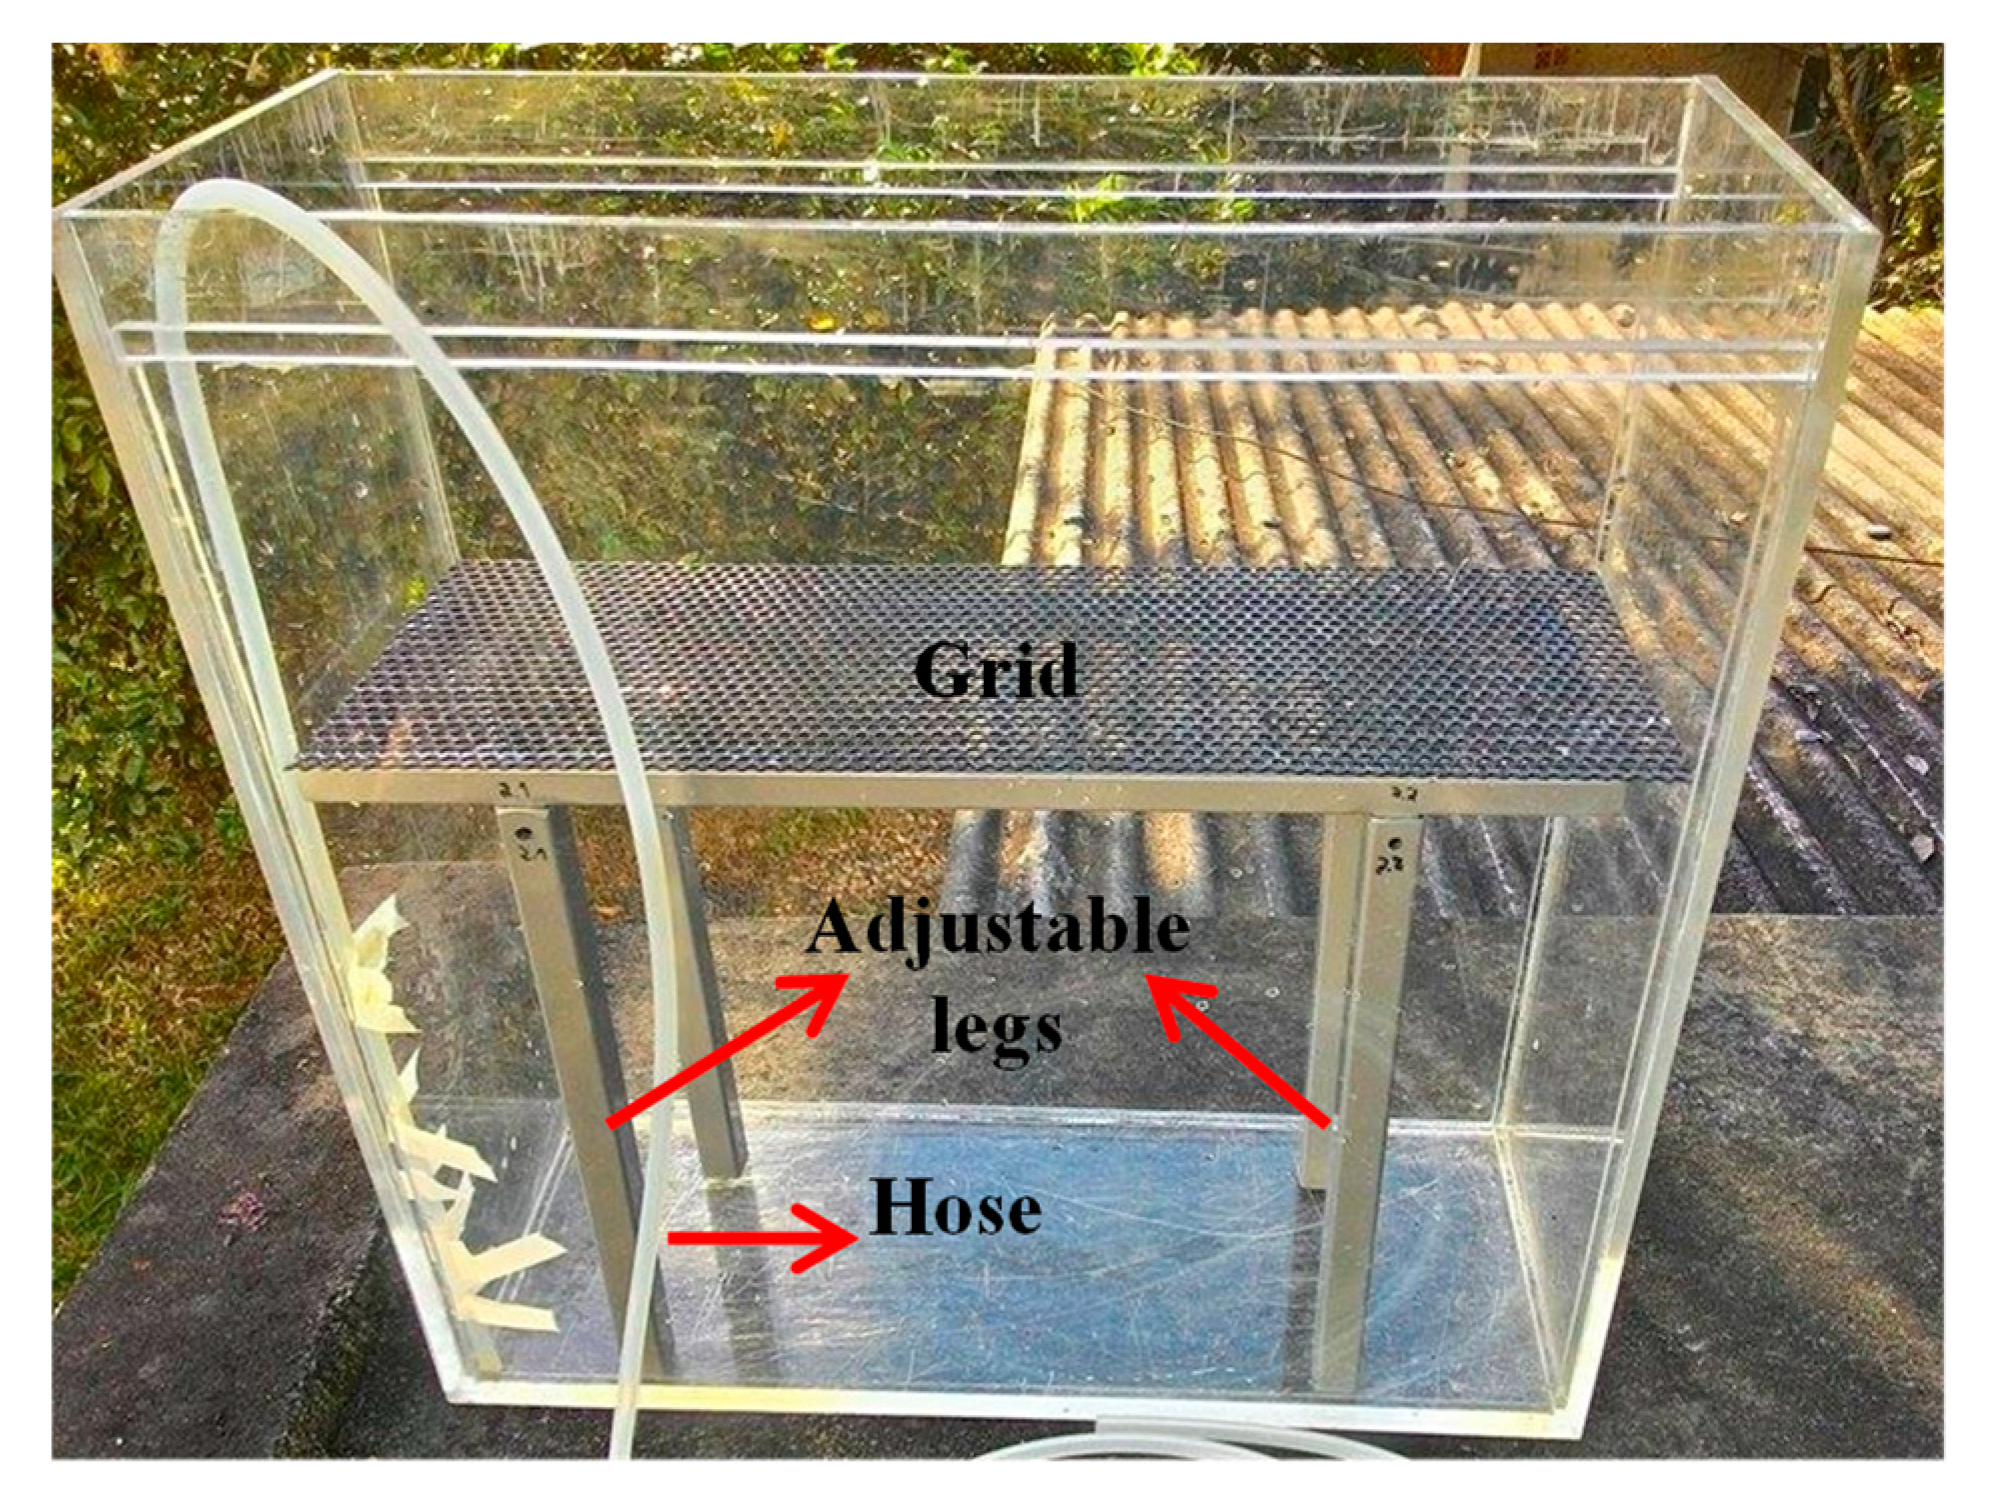
3.1.3. Equipment for Assembly of Models
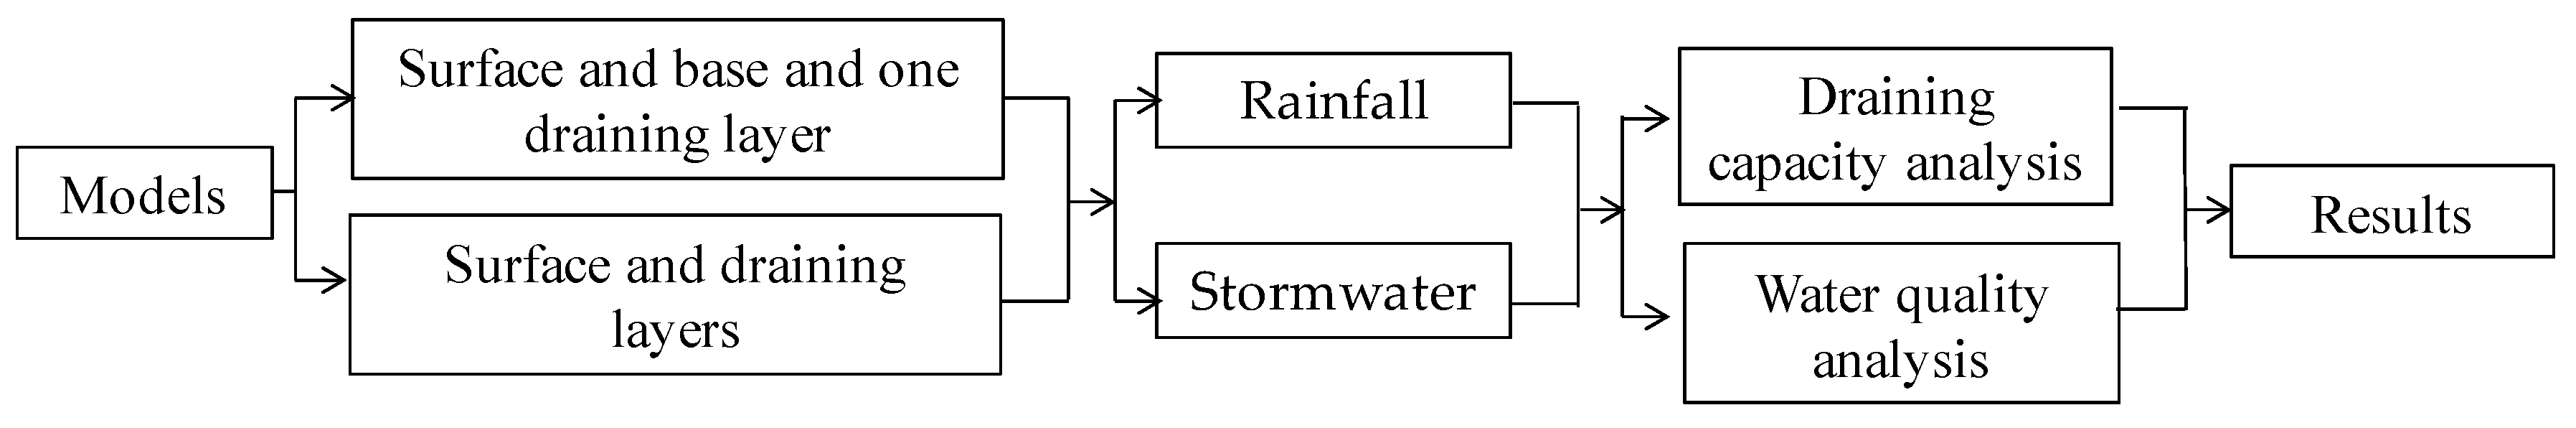
3.1.4. Models
3.2. Method
3.2.1. Quantity Analysis
3.2.2. Quality Analysis
4. Results and Discussion
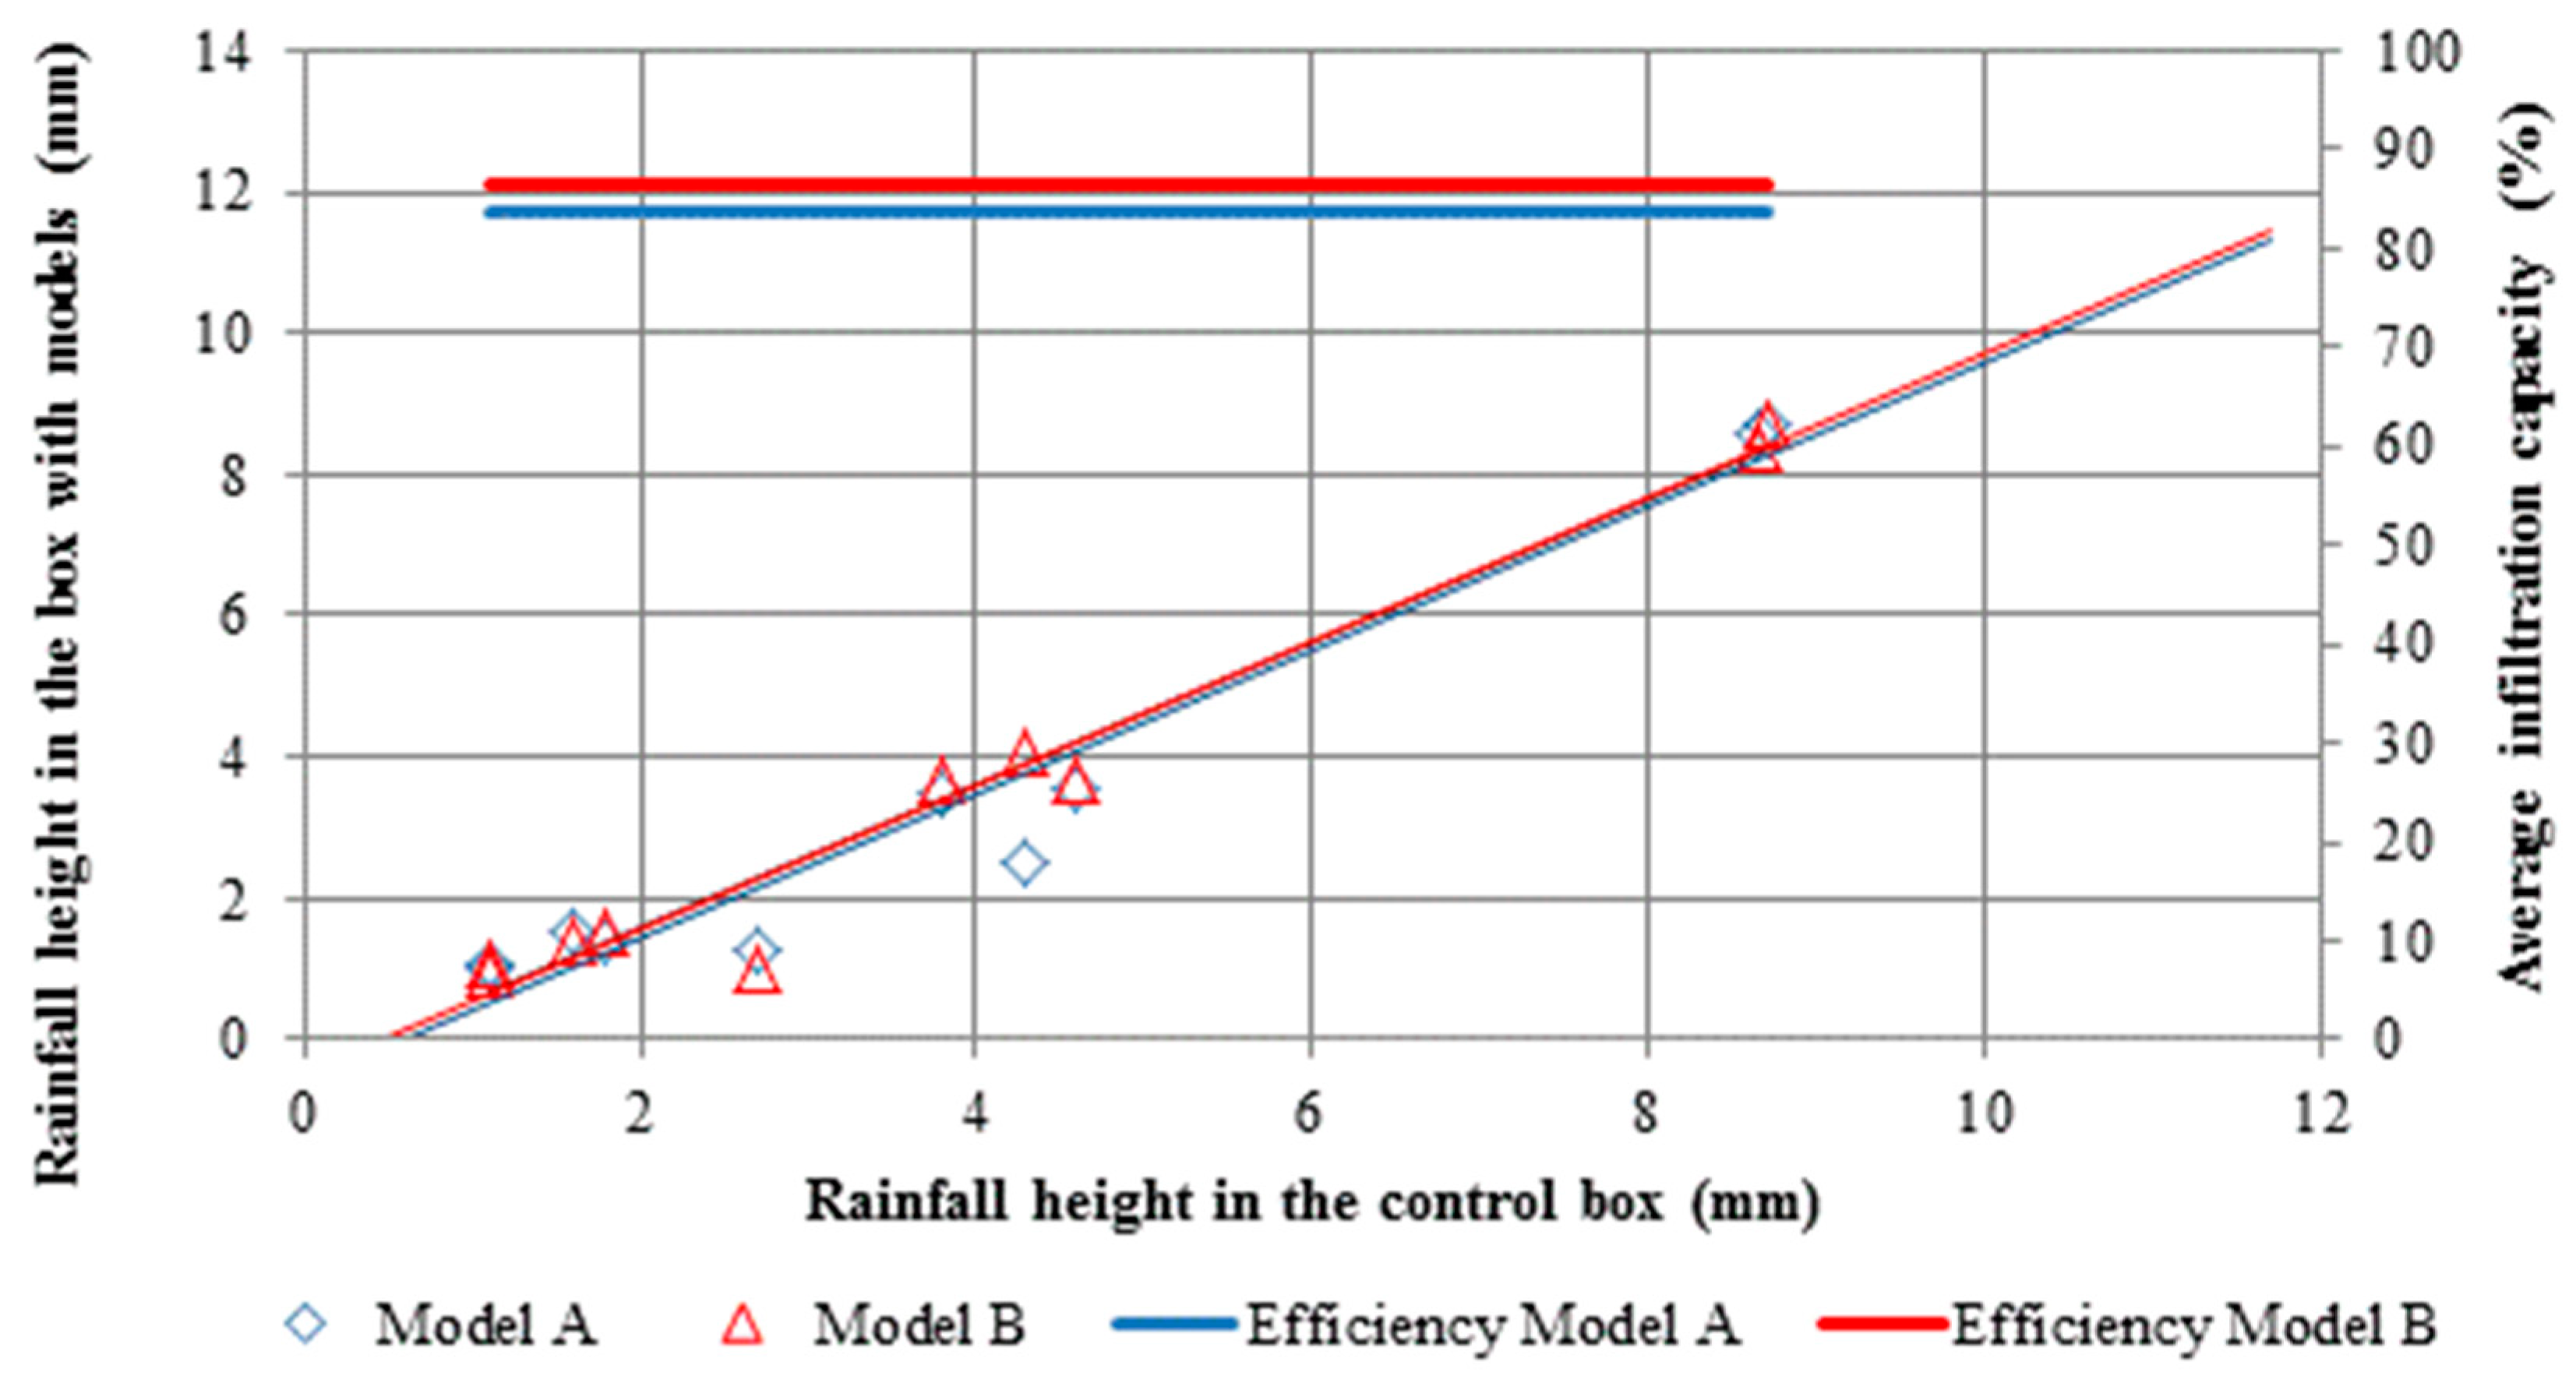
4.1. Quantity Analysis
4.2. Quality Analysis
4.2.1. Rainwater
4.2.2. Stormwater
4.2.3. Discussion
5. Conclusions
Author Contributions
Conflicts of Interest
Appendix A. Supplementary Data

| Parameter | Coarse Aggregates | Fine Aggregates | |
|---|---|---|---|
| 3/4″ | 3/8″ | <4.75 mm | |
| Apparent specific gravity (Gsa) | 2.774 | 2.740 | 2.717 |
| Bulk specific gravity (Gsb) | 2.748 | 2.701 | - |
| Absorption (%) | 0.351 | 0.521 | - |
| Parameter | Standard | Specification | Results |
|---|---|---|---|
| Penetration 25oC, 100 g, 5 s (0.01 mm) | ASTM D5 | 25 to 75 | 42.0 |
| Softening point (oC) | ASTM D 36 | 54.4 min. | 67.7 |
| Apparent viscosity (cP) 175oC | ASTM D 2196 | 1500 min. | 1644 |
| Resilience (%) | ASTM D 5329 | 20.0 min. | 33.0 |
| RTFOT 163oC, 85 min | ASTM D 2872 | ||
| Change in mass (%) | ASTM D 2872 | 0.6 max. | 0.3 |
| Softening point (oC) | ASTM D 36 | - | 2.9 |
| Penetration 25oC, 100 g, 5 s (0.01 mm) | ASTM D5 | - | 25.3 |
| Retained penetration (%) | ASTM D 2872 | - | 60.2 |
| Apparent viscosity (cP) 175oC | ASTM D 2196 | - | 1962 |
| Resilience (%) | ASTM D5 | - | 32.0 |
| Sieves | Specifications | Gradation Curves | |||||
|---|---|---|---|---|---|---|---|
| % Passing | % Passing | ||||||
| Inches/No | mm | Caltrans | CPA | PMQ | Caltrans | CPA | PMQ |
| 3/4″ | 19.0 | 100 | - | 100 | 100 | - | 100 |
| 5/8″ | 16.0 | - | - | 88–100 | - | - | 94 |
| 1/2″ | 12.5 | 95–100 | 100 | 78–94 | 97.5 | 100 | 86 |
| 3/8″ | 9.5 | 79–89 | 70–90 | 60–80 | 83 | 90 | 70 |
| No. 4 | 4.8 | 28–37 | 15–30 | 44–60 | 32 | 30 | 52 |
| No. 10 | 2.0 | - | 10–22 | - | - | 16 | - |
| No. 8 | 2.4 | 7–18 | - | - | - | - | - |
| No. 40 | 0.4 | - | 6–13 | 20–35 | 12.5 | 11 | 27 |
| No. 30 | 0.6 | 0–10 | - | - | - | - | - |
| No. 80 | 0.18 | - | - | 12–24 | 6.5 | - | 18 |
| No. 200 | 0.075 | 0–3 | 3–6 | 9–12 | 1.5 | 4 | 1.5 |
| Sieves | Porous Layers | ||||
|---|---|---|---|---|---|
| Inches/No | mm | Choker Course (UNHSC, 2009) | Filter Course (UNHSC, 2009) | Reservoir Course (UNHSC, 2009) | BGS (Grade C) (Brazil, 2016) |
| % Passing | |||||
| 2½″ | 63.0 | - | - | 100 | - |
| 2″ | 500.0 | - | - | 90–100 | - |
| 1½ | 37.5 | 100 | - | 35–70 | - |
| 1″ | 25.0 | 95–100 | - | 0–15 | 100 |
| ¾″ | 19.0 | - | - | - | - |
| ½″ | 12.5 | 25–60 | - | 0–5 | - |
| 3/8″ | 9.5 | - | 100 | - | 50–85 |
| No. 4 | 4.8 | 0–10 | 70–100 | - | 35–65 |
| No. 10 | 2.0 | - | - | - | 40–70 |
| No. 8 | 2.4 | 0–5 | - | - | - |
| No. 40 | 0.42 | - | - | - | 35–45 |
| No. 200 | 0.075 | - | 0–6 | - | 10–25 |
| Layers | Model A | Model B | ||||
|---|---|---|---|---|---|---|
| Name | Thickness (cm) | Specification | Name | Thickness (cm) | Specification | |
| Surface | CPA | 7.0 | DNER-ES 386/99 | Caltrans | 7.0 | Caltrans OPFG 1/2″ |
| Choker course | PMQ | 5.0 | PMSP-ESP10/92 Grade I | Choker course | 5.0 | UNHSC (2009) |
| Filter course | - | - | - | Filter course | 15.0 | UNHSC (2009) |
| Reservoir course | BGS | 15.0 | DNIT 031/2006-ES | Reservoir course | 16.0 | UNHSC (2009) |
| Total thickness (cm) | 27.0 | 43.0 | ||||
| Parameters | Asphalt Mixtures Slabs | Rainfall in the Control (mm) | ||
|---|---|---|---|---|
| Caltrans | CPA | PMQ | ||
| Maximum infiltration capacity (mm) | 40.0 | 47.0 | 43.0 | 47.0 |
| Minimum infiltration capacity (mm) | 2.0 | 5.0 | 3.0 | 5.0 |
| Average infiltration capacity (mm) | 14.9 | 18.5 | 16.1 | 20.4 |
| Standard deviation (mm) | 10.9 | 10.8 | 9.9 | 9.3 |
| Parameters | Models | Rainfall in the Control (mm) | |
|---|---|---|---|
| A | B | ||
| Maximum infiltration capacity (mm) | 8.7 | 8.7 | 8.7 |
| Minimum infiltration capacity (mm) | 1.0 | 1.0 | 1.1 |
| Average infiltration capacity (mm) | 3.3 | 3.5 | 3.8 |
| Standard deviation (mm) | 2.2 | 2.3 | 2.2 |


References
- Klenzendorf, J.B.; Eck, J.B.; Charbeneau, J.R.; Barret, E.M. Quantifying the behavior of porous asphalt overlays with respect to drainage hydraulics and runoff water quality. Environ. Eng. Geosci. 2012, XVIII, 99–111. [Google Scholar] [CrossRef]
- Tilley, J.S.; Slonecker, T.E. Quantifying the Components of Impervious Surfaces; Open File Report 2007–1008 U.S.; Department of the Interior, U.S. Geological Survey U.S. Geological Survey: Reston, VA, USA, 2006. Available online: https://pubs.usgs.gov/of/2007/1008/ofr2007-1008.pdf (accessed on 23 May 2017).
- Green, O.O.; Shuster, W.D.; Rhea, L.K.; Garnestani, A.S.; Thurston, H.W. Identification and induction of human, social, and cultural capitals through an experimental approach to stormwater management. Sustainability 2012, 4, 1669–1682. Available online: https://www.mdpi.com/2071-1050/4/8/1669. (accessed on 25 May 2017). [CrossRef]
- Castro-Fresno, D.; Andrés-Valeri, V.C.; Sañudo-Fontanela, L.A.; Hernadez-Rodrigues, J. Sustainable drainage practices in Spain, specially focused on pervious Pavements. Water 2013, 5, 67–93. Available online: https://www.mdpi.com/2073-4441/5/1/67. (accessed on 15 July 2017). [CrossRef]
- Schaus, L.K. Porous Asphalt Pavement Designs: Proactive Design for Cold Climate Use. Master’s Thesis, University of Waterloo, Waterloo, ON, Canada, 2007. [Google Scholar]
- Suzuki, C.Y.; Azevedo, A.M.; Kabbach Júnior, F.I. Drenagem Subsuperficial de Pavimentos—Conceitos e Dimensionamento (Subsurface Drainage Pavements—Concepts and Design); Oficina de Textos: São Paulo, SP, Brazil, 2013; ISBN 978-85-7975-075. (In Portuguese) [Google Scholar]
- Boogaard, F.; Lucke, T.; van de Giesen, N.; van de Ven, F. Evaluating the infiltration performance of eight Dutch permeable pavements using a new full-scale infiltration testing method. Water 2014, 6, 2070–2083. Available online: https://www.mdpi.com/2073-4441/6/7/2070 (accessed on 3 August 2017). [CrossRef]
- Lucke, T.; Beecham, S.; Boogaard, F.; Baden, M. Are infiltration capacities of clogged permeable pavements still acceptable? In Proceedings of the Novatech 2013—8th International Conference on planning and technologies for sustainable management of water in the city, Lyon, France, June 28–July 1 2013. [Google Scholar]
- NAPA. Porous Asphalt Pavement; National Asphalt Pavement Association: Lanham, MD, USA, 2003. [Google Scholar]
- Huber, G. Performance survey on open-graded friction course mixes. In Synthesis of Highway Practice 284; National Cooperative Highway Research Program (NCHRP): Washington, DC, USA, 2000. [Google Scholar]
- Kiran, T.-M.; Parneet, P. Sustainable approaches for stormwater quality improvements with experimental geothermal paving systems. Sustainability 2015, 7, 1388–1410. Available online: https://www.mdpi.com/2071-1050/7/2/1388 (accessed on 20 May 2017). [CrossRef]
- Pratt, C.J.; Mantle, J.D.; Schofield, P.A. UK research into the performance of permeable pavement, reservoir structures in controlling stormwater discharge quantity and quality. Water Sci. Technol. 1995, 32, 63–69. [Google Scholar] [CrossRef]
- Kumar, K.; Kozak, J.; Hundal, L.; Cox, A.; Zhang, H. In-situ infiltration performance of different permeable pavements in an employee used parking lot—A four-year study. J. Environ. Manag. 2016, 167, 8–14. [Google Scholar] [CrossRef] [PubMed]
- Siriwardene, N.; Deletic, A.; Fletcher, T. Modelling of sediment transport through stormwater gravel filters over their lifespan. Environ. Sci. Technol. 2007, 41, 8099–8103. [Google Scholar] [CrossRef] [PubMed]
- Collins, K.A.; Hunt, W.F.; Hathaway, J.M. Hydrologic comparison of four types of permeable pavement and standard asphalt in eastern North Carolina. J. Hydrol. Eng. 2008, 13, 1146–1157. [Google Scholar] [CrossRef]
- ASCE. Permeable Pavements: Recommended Design Guidelines; Permeable Pavement Technical Committee of the Water Resources Institute of the American Society of Civil Engineers: Reston, VA, USA, 2013. [Google Scholar]
- Drake, J.; Bradford, A.; Seters, T.V. Stormwater quality of spring–summer-fall effluent from three partial-infiltration permeable pavement systems and conventional asphalt pavement. J. Environ. Manag. 2014, 139, 69–79. [Google Scholar] [CrossRef] [PubMed]
- McDaniel, R.S.; Thornton, W.D.; Dominguez, J.G. Field Evaluation of Porous Asphalt Pavement; Final Report; North Central Superpave Center Purdue University: West Lafayette, IN, USA, 2004. [Google Scholar]
- Putman, B.J. Evaluation of Open-Graded Friction Courses: Construction, Maintenance, and Performance; Report No. FHWA-SC-12-04; South Carolina Department of Transportation: Columbia, SC, USA, 2012. [Google Scholar]
- TNZ. Specification for Porous Asphalt; Transit New Zeland SP/SP11 070704; TNZ: Wellington, New Zeland, 2007. [Google Scholar]
- NAPA. Porous asphalt pavements for stormwater management. In Design, Construction and Maintenance Guide; National Asphalt Pavement Association: Lanham, MD, USA, 2008. [Google Scholar]
- Dierkes, C.; Kuhlman, L.; Kandasamy, J.; Angelis, G. Pollution retention capability and maintenance of permeable pavements. In Proceedings of the 9th International Conference on Urban Drainage, Portland, OR, USA, 8–13 September 2002. [Google Scholar]
- Agarwal, S.K. Heavy Metal Pollution; A.P.H. Publishing: New Delhi, India, 2009; ISBN 978-81-313-0484-6. [Google Scholar]
- Llopart-Mascaró, A.; Ruiz, R.; Martínez, M.; Malgrat, P.; Rubio, P. Analysis of Rainwater quality: Towards sustainable Rainwater management in urban environments. In Proceedings of the Novatech 2010—7th International Conference on Sustainable Techniques and Strategies for Urban Water Management, Lyon, France, 27 June–1 July 2010. [Google Scholar]
- WSDOT. Untreated Highway Runoff in Western Washington; Washington State Department of Transportation, Herrera Environmental Consultants, Inc.: Seattle, WA, USA, 2007. [Google Scholar]
- Barrett, M.E.; Malina, J.F., Jr.; Charbeneau, R.J.; Ward, G.H. Characterization of Highway Runoff in the Austin Texas Area; Center for Research in Water Resources, Bureau of Engineering Research: Austin, TX, USA, 1995. [Google Scholar]
- Yuen, J.; Olin, P.H.; Lim, H.S.; Benner, S.G.; Sutherland, R.A.; Ziegler, A.D. Accumulation of potentially toxic elements in road deposited sediments in residential and light industrial neighborhoods of Singapore. J. Environ. Manag. 2012, 101, 151–163. [Google Scholar] [CrossRef] [PubMed]
- NRMCA. Freeze-Thaw Resistance of Pervious Concrete; National Ready-Mixed Concrete Association: Silver Spring, MD, USA, 2004. [Google Scholar]
- Balades, J.D.; Legret, M.; Madiec, H. Permeable pavements: Pollution management tools. Water Sci. Technol. 1995, 32, 49–56. [Google Scholar] [CrossRef]
- Pagotto, C.; Legret, M.; Le Cloirec, P. Comparison of the hydraulic behaviour and the quality of highway runoff water according to the type of pavement. Water Res. 2000, 34, 4446–4454. [Google Scholar] [CrossRef]
- ANA. Nacional de Águas—Brasil (National Water Agency–Brazil). In Conservação e Reúso da Água em Edificações; Agência Prol Editora Gráfica: São Paulo, SP, Brazil, 2005. (In Portuguese) [Google Scholar]
- CONAMA. Conselho Nacional do Meio Ambiente Resolução No. 430, de 13 de maio de 2011. In Condições e Padrões de Lançamento de Efluentes; Ministério Nacional do Meio Ambiente, Conselho Nacional do Meio Ambiente: Brasília, DF, Brazil, 2011. (In Portuguese) [Google Scholar]
- CONAMA. Conselho Nacional do Meio Ambiente Resolução No. 357, de 18 de março de 2005. Classificação dos Corpos de Água e Diretrizes Ambientais Para Seu Enquadramento; Ministério Nacional do Meio Ambiente, Conselho Nacional do Meio Ambiente: Brasília, DF, Brazil, 2005. (In Portuguese)
- Brazil. Departamento Nacional de Infraestrutura de Transportes/Instituto de Pesquisas Rodoviárias; Coletânea de Normas; (In Portuguese). 2016. Available online: http://ipr.dnit.gov.br/normas-e-manuais/normas (accessed on 1 July 2017).
- ASTM (American Society for Testing and Materials). Annual Book of ASTM Standards; ASTM International: Washington, DC, USA, 2002; Volume 03.02, Available online: https://www.astm.org (accessed on 2 February 2017).
- CALTRANS. California Department of Transportation Open Graded Friction Course Usage Guide; Division of Engineering Services: Sacramento, CA, USA, 2006.
- DER/SP. Especificação Técnica: Pré-Misturado a Quente; Departamento de Estradas de Rodagem de São Paulo: São Paulo, Brazil, 2006. (In Portuguese) [Google Scholar]
- UNHSC. Design Specifications for Porous Asphalt Pavement and Infiltrations Beds; University of New Hampshire–Stormwater Center (UNHSC): Durham, NH, USA, 2009. [Google Scholar]
- Tota-Maharaj, K.; Scholz, M. Efficiency of permeable pavement systems for the removal of urban runoff pollutants under varying environmental conditions. Environ. Prog. Sustain. Enery 2010, 29, 358–369. [Google Scholar] [CrossRef]
- Bean, E.Z.; Hunt, W.F.; Bidelshap, D.A. Evaluation of four permeable pavement sites in eastern North Carolina for runoff reduction and water quality impacts. J. Irrig. Drain. Eng. 2007, 133, 583–592. [Google Scholar] [CrossRef]
- CETESB. Companhia Ambiental do Estado de São Paulo; Publicações e Relatórios: São Paulo, SP, Brazil, 2014. (In Portuguese) [Google Scholar]
- LACEN. Manual de Orientação Para Coleta de Água e Amostras Ambientais; Laboratório Central de Saúde Pública: Santa Catarina, Brazil, 2000. (In Portuguese) [Google Scholar]
- Quevedo, C.M.G. Avaliação da Presença de Fósforo Nos Esgotos Sanitários e da Atual Contribuição Dos Detergentes. Ph.D. Thesis, Universidade de São Paulo (USP), Faculdade de Saúde Pública,, São Paulo, SP, Brazil, 2015. (In Portuguese). [Google Scholar] [CrossRef]
- Brow, R.A.; Borst, M. Nutrient infiltration concentration from three permeable pavement types. J. Environ. Manag. 2015, 164, 74–85. [Google Scholar] [CrossRef] [PubMed]
- Chughtai, M.; Mustafa, S.; Mumtaz, M. Study of physicochemical parameters of rainwater: A case study of Karachi, Pakistan. Am. J. Anal. Chem. 2014, 5, 235–242. [Google Scholar] [CrossRef]
- Cederkvist, K.; Jensen, M.B.; Holm, P.E. Method for assessment of stormwater treatment facilities—Synhetic road runoff addition including micro-pollutants and tracer. J. Environ. Manag. 2017, 198, 107–117. [Google Scholar] [CrossRef] [PubMed]


| Pollutant/Parameter | [22] | [23] | [24] |
|---|---|---|---|
| pH | 3.90–7.50 | n/a (1) | 6.00–8.30 |
| Total phosphorus (Ptot) | 0.01–0.19 | n/a (1) | 0.23 |
| Ammonia (NH4) | 0.10–2.00 | n/a (1) | n/a (1) |
| NO3 | 0.10–7.40 | n/a (1) | n/a (1) |
| Cadmium (Cd) | 0.10–3.90 | 10.00–150.00 | <0.01 |
| Zinc (Zn) | 5.00–235.00 | 40.00 | 0.52 |
| Copper (Cu) | 1.00–355.00 | 3.00–370.00 | <0.10 |
| Lead (Pb) | 2.00–76.00 | 11.00–84.00 | <0.20 |
| Nickel (Ni) | 1.00–14.00 | 5.00–33.00 | <0.03 |
| Chromium (Cr) | 2.00–8.00 | n/a (1) | 0.05 |
| Iron (Fe) | n/a (1) | 21.00–633.00 | n/a (1) |
| Pollutant/Parameter | [1] | [22] | [25] | [26] |
|---|---|---|---|---|
| pH | n/a (1) | 6.4–7.9 | 5.8–6.8 | 6.51–7.16 |
| Total phosphorus (Ptot) | 0.04–0.14 | 0.23–0.34 | 0.03–0.57 | 0.10–0.42 |
| Ammonia (NH4) | n/a (1) | 0.5–2.3 | 1.0–2.7 | n/a (1) |
| NO3 | n/a (1) | 0.1–16.0 | n/a (1) | 0.28–1.25 |
| Cadmium (Cd) | n/a (1) | 0.3–13.0 | 0.9–2.8 | n/a (1) |
| Zinc (Zn) | 22.0–610 | 120.0–2000.0 | 26.0–394.0 | 50.0–237.0 |
| Copper (Cu) | 11.0–180.0 | 97.0–104.0 | 4.6–72.0 | 7.0–38.0 |
| Lead (Pb) | 1.0–76.0 | 11.0–525.0 | 24–1065.0 | 7.0–99.0 |
| Nickel (Ni) | n/a (1) | 4.0–70.0 | 8.6–12.9 | n/a (1) |
| Chromium (Cr) | n/a (1) | 6.0–50.0 | n/a (1) | n/a (1) |
| Iron (Fe) | n/a (1) | n/a (1) | 2429.0–10,300.0 (2) | 361.0–2606.0 |
| Pollutant/Parameter | [31] | [32] |
|---|---|---|
| pH | 6.0 to 9.0 | - |
| Total phosphorus (Pt) max. | 0.1 mg/L | - |
| Dissolved copper (Cu) max. | - | 1.0 mg/L |
| Total chromium (Cr) max. | - | 1.0 mg/L |
| Dissolved iron (Fe) max. | - | 15.0 mg/L |
| Total zinc (Zn) max. | - | 5.0 mg/L |
| Nitrite (Ni) max. | 1.0 mg/L | - |
| Ammonia max. | 20.0 mg/L | - |
| Odour and aspect | not unpleasant | - |
| Fecal coliforms | not detectable | - |
| Parameter | Control | Model A | Model B | Limit | ||
|---|---|---|---|---|---|---|
| pH | Rainwater | Average | 5.8 | 7.7 | 7.1 | 6.0–9.0 |
| Standard deviation | 0.3 | 0.3 | 0.3 | |||
| Stormwater | Average | 6.9 | 7.6 | 7.6 | ||
| Standard deviation | 0.2 | 0.2 | 0.2 | |||
| Phosphorus (mg/L) | Rainwater | Average | 0.20 | 0.54 | 0.94 | ≤0.10 |
| Standard deviation | 0.18 | 0.47 | 0.47 | |||
| Stormwater | Average | 0.92 | 1.26 | 3.19 | ||
| Standard deviation | 0.80 | 1.33 | 0.98 | |||
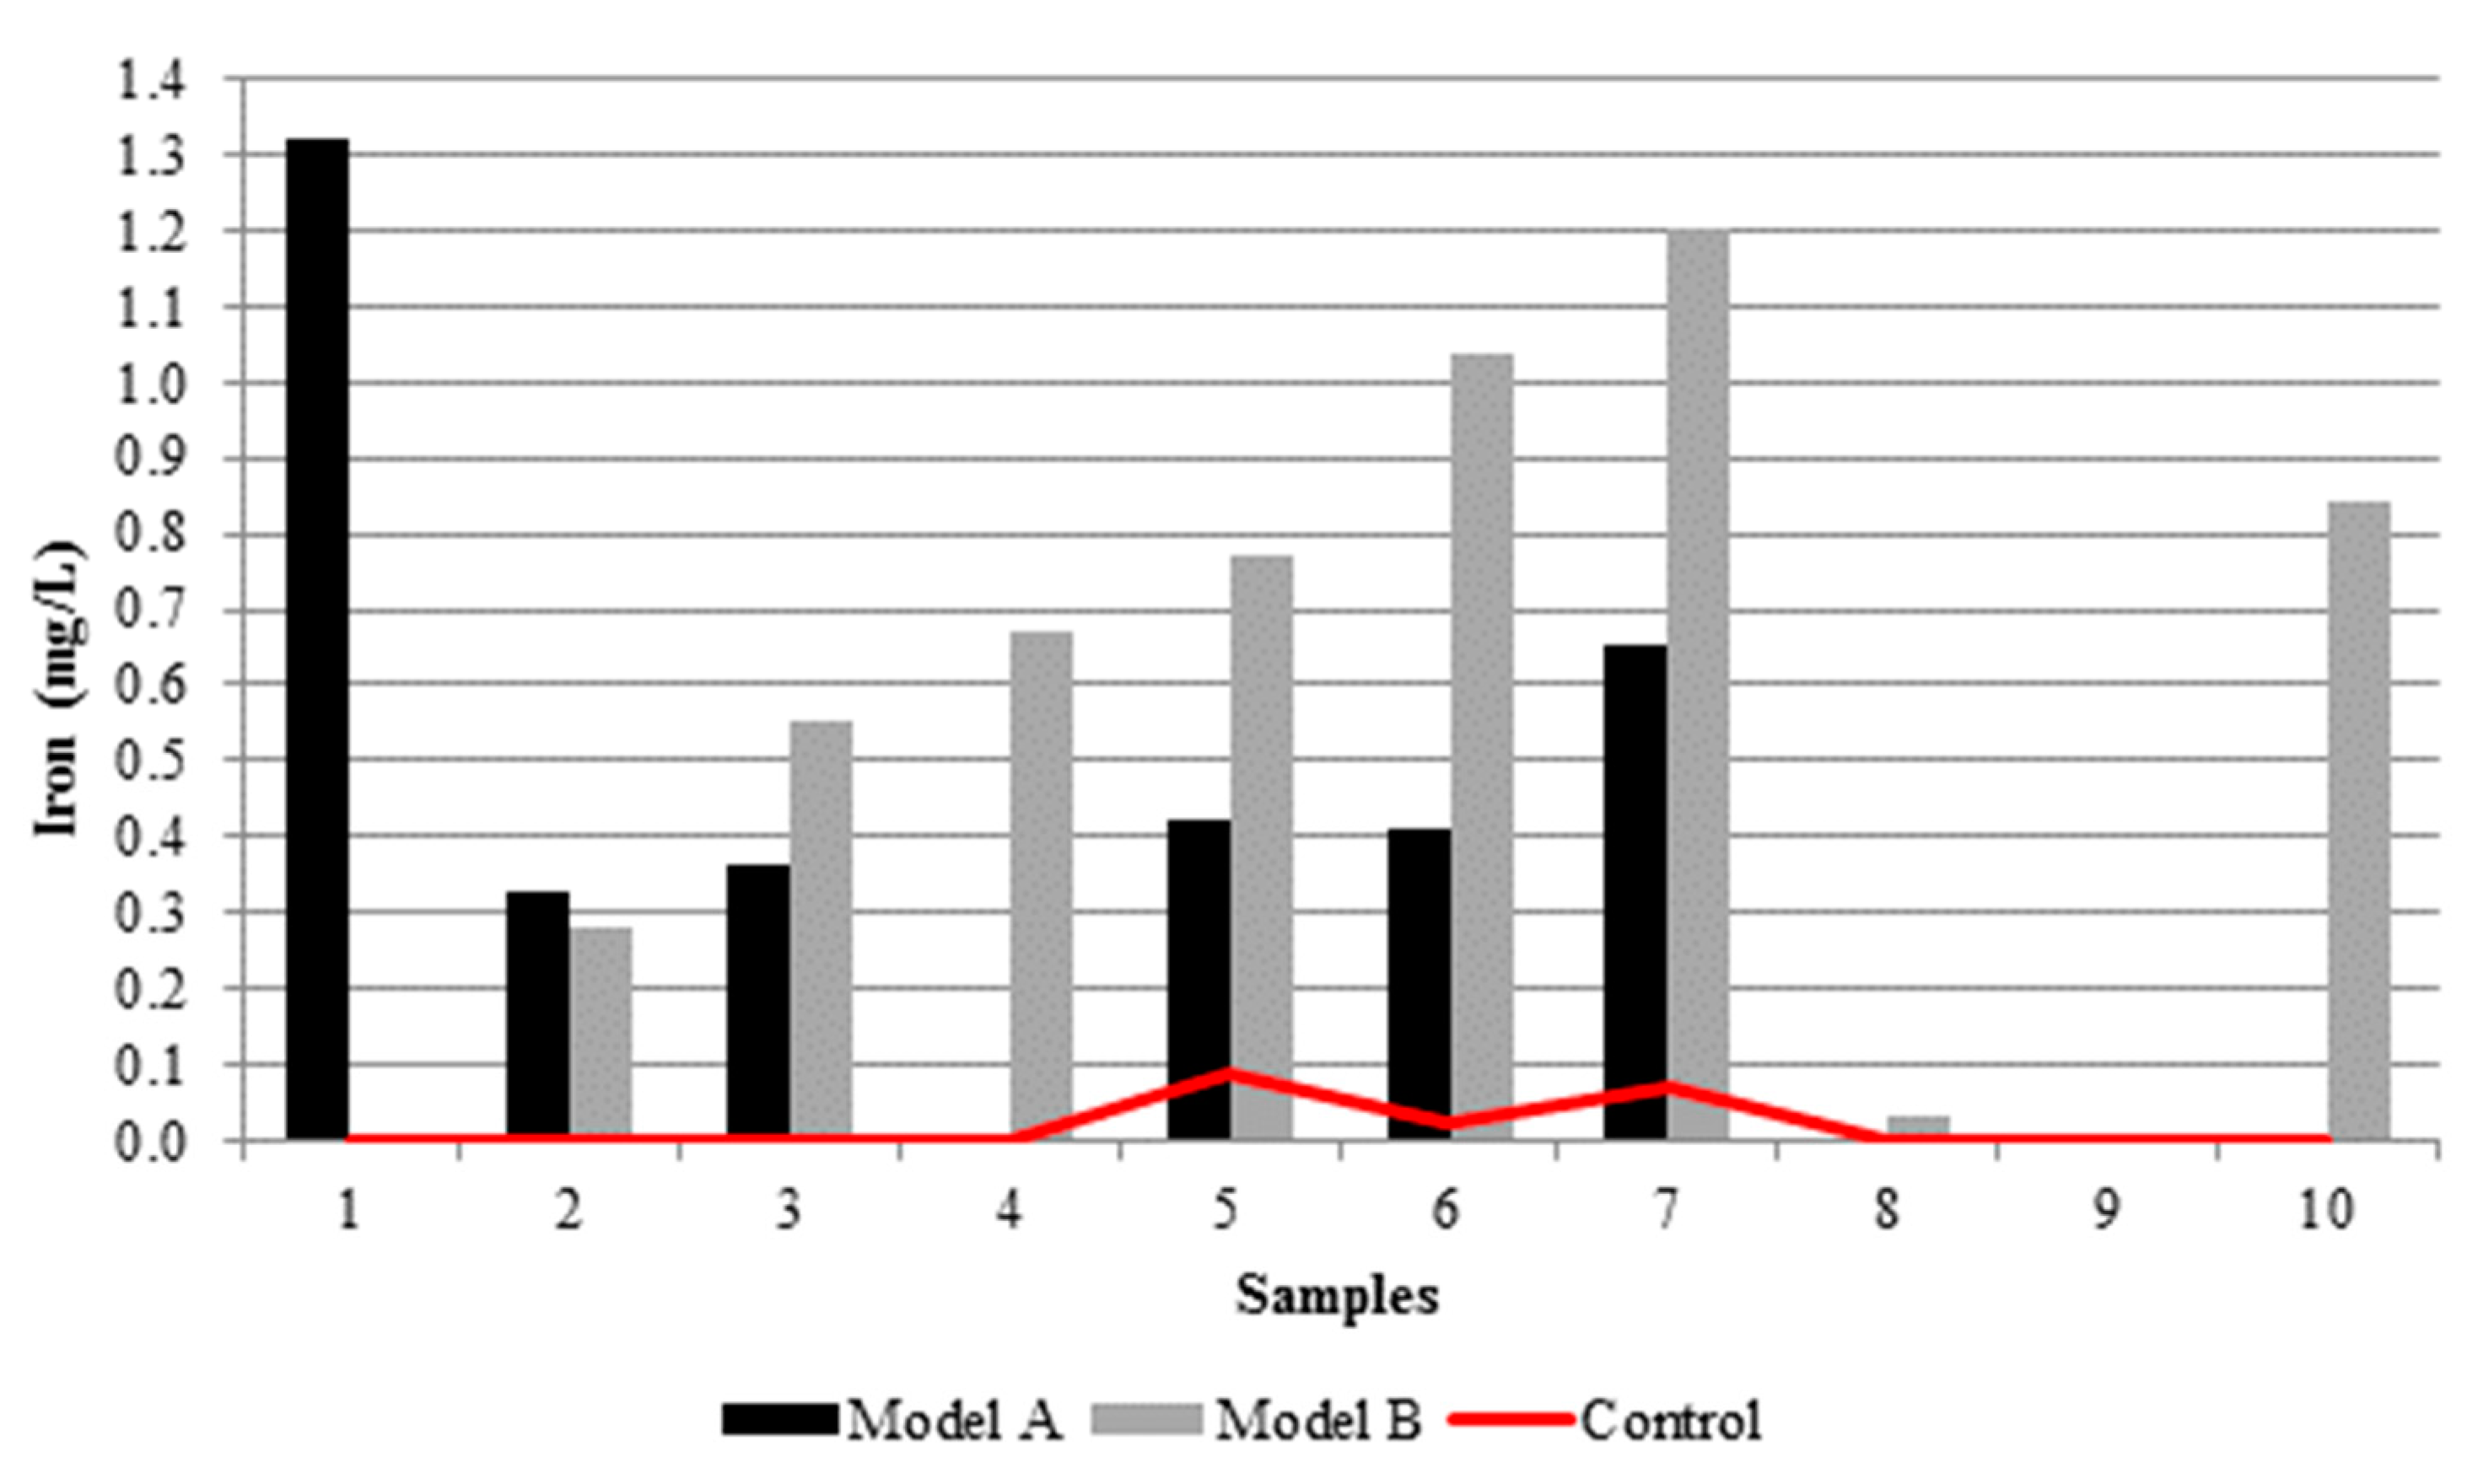
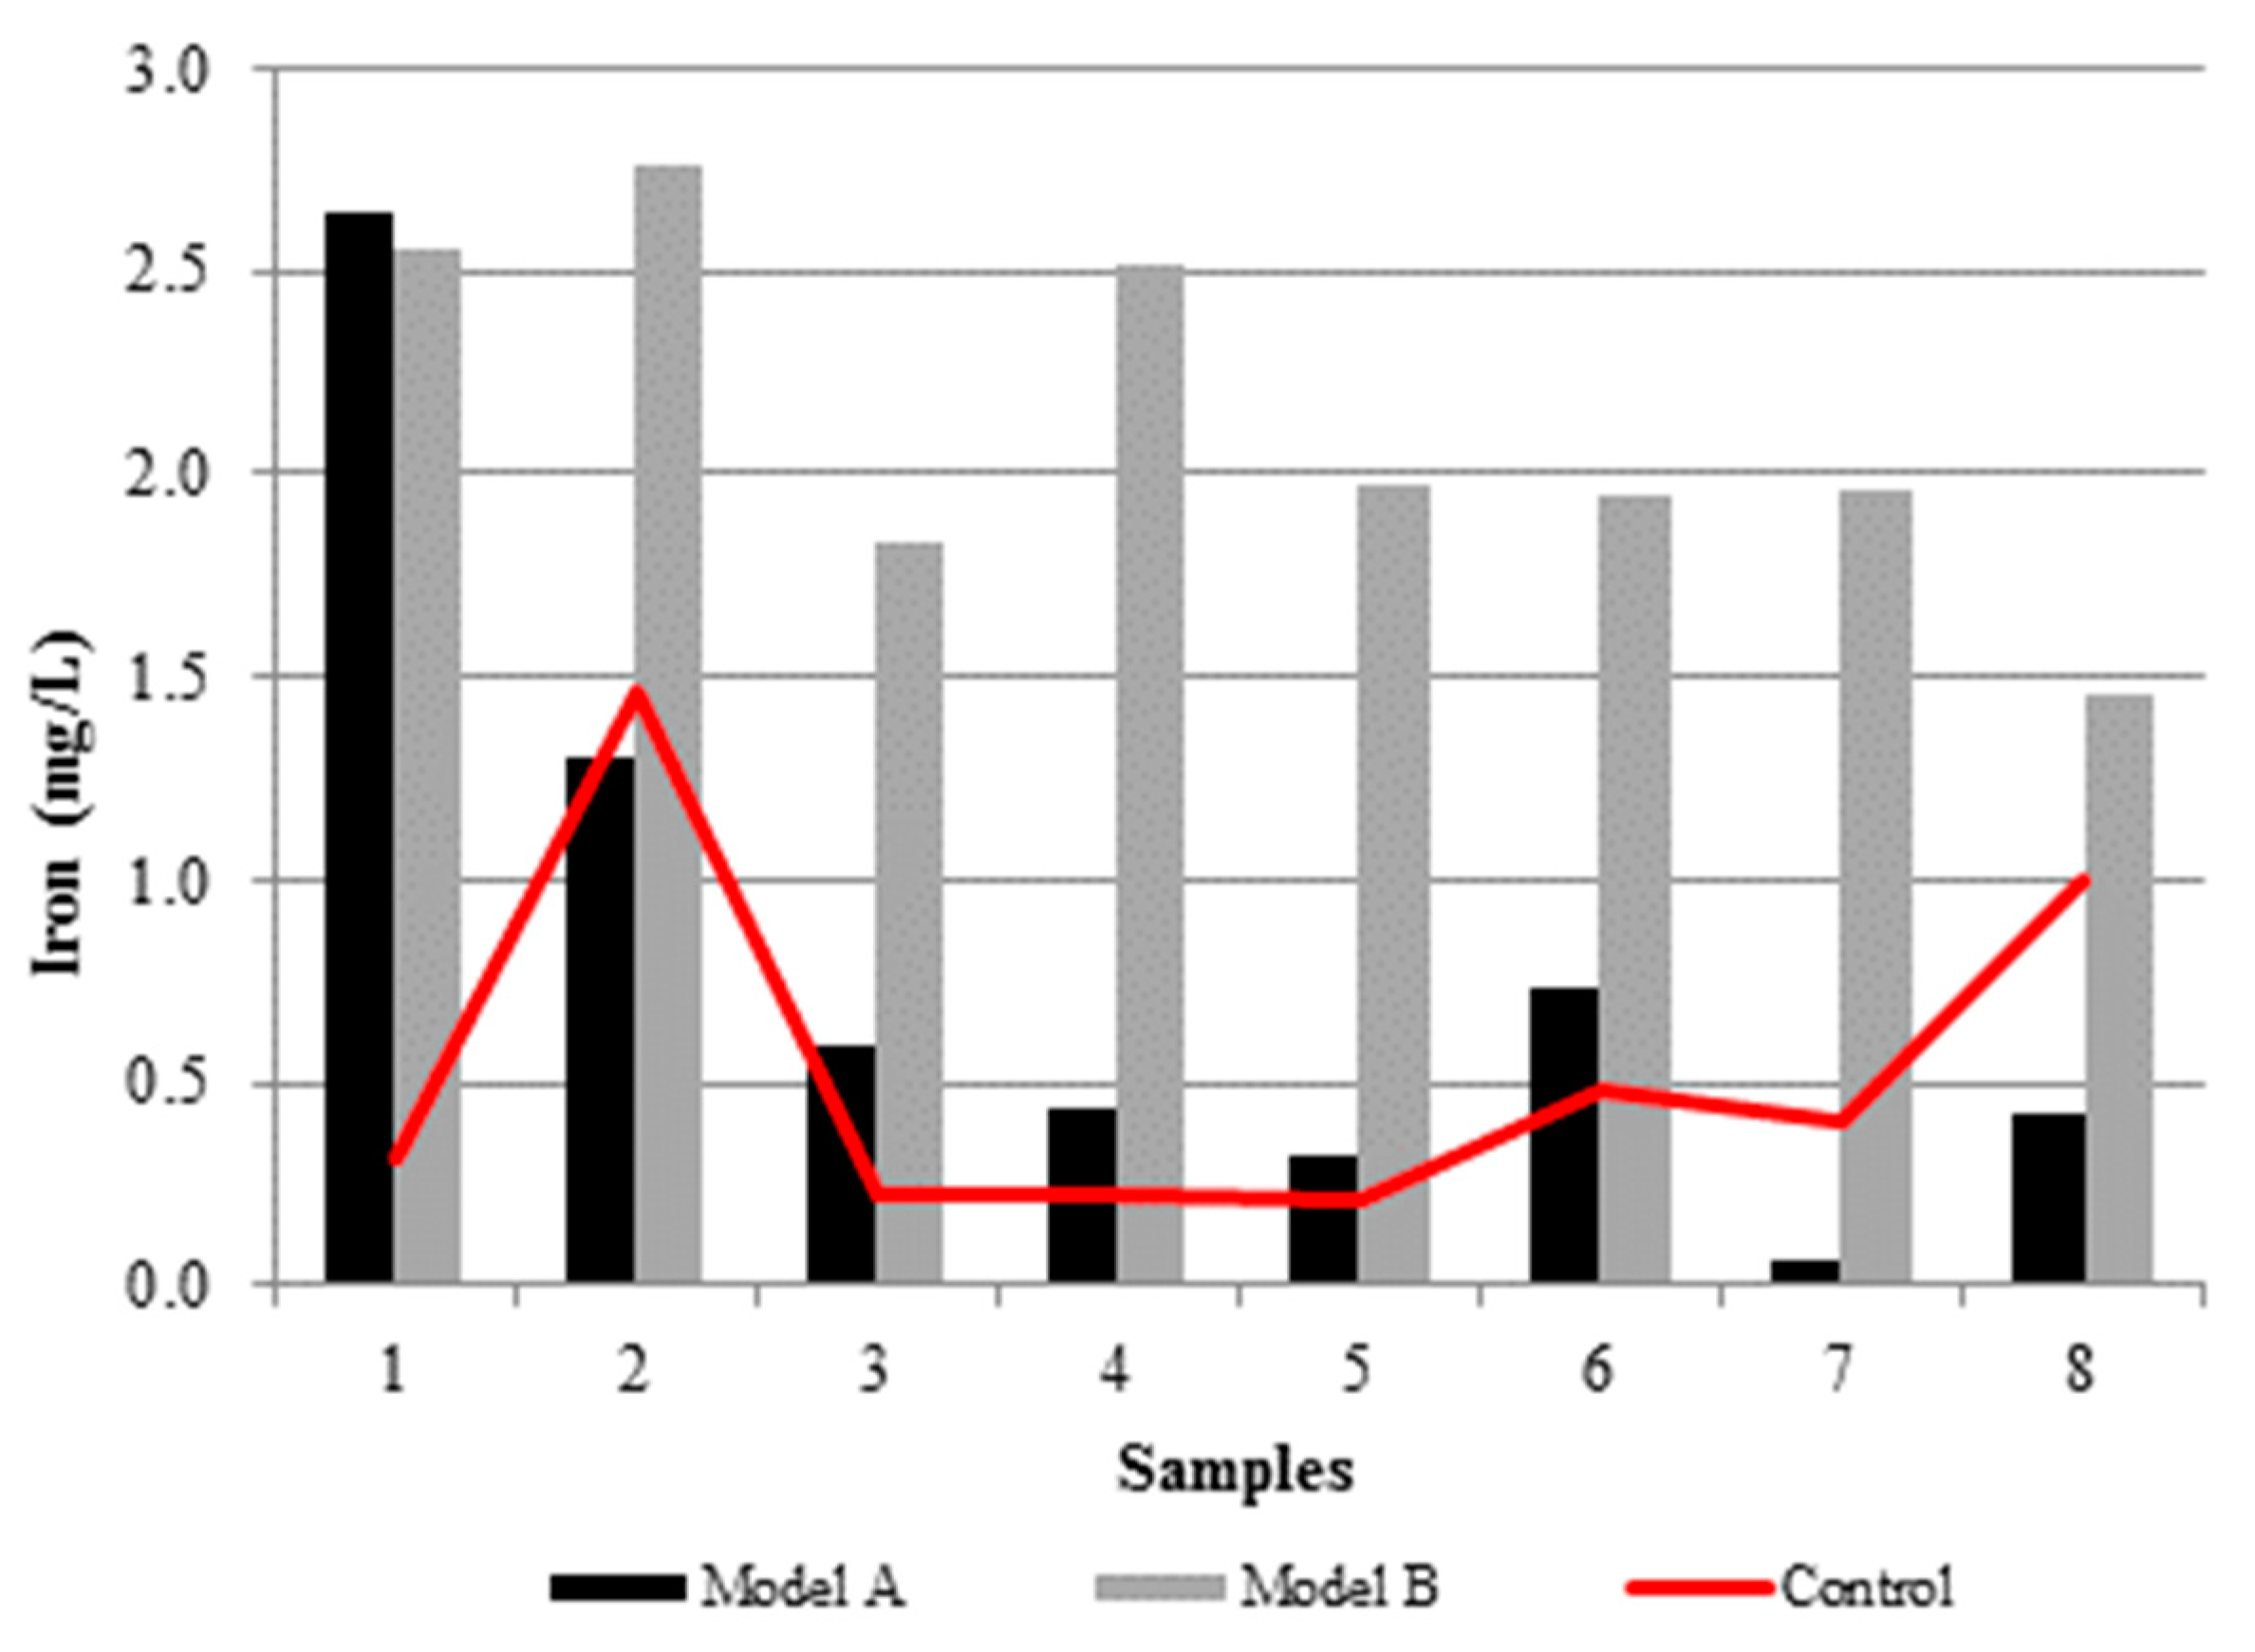
| Iron (mg/L) | Rainwater | Average | 0.02 | 0.35 | 0.54 | ≤15.00 |
| Standard deviation | 0.03 | 0.41 | 0.44 | |||
| Stormwater | Average | 0.54 | 0.81 | 2.12 | ||
| Standard deviation | 0.45 | 0.82 | 0.44 | |||
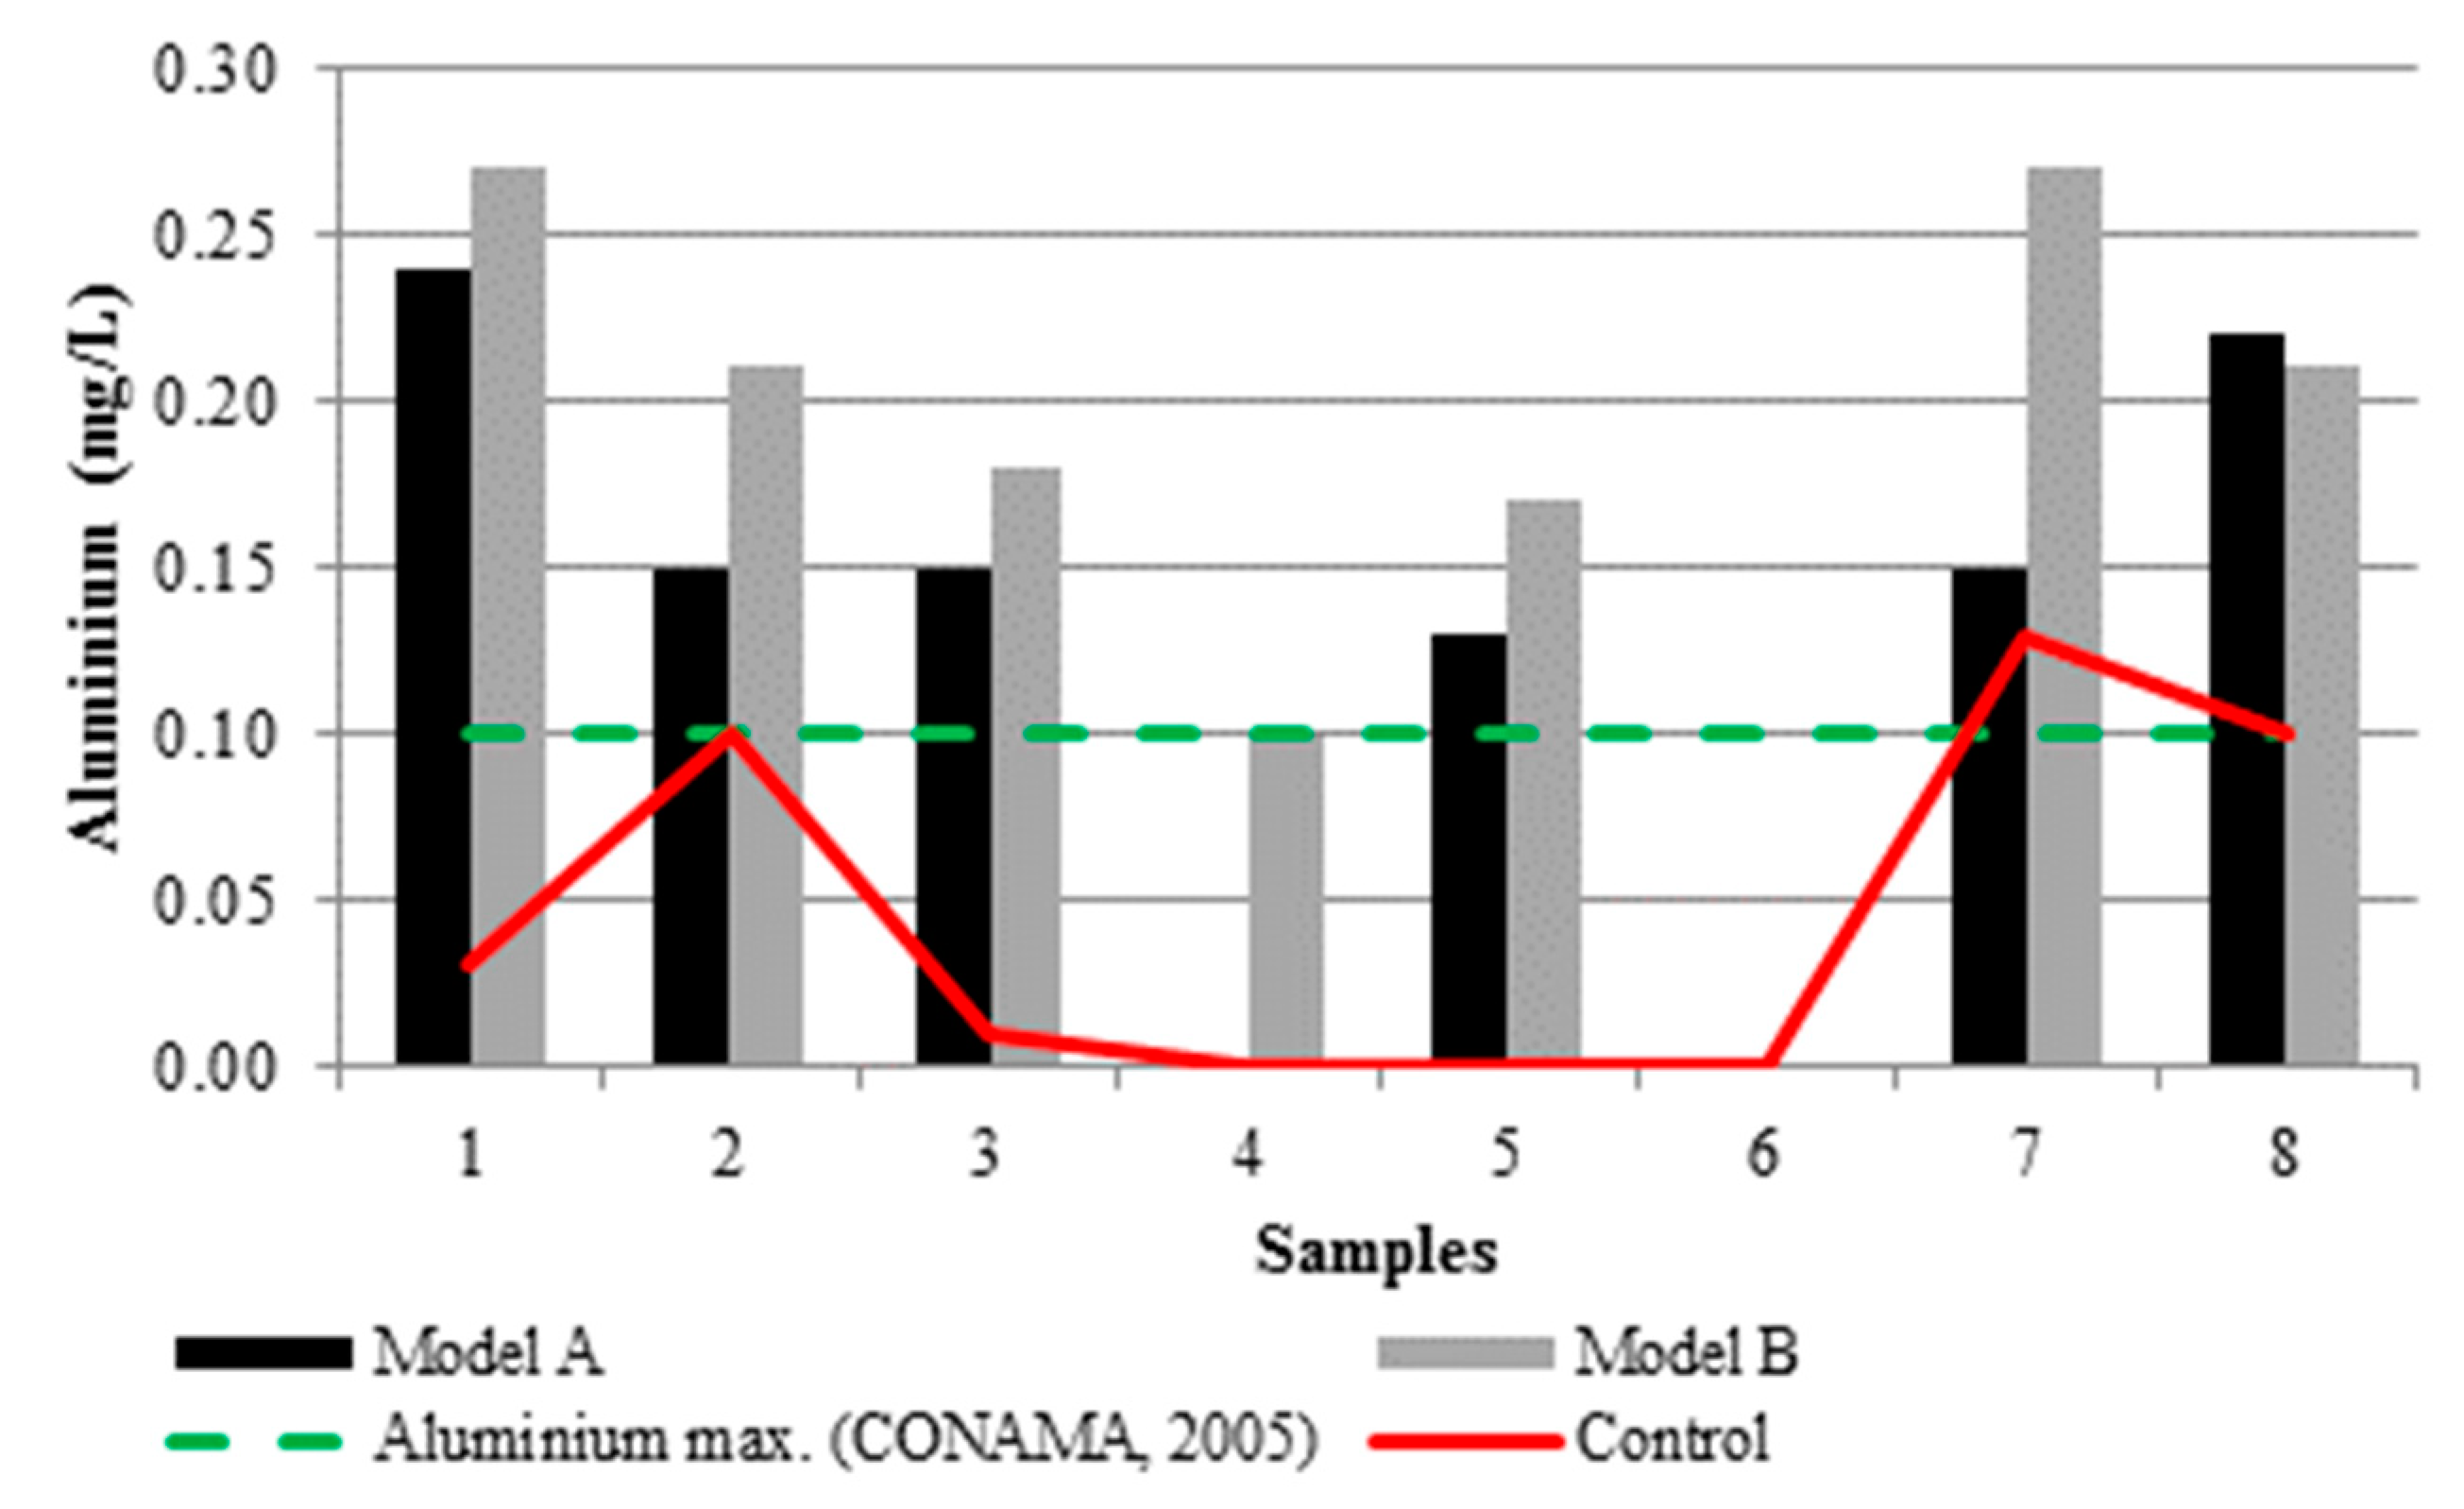
| Aluminium (mg/L) | Rainwater | Average | 0.03 | 0.12 | 0.08 | ≤ 0.10 |
| Standard deviation | 0.03 | 0.11 | 0.04 | |||
| Stormwater | Average | 0.05 | 0.13 | 0.18 | ||
| Standard deviation | 0.05 | 0.09 | 0.09 | |||
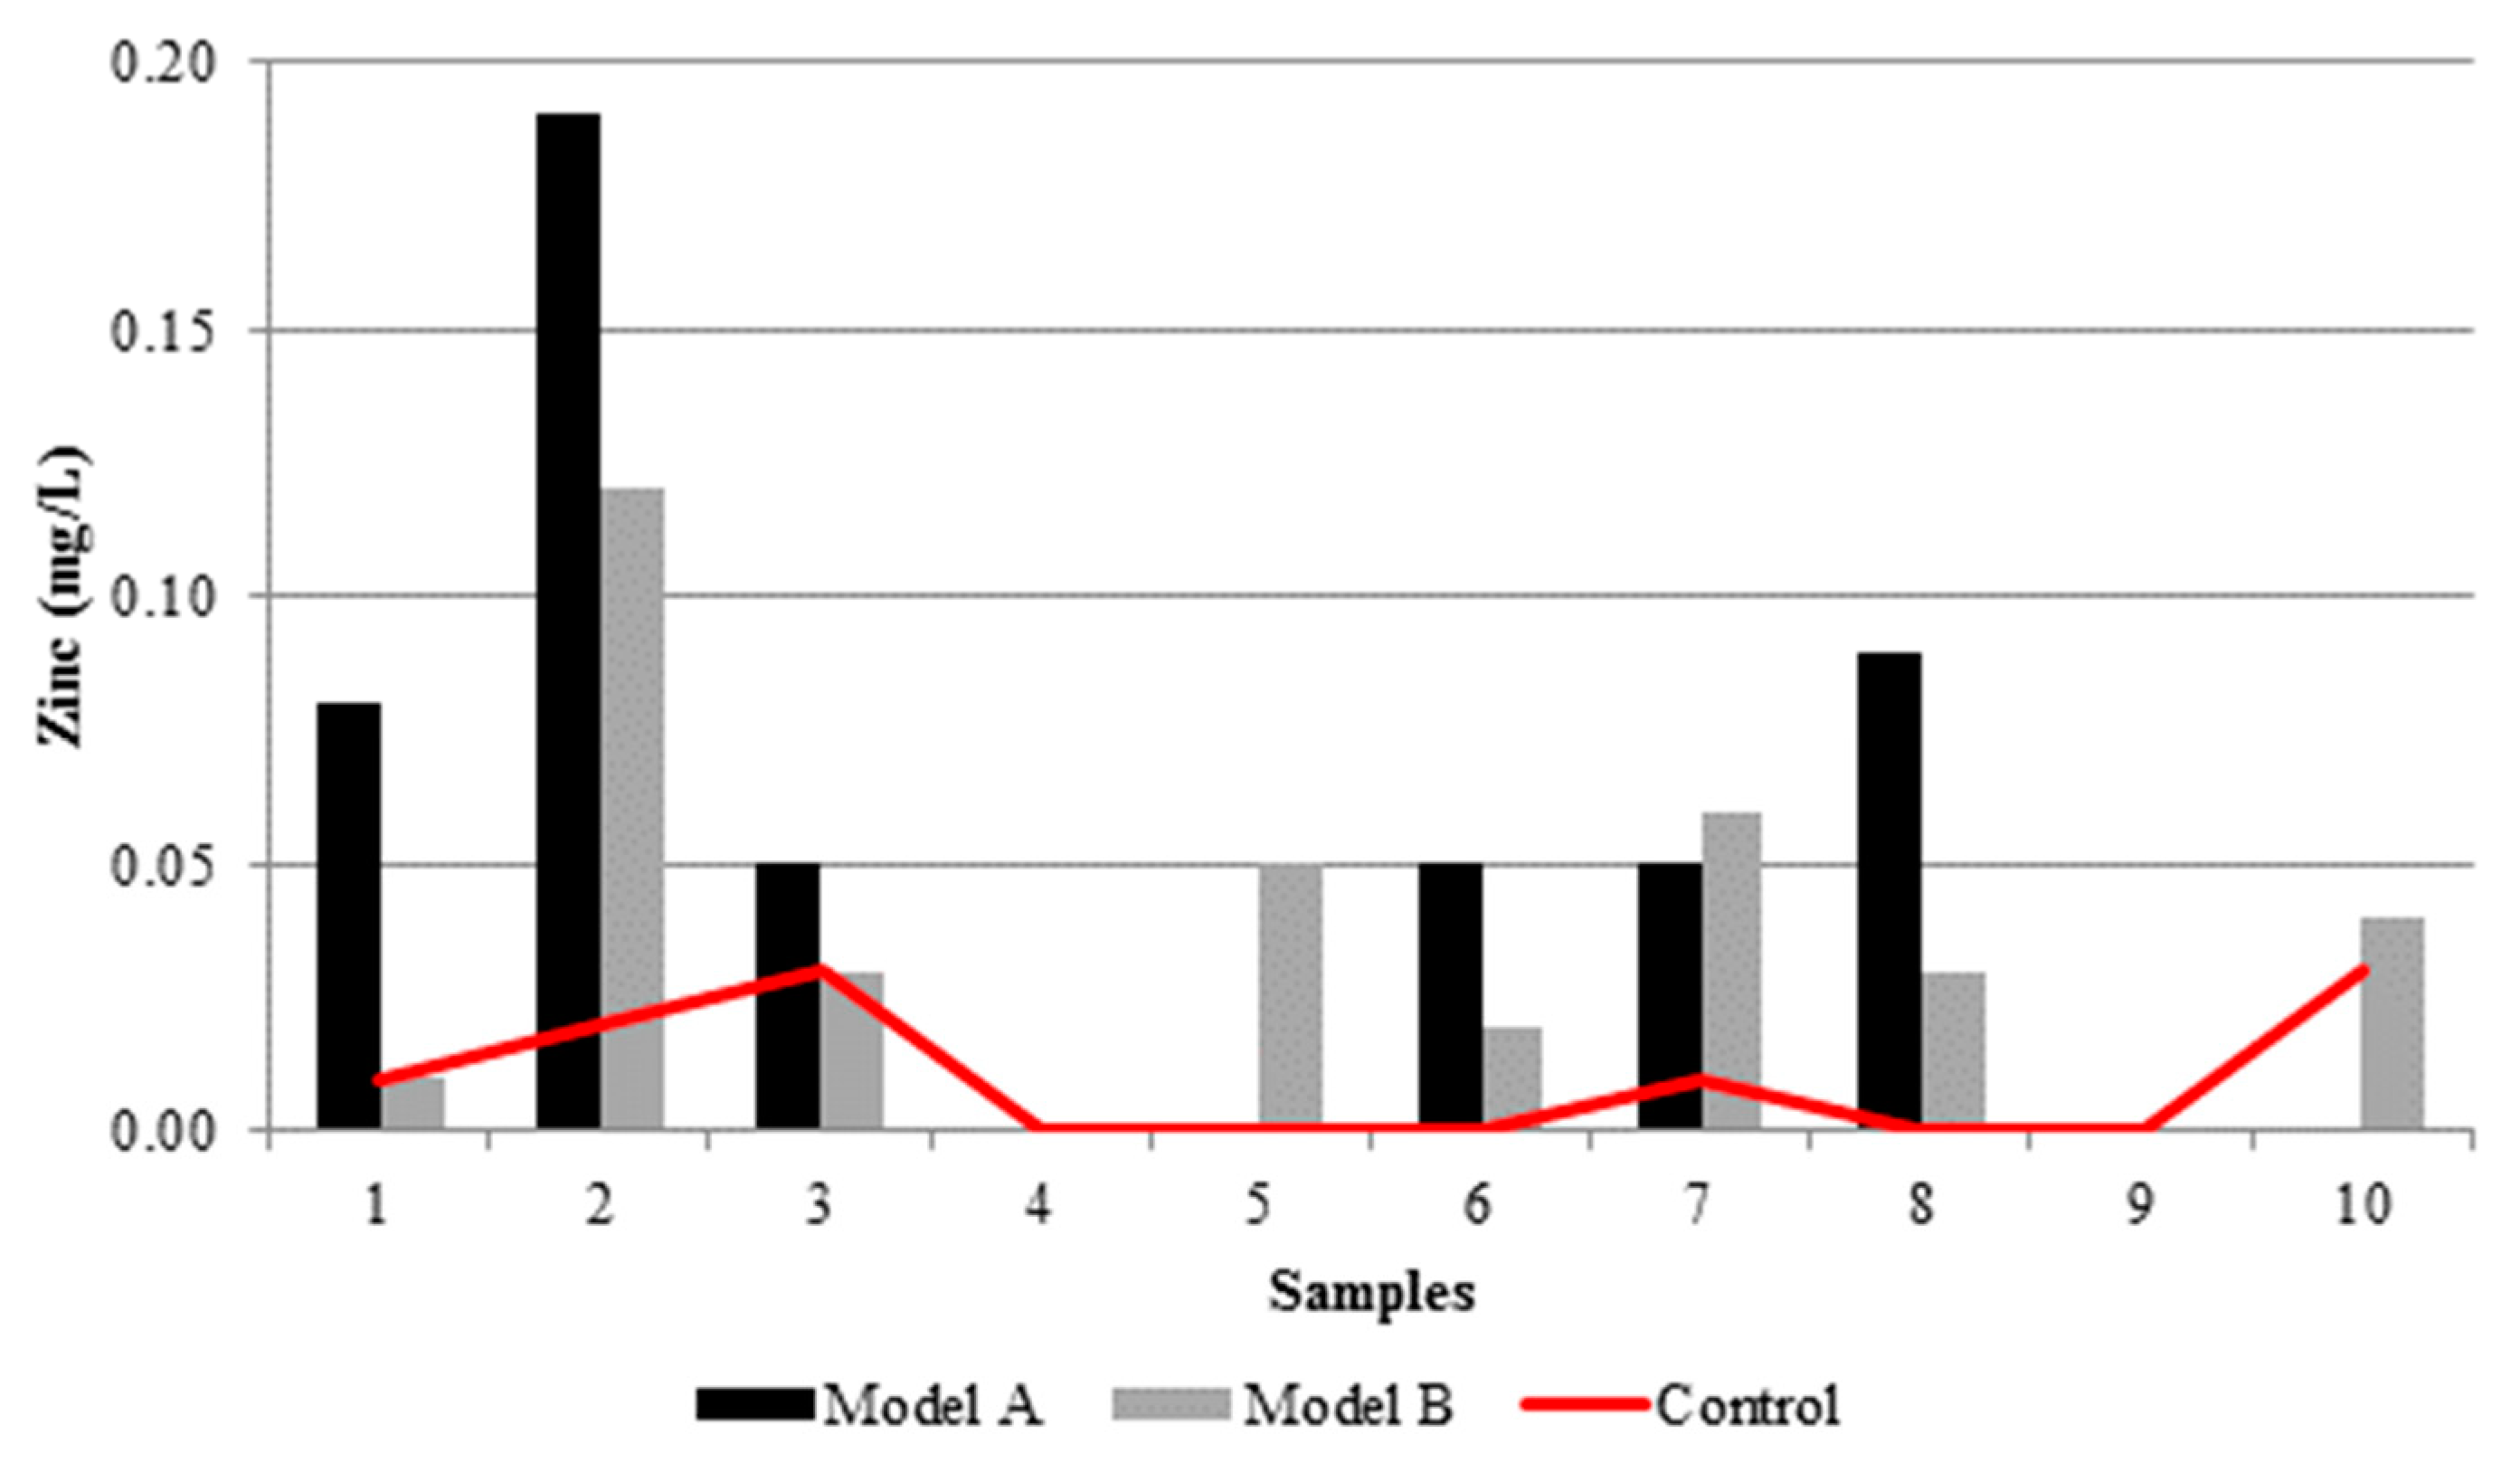
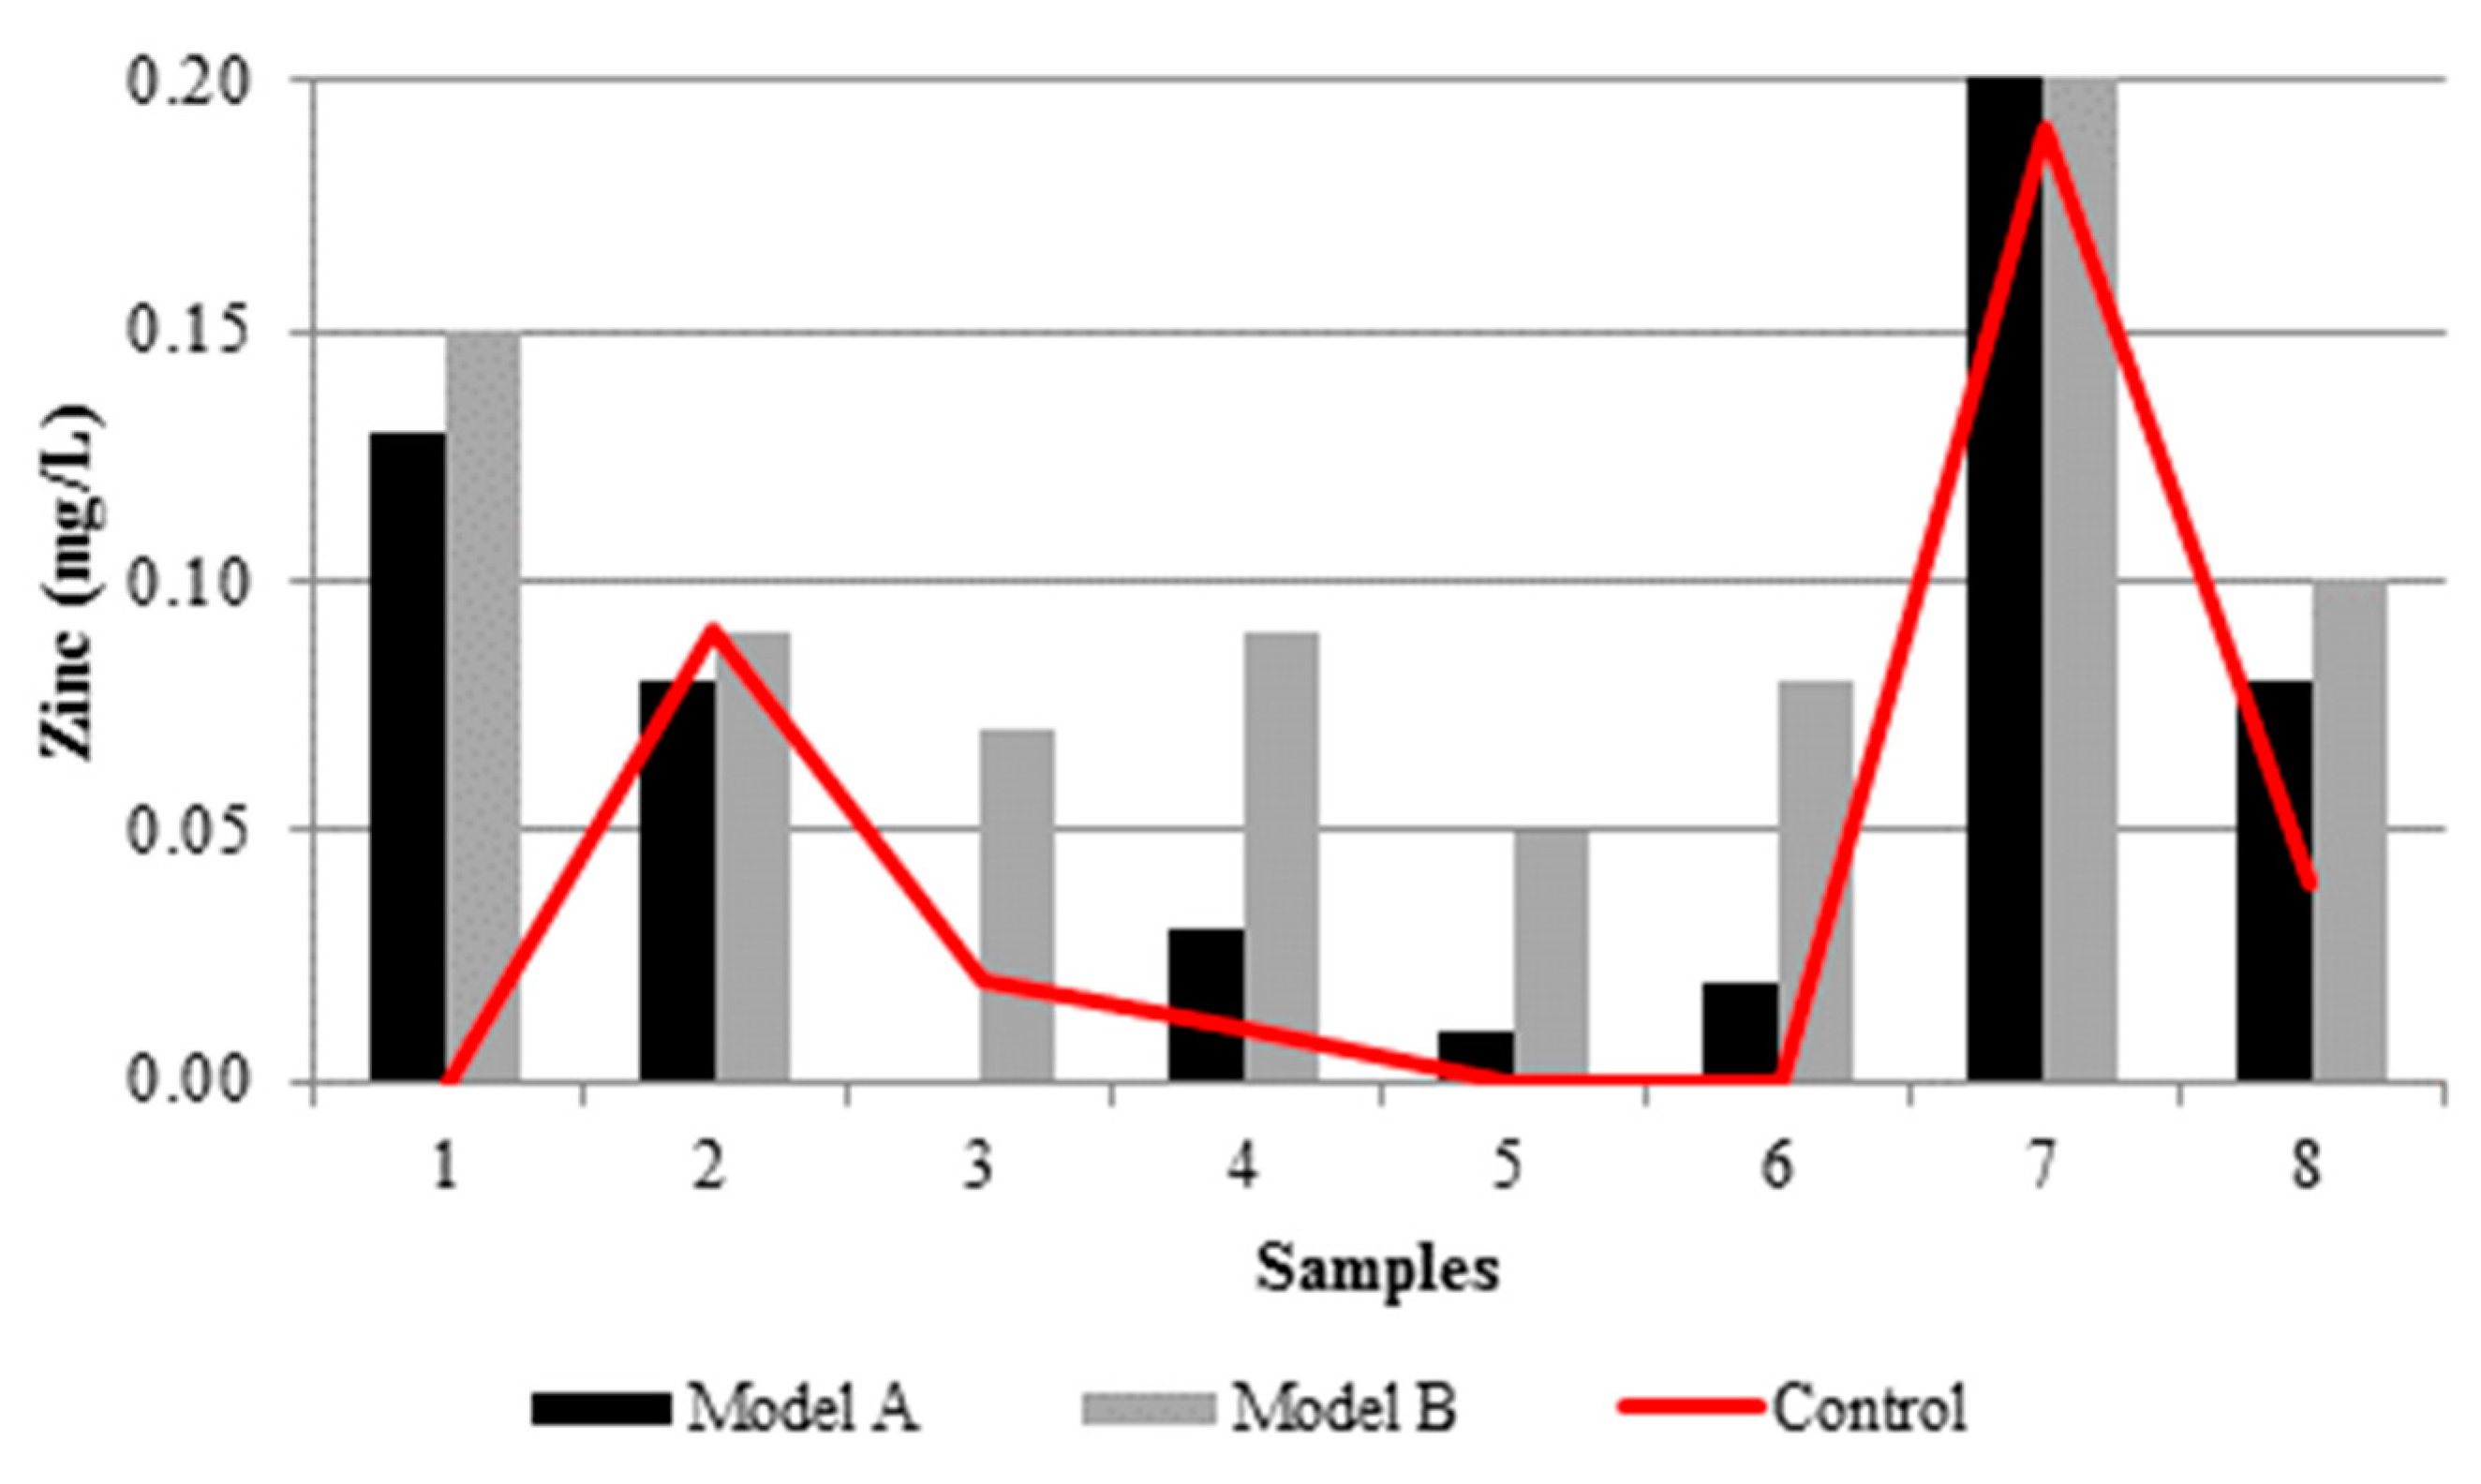
| Zinc (mg/L) | Rainwater | Average | 0.01 | 0.05 | 0.04 | ≤5.00 |
| Standard deviation | 0.01 | 0.06 | 0.04 | |||
| Stormwater | Average | 0.04 | 0.08 | 0.11 | ||
| Standard deviation | 0.07 | 0.10 | 0.05 | |||
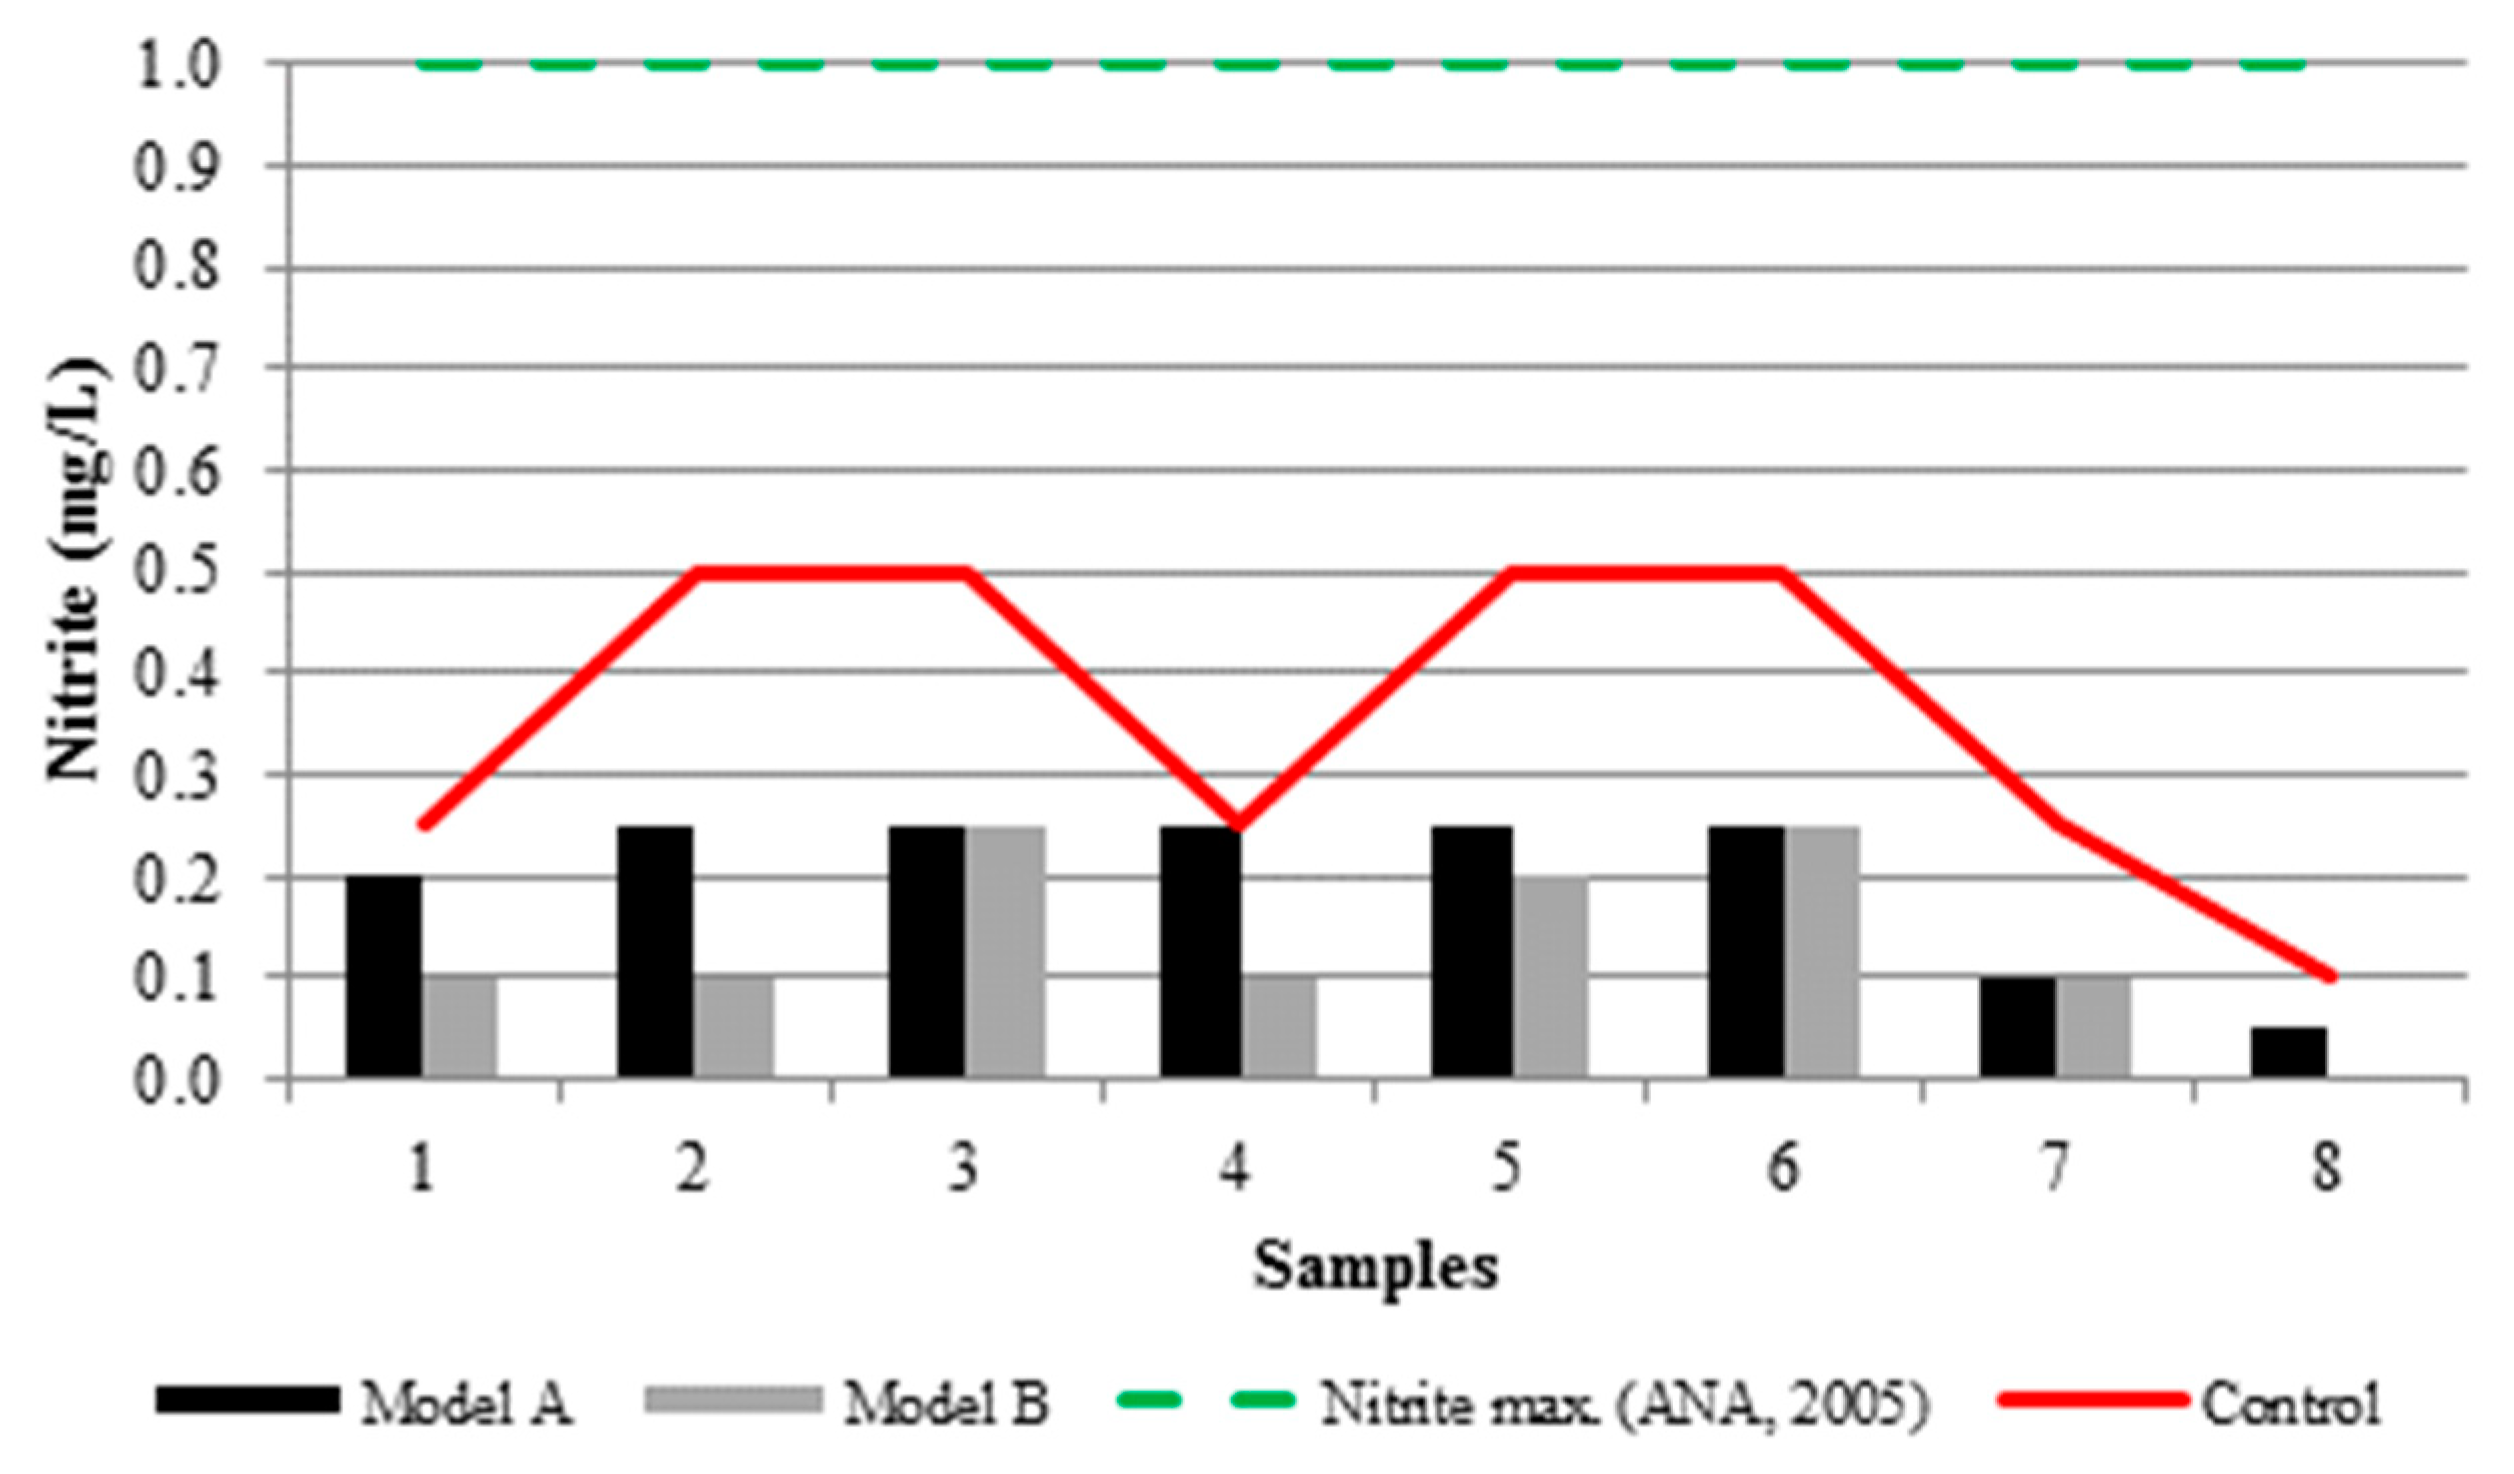
| Nitrite (mg/L) | Rainwater | Average | 0.01 | 0.02 | 0.04 | ≤1.00 |
| Standard deviation | 0.01 | 0.01 | 0.02 | |||
| Stormwater | Average | 0.36 | 0.20 | 0.14 | ||
| Standard deviation | 0.16 | 0.08 | 0.09 | |||
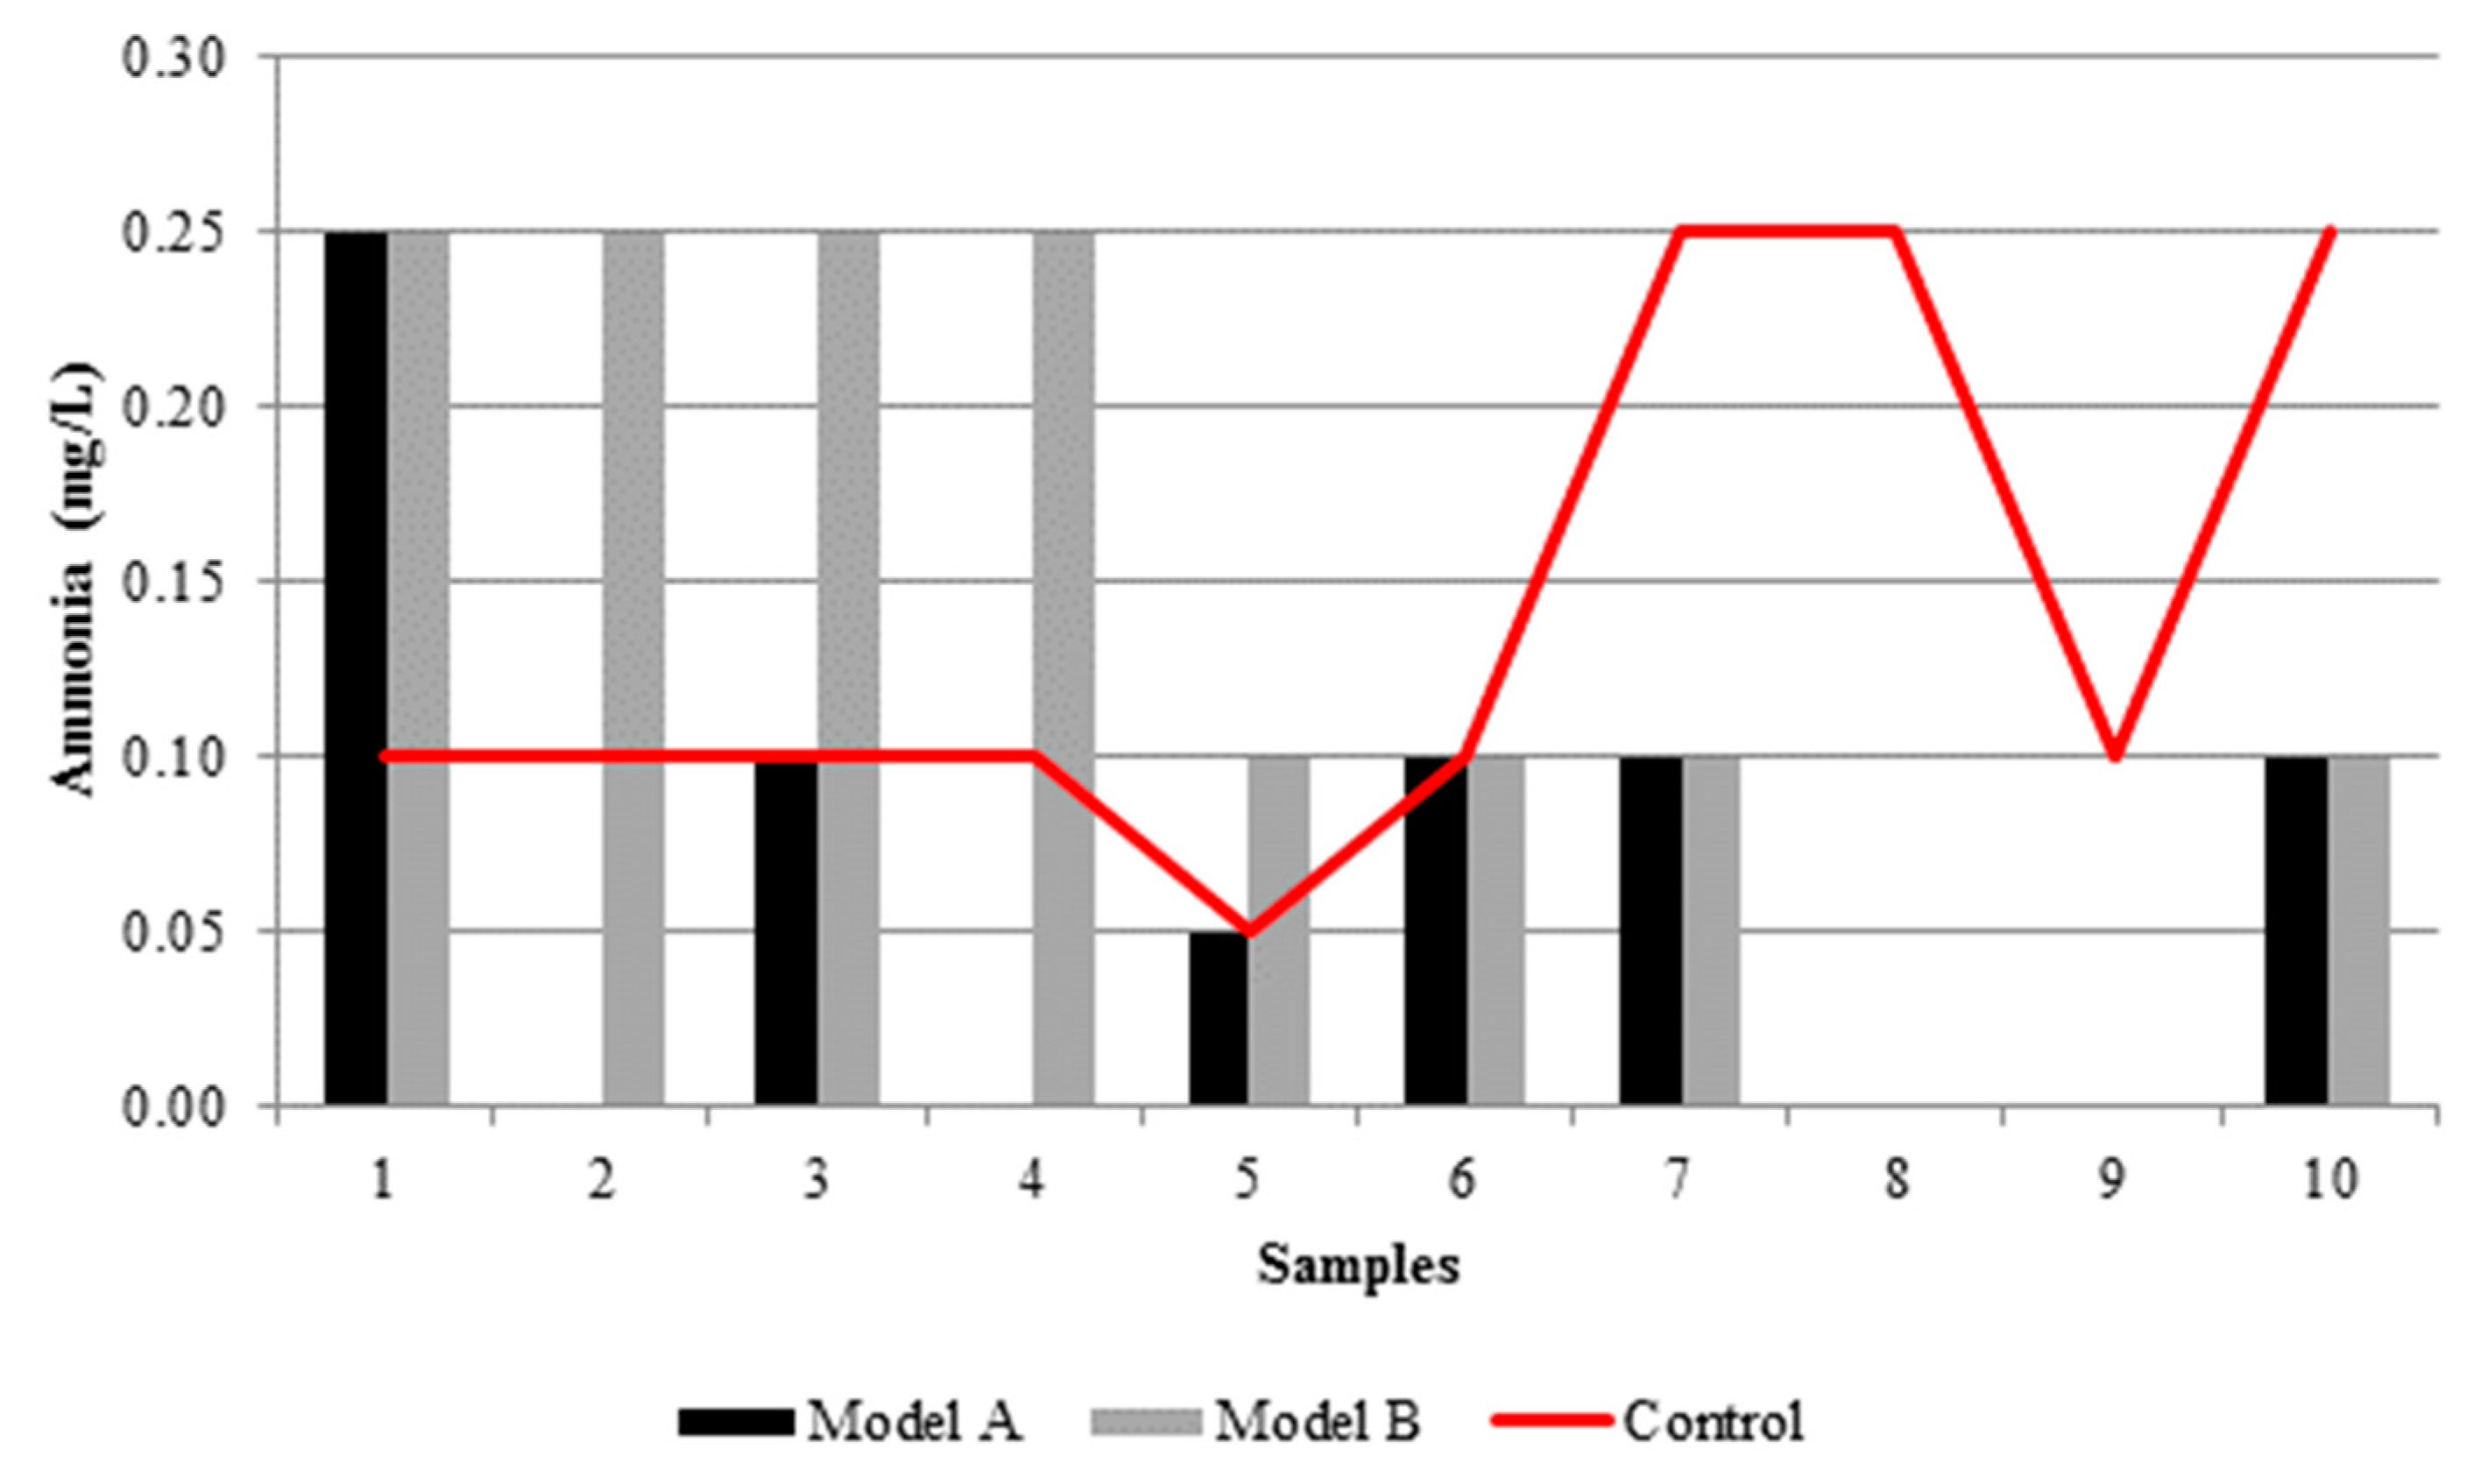
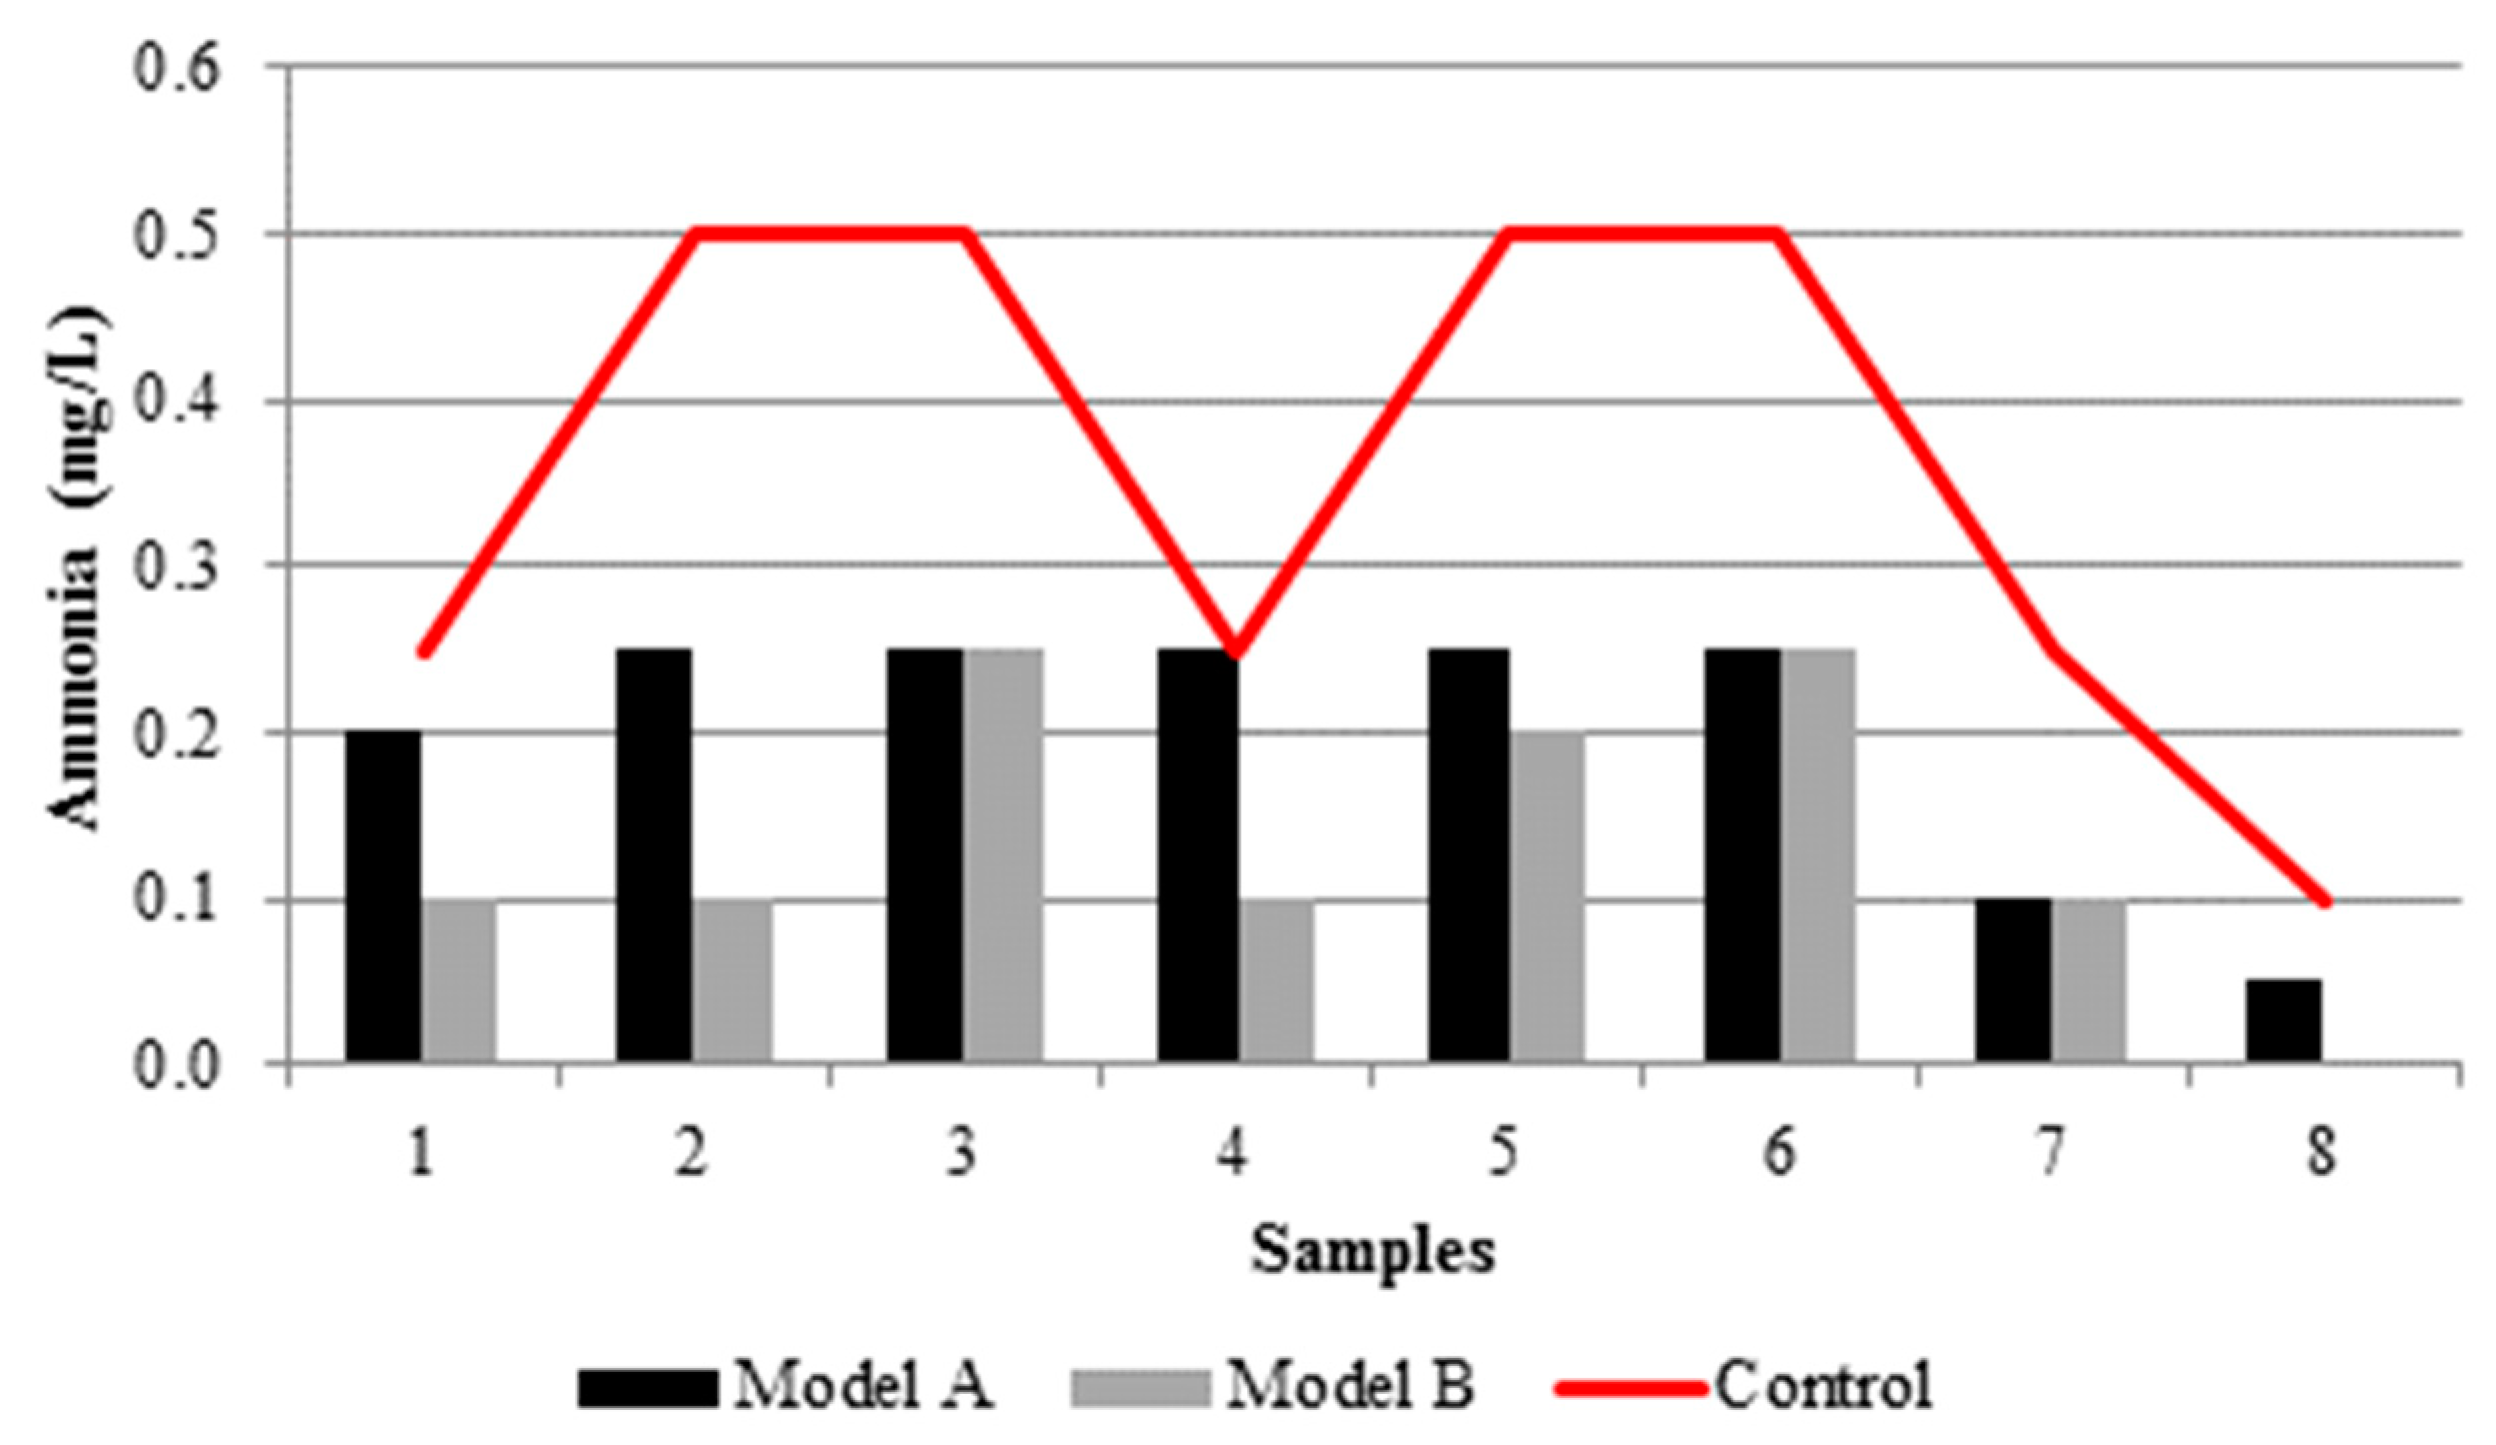
| Ammonia (mg/L) | Rainwater | Average | 0.14 | 0.07 | 0.14 | ≤20.00 |
| Standard deviation | 0.08 | 0.08 | 0.10 | |||
| Stormwater | Average | 0.36 | 0.20 | 0.14 | ||
| Standard deviation | 0.16 | 0.08 | 0.09 | |||
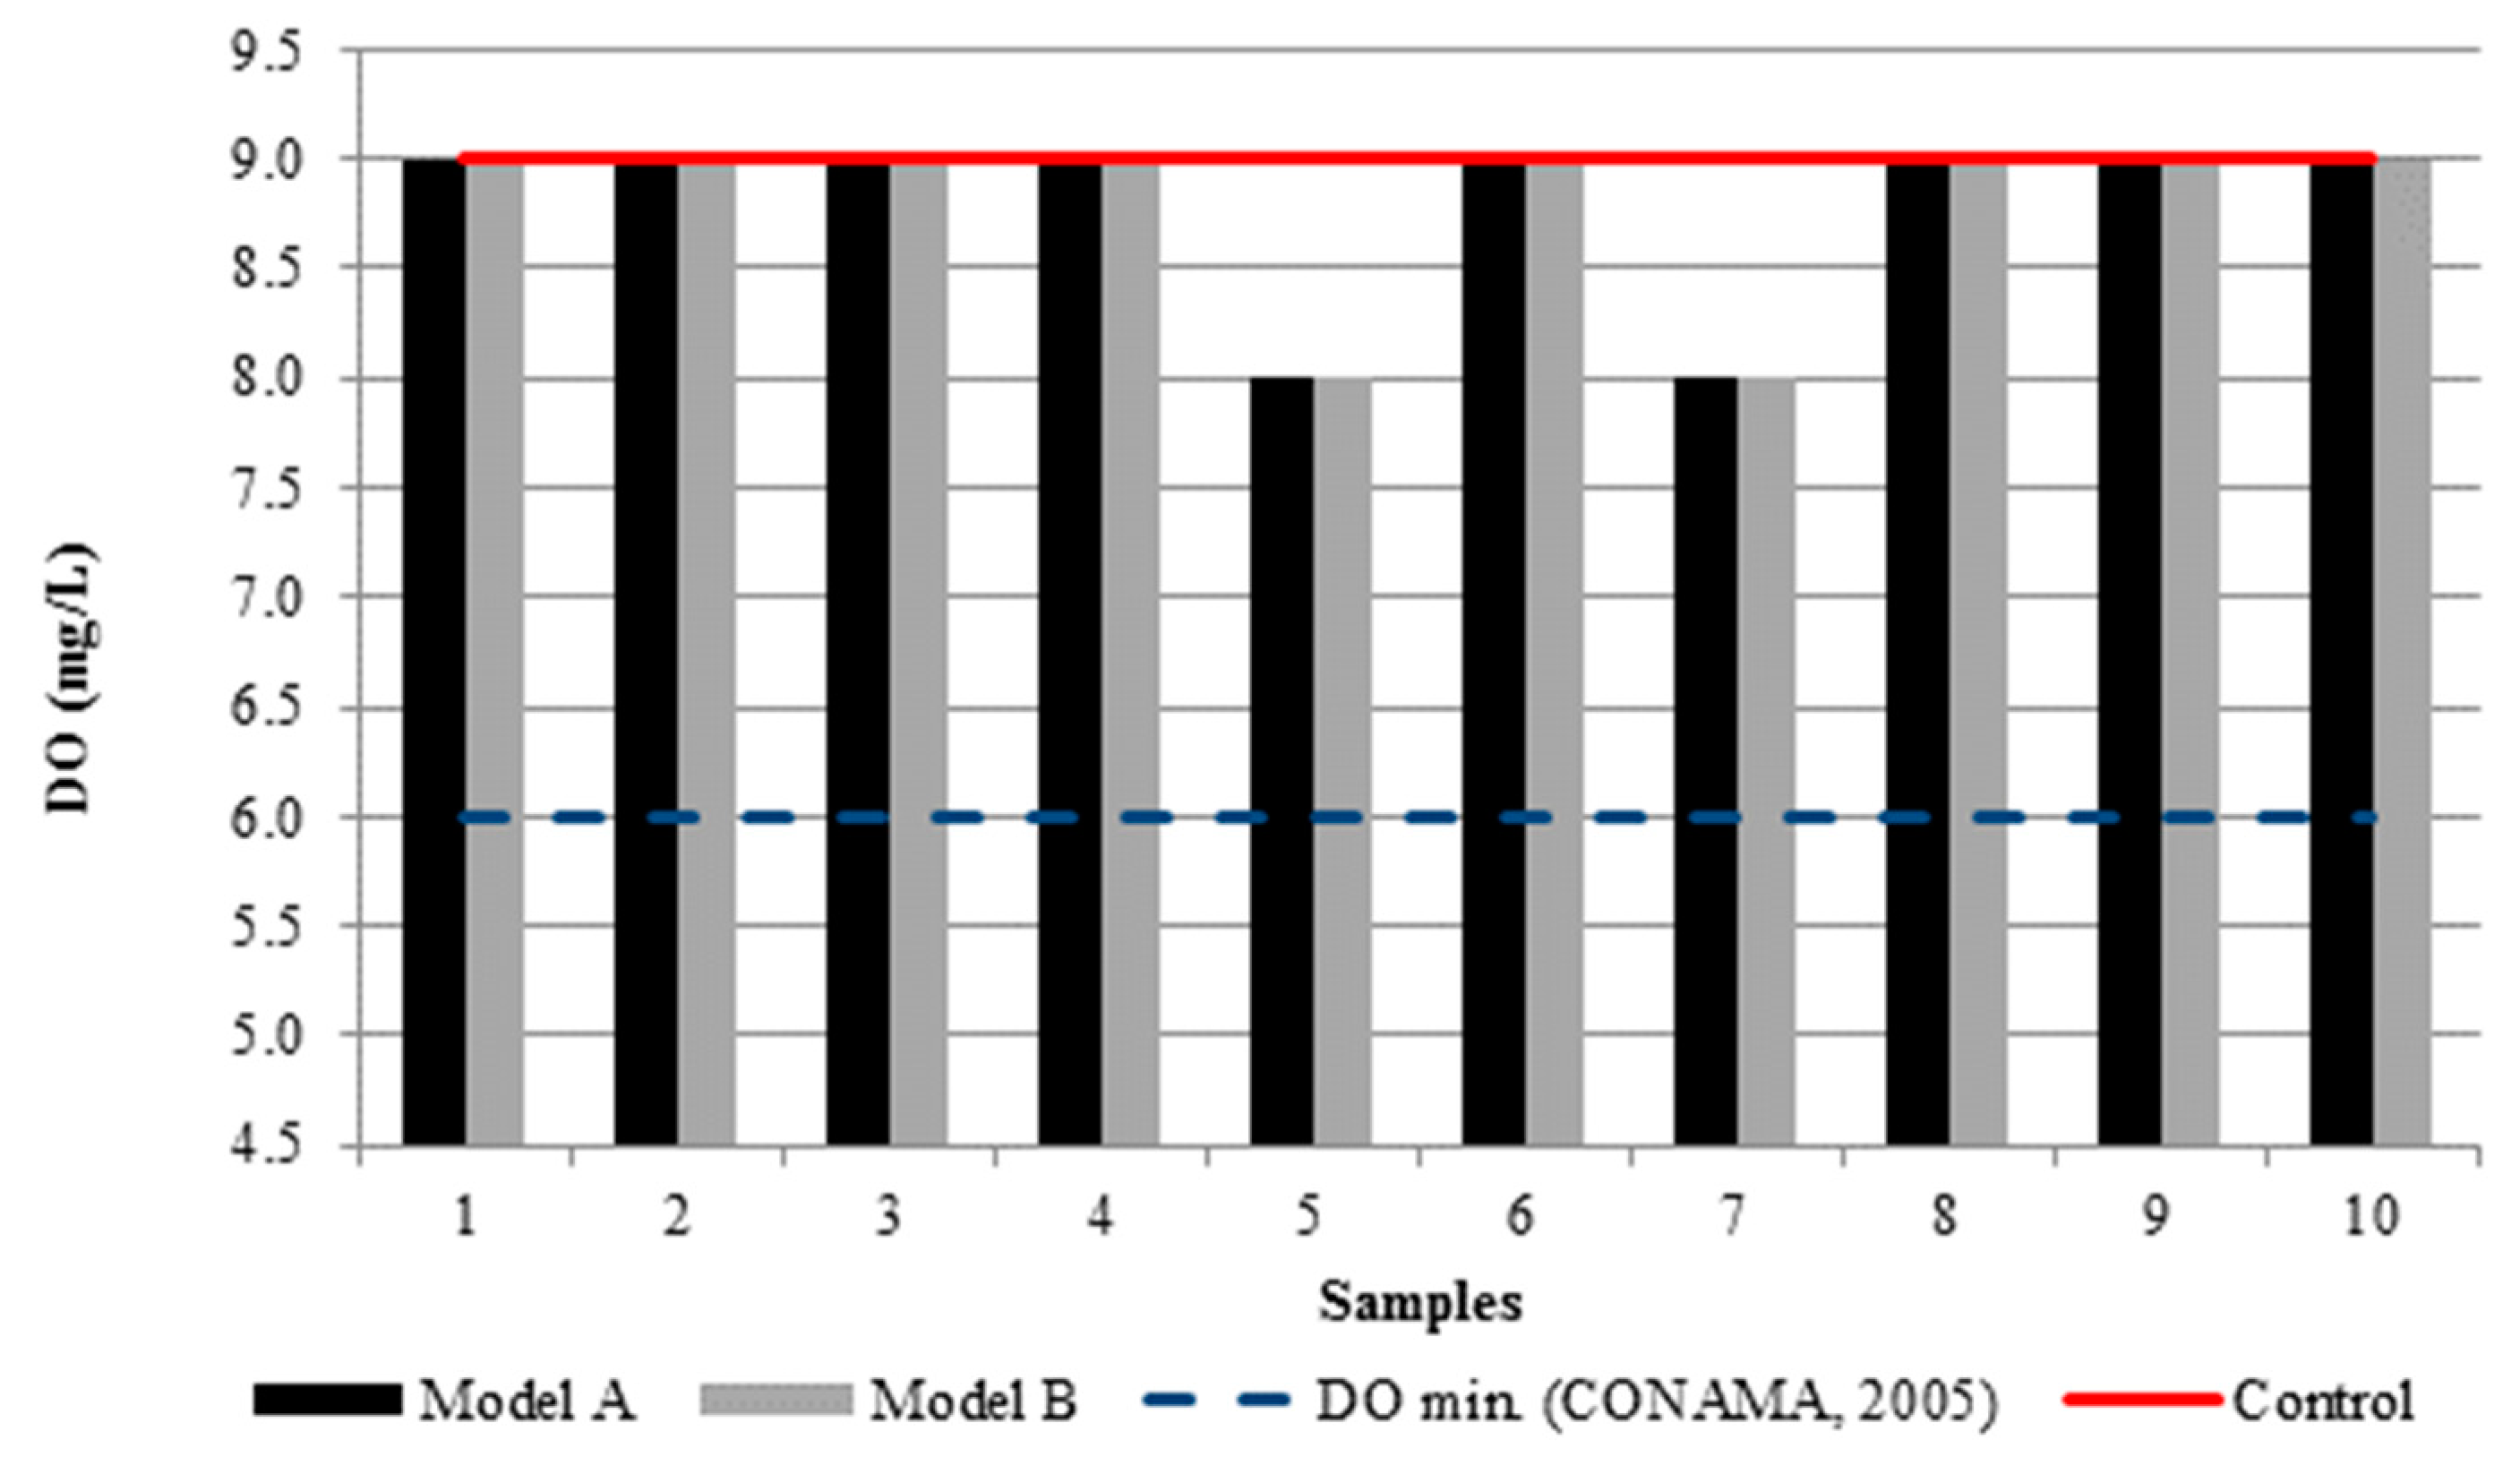
| DO (mg/L) | Rainwater | Average | 9.0 | 8.8 | 8.8 | ≥6.00 |
| Standard deviation | 0.0 | 0.4 | 0.4 | |||
| Stormwater | Average | 6.9 | 7.6 | 6.7 | ||
| Standard deviation | 0.2 | 0.2 | 0.2 | |||
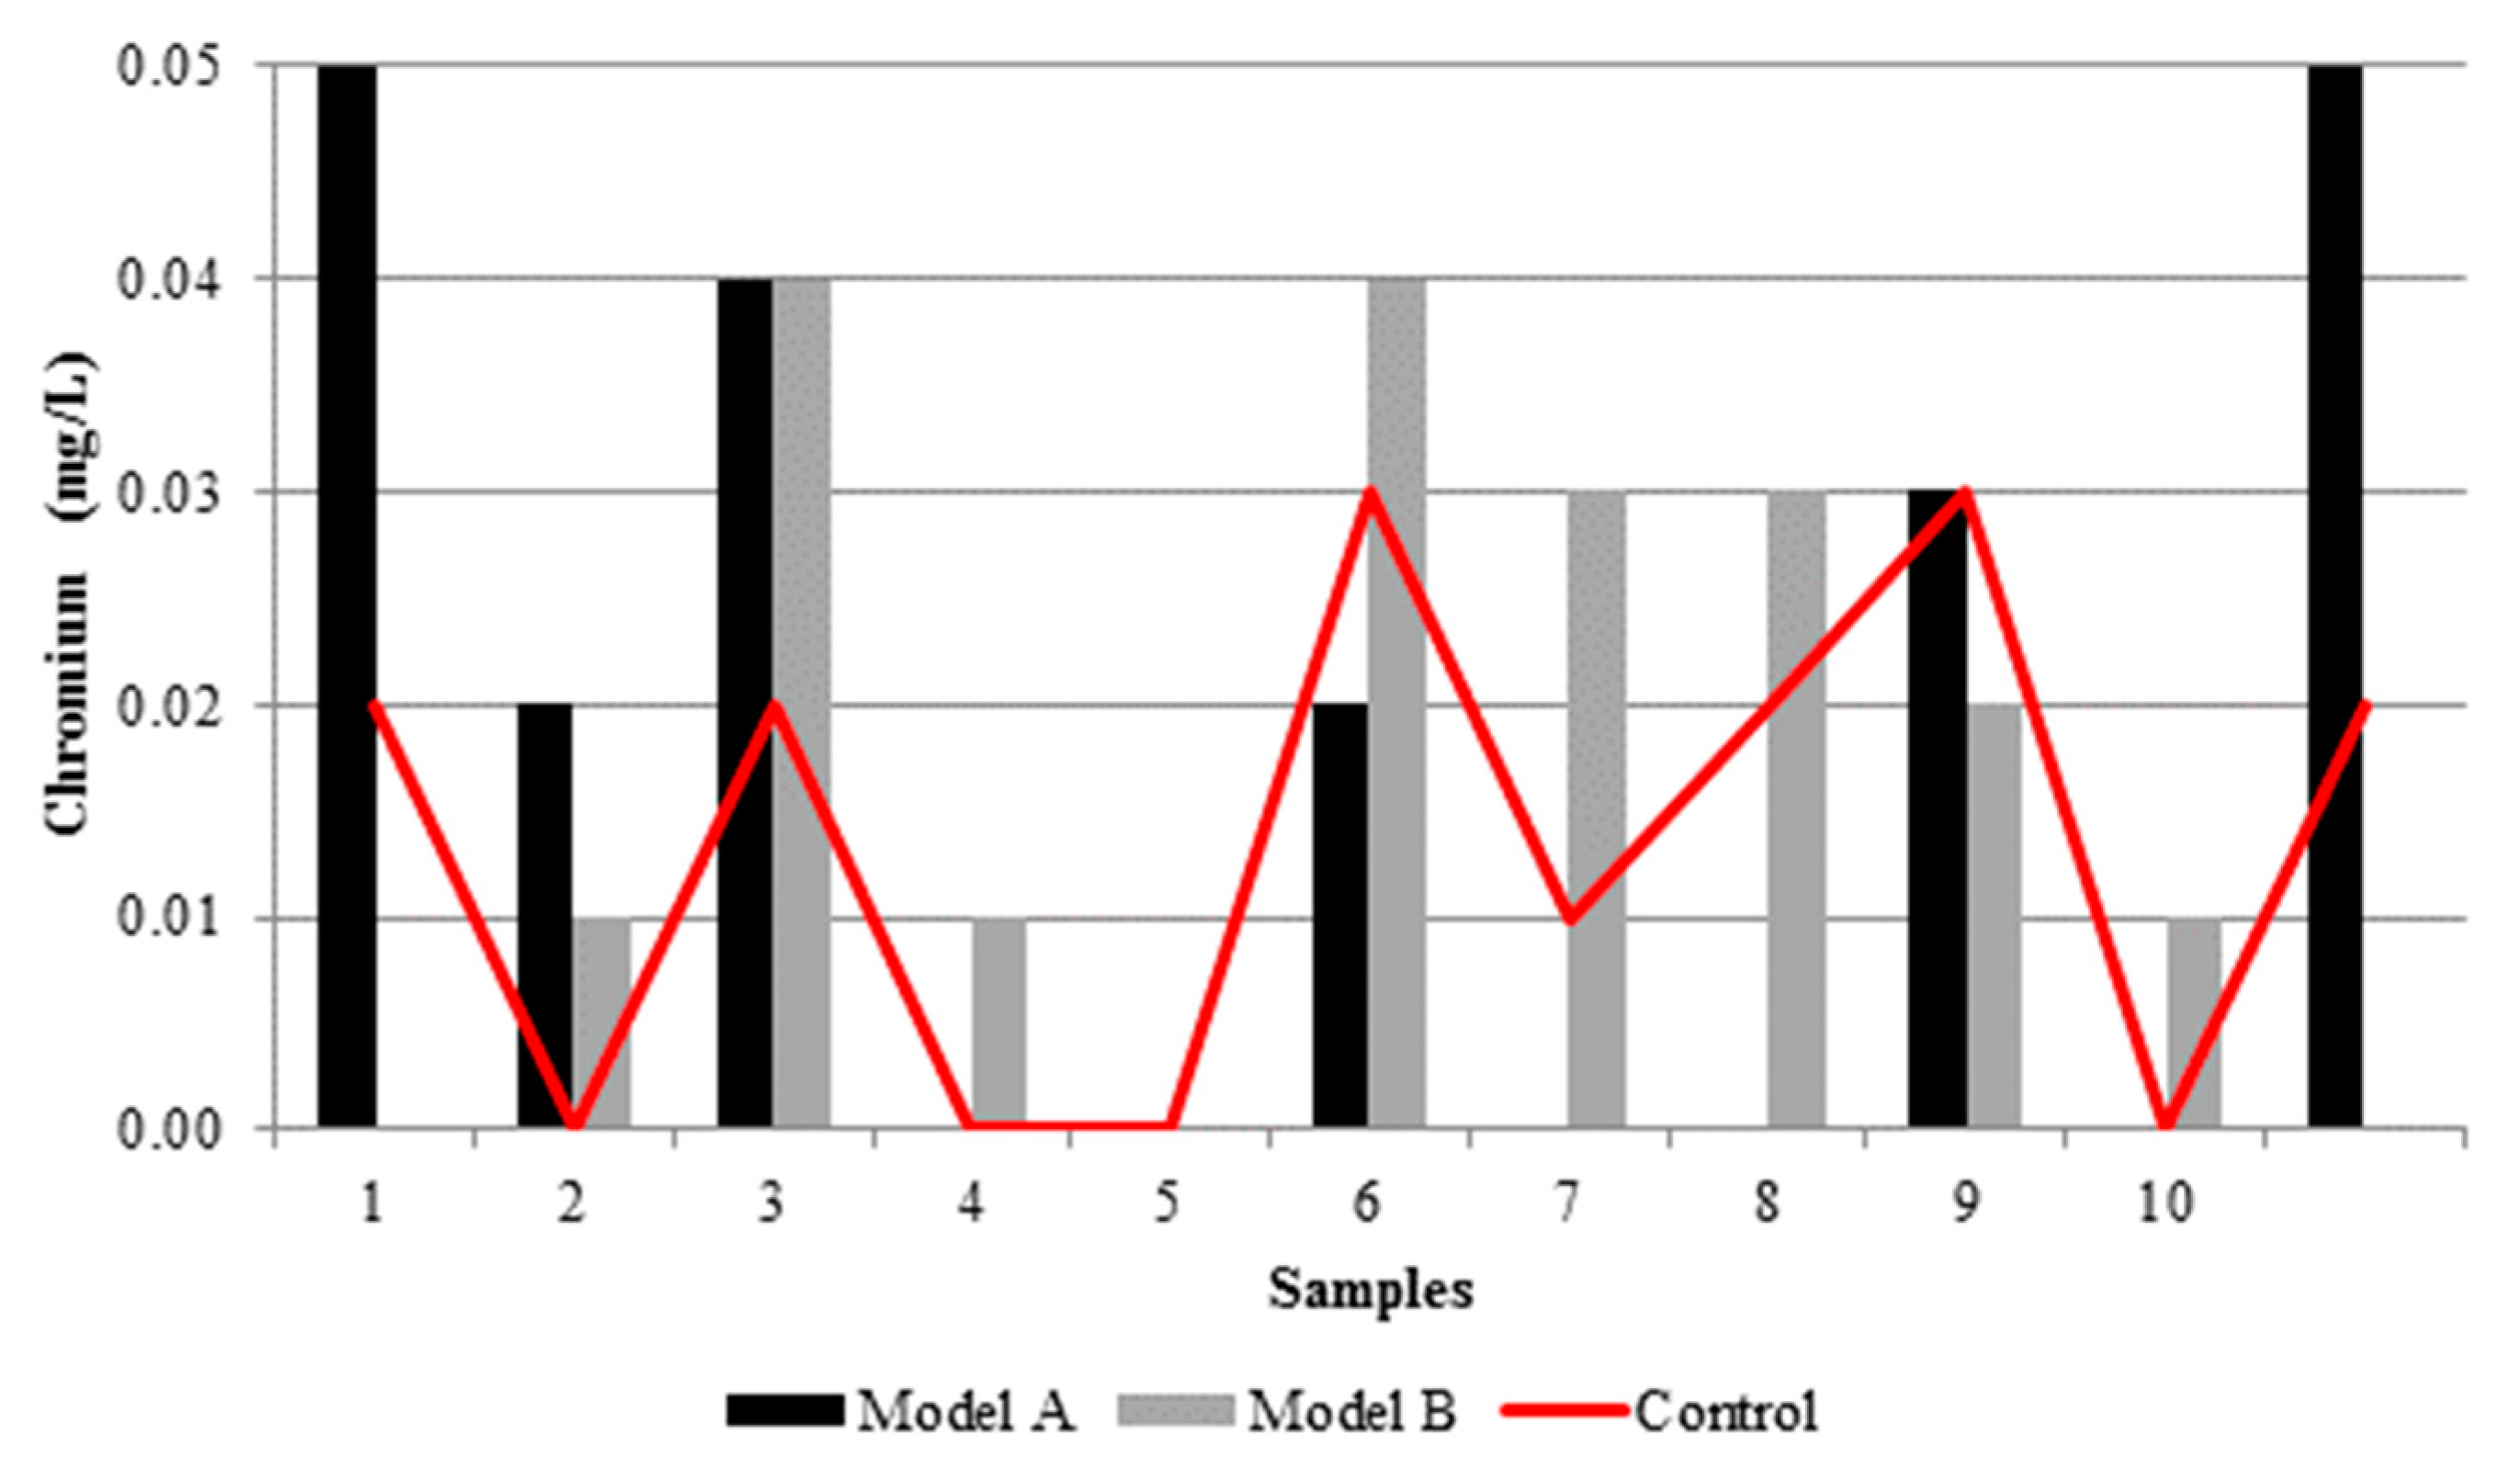
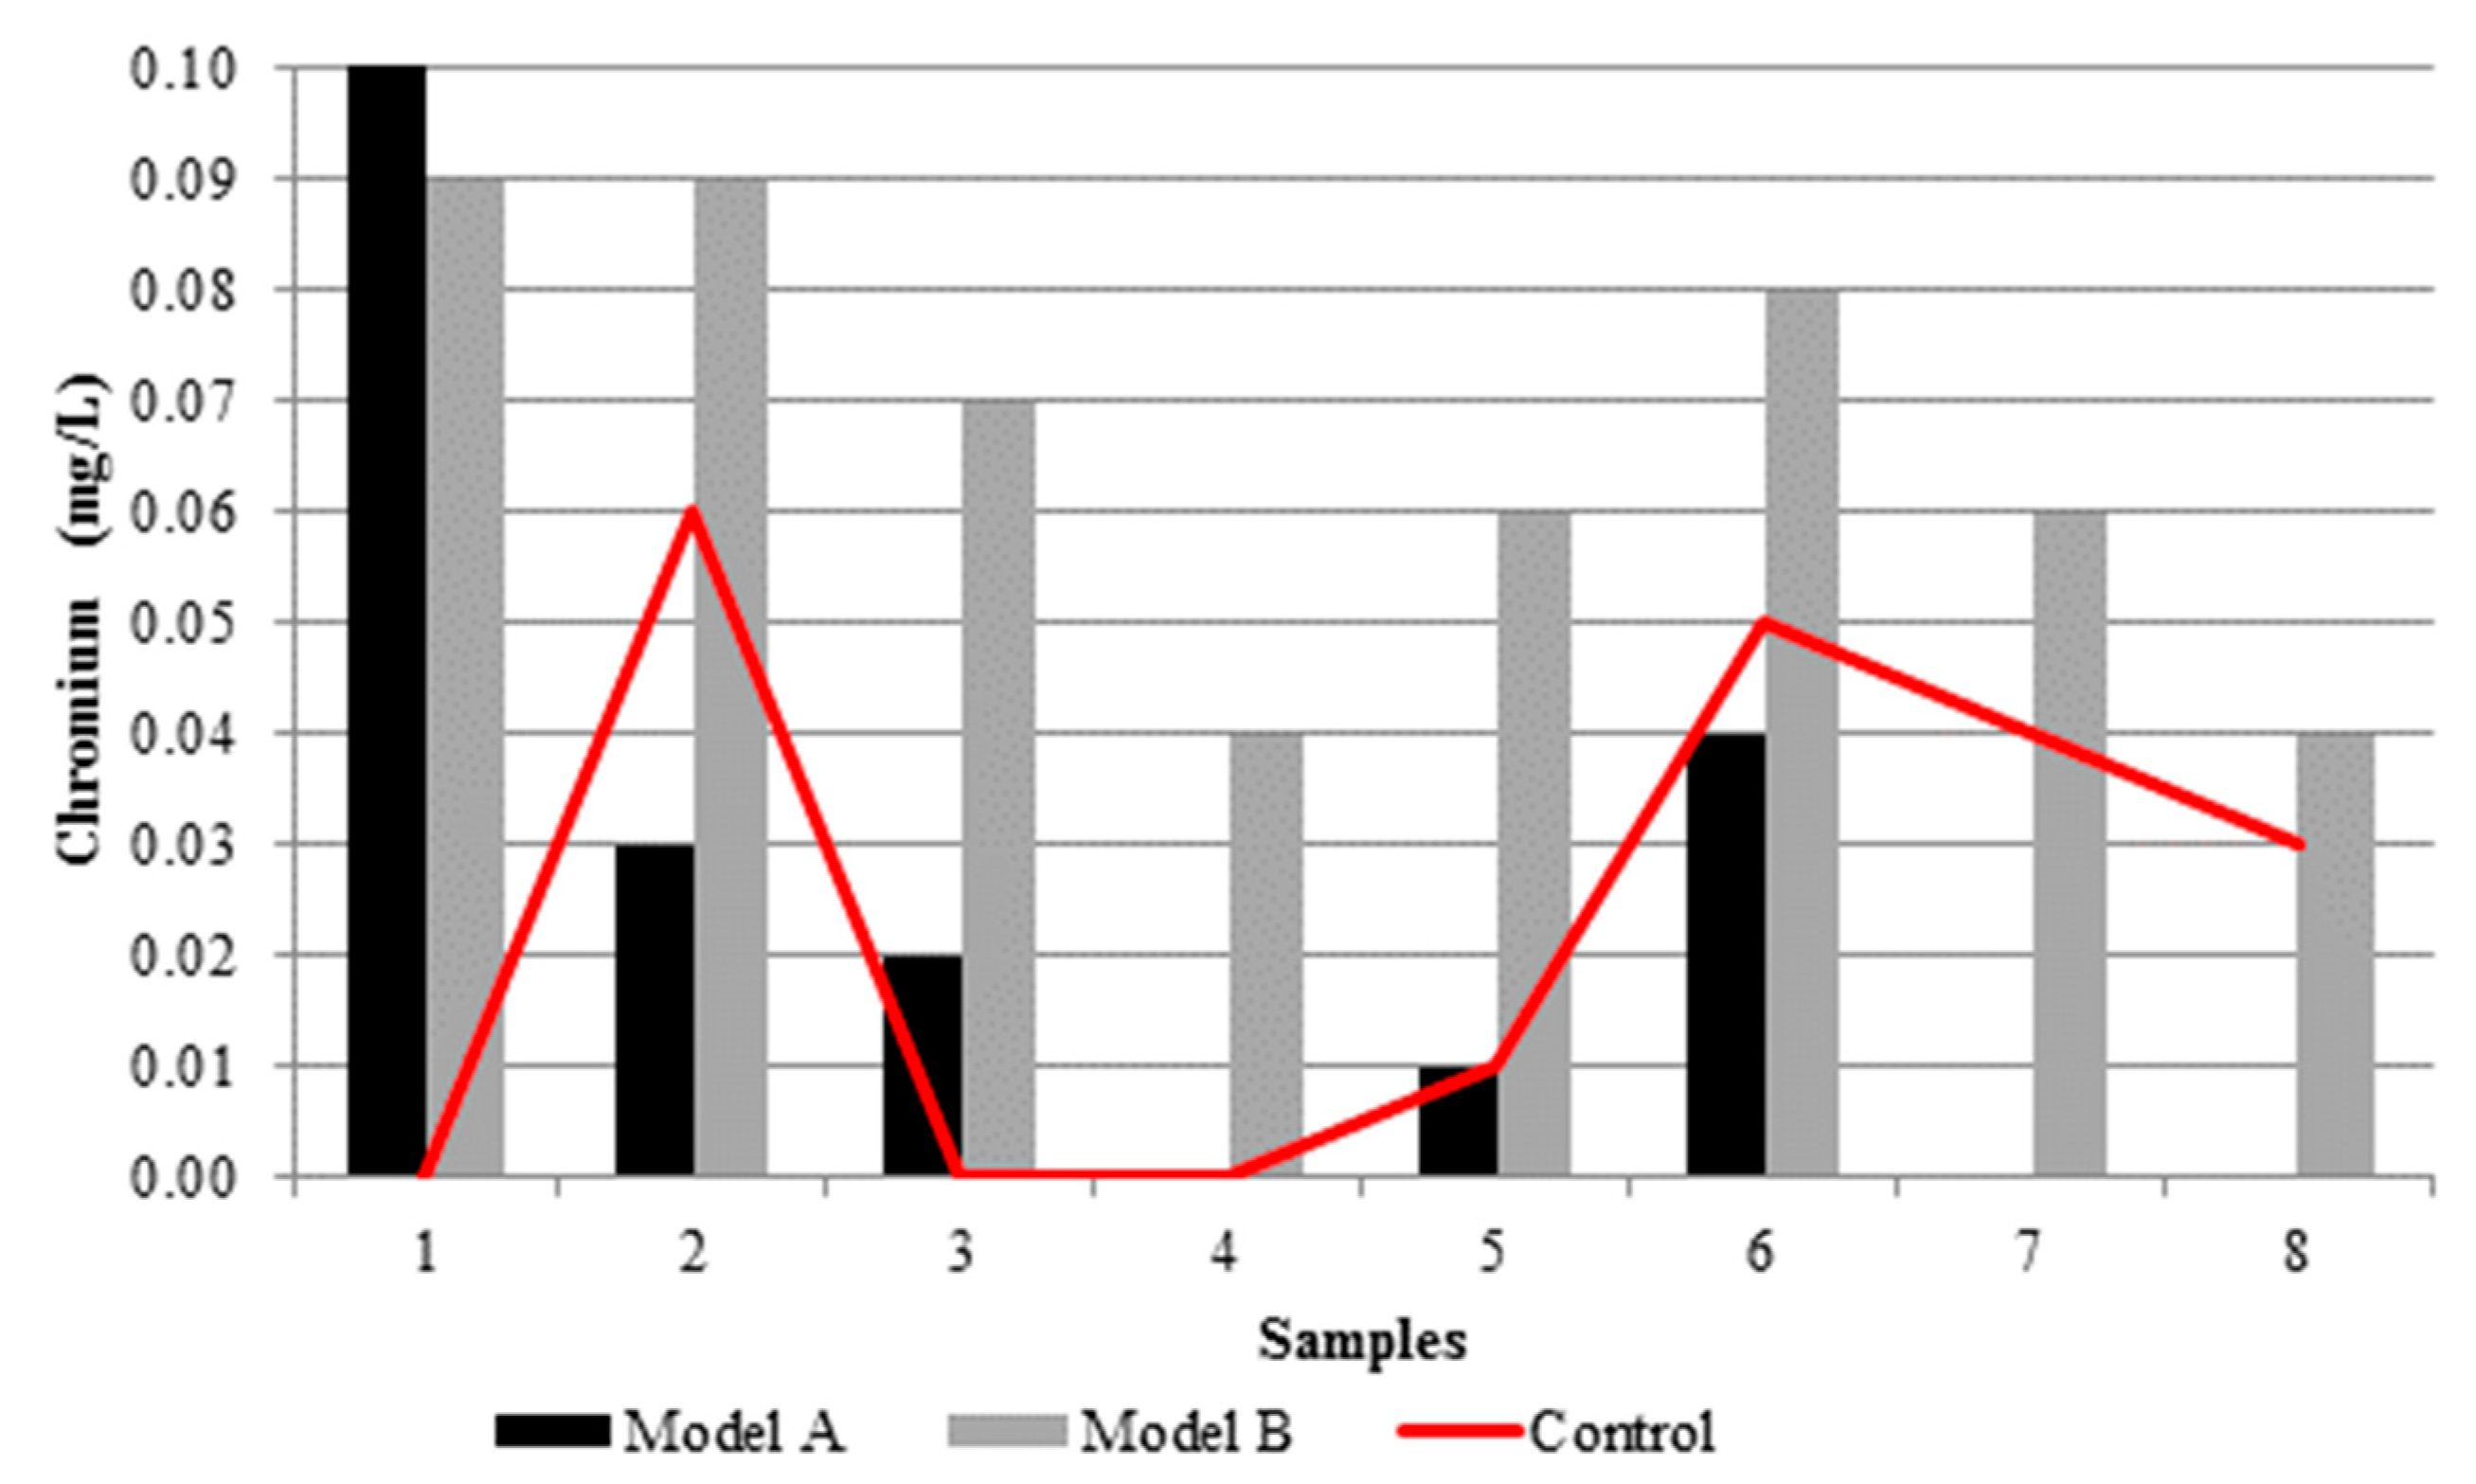
| Chromium (mg/L) | Rainwater | Average | 0.01 | 0.02 | 0.02 | ≤20.00 |
| Standard deviation | 0.01 | 0.02 | 0.02 | |||
| Stormwater | Average | 0.03 | 0.03 | 0.07 | ||
| Standard deviation | 0.02 | 0.04 | 0.02 | |||
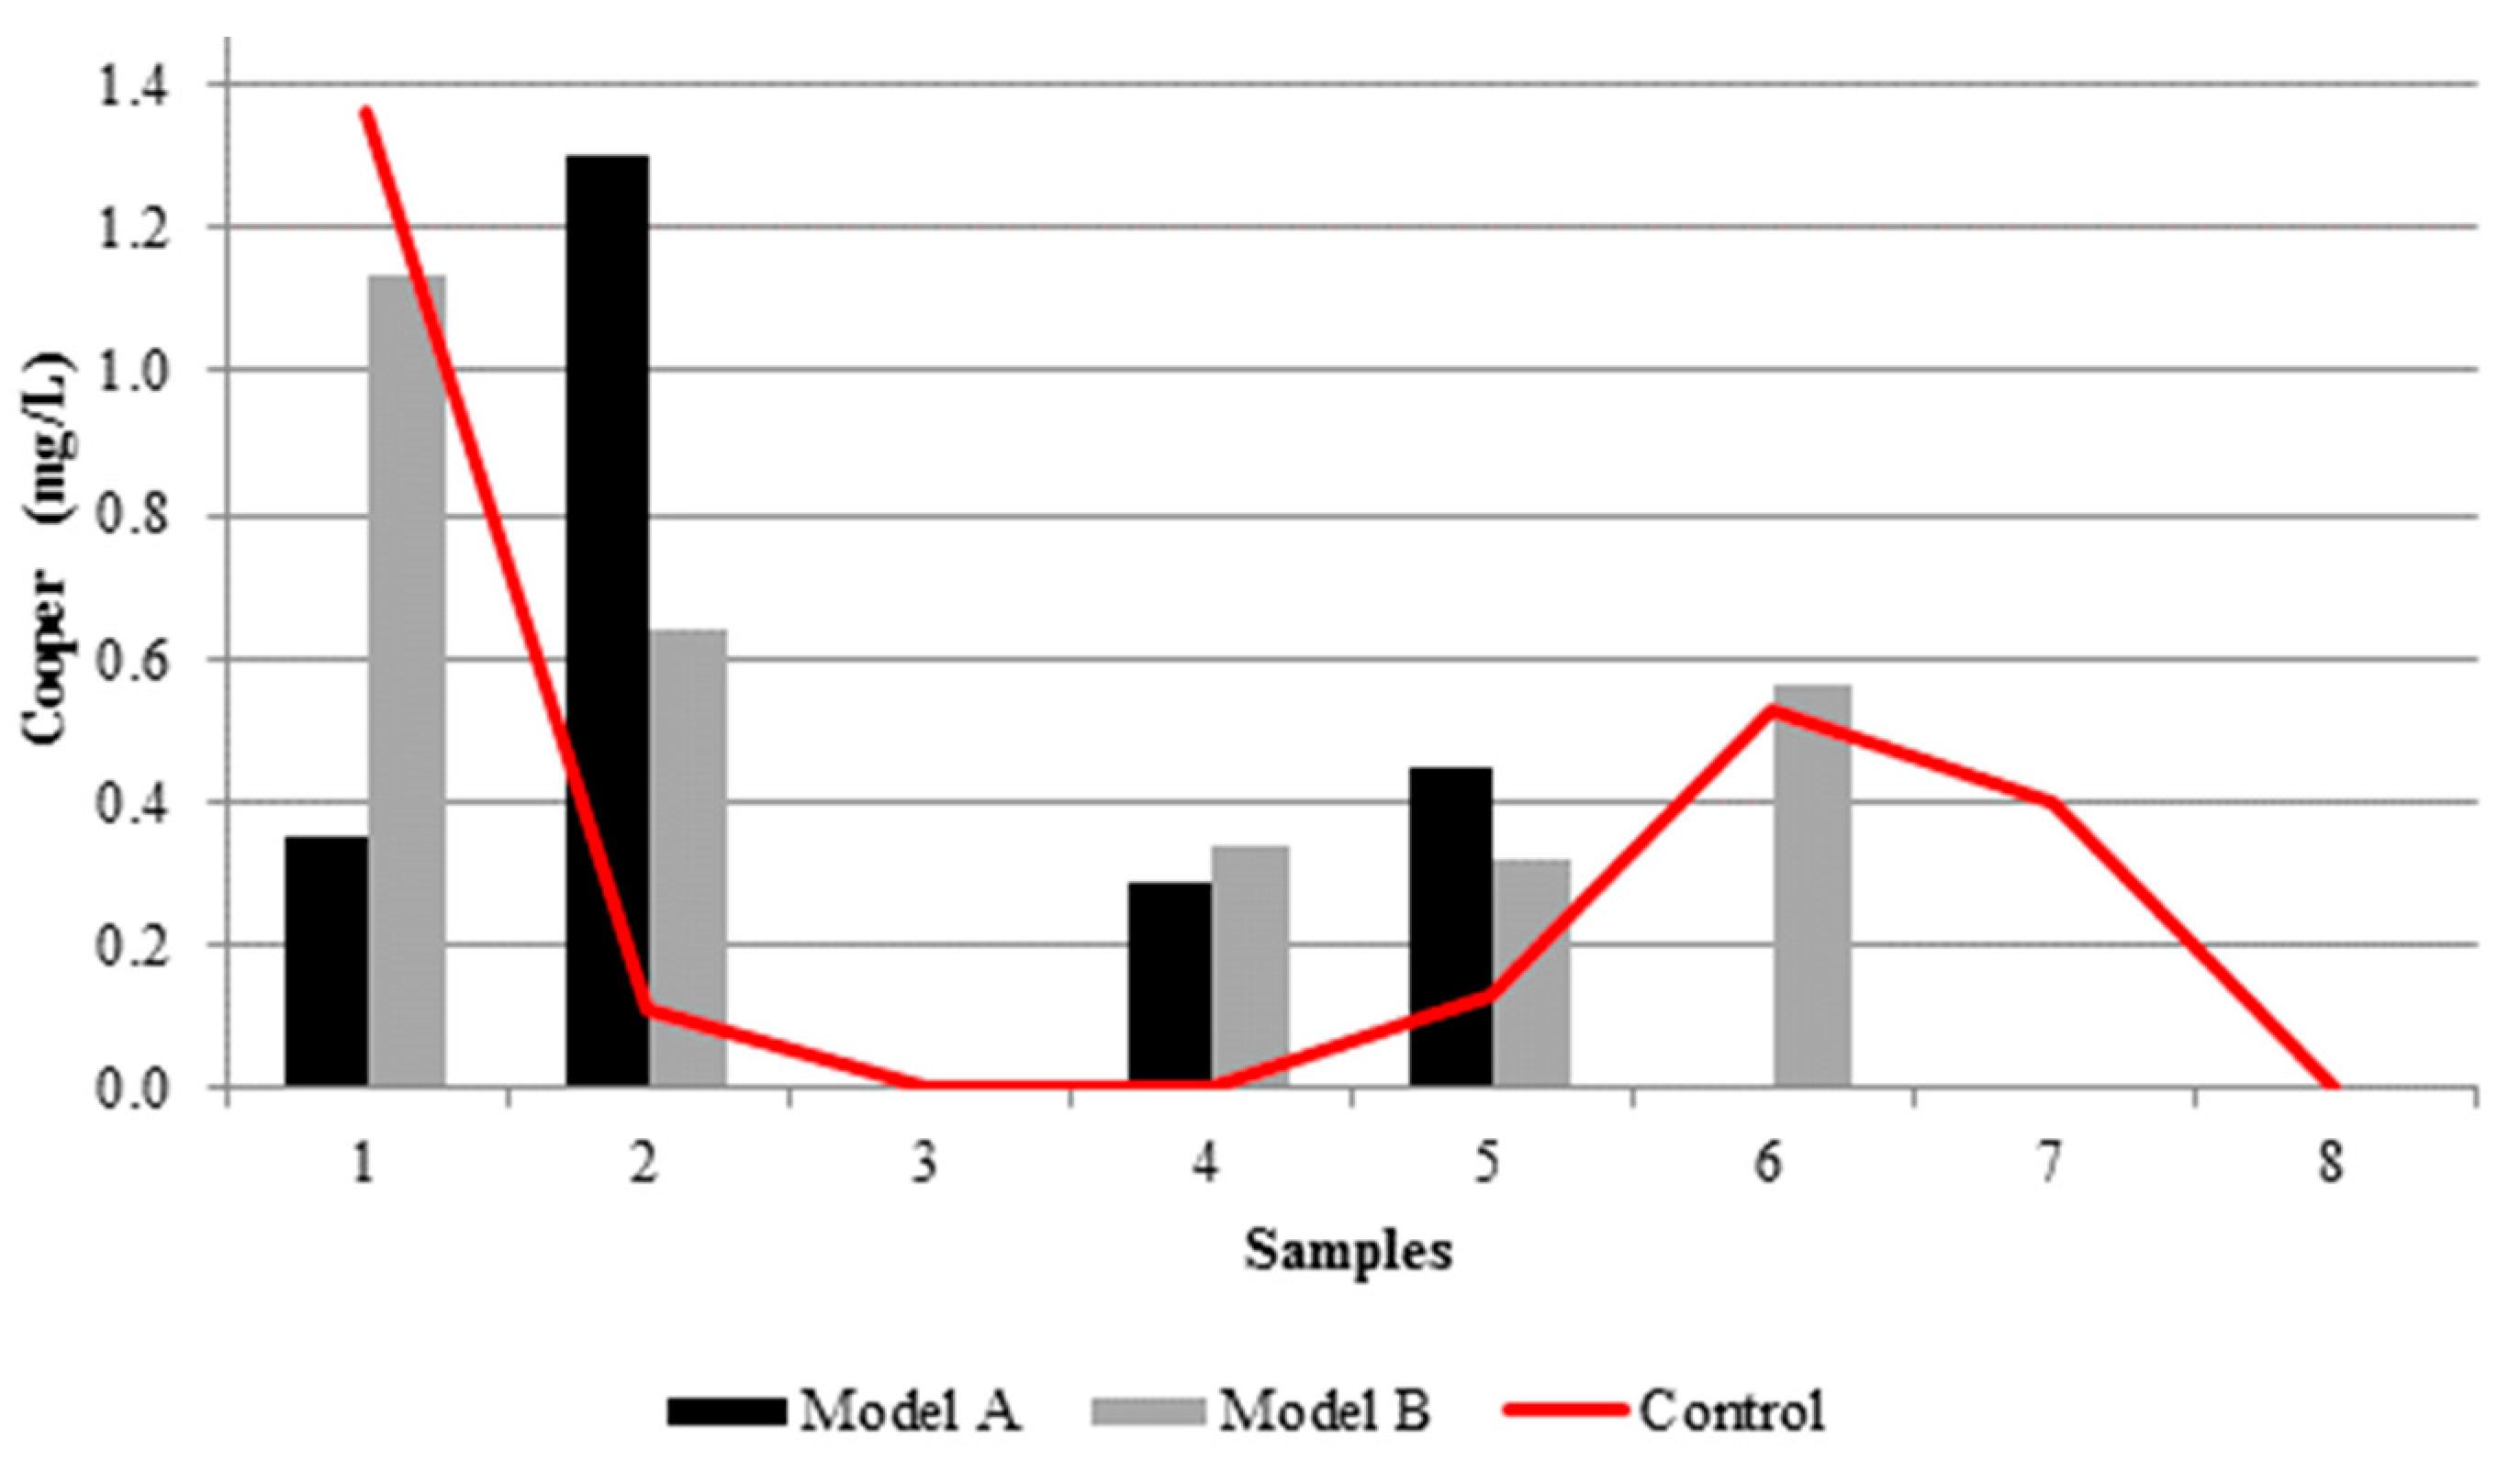
| Copper (mg/L) | Rainwater | Average | 0.00 | 0.03 | 0.00 | ≤1.00 |
| Standard deviation | 0.00 | 0.08 | 0.00 | |||
| Stormwater | Average | 0.32 | 0.30 | 0.37 | ||
| Standard deviation | 0.47 | 0.44 | 0.40 | |||
Publisher’s Note: MDPI stays neutral with regard to jurisdictional claims in published maps and institutional affiliations. |
© 2018 by the authors. Licensee MDPI, Basel, Switzerland. This article is an open access article distributed under the terms and conditions of the Creative Commons Attribution (CC BY) license (https://creativecommons.org/licenses/by/4.0/).
Share and Cite
Thives, L.P.; Ghisi, E.; Brecht, D.G.; Pires, D.M. Filtering Capability of Porous Pavements. Proceedings 2018, 2, 174. https://doi.org/10.3390/ecws-2-04943
Thives LP, Ghisi E, Brecht DG, Pires DM. Filtering Capability of Porous Pavements. Proceedings. 2018; 2(5):174. https://doi.org/10.3390/ecws-2-04943
Chicago/Turabian StyleThives, Liseane Padilha, Enedir Ghisi, Douglas G. Brecht, and Dario M. Pires. 2018. "Filtering Capability of Porous Pavements" Proceedings 2, no. 5: 174. https://doi.org/10.3390/ecws-2-04943
APA StyleThives, L. P., Ghisi, E., Brecht, D. G., & Pires, D. M. (2018). Filtering Capability of Porous Pavements. Proceedings, 2(5), 174. https://doi.org/10.3390/ecws-2-04943