Proceeding Paper

Evaluating the Performance of Different Commercial and Pre-Commercial Maize Varieties under Low Nitrogen Conditions Using Affordable Phenotyping Tools †

by
Ma. Luisa Buchaillot
1,
Adrian Gracia-Romero
1,
Mainassara A. Zaman-Allah
2,
Amsal Tarekegne
2,
Boddupalli M. Prasanna
2,
Jill E. Cairns
2,
Jose Luis Araus
1 and
Shawn C. Kefauver
1,*
1
Integrative Crop Ecophysiology Group, Plant Physiology Section, Faculty of Biology, University of Barcelona, Av. Diagonal 643, 08028 Barcelona, Spain
2
International Maize and Wheat Improvement Center, CIMMYT Southern Africa Regional Office, Harare, Zimbabwe
*
Author to whom correspondence should be addressed.
Presented at the 2nd International Electronic Conference on Remote Sensing, 22 March–5 April 2018; Available online: https://sciforum.net/conference/ecrs-2.
Proceedings 2018, 2(7), 366; https://doi.org/10.3390/ecrs-2-05180
Published: 22 March 2018
(This article belongs to the Proceedings of The 2nd International Electronic Conference on Remote Sensing)

Abstract

:
Maize is the most commonly cultivated cereal in Africa in terms of land area and production. Low yields in this region are very often associated with issues related to low Nitrogen (N), such as low soil fertility or low fertilizer availability. Developing new maize varieties with high and reliable yields in actual field conditions using traditional crop breeding techniques can be slow and costly. Remote sensing has become an important tool in the modernization of field-based High Throughput Plant Phenotyping (HTPP), providing faster gains towards improved yield potential, adaptation to abiotic (water stress, extreme temperatures, and salinity) and biotic (susceptibility to pests and diseases) limiting conditions, and even quality traits. We evaluated the performance of a set of remote sensing indices derived from Red-Green-Blue (RGB) images and the performance of the field-based Normalized Difference Vegetation Index (NDVI) and SPAD as phenotypic traits and crop monitoring tools for assessing maize performance under managed low nitrogen conditions. Phenotyping measurements were conducted on maize plants at two different levels: on the ground and from an airborne UAV (Unmanned Aerial Vehicle) platform. For the RGB indices assessed at the ground level, the strongest correlations compared to yield were observed with Hue, GGA (Greener Green Area), and GA (Green Area) at the ground level, while GGA and CSI (Crop Senescence Index) were better correlated with grain yield at the aerial level. Regarding the field sensors, SPAD exhibited the closest correlation with grain yield, with a higher correlation when measured closer to anthesis. Additionally, we evaluated how these different HTPP data contributed to the improvement of multivariate estimations of crop yield in combination with traditional agronomic field data, such as ASI (Anthesis Silking Data), AD (Anthesis Data), and Plant Height (PH). All multivariate regression models with an R2 higher than 0.50 included one or more of these three agronomic parameters as predictive parameters, but with RGB indices at both levels increased to R2 over 0.60. As such, this research suggests that traditional agronomic data provide information related to grain yield in abiotic stress conditions, but that they may be potentially supplemented by RGB indices from either ground or UAV phenotyping platforms. Finally, in comparison to the same panel of maize varieties grown under optimal conditions, only 11% of the varieties that were in the highest yield-producing quartile under optimal N conditions remained in the highest quartile when grown under managed low N conditions, suggesting that specific breeding for low N tolerance can still produce gains, but that low N productivity is also not necessarily exclusive of high productivity in optimal conditions.

1. Introduction

Maize is the most commonly cultivated cereal in Africa in terms of land area and production [1]. Low yields in this region are largely associated with drought stress, low soil fertility, weeds, pests, diseases, low input availability, low input use, and inappropriate seeds [2]. After water, nitrogen (N) is the single most important input for maize production, and the lack of N is considered the principal constraint to cereal yields in areas with more than 400 mm average annual rainfall in sub-Saharan Africa [3]. Plants scientists face the challenge of solving these limitations while considering the additional implications of climate change on food security [4]. In that sense, affordable technologies capable of monitoring crop performance, involving yield prediction, or assessing phenotyping variability for agronomical or breeding purposes are aimed at surpassing the bottlenecks in the way of full exploitation of this technology [5,6]. One of the first non-destructive and analytical tools was the chlorophyll meter, which was based on radiation absorbance by leaves in the red and near-infrared regions (usually at 650 and 940 nm), as relative leaf chlorophyll content readings have an indirect and close relationship with leaf N concentration and leaf chlorophyll concentration (SPAD) [7,8].
Remote sensing has become an important tool in the modernization of field High Throughput Plant Phenotyping (HTPP), including improvements in yield potential, adaptation to abiotic stressors (drought, extreme temperatures, salinity), biotic (susceptibility to pests and diseases) limiting conditions, and even quality traits [6,9,10]. The Normalized Difference Vegetation Index (NDVI) [11] is one of the most well-known vegetation indices derived from multispectral remote sensing, as it includes visible and near infrared radiation [12,13]. As a low-cost alternative, various RGB-based Vegetation Indices (RGB-VIs) can be calculated from commercial Reed Green Blue (RGB) cameras that have proven able to predict grain yield, quantify nutrient deficiencies, and measure disease impacts [14,15]. The RGB images can be processed using the Breedpix code that enables the extraction of RGB-VIs in relation to different properties of color, which often demonstrate a performance similar to or slightly better than that of the better-known NDVI [16]. The RGB-VIs proposed here, namely Hue, Saturation, Intensity, Green Area (GA), and Greener Green Area (GGA) (the last two are based on pixel selections of Hue of 60–180 and 80–180, respectively), as well as L, a*, and b* from the CIE-Lab color space, are readily obtainable from zenithal pictures of canopies and by using the appropriate calculations [16].
The aim of this study is to evaluate the performance of different commercial and pre-commercial maize varieties under low nitrogen conditions using affordable HTPP tools. We evaluated the selection of maize varieties using a set of remote sensing indices derived from RGB images acquired from a UAV (Unmanned Aerial Vehicle) and at the ground level compared with the performance of the field-based NDVI and SPAD sensors, and then we tested their capacity for yield estimation both alone and in combination with standard agronomical variables, such as ASI (Anthesis Silking Data), AD (Anthesis Data), and Plant Height (PH).

2. Materials and Methods

2.1. Plant Material and Growing Conditions

Field trials were conducted at the CIMMYT (International Center for Maize and Wheat Improvement) regional station located in Harare, Zimbabwe (−17.800 S, 31.050 E, 1498 m.a.s.l.). The soil of the station is characterized by a pH slightly below 6. This study consisted of two different conditions: the first was Optimum Nitrogen (OP) with a standard fertilization application [10], and the second was the Low Managed Nitrogen (LOW) that was 25–35% less N fertilizer compared to the OP growing conditions. A set of 49 maize hybrids were developed at CIMMYT, and 15 commercial maize varieties were developed in Zimbabwe. Seeds were sown during the wet season; on December 16th, 2015; and during the harvest on 12 May 2016.

2.2. Remote Sensing and Proximal (Ground) Data Colleciton

Remote sensing evaluations were performed on seedlings (less than 5 leaves) during the last week of January. RGB-VIs were evaluated for each plot at terrestrial and aerial levels. RGB aerial images were acquired using an Unmanned Air Vehicle (UAV, Mikrokopter OktoXL, Moormerland, Germany) flying under remote control at about 50 m. The digital camera used for aerial imaging was a Lumix GX7 (Panasonic, Osaka, Japan). Images were taken at 16-megapixel resolution using a 4/3’’ sensor, 20 mm focal length, 1/160 s shutter speed, and auto-programmed aperture. These images were taken at the rate of every 2 s from 50 m for the duration of the flight. At the ground level, one conventional digital photograph was taken per plot with an Olympus OM-D (Olympus, Tokyo, Japan), holding the camera about 80 cm above the plant canopy in a zenith and focusing near the center of each plot. The images were acquired with a resolution of 16 megapixels with a 4/3’’ Live MOS sensor with a focal length of 14 mm, activated at a speed of 1/125 s with the aperture programmed in automatic mode.
The NDVI of individual plots at ground level was determined with a ground-based portable spectroradiometer with an active sensor (GreenSeeker handheld crop sensor, Trimble, Sunnyvale, CA, USA). The RGB images at aerial and ground level were taken on January 28th, 2016 with the NDVI. SPAD was measured in two different dates, once on February 18th, 2016 (SPAD1) and then again on March 1st, 2016 (SPAD2) using a portable Minolta SPAD-502 chlorophyll meter (Spectrum Technologies Inc., Plainfield, IL, USA).

2.3. Image Processing and Statistical Analyses

For the RGB images, the Microsoft Image Composite Editor (ICE; Microsoft Research Computational Photography Group, Redmond, WA, USA) was used to produce an accurate image mosaic as seen in Figure 1. A total of 63 overlapping images were used for mosaic. Through the open source image analysis platform FIJI (Fiji is Just ImageJ; http://fiji.sc/Fiji), regions of interest were established at each row for the plots to be cropped. RGB pictures were subsequently analyzed using a version of the Breedpix 0.2 software adapted to JAVA8 and integrated as the CIMMYT MaizeScanner plugin within FIJI (https://github.com/George-haddad/CIMMYT). With the Breedpix software code, the images were processed to convert RGB values into indices based on the models of Hue-Intensity-Saturation (HIS), CIE-Lab, and CIE-Luv cylindrical-coordinate representations of colors. Additionally, Crop Senescence Index (CSI) was calculated in agreement with [15,17]. The Triangular Greenness Index (TGI) was calculated as the area of a triangle formed by the reflectance values of the Blue, Green, and Red bands [18]. Finally, the Normalized Green Red Difference Index (NGRDI) is calculated as the difference between the green and red digital numbers differentiates between plants and soil, and the sum normalizes for variations in light intensity between different images [19]. All statistical analyses were done using R and R Studio (http://cran.r-project.org, http://www.rstudio.com, R Studio, Boston, MA, USA).

3. Results and Discussion

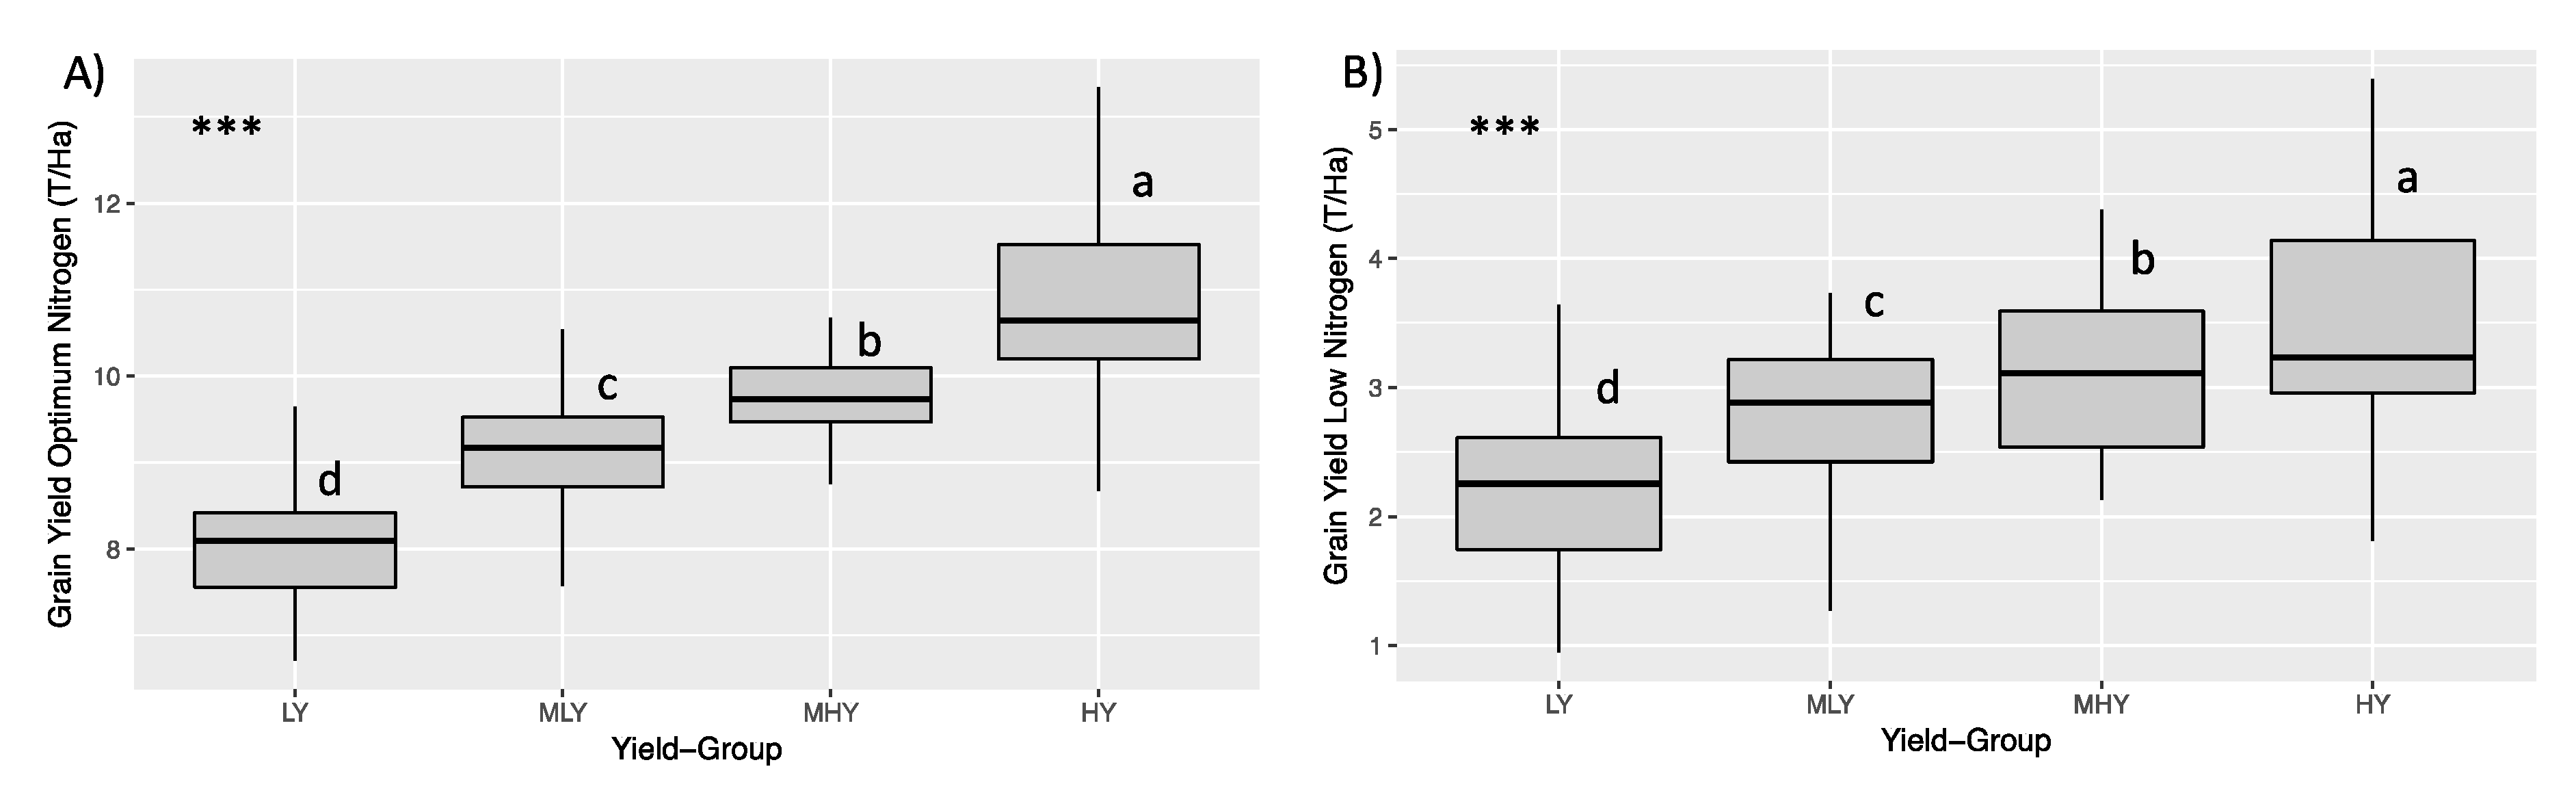
3.1. The Effect of Optimal Condition and Low Managed Nitrogen on Grain Yield

The results showed (Figure 1) that of the maize varieties grown under optimal conditions, 11% of the varieties that were in highest yield-producing quartile under optimal N conditions remained in the highest quartile when grown under managed low N conditions, suggesting that specific breeding for low N tolerance can still produce gains, but that low N productivity is not necessarily exclusive of high productivity in optimal conditions. In some cases, it has been reported that the genotypes selected under low N fertilization input are not truly adapted to N-rich soils [20]. In [21], the authors suggest that when plant material performs relatively well under low N input, it should be selected under N deficiency conditions for which yield reduction does not exceed 35–40%.

3.2. Performance of Remote Sensing Indices and Field Sensors in Estimating Grain Yield

The RGB indices Hue, GGA, and GA calculated from images taken at ground level demonstrated the best correlations with GY, outperforming other RGB indices (Table 1). GA quantifies the portion of green pixels to the total pixels of the image and is a reliable estimation of vegetation cover [22] and the values of GA in both observation levels were consistently below 60%. The ground and aerial measurements were taken at the same time on the same day, variation in environmental variables such as light intensity and brightness can be assumed to be negligible. On the other hand, all RGB indices from the ground and aerial levels did not show significant differences between quartiles. This may be best explained considering that the data for our study were collected at an early phenological stage when the plants were not yet at full canopy cover and they did not yet show the full range of symptoms of N deficiency. N deficiency can reduce plant growth rates, but also other later factors that affect GY, including leaf chlorophyll content, soluble protein content, photosynthetic rate, and related enzyme activities of the maize plant during grain filling [23].
NDVI has been used with satisfactory results in many prediction models of yield in wheat at the field level [24], using field, airborne, and satellite imagery. Regarding NDVI, its values are clearly highlighted and the variability is low, with more than 90% of its values being in the range 0.55–0.8. These results support the previously reported saturation of reflectance spectra in the red and near-infrared regions, such that increasing leaf area does not involve a parallel increase in NDVI values [25].
SPAD is used to measure relative chlorophyll content in plant leaves and it has been effectively used to diagnose N status and predict GY potential in maize [26]. In maize, chlorophyll meters provide a convenient and reliable way to estimate leaf N content during vegetative growth [27] and over a large time scale after anthesis [28]. We can see this as a decline in relative chlorophyll content between the two SPAD measurements. This may be because when the crops are in the first phase (SPAD1), i.e., vegetative phase, young developing roots and leaves behave as sink organs for the assimilation of inorganic N and the synthesis of amino acids originating from the N taken up before flowering and then reduced via the nitrate assimilatory pathway. After flowering, (SPAD2), the N accumulated in the vegetative parts of the plant, is remobilized and translocated to the grain [29].
In multivariate analyses, the estimation for yield using different combinations of RGB images from the field and UAV platforms, field sensors, and traditional agronomical field measurements provided improved results over the single index results presented in Table 1. Combining RGB images and proximal field sensors resulted in R2 values of 0.403 and 0.384 for the ground and aerial RGB data, respectively. Further improvements were observed when also employing the traditional agronomical field measurements ASI, AD, and PH, resulting in R2 values of 0.6157 and 0.6154 using RGB ground and aerial VIs, respectively. This suggests that the use of the more time-consuming field senors may be replaced with either ground or aerial RGB data when used in combination with the traditional agronomical field measurements for optimal results.

4. Conclusions

Maize hybrid technology may show promise for improving much-needed GY in low N environments, and the current range of variability in performance suggests the possibility of potential for further improvements. We need to take advantage of known effects of low N on physiological processes to focus our efforts to bring HTPP to low N breeding. For HTPP, RGB sensors can be considered as a functional technology from the ground or a UAV, but also, similar to SPAD, NDVI, or any other agronomic or general plant physiological measurement, these measurements must be carefully planned for an adequate growth stage in order to optimize their benefits to plant breeding (i.e., possible gains with new technologies with regards to equipment and time costs, especially in larger breeding platforms).

Author Contributions

M.A.Z.-A., A.T., B.M.P. and J.E.C. managed and directed the maize trials at the CIMMYT Southern African Regional Office in Harare, Zimbabwe. S.C.K. carried out the UAV flights and image pre-processing for the obtainment of aerial measurements. A.G.-R. and J.L.A. conducted the field measurements and the collection of samples. M.L.B. processed the images, analyzed the samples, and wrote the paper under the supervision of J.L.A. and S.C.K. with specific contributions from all of the other authors.

Acknowledgments

We thank the personnel from the CIMMYT Southern Africa Regional Office at Harare, Zimbabwe for their support during the field measurements and sampling. The trials were financially supported by CRP MAIZE (www.maize.org). We also acknowledge Stress Tolerant Maize for Africa funded by the Bill & Melinda Gates Foundation and USAID for open-access publication support. Finally, we thank Jaume Casadesús for providing the BreedPix software and Mrs Esnath Hamadziripi for being instrumental in trial implementation.

Conflicts of Interest

The authors declare no conflict of interest.

Abbreviations

NNitrogen
NDVINormalized Difference Vegetation Index
HTTPHigh Throughput Plant Phenotyping
RGBRed-Green-Blue
GAGreen Area
GGAGreen Greener Area
CIMMYTInternational Maize and Wheat Improvement Center
OPOptimum Nitrogen
LOWLow Managed Nitrogen
UAVUnmanned Aerial Vehicle
ASIAnthesis Silking Data
ADAnthesis Data
PHPlant Heigh
CSICrop Senescence Index
TGITriangular Greenness Index
NGRDINormalized Green Red Difference Index
HISHue-Intensity-Saturation
LYLow Yield
MLYMedium Low Yield
MHYMedium High Yield
HYHigh Yield

References

  1. FAO. Food and Agriculture Organization of the United Nations; Statistic Division. 2017. Available online: http://faostat.fao.org/ (accessed on 7 March 2018).
  2. Cairns, J.E.; Hellin, J.; Sonder, K.; Araus, J.L.; MacRobert, J.F.; Thierfelder, C.; Prasanna, B.M. Adapting maize production to climate change in sub-Saharan Africa. Food Secur. 2013, 5, 345–360. [Google Scholar] [CrossRef]
  3. Buerkert, A.; Bationo, A.; Piepho, H.P. Efficient phosphorus application strategies for increased crop production in sub-Saharan West Africa. Field Crops Res. 2001, 72, 1–15. [Google Scholar] [CrossRef]
  4. Cairns, J.E.; Sanchez, C.; Vargas, M.; Ordoñez, R.; Araus, J.L. Dissecting Maize Productivity: Ideotypes Associated with Grain Yield under Drought Stress and Well-Watered Conditions. J. Integr. Plant Biol. 2012, 54, 1007–1020. [Google Scholar] [CrossRef]
  5. Araus, J.L.; Cairns, J.E. Field high-throughput phenotyping: The new crop breeding frontier. Trends Plant Sci. 2014, 19, 52–61. [Google Scholar] [CrossRef]
  6. Reynolds, M.; Foulkes, J.; Furbank, R.; Griffiths, S.; King, J.; Murchie, E.; Parry, M.; Slafer, G. Achieving yield gains in wheat. Plant Cell Environ. 2012, 35, 1799–1823. [Google Scholar] [CrossRef]
  7. Debaeke, P.; Route, P.; Justes, E. Relationship between the normalize SPAD index and the nitrogen nutrition index: Application to durum wheat. J. Plant Nutr. 2006, 29, 75–92. [Google Scholar] [CrossRef]
  8. Rorie, R.L.; Purcell, L.C.; Morteza, M.; Karcher, D.E.; King, C.A.; Marsh, M.C.; Longer, D.E. Association of “greenness” in corn with yield and leaf nitrogen concentration. Agron. J. 2011, 103, 529–535. [Google Scholar] [CrossRef]
  9. Baenziger, M. Breeding for Drought and Nitrogen Stress Tolerance in Maize: From Theory to Practice; CIMMYT: Edo Mex, Mexico, 2000. [Google Scholar]
  10. Masuka, B.; Araus, J.L.; Das, B.; Sonder, K.; Cairns, J.E. Phenotyping for Abiotic Stress Tolerance in Maize. J. Integr. Plant Biol. 2012, 54, 238–249. [Google Scholar] [CrossRef]
  11. Tucker, C.J. Red and photographic infrared linear combinations for monitoring vegetation. Remote Sens. Environ. 1979, 8, 127–150. [Google Scholar] [CrossRef]
  12. Thenkabail, P.S.; Smith, R.B.; De Pauw, E. Hyperspectral vegetation indices and their relationships with agricultural crop characteristics. Remote Sens. Environ. 2000, 71, 158–182. [Google Scholar] [CrossRef]
  13. Thenkabail, P.S.; Ronald, B.; De Pauw, E. Evaluation of narrowband and broadband vegetation indices for determining optimal hyperspectral wavebands for agricultural crop characterization. Photogramm. Eng. Remote Sens. 2002, 68, 607–622. [Google Scholar]
  14. Vergara-Diaz, O.; Kefauver, S.C.; Elazab, A.; Nieto-Taladriz, M.T.; Araus, J.L. Grain yield losses in yellow-rusted durum wheat estimated using digital and conventional parameters under field conditions. Crop J. 2015, 3, 200–210. [Google Scholar] [CrossRef]
  15. Kefauver, S.C.; El-Haddad, G.; Vergara-Diaz, O.; Araus, J.L. RGB picture vegetation indexes for High-Throughput Phenotyping Platforms (HTPPs). In Proceedings of the SPIE Remote Sensing Conference, Toulouse, France, 21–24 September 2015. [Google Scholar]
  16. Casadesús, J.; Kaya, Y.; Bort, J.; Nachit, M.M.; Araus, J.L.; Amor, S.; Ferrazzano, G.; Maalouf, F.; Maccaferri, M.; Martos, V.; et al. Using vegetation indices derived from conventional digital cameras as selection criteria for wheat breeding in water-limited environments. Ann. Appl. Biol. 2007, 150, 227–236. [Google Scholar] [CrossRef]
  17. Zaman-Allah, M.; Vergara, O.; Araus, J.L.; Tarekegne, A.; Magorokosho, C.; Zarco-Tejada, P.J.; Cairns, J. Unmanned aerial platform-based multi-spectral imaging for field phenotyping of maize. Plant Methods 2015, 11, 35. [Google Scholar] [CrossRef]
  18. Hunt, E.R.; Doraiswamy, P.C.; McMurtrey, J.E.; Daughtry, C.S.; Perry, E.M.; Akhmedov, B. A visible band index for remote sensing leaf chlorophyll content at the canopy scale. Int. J. Appl. Earth Obs. Geoinf. 2013, 21, 103–112. [Google Scholar] [CrossRef]
  19. Hunt, E.R.; Cavigelli, M.; Daughtry, C.S.; Mcmurtrey, J.E.; Walthall, C.L. Evaluation of digital photography from model aircraft from remote sensing crop biomass and nitrogen status. Precis. Agric. 2005, 6, 359–378. [Google Scholar] [CrossRef]
  20. Muruli, B.I.; Paulsen, G.M. Improvement of nitrogen use efficiency and its relationship to other traits in maize. Maydica 1981, 26, 63–73. [Google Scholar]
  21. Gallais, A.; Coque, M. Genetic variation and selection for nitrogen use efficiency in maize: A synthesis. Maydica 2005, 50, 531–537. [Google Scholar]
  22. Lukina, E.V.; Stone, M.L.; Raun, W.R. Estimating vegetation coverage in wheat using digital images. J. Plant Nutr. 1999, 22, 341–350. [Google Scholar] [CrossRef]
  23. Ding, L.; Wang, K.J.; Jiang, G.M.; Biswas, D.K.; Xu, H.; Li, L.F.; Li, Y.H. Effects of nitrogen deficiency on photosynthetic traits of maize hybrids released in different years. Ann. Bot. 2005, 96, 925–930. [Google Scholar] [CrossRef]
  24. Aparicio, N.; Villegas, D.; Casadesus, J.; Araus, J.L.; Royo, C. Spectral vegetation indices as nondestructive tools for determining durum wheat yield. Agron. J. 2000, 92, 83–91. [Google Scholar] [CrossRef]
  25. Hobbs, T.J. The use of NOAA-AVHRR NDVI data to assess herbage production in the arid rangelands of Central Australia. Int. J. Remote Sens. 1995, 16, 1289–1302. [Google Scholar] [CrossRef]
  26. Vetsch, J.A.; Randall, G.W. Corn production as affected by nitrogen application timing and tillage. Agron. J. 2004, 96, 502–509. [Google Scholar] [CrossRef]
  27. Chapman, S.; Baretto, H. Using a chlorophyll meter to estimate specific leaf nitrogen of tropical maize during vegetative growth. Agron. J. 1997, 89, 557–562. [Google Scholar] [CrossRef]
  28. Dwyer, L.M.; Anderson, A.M.; Ma, B.L. Stewart, D.W.; Tollenaar, M.; Gregorich, E. Quantifying the nonlinearity in chlorophyll meter response to corn leaf nitrogen concentration. Can. J. Plant Sci. 1995, 75, 179–182. [Google Scholar] [CrossRef]
  29. Masclaux, C.; Quilleré, I.; Gallais, A.; Hirel, B. The challenge of remobilization in plant nitrogen economy: A survey of physio-agronomic and molecular approaches. Ann. Appl. Biol. 2001, 138, 69–81. [Google Scholar] [CrossRef]
Figure 1. LY (Low Yield), MLY (Medium-low Yield), MHY (Medium-High Yield), and HY (High Yield) maize variety in two different conditions: (A) Optimum Nitrogen (OP) and (B) Low Nitrogen (LOW). Each value is the mean ± SD for each genotype (n = 48 per quartile with 16 different variety). Bars with the different letters are significant at p < 0.001.
Proceedings 02 00366 g001
Table 1. Grain yield correlations with all proximal remote sensing variables from the RGB images taken from the UAV aerial platform, RGB images from the ground, and SPAD and NDVI field sensors. These indices are defined in the Introduction and Materials and Methods. Levels of significance: *, p < 0.05; ***, p < 0.001.
RGB Indices/AerialRpRGB Indices/GroundRpAdditional Field SensorsRP
GGA0.1978***GGA0.2339***SPAD1 (18/02/16)0.2936***
GA0.1659***GA0.2175***SPAD2 (01/03/16)0.2564***
Hue0.1449***Hue0.2351***NDVI0.1404***
Intensity0.0932***Intensity0.0090
Saturation0.1819***Saturation0.0515*
Lightness0.0848***Lightness0.0208*
a *0.1275***a *0.1467***
b *0.1573***b *0.0080
u *0.1470***u *0.2021***
v *0.0884***v *0.0002
CSI0.1830***CSI0.1031***
TGI0.0527*TGI0.0019
NGRDI0.1645***NGRDI0.0007
Publisher’s Note: MDPI stays neutral with regard to jurisdictional claims in published maps and institutional affiliations.

