Proceeding Paper

Steps towards Industrial Validation Experiments †

1
Empa, Materials Science and Technology, CH-8600 Dübendorf, Switzerland
2
National Physical Laboratory, Teddington TW11 0LW, UK
3
School of Engineering, University of Liverpool, Liverpool L69 3GH, UK
4
Industrial Systems Institute, Athena Research and Innovation Center, 265 04 Patras, Greece
5
Dantec Dynamics GmbH, D-89077 Ulm, Germany
6
Airbus Operations Ltd., Filton, Bristol BS99 7AR, UK
*
Author to whom correspondence should be addressed.
Presented at the 18th International Conference on Experimental Mechanics, Brussels, Belgium, 1–5 July 2018.
Proceedings 2018, 2(8), 391; https://doi.org/10.3390/ICEM18-05216
Published: 9 May 2018
(This article belongs to the Proceedings of The 18th International Conference on Experimental Mechanics)

Abstract

:
Imaging systems for measuring surface displacement and strain fields such as stereoscopic Digital Image Correlation (DIC) are increasingly used in industry to validate model simulations. Recently, CEN has published a guideline for validation that is based on image decomposition to compare predicted and measured data fields. The CEN guideline was evaluated in an inter-laboratory study that demonstrated its usefulness in laboratory environments. This paper addresses the incorporation of the CEN methodology into an industrial environment and reports progress of the H2020 Clean Sky 2 project MOTIVATE. First, while DIC is a well-established technique, the estimation of its measurement uncertainty in an industrial environment is still being discussed, as the current approach to rely on the calibration uncertainty is insufficient. Second, in view of the push towards virtual testing it is important to harvest existing data in the course of the V&V activities before requesting a dedicated validation experiment, specifically at higher levels of the test pyramid. Finally, it is of uttermost importance to ensure compatibility and comparability of the simulation and measurement data so as to optimize the test matrix for maximum reliability and credibility of the simulations and a quantification of the model quality.

1. Introduction

Validation is usually embedded in a Verification & Validation (V&V) process, the overall aim of which is to establish confidence that a computational model behaves in accordance with its underlying assumptions and equations, and that it produces realistic results with respect to particular objectives which are derived from a specified intended use. Consequently, the simulation results have to be evaluated against these objectives, which is why validation is performed by comparing model behavior with the real system behavior when both simulation and observation are conducted under nominally identical conditions.
A generic framework for performing validation experiments for computational solid mechanics models was established by the ASME [1,2]. In solid mechanics, validation has long been performed using single data points, for example evaluating the maximum or minimum values of a response measured by strain gauges. Recently, CEN has published a guideline for validation [3] which was developed in the European FP7 project VANESSA [4]. This guideline addresses the use of full-field measurement instruments in the validation process. Such instruments use imaging methods for measuring surface displacement, strain or stress fields—such as stereoscopic Digital Image Correlation (DIC), speckle pattern interferometry or thermal stress analysis—and are increasingly used in industry. The methodology described in the CEN guideline is based on image decomposition to compare predicted and measured data fields. The guideline was evaluated in an inter-laboratory study on different representative test objects and demonstrated its usefulness in laboratory environments [5].
This paper addresses the incorporation of the methodology into an advanced structural test in an industrial environment as it is currently undertaken in the H2020 Clean Sky 2 project MOTIVATE [6]. It is expected that this step up from Technology Readiness Level 4 to 6 will lead to an update of the CEN guideline to support its use in industrial environments. First, although DIC is a well-established technique for measuring displacement and strain fields on the surface of components [7], the estimation of its measurement uncertainty in an industrial environment is still being discussed [8], while the uncertainty contribution from calibration can readily be established using a reference material [9] in conjunction with the calibration methodology described in the CEN guideline [3]. Second, in view of the push towards virtual testing it is important to harvest existing information (historical data) in the course of the V&V activities before requesting an additional dedicated validation experiment, specifically at higher levels of the test pyramid. Finally, it is of uttermost importance to ensure compatibility and comparability of the simulation and measurement data so as to optimize the test matrix for maximum reliability and credibility of the simulations and achieve a quantification of the model quality using an appropriate validation metric. The practical applicability of the CEN guideline must be addressed for complex geometry, and a lack of experimental data points (e.g., due to DIC optical accessibility) and their mitigation, such as the ‘interpolation’ or the ‘tiling’ technique [10].

2. Validation in an Industrial Context

Typically, the validation process is presented in a flowchart that splits into parallel strands of activities for computational and experimental modelling and recombines with the quantitative comparison between simulation and experimental outcomes, Figure 1, with the colored boxes discussed in what follows. Steps of the ASME V&V [1] guide include the selection of system response quantities—preferably displacement or strain fields; software verification and convergence checks; definition of the metric for data comparison; specification of model accuracy requirements adequate for its intended use.
Outcomes are compared with the purpose of providing sufficient information for a subsequent decision on whether acceptable agreement of the simulation data with the experimental results has been reached, in which case the model is successfully validated. If the level of agreement is insufficient, then, usually, the computational model or the experiment, or both, need to be reviewed [11]. In general, the process should be repeated until an acceptable agreement is reached. To address the specific needs of validation in an industrial environment, the MOTIVATE collaboration addresses the following issues, among others.

2.1. Prerequisites for a Significant Validation Outcome

When the experimental results are used as reference against which the computational data are compared in the Validation assessment, Figure 1, insufficient information on the accuracy of the experimental results does not allow adequate confidence to be built for the computational model. This promotes the need for new experiments in order to obtain the necessary information, as was reported by Hack et al. [5]. The acceptable level of measurement uncertainty is governed by the accuracy requirements for the intended use of the model. Methods are being developed in MOTIVATE to estimate the measurement uncertainty of a DIC system in situ in an industrial environment. It will further be necessary to identify error sources apart from those associated with DIC, such as from the mechanical set-up and load introduction, as well as environmental boundary conditions.
Figure 1. A generic validation flowchart. The outcomes from both the Mathematical and Physical strand, the quantitative comparison constituting the validation step and the decision on acceptable agreement are high-lighted for discussion in the main text.
Proceedings 02 00391 g001

2.2. Quantitative Comparison Using a Validation Metric

The flowchart, Figure 1, ties together the mathematical and physical strands in the box of quantitative comparison of the simulation results and experimental data. The outcome of this comparison is then assessed in the next step with respect to the accuracy limits, set beforehand, for the intended use of the model.
Typically, it is followed by a Yes/No decision as to whether the agreement is acceptable. The CEN guideline has established a methodology to take this decision based on the comparison of feature vectors obtained from image decomposition. However, the information is then lost relating to how good the model is, if it is acceptable, or how bad, if it is not. The absence of this information leads to an unweighted, generic decision to revise the model or the experiment.
In industrial validation, a robust outcome from the quantitative comparison is mandatory and should be based on an objective validation metric [12], meaning that different engineers can obtain the same value of the metric from the same sets of data and validation requirements. A literature review has revealed a lack of validation metrics that could be applied to full-field data, as opposed to time-series data from a single sensor or output. Hence, a new metric has been developed based on the concept of relative error and considering the uncertainty in the measurement data [13]. While this validation metric can still inform a yes/no decision, it also allows the quantification of the extent to which the model agrees with the experiment.

2.3. Incorporation of Historical Data

While a validation experiment may finally not yield a favorite decision for the use of a computational model, the data generated might still be useful in a different context or under more relaxed requirements of use. In such a case, the data or part thereof should be available for later use in a further validation process. It is felt appropriate, therefore, to incorporate the use of “historical data” into the validation flowchart to reflect the fact that the industrial validation process is very cost-sensitive.

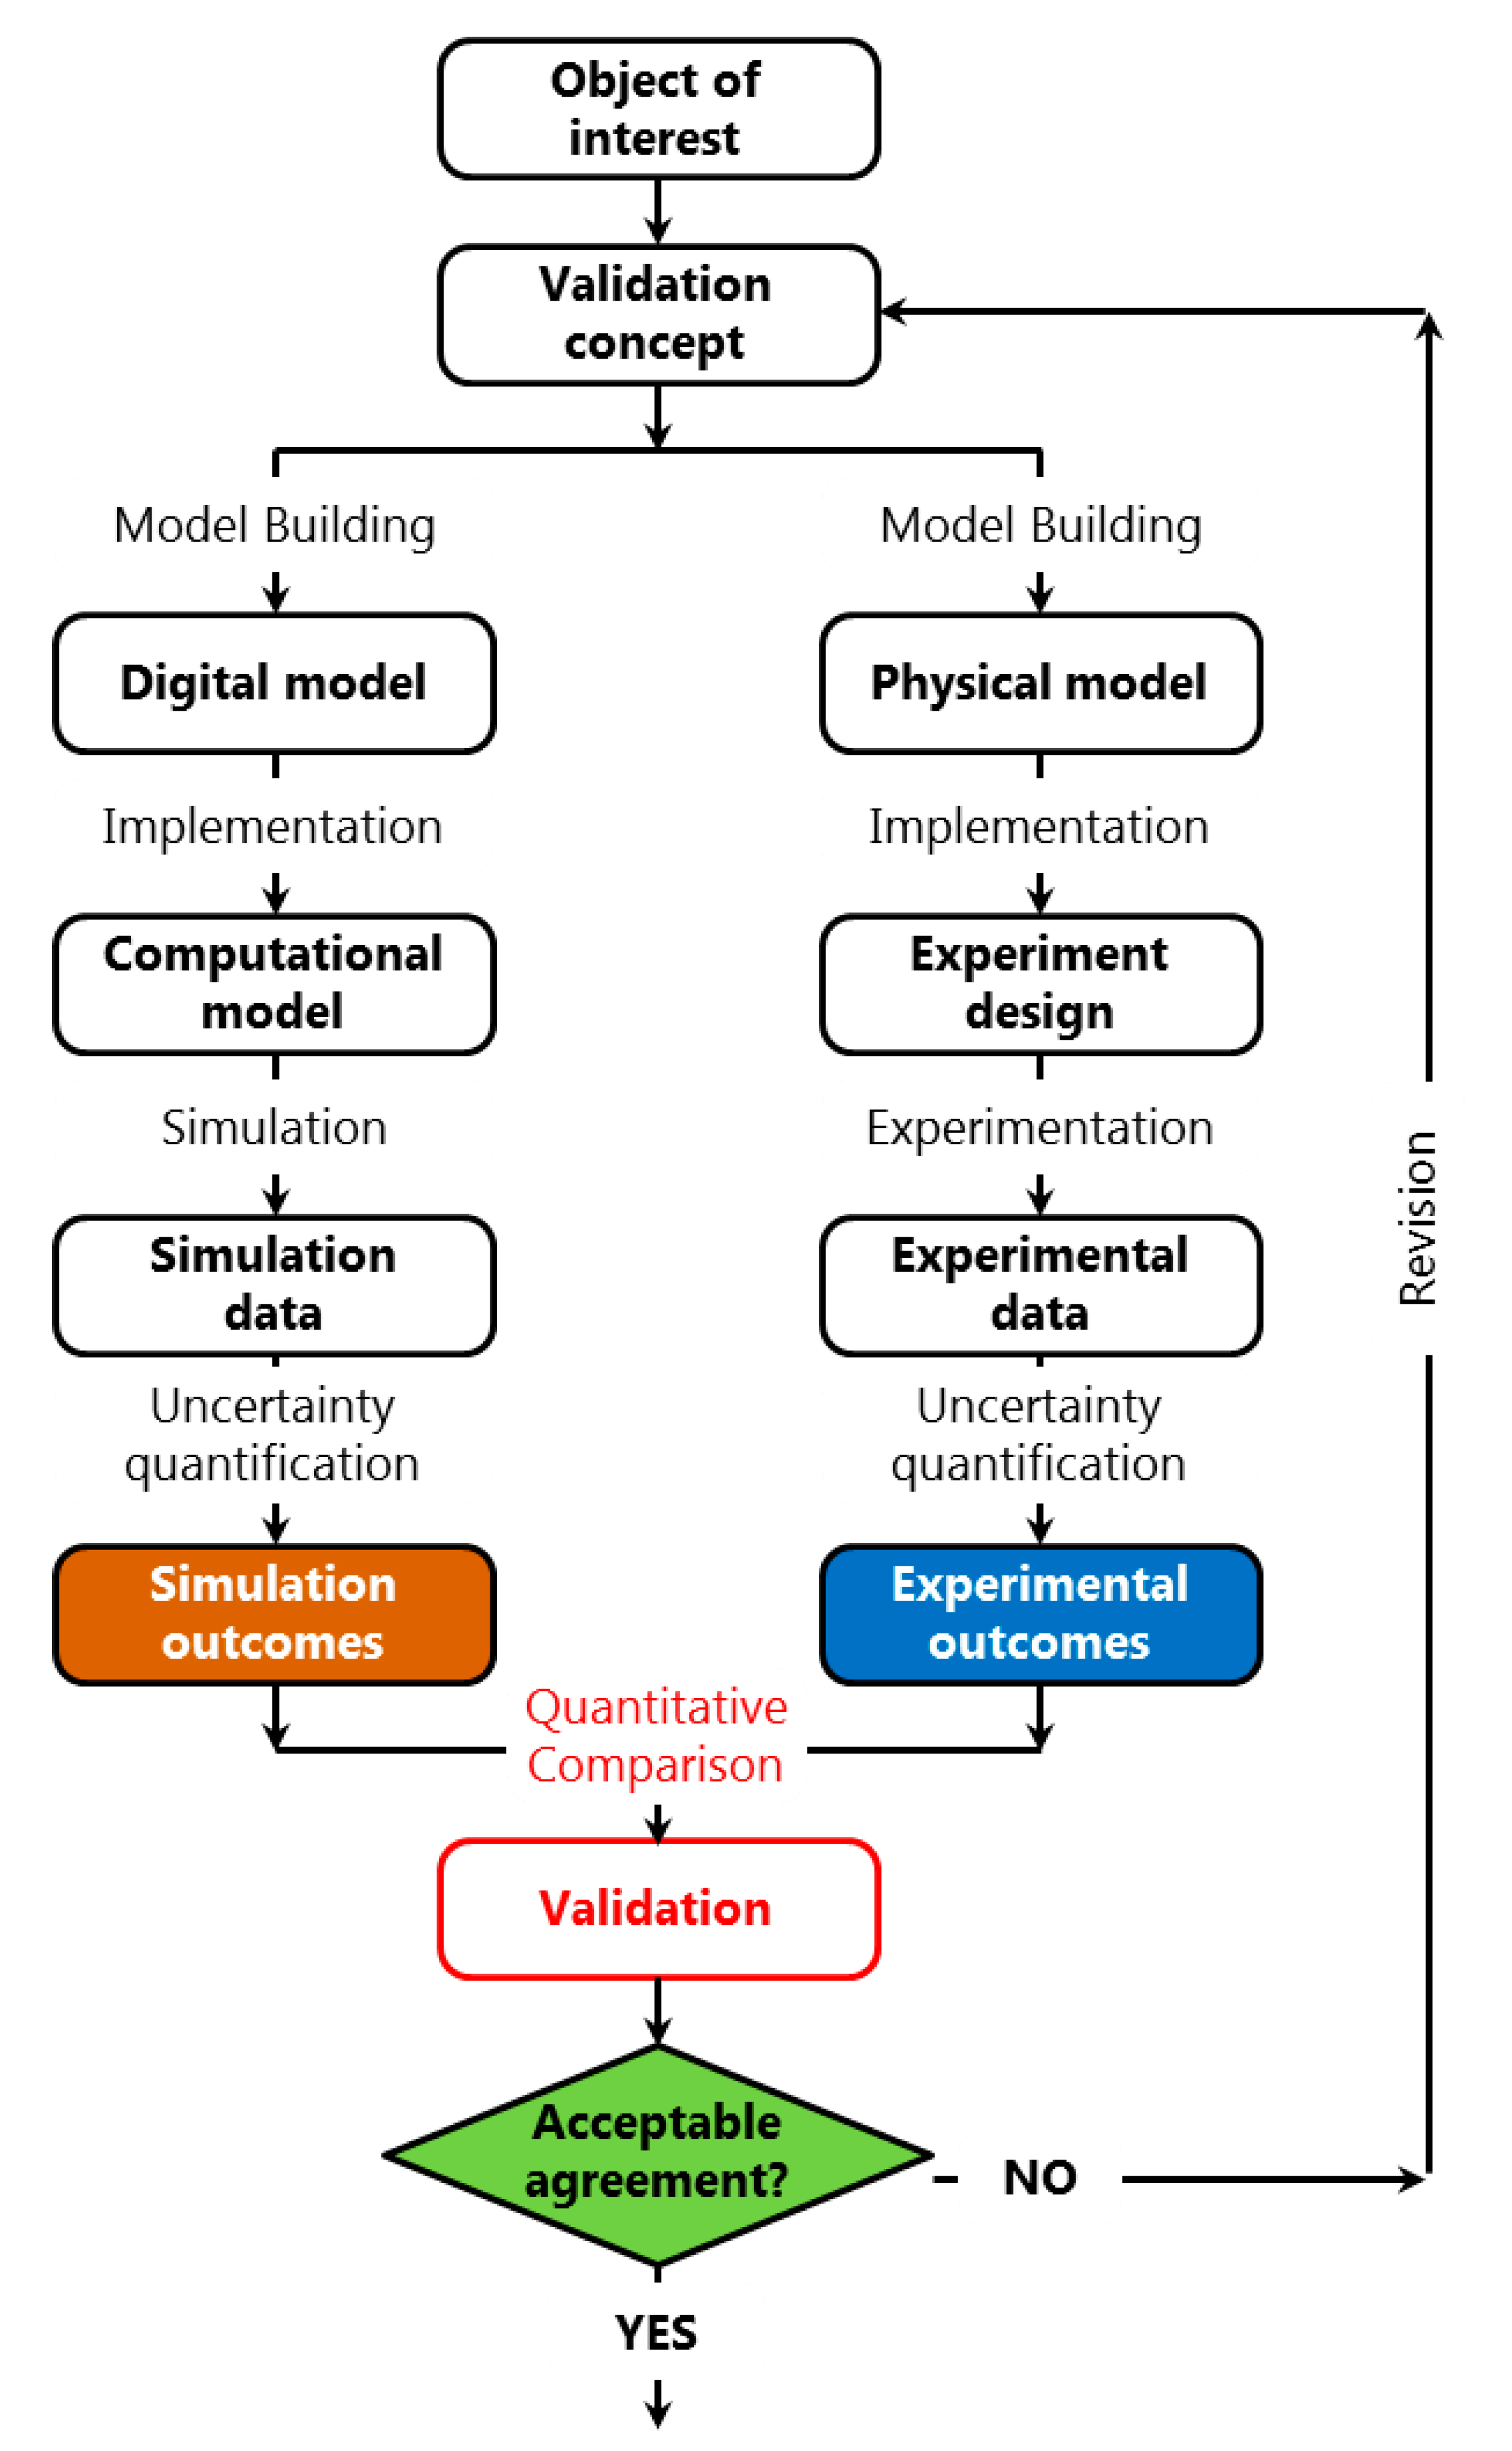
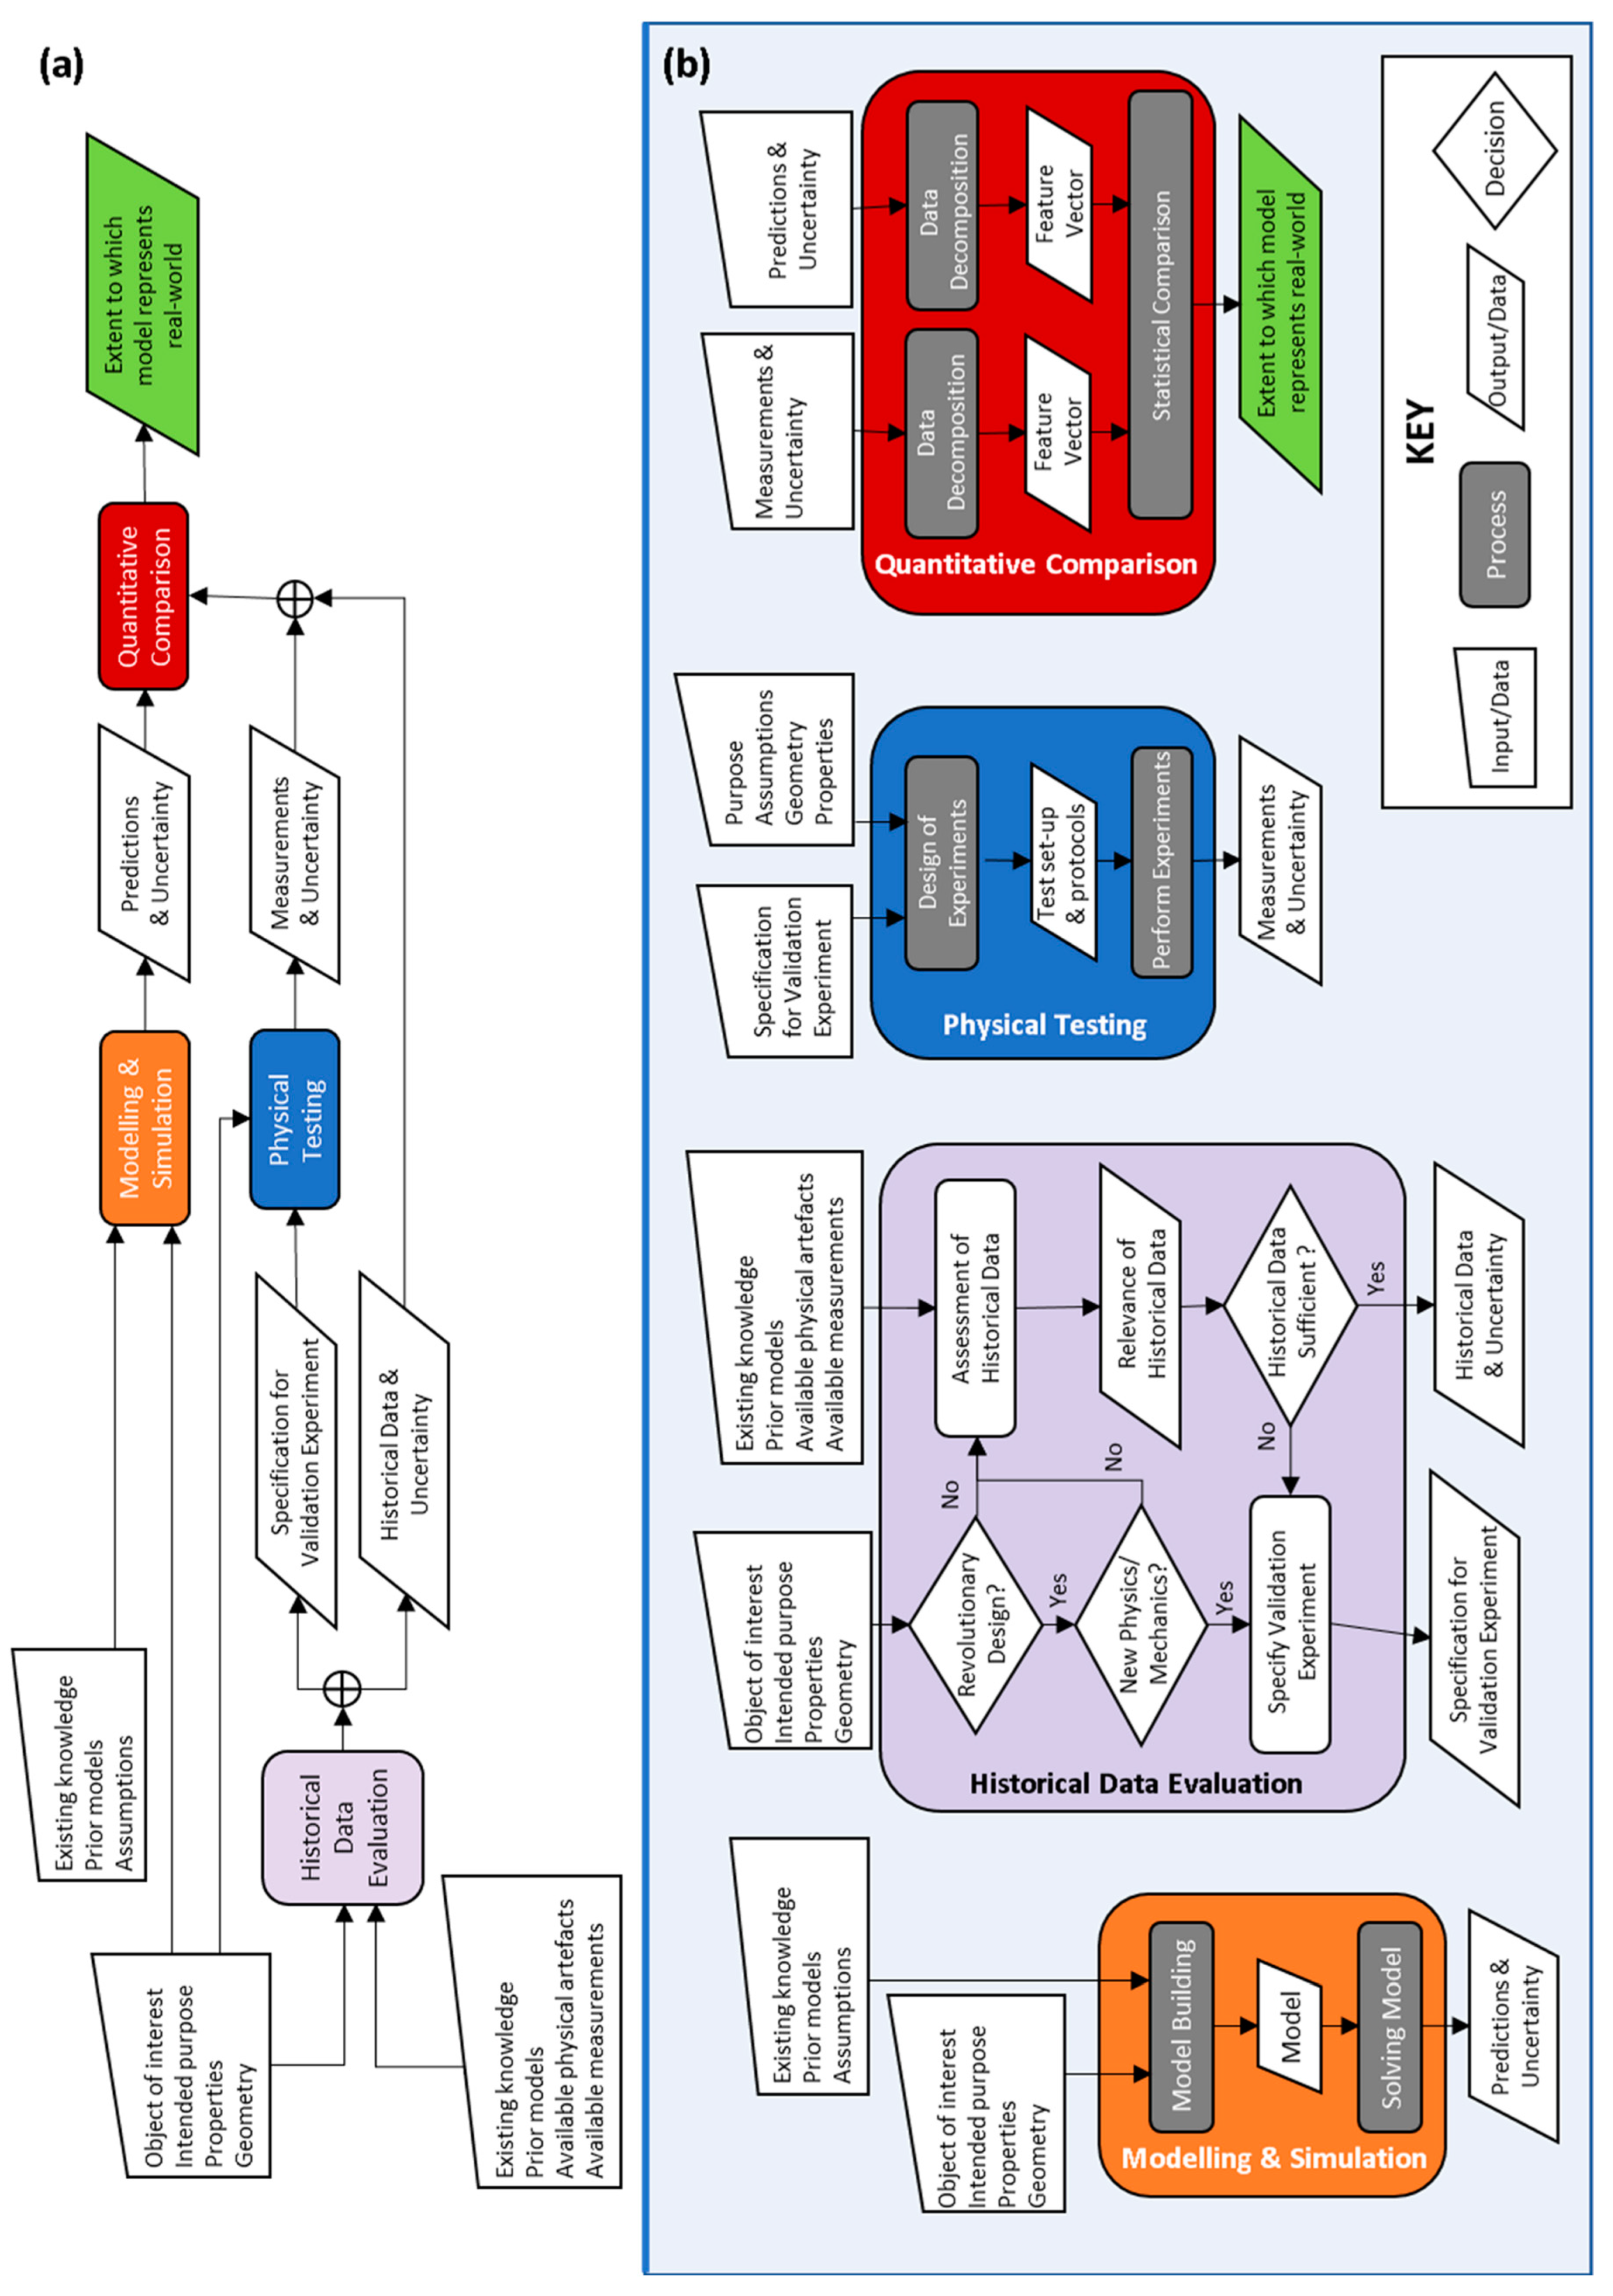
3. Proposed Validation Flowchart

One goal of the MOTIVATE project is to provide a smarter testing methodology by integration of test and simulation that can be optimized by intertwining experiments and simulations to minimize cost and maximize confidence in predictions while ensuring a rigorous and robust validation. However, the validation flowchart, Figure 1, places equal emphasis on test and simulation, or experiment and model. Therefore, the MOTIVATE consortium has given some consideration to redesigning the flowchart to place more emphasis on the modelling and simulation while ensuring a rigorous and robust validation. The revised flowchart in Figure 2 was developed from a brain-storming session involving the consortium and the topic manager.
The flowchart for the validation process is shown in Figure 2a and a key new feature is the evaluation of historical data. In addition, the relative positions and flow of information has been altered relative to the flowchart in Figure 1; in particular, the construction of the model takes priority and physical testing is performed only if required. The processes involved are shown as colored boxes in the Figure 2a and the sub-processes within them are shown in corresponding colors in Figure 2b. This includes the decision sequence required to evaluate historical data for use in the validation process and the quantitative validation process described in the CEN guideline is supplemented by an appropriate validation metric.

4. Conclusions

The work presented will allow the extension of the process described in the CEN guideline to include a validation metric, i.e., a measure of the extent to which the model’s predictions represent the real-world; and translate the validation process into the industrial environment.
The implementation of the validation process described in the CEN guideline has been reviewed in the context of an industrial environment. A revised flowchart has been developed for the validation process with the aim of shifting the emphasis from validation experiments towards simulation, permitting the use of historical data in appropriate circumstances and including a new validation metric. This will lead to recommendations for updating the CEN guideline and will help in deciding whether the guideline will be transformed into a CEN standard or other CEN deliverable. Therefore, we encourage the community to give feedback on the CEN guideline or the revised flowchart, Figure 2, to the chair of the CEN Workshop 71 [14].

Author Contributions

E.H. is main author and presenter of the paper; R.B. has contributed to the flowchart by suggesting its modularity; K.D. contributed the aspects of validation metric; G.L. contributed to the simulation aspects; E.P. is Coordinator of the MOTIVATE project and drafted the first version of the revised flowchart; T.S. contributed to the DIC uncertainty; E.S. represents the Topic Manager of the MOTIVATE project and contributed the industrial view to validation.

Acknowledgments

This project has received funding from the Clean Sky 2 Joint Undertaking under the European Union’s Horizon 2020 research and innovation program under Grant Agreement No. 754660. H2020 projects follow a strict Open Access policy.

Conflicts of Interest

The authors declare no conflict of interest. The founding sponsors had no role in the design of the study; in the writing of the manuscript, and in the decision to publish the results.

References

  1. ASME. Guide for Verification and Validation in Computational Solid Mechanics; American Society of Mechanical Engineers ASME V&V 10-2006: New York, NY, USA, 2006. [Google Scholar]
  2. ASME. An Illustration of the Concepts of Verification and Validation in Computational Solid Mechanics; American Society of Mechanical Engineers ASME V&V 10.1-2012: New York, NY, USA, 2012. [Google Scholar]
  3. European Committee for Standardisation (CEN). Validation of computational solid mechanics models. In CEN Workshop Agreement, CWA 16799:2014 E. Available online: https://www.cen.eu/work/areas/Materials/Pages/WS-71.aspx (accessed on 30 April 2018).
  4. EU framework programme 7 project VANESSA: VAlidation of Numerical Engineering Simulations—Standardisation Action (Grant Agreement No. 319116). Available online: http://www.engineeringvalidation.org/vanessa (accessed on 30 April 2018).
  5. Hack, E.; Lampeas, G.; Patterson, E.A. An evaluation of a protocol for the validation of computational solid mechanics models. J. Strain Anal. Eng. Des. 2016, 51, 5–13. [Google Scholar] [CrossRef]
  6. MOTIVATE, Matrix Optimization for Testing by Interaction of Virtual and Test Environments, H2020 Clean Sky 2 Project (Grant Agreement No. 754660). Available online: www.engineeringvalidation.org (accessed on 30 April 2018).
  7. Sutton, M.A.; Orteu, J.-J.; Schreier, H. Image Correlation for Shape, Motion and Deformation Measurements; Springer: New York, NY, USA, 2009. [Google Scholar]
  8. Reu, P.L. , A study of the influence of calibration uncertainty on the global uncertainty for digital image correlation using a Monte Carlo approach. Exp. Mech. 2013, 53, 1661–1680. [Google Scholar] [CrossRef]
  9. Hack, E.; Lin, X.; Patterson, E.A.; Sebastian, C.M. , A reference material for establishing uncertainties in full-field displacement measurements. Meas. Sci. Technol. 2015, 26, 075004. [Google Scholar] [CrossRef]
  10. Lampeas, G.; Pasialis, V.P.; Lin, X.; Patterson, E.A. On the validation of solid mechanics models using optical measurements and data decomposition. Simul. Model. Pract. Theory 2015, 52, 92–107. [Google Scholar] [CrossRef]
  11. Sargent, R.G. An introduction to verification and validation of simulation models. In Proceedings of the 2013 Winter Simulation Conference, Washington DC, USA, 8–11 December 2013; pp. 321–327. [Google Scholar]
  12. Oberkampf, W.L.; Barone, M.F. Measures of agreement between computation and experiment: Validation metrics. J. Comput. Phys. 2006, 217, 5–36. [Google Scholar] [CrossRef]
  13. Dvurecenska, K.; Patelli, E.; Patterson, E.A. What’s the probability that a simulation agrees with your experiment? In Proceedings of the Photomechanics 2018 conference, Toulouse, France, 19–22 March 2018; pp. 65–67. [Google Scholar]
  14. Chair of CEN Workshop WS71. E-Mail: [email protected].
Figure 2. The validation process in an industrial context. (a) Proposed revised flowchart for a validation process including the evaluation of historical data; (b) more detailed contents of sub-processes in the colored boxes of (a).
Proceedings 02 00391 g002
Publisher’s Note: MDPI stays neutral with regard to jurisdictional claims in published maps and institutional affiliations.

