Abstract
DInSAR is a renowned method for estimating land subsidence based on the principles of interferometric synthetic aperture radar using different series of the temporal dataset. The present study has been performed using GMTSAR software with Sentinel 1 SAR data of C band for the duration of 2017–2019 (January to April) and focused particularly over the area of Jagadhri city which is situated 100 km away from Chandigarh, which has been identified under the potential threat of land subsidence. The DInSAR method has been applied in this study that came up with an outcome of three interferograms and yearly displacement that broadcast an update on the diagnosis of subsidence activity in the area. A total of six Single Look Complex (SLC) datasets were selectively chosen with a minimum temporal and spatial baseline so that the problem of decorrelation would be minimal. Goldstein filtering has been applied to the deburst interferograms which reduced the noise and, in turn, improved the quality of output. The city is located on the western bank of river Yamuna and about 55 km on the east of Ambala. Due to the presence of unconsolidated sediments in the aquifer system and over-exploitation of groundwater to meet the domestic needs has led to surface deformation in and around the city area. The outcome of this study identifies the area of depression quite distinctly while the accuracy has been assessed by ground survey. The rate of subsidence estimated approximately 4.98 cm/year which can prove to be disastrous over the course of time.
1. Introduction
In a brief outlook, the word “subsidence” refers to the sinking or gradual downing of any materialistic or physical surface with a negligible amount of horizontal motion. Land subsidence can also be defined as an environmental or geological phenomenon that causes slow lowering of ground surface elevation [1]. It is often observed as a result of natural compaction of existing unconsolidated sediments and excessive extraction of ground water, geothermal fluids, oil, gas, coal, and other solids through mining [2,3]. Land subsidence leads to changes in the small scale topographic gradients, thus causing damage in infrastructure, inundation of land and reducing the capacity of aquifers to store water, ruptures in land surface, magnifying the chance of getting flooded, ultimately posing a risk for the society and economy [4]. Land subsidence can be measured by several methods such as (i) direct measurement of aquifer compaction by extensometer, (ii) groundwater head observation, (iii) calculation by using geological and hydrogeological data and (iv) measurement of topographic elevation changes by geodetic methods of levelling and Global Positioning System (GPS) [5]. Noteworthy, all of these methods are time-consuming and often precise field measurements are not possible, especially in dense urban areas, whereas satellite data has the capability to look into the scenario over a large area with an accuracy of a satisfactory level. Therefore, in order to overcome such limitations, the microwave repeat pass interferometric synthetic aperture radar (InSAR) technique with temporal SAR image can be used for assessing the land-surface elevation changes with high precision. Many studies have used D-InSAR technique [6,7,8,9,10] to monitor the land subsidence due to over-pumping of groundwater from confined aquifer systems. However, these studies have not followed up the atmospheric corrections while evaluating the potential subsidence from D-InSAR image pairs. Basically, the atmospheric corrections are performed to remove the effect of variations on water vapor content in the atmosphere because the water vapor content delays the microwave signal propagation emitted from the SAR antenna to target objects. The temporal decorrelation and atmospheric moisture content may cause a serious problem in retrieving the accurate time series of deformation [11]. The strong atmospheric effects may influence the interferogram accuracy in large scale, which leads to an error up to 3 cm, approximately [12]. Nevertheless, this technique indeed provides a scope of rapid assessment of land subsidence over a large region. The occurrence of land subsidence has been studied in many places around the world, including Tokyo in Japan [13], Mexico city in Mexico [14], western Saudi Arabia [15], Jakarta in Indonesia [16], Ravenna in Italy [17], Bangkok in Thailand [18], Pingtung plain in Taiwan [19], Beijing in China [20] etc. In the Indian context few cities such as Delhi [21], Kolkata [11,22], etc. These areas have been identified with the risk of land subsidence with varying magnitude. However, a study by Kim et al. in 2018 suggests that due to over-exploitation of groundwater, the north-western part of the Indo-Gangetic plain specifically Punjab, Haryana, and Chandigarh, are already in a high risk zone under land subsidence [23].
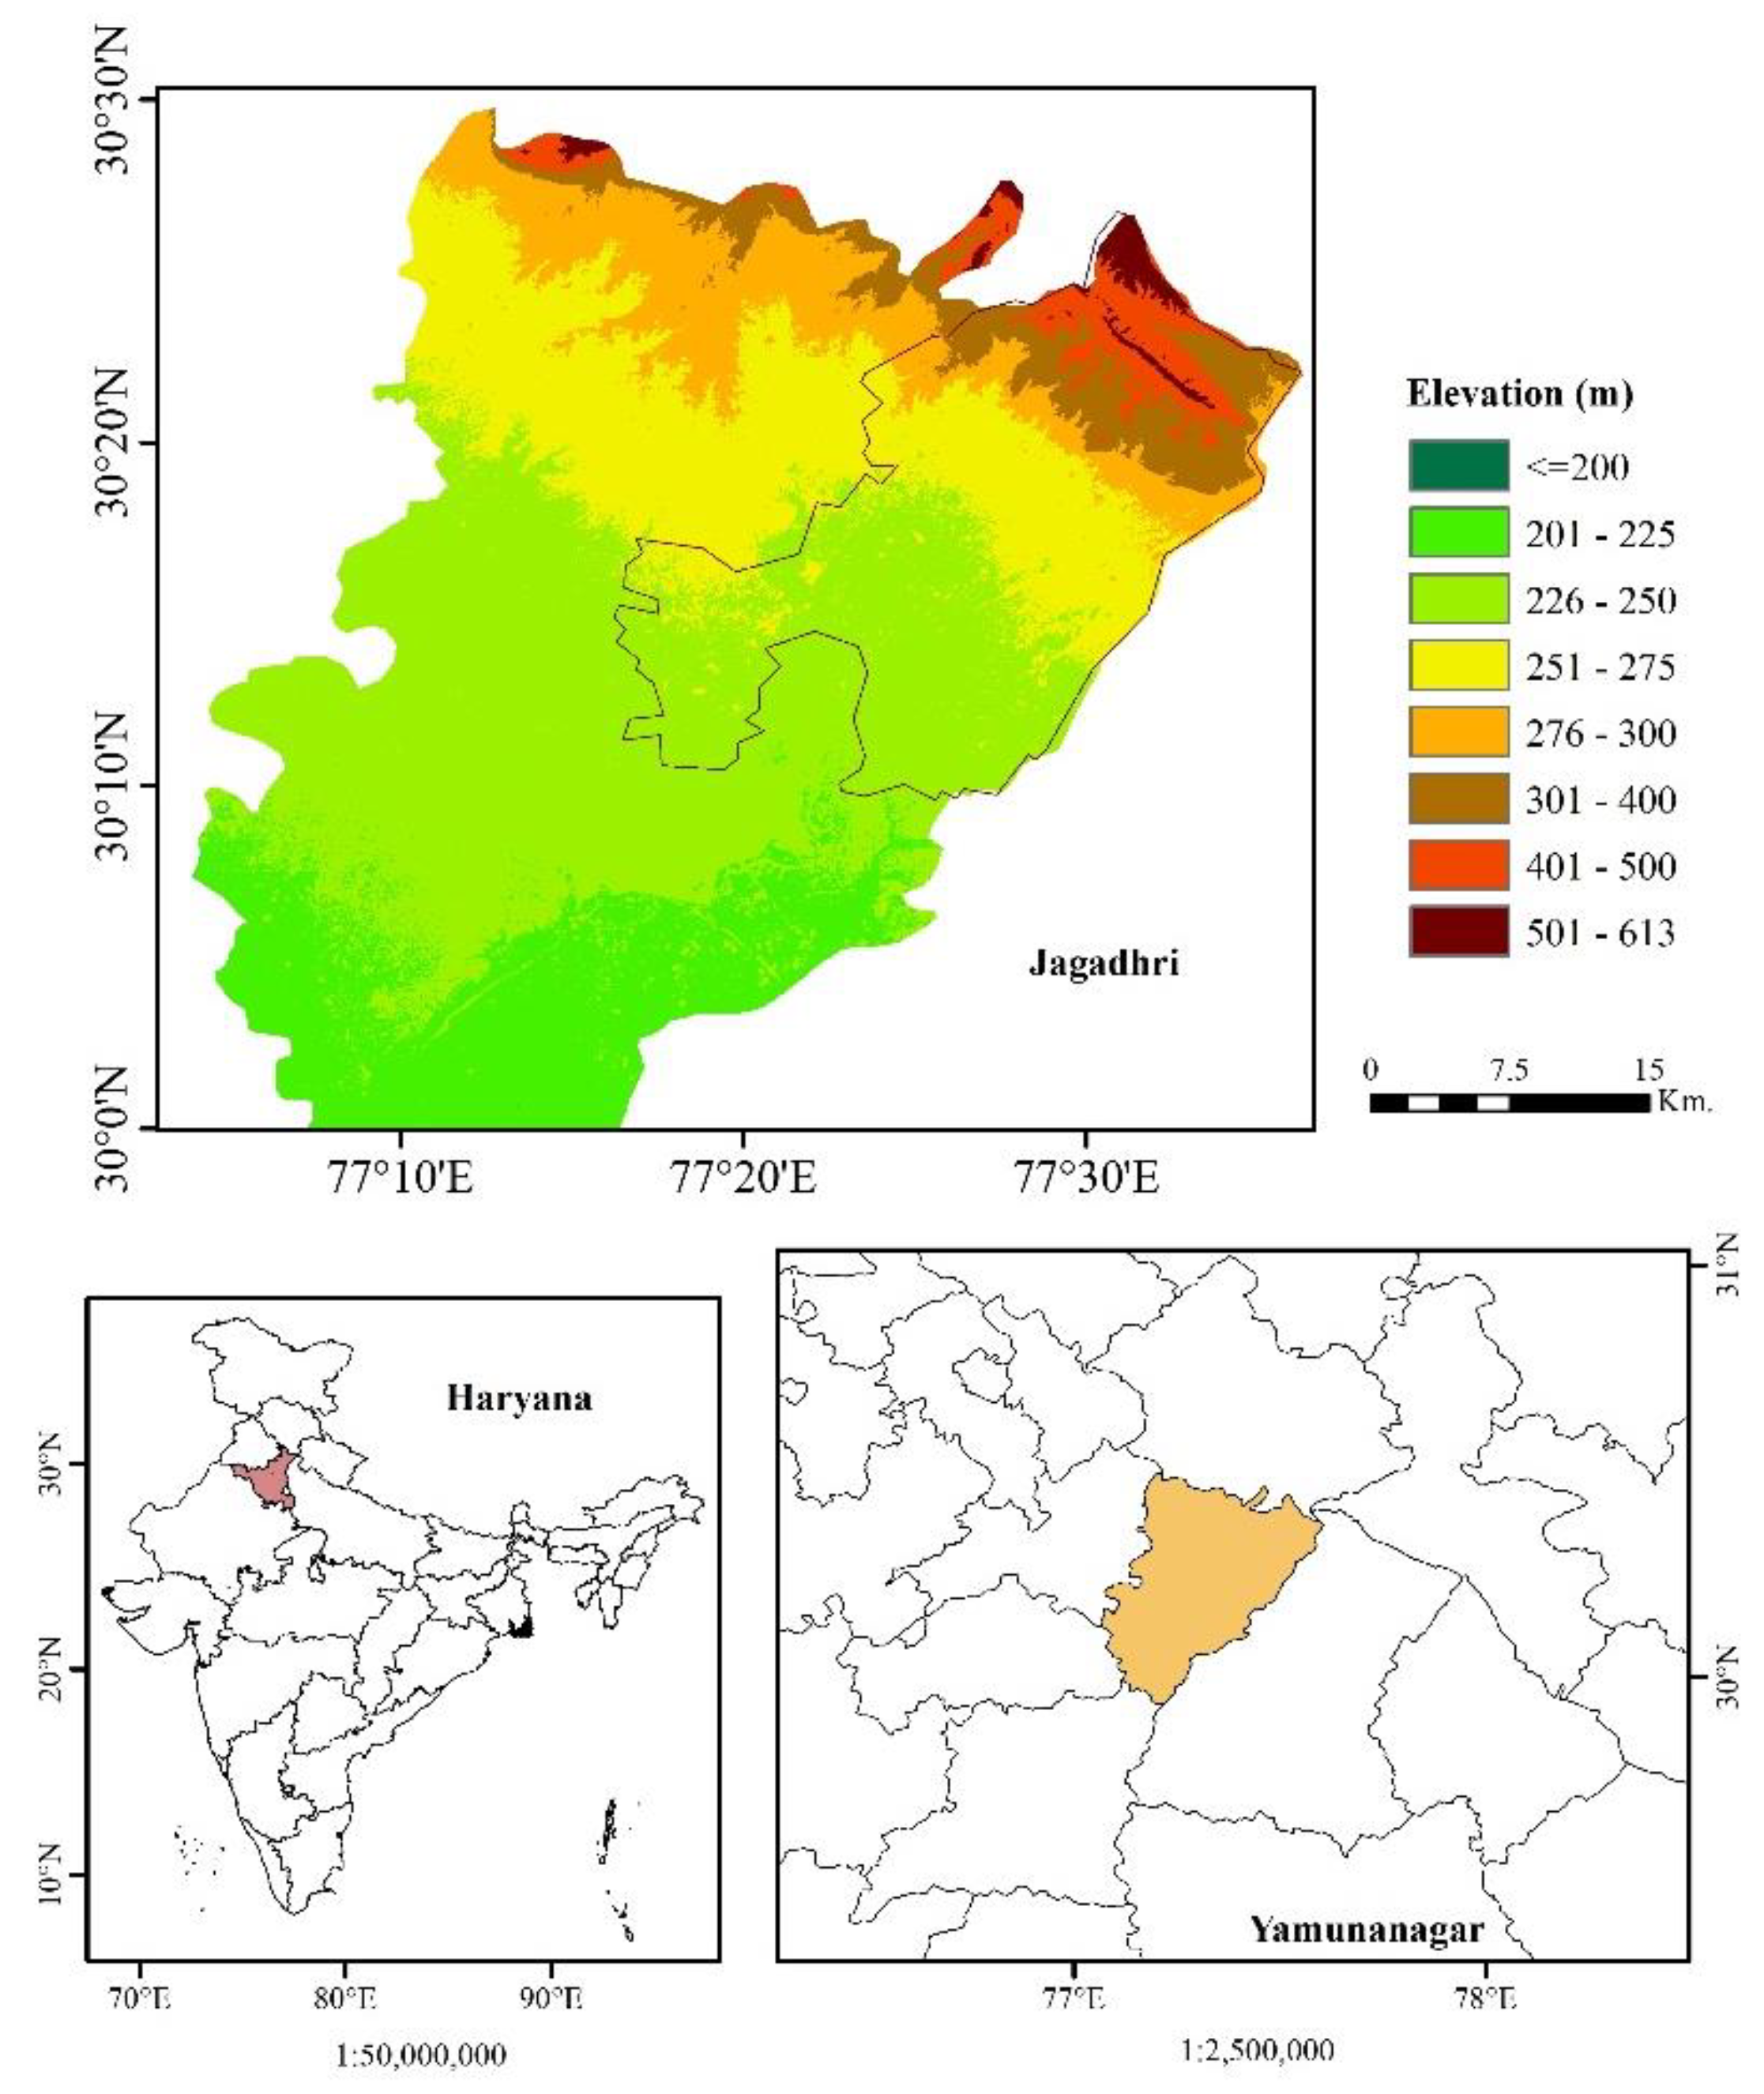
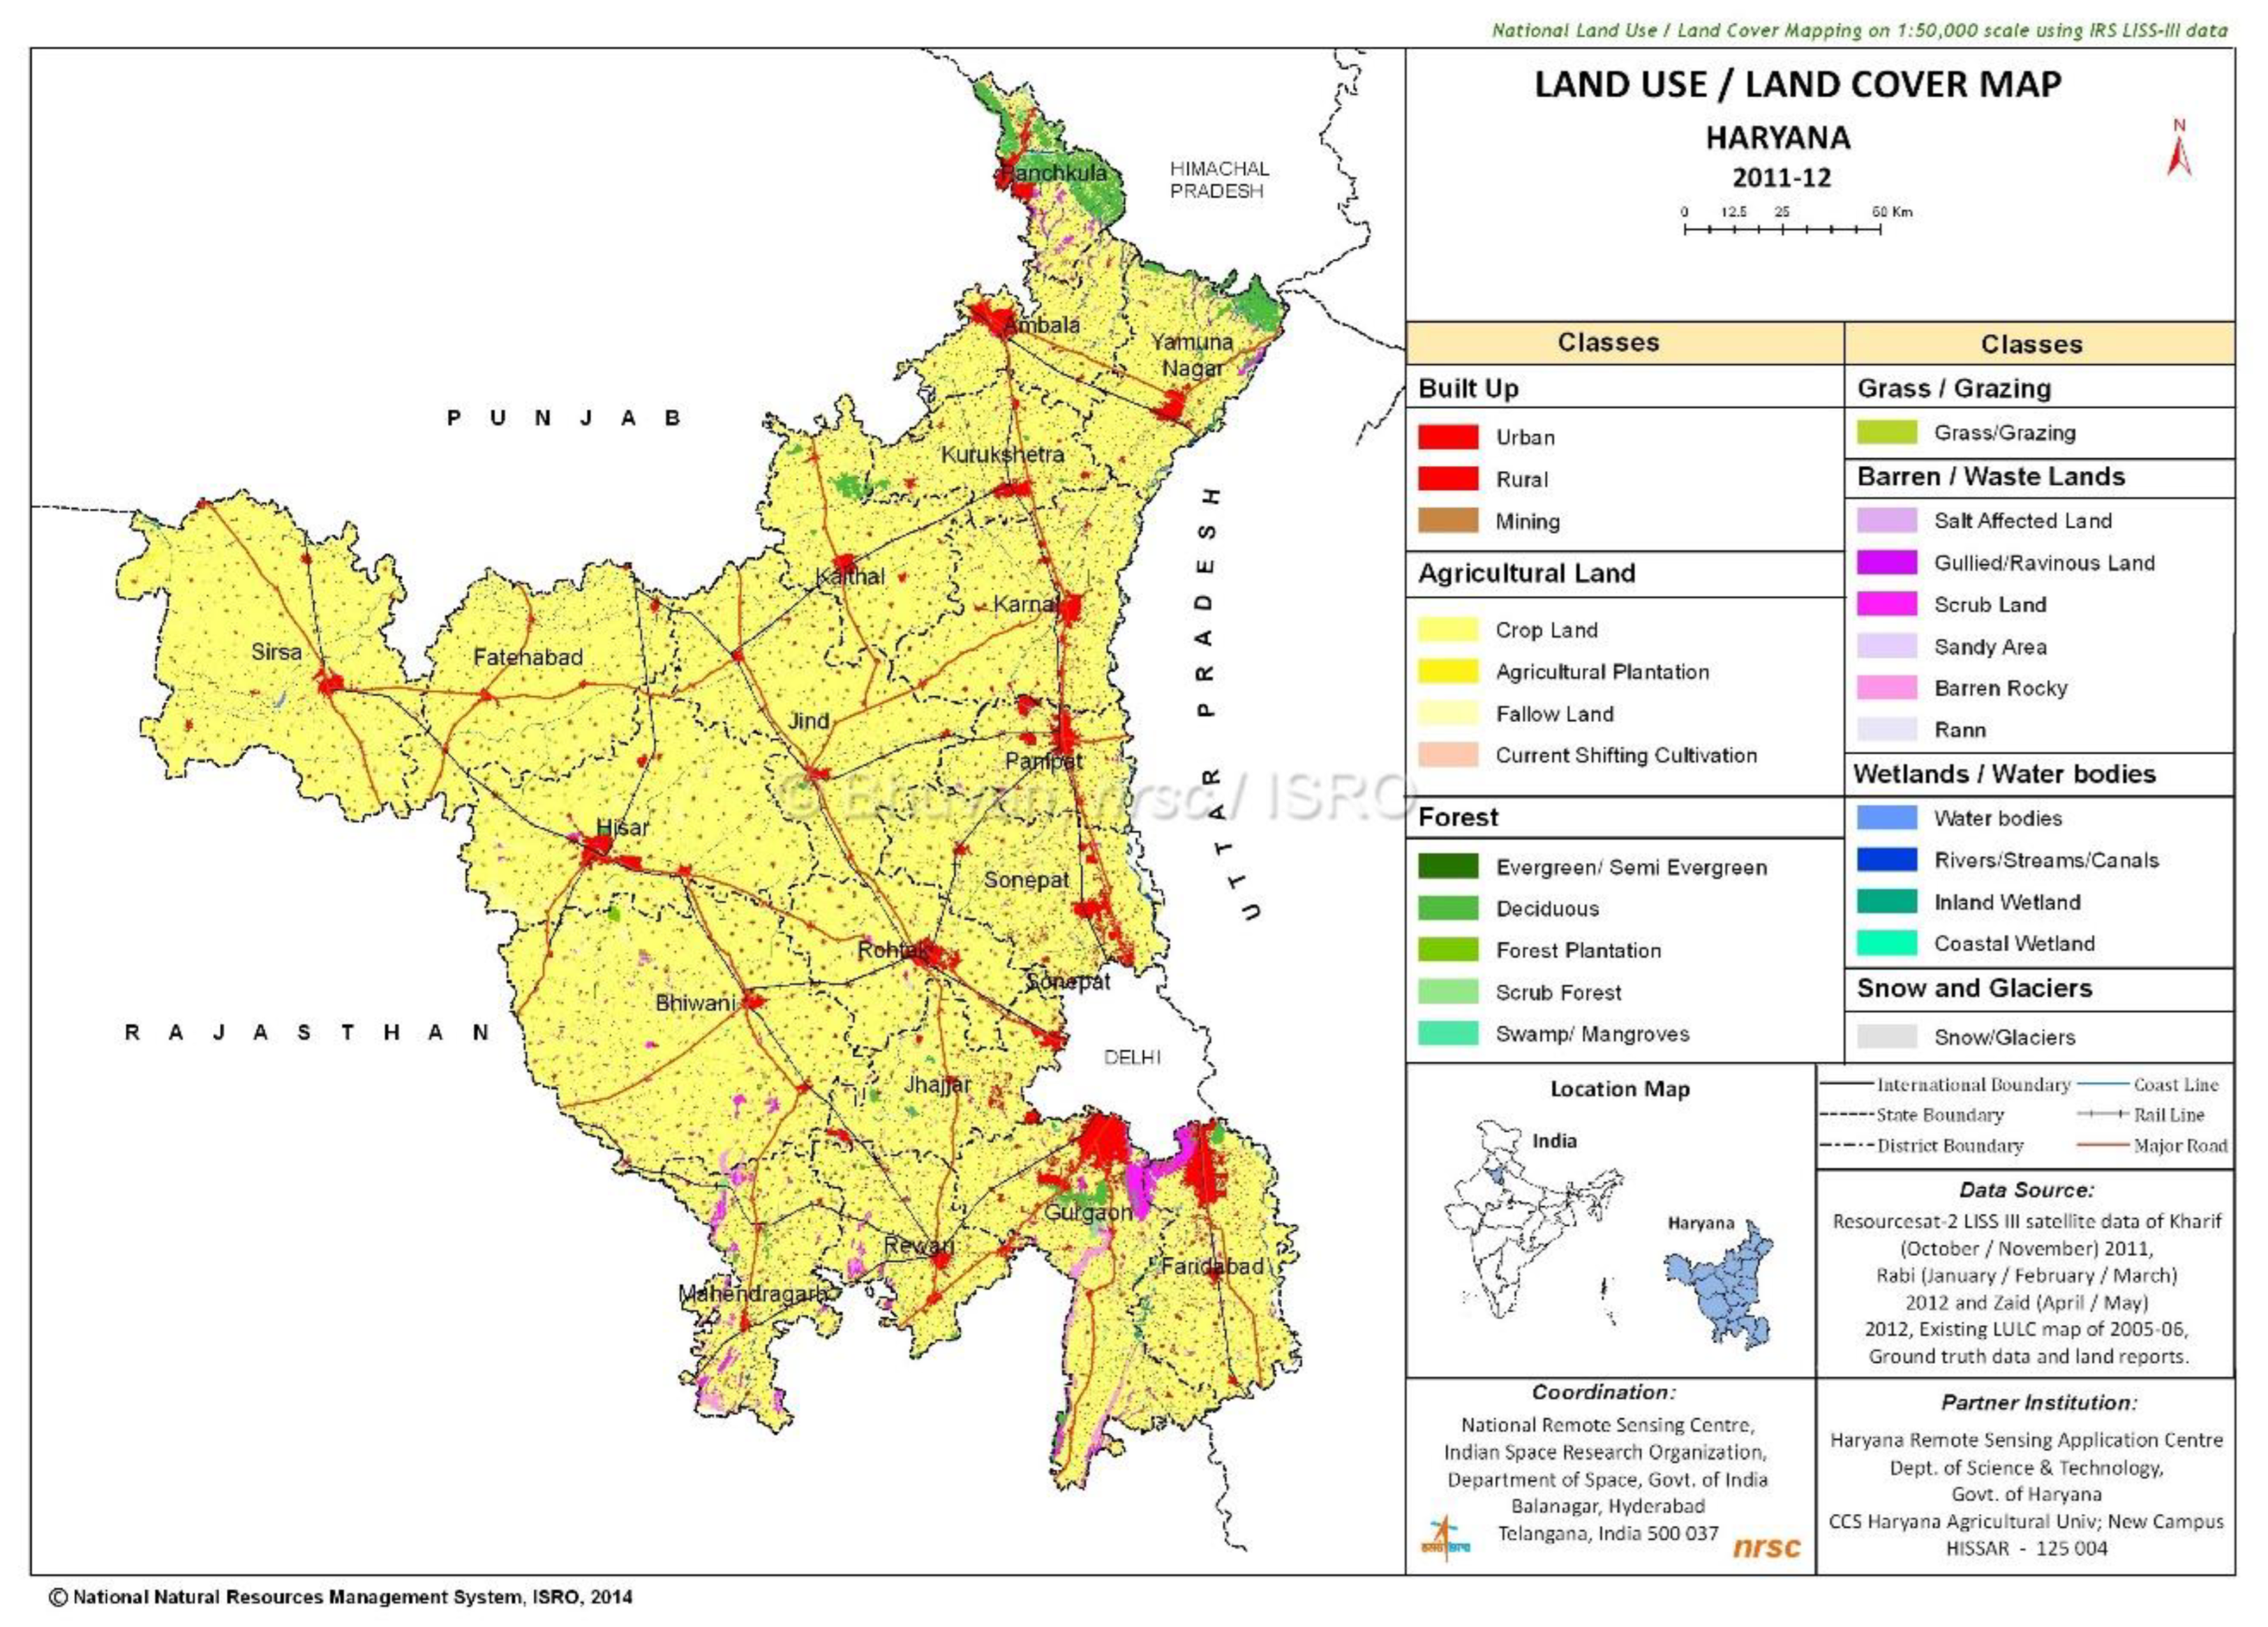
For the present study, Jagadhri city (30.1681°N, 77.2969°E) has been chosen as an area under investigation (Figure 1), which is located in Yamunanagar district in Haryana on the western bank of Yamuna river, 55 km away from Ambala and 100 km away from Chandigarh. This site is important from several points of view, i.e., the population is increasing by 3.39%/year and 2.25%/year in last two census decades, 2001, 2011, respectively. The land use land cover map of 1:50000 scale (Figure 2) prepared by the National Remote Sensing Centre using LISS-III data accessed from BHUVAN shows that a 91.53 sq.km. area is built-up and a 1431.42 sq.km. area is cropland which is directly dependent on groundwater as the source of fresh water for drinking purposes and water for daily requirements are coming from groundwater mainly while the large cropland area is served by an irrigation facility only during the monsoon season from Hathnikund barrage and dam, located right between western and eastern Yamuna canals. The most cultivated crop here is sugarcane which requires a significant amount of water, pumped from underground during 7 to 8 months a year. Therefore, with stress of substantial exploitation of groundwater, the water table decreases rapidly which results in land subsidence at the local level. It is high time to measure the rate of vertical displacement to be aware and plan the city accordingly. Therefore, this study has purposefully undertaken to estimate the magnitude of displacement rate in Jagadhri city area.

Figure 1.
Area of this study, Jagadhri city, in Yamunanagar district of Haryana, India.

Figure 2.
Land use land cover map of Haryana during 2011 and 2012 prepared by NRSC showing the location of Jagadhri city as the main city area in Yamunanagar district area.
2. Data and Methodology
In this study, DInSAR approach has been applied to measure the surface displacement by using two pass, or repeat pass interferometric techniques that are used to find the phase difference of the complex SAR signals between the acquisitions from two different passes with a slightly different orbital position. The dataset has been chosen in such a way that the difference in orbital position would be minimal. Interferogram has been generated by the superimposing of two SAR images by subtraction of phase values in each pixel. The coherent interferogram contains several pieces of phase information, such as (a) phase difference from the spatial baseline of the data pair assuming the Earth as a flat surface, (b) topographic unevenness due to terrain ruggedness, (c) phase component due to the displacement of the terrain in range direction, i.e., the radar line of sight, (d) error due to atmospheric phase change, (e) phase due to the residual noise effect of scattering characteristics of target objects which is a function of time and thermal noise [24]. For the feasibility of this study, Sentinel-1A Interferometric SAR data has been collected from Alaska Satellite Facility website (https://vertex.daac.asf.alaska.edu) and the DORIS data of Verified Orbit has collected from the European Space Agency website (https://qc.sentinel1.eo.esa.int/aux_poeorb/) which is available 20 days after the actual satellite acquisition. Generally, the perpendicular baseline and time difference between the images are important in such land subsidence-related studies because several attempts have been done in different areas with different spatial baselines to find an identical rate of subsidence [19,21]. The distance between the two SAR image acquisitions represents a baseline, hence, there are three spatial baselines 110, 136, and 121 m and three temporal baselines of 108, 102 and 120 days for the years 2017, 2018, and 2019 respectively. SRTM 1 arc sec DEM, accessed from GMTSAR DEM portal was used in order to eliminate the topographic phase component from the interferogram. Further, the phase noise due to radar signal was removed by the Goldstein filtering technique that ultimately enhanced the fringe visibility in the interferograms, therefore, helpful to produce coherence images as well. Noteworthy, the coherency ranges between 0 and 1 while the high coherence produced a better quality of interferogram. Atmospheric correction was not performed in the present study, instead of that, the dates of image acquisitions were selectively chosen from January in winter season and April in pre-monsoon season such that the amount of atmospheric moisture present would be minimal in order to avoid the atmospheric noise that usually originates due to variations in atmospheric condition during data acquisition. In the present study, phase unwrapping is performed to resolve this 2π ambiguity using minimum cost flow algorithm [25]. The methodology adopted in this study for DInSAR processing represented in Figure 3. The line of sight (LOS) displacement, i.e., in range direction has been calculated using the following formula:
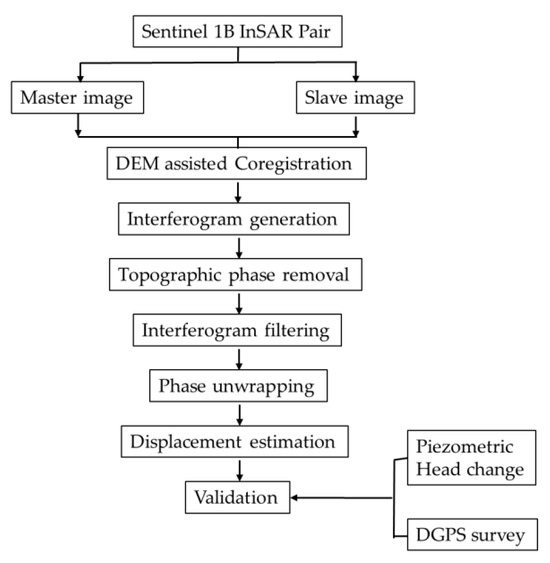
Figure 3.
Methodology flowchart.
Here, ∆D is the LOS displacement for a particular pixel in an unwrapped interferogram. ∆φ is the phase difference of that pixel for an InSAR pair separated temporally by 105 days while λ is the sensor wavelength. The present study incorporates the C-band data which have a wavelength of …m.
Therefore, the component of vertical displacement has been computed by the formula:
Here, ∆Dv is the magnitude of vertical displacement and θ is the local incidence angle. Further, the rate of displacement has been calculated by:
Here, ∆R is the displacement rate and ∆t is the temporal difference in days between two datasets. For validation purposes, DGPS data was collected four times each year in the months of January, April, July, and November in campaign mode for seven days at a stretch. For 2019, the DGPS data recorded in months of January and April has been considered for yearly rate consideration. The data has been post-processed using GAMIT software on the LINUX platform.
The lithology data, collected from the Central Groundwater Board, have been presented in Table 1. The piezometric data from three wells during November and April within the city area have been collected from the same source.

Table 1.
Lithology Data.
3. Result and Discussion
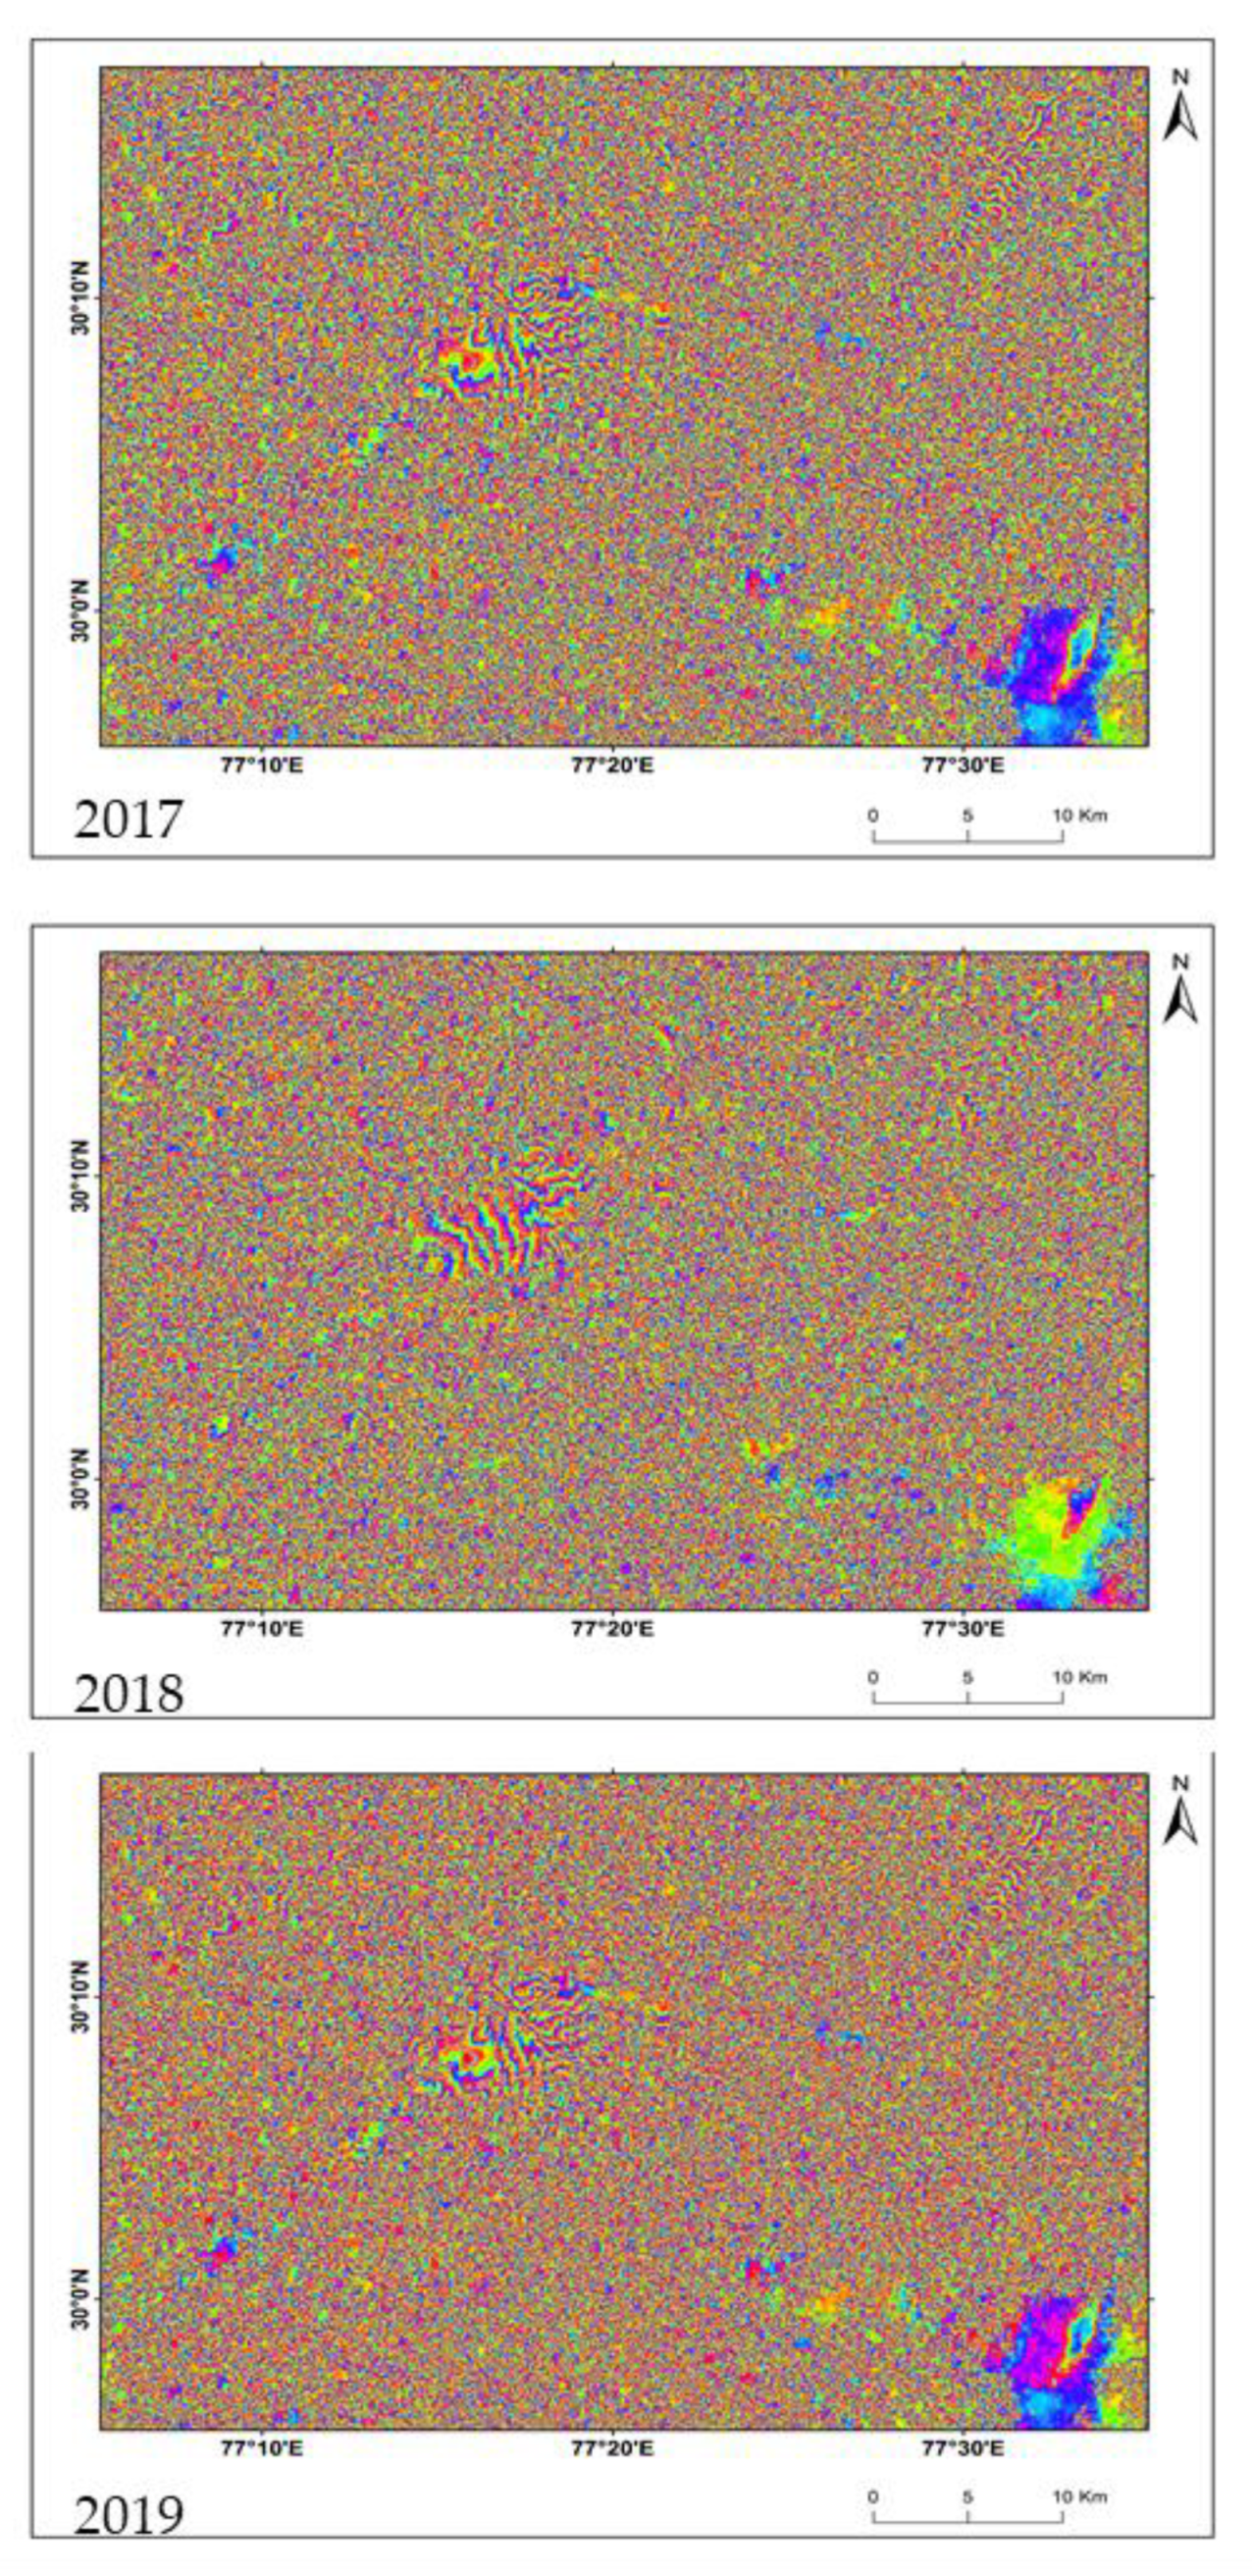
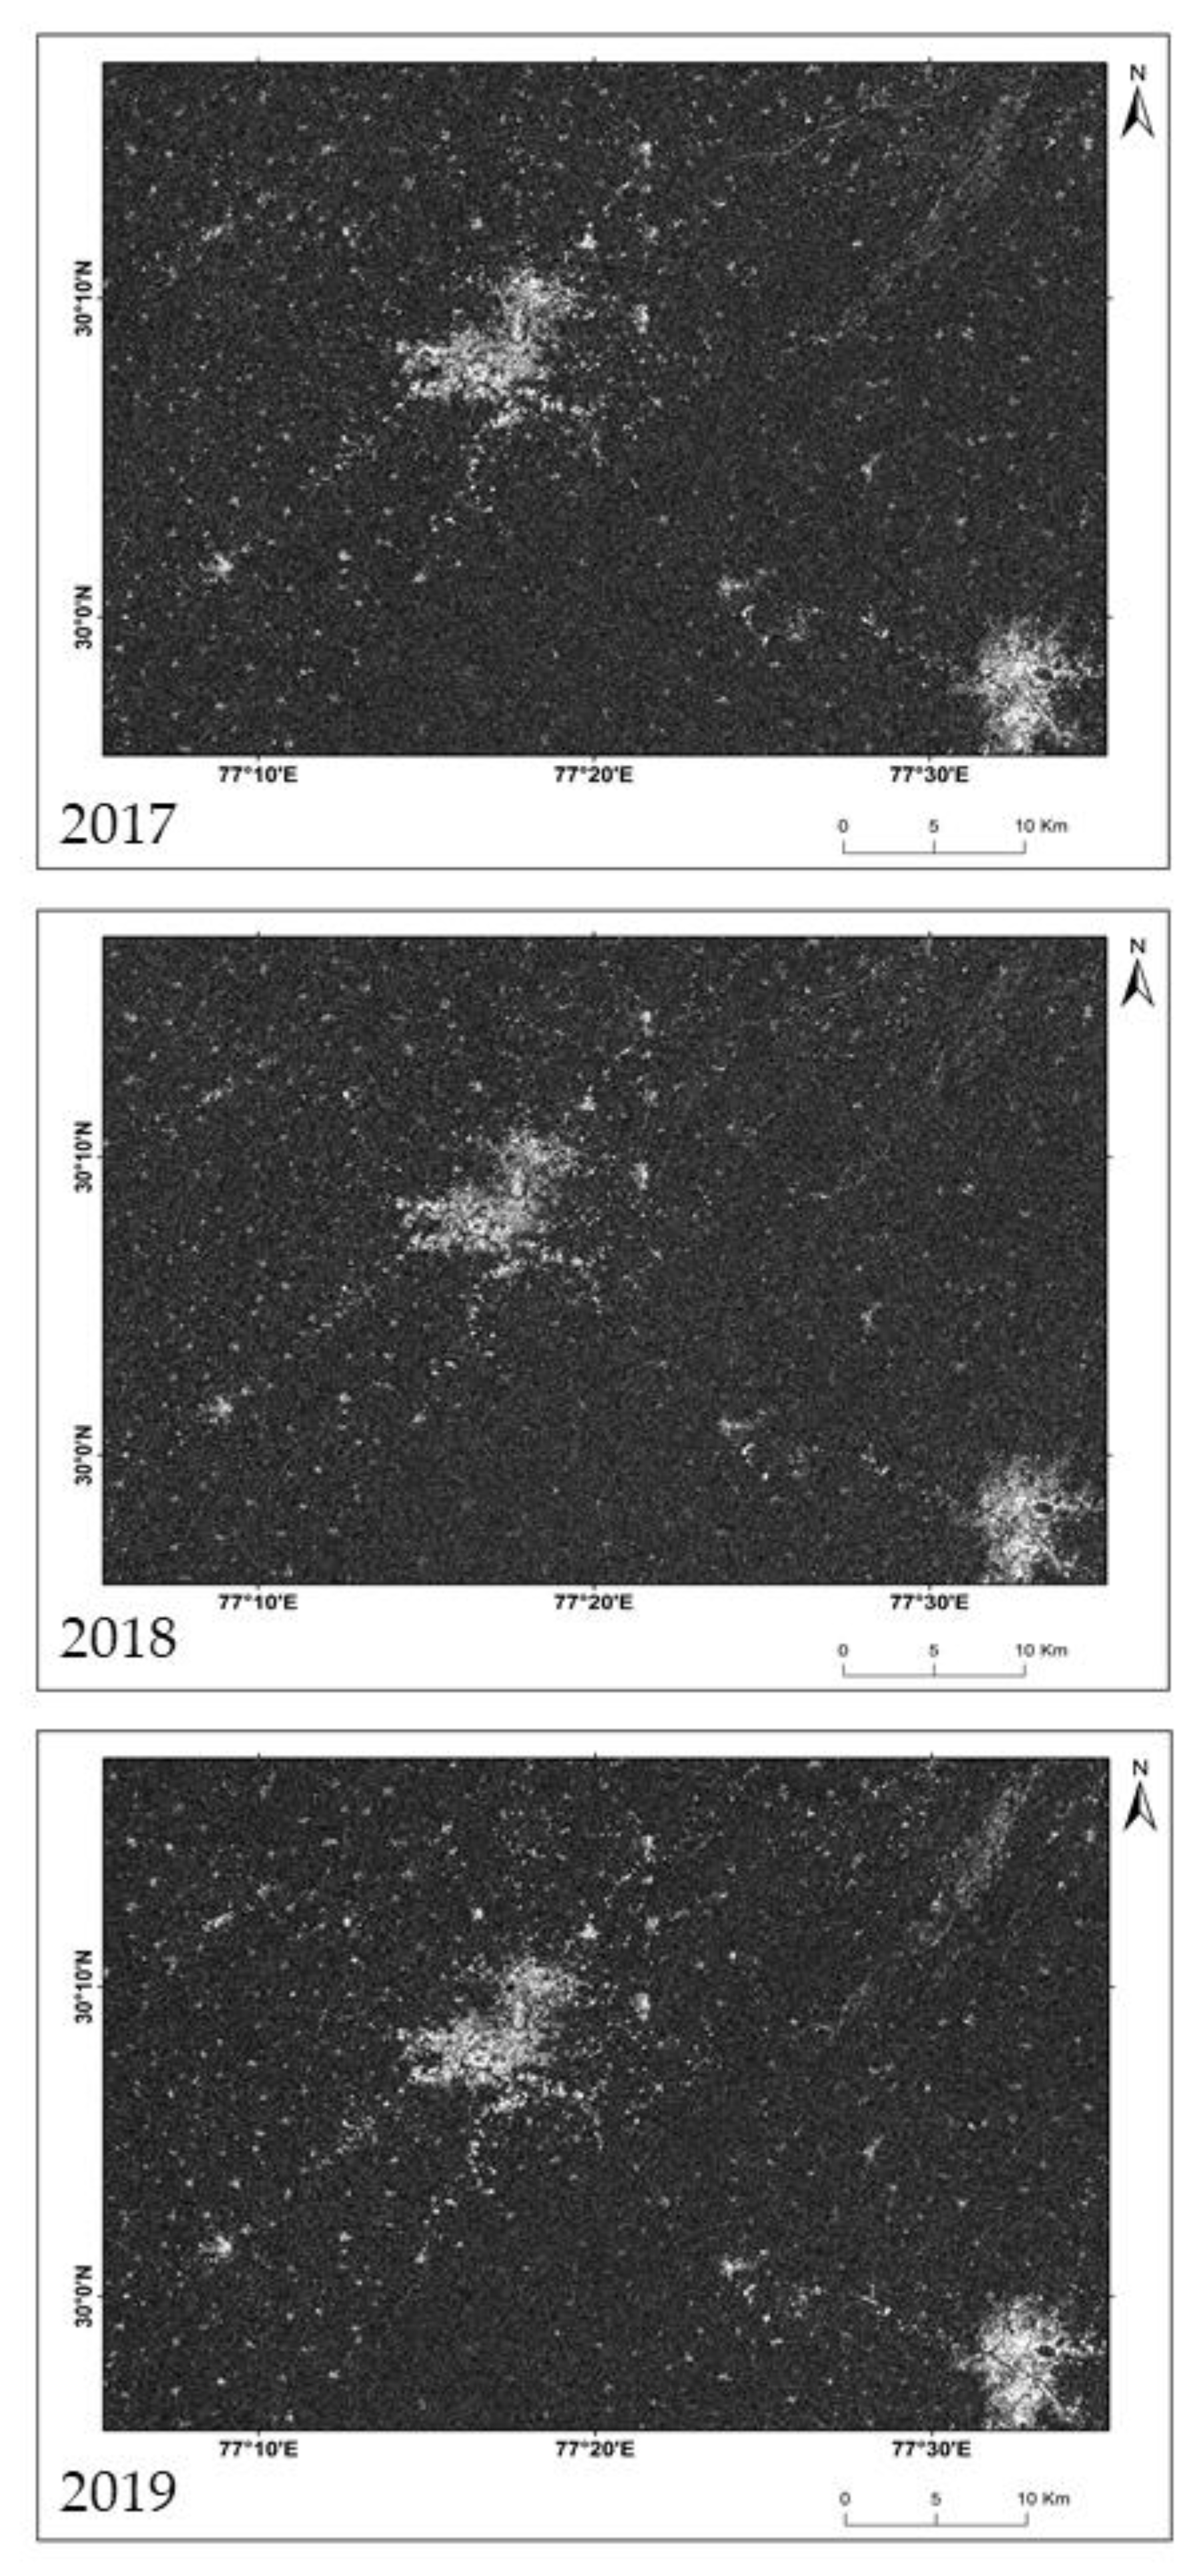
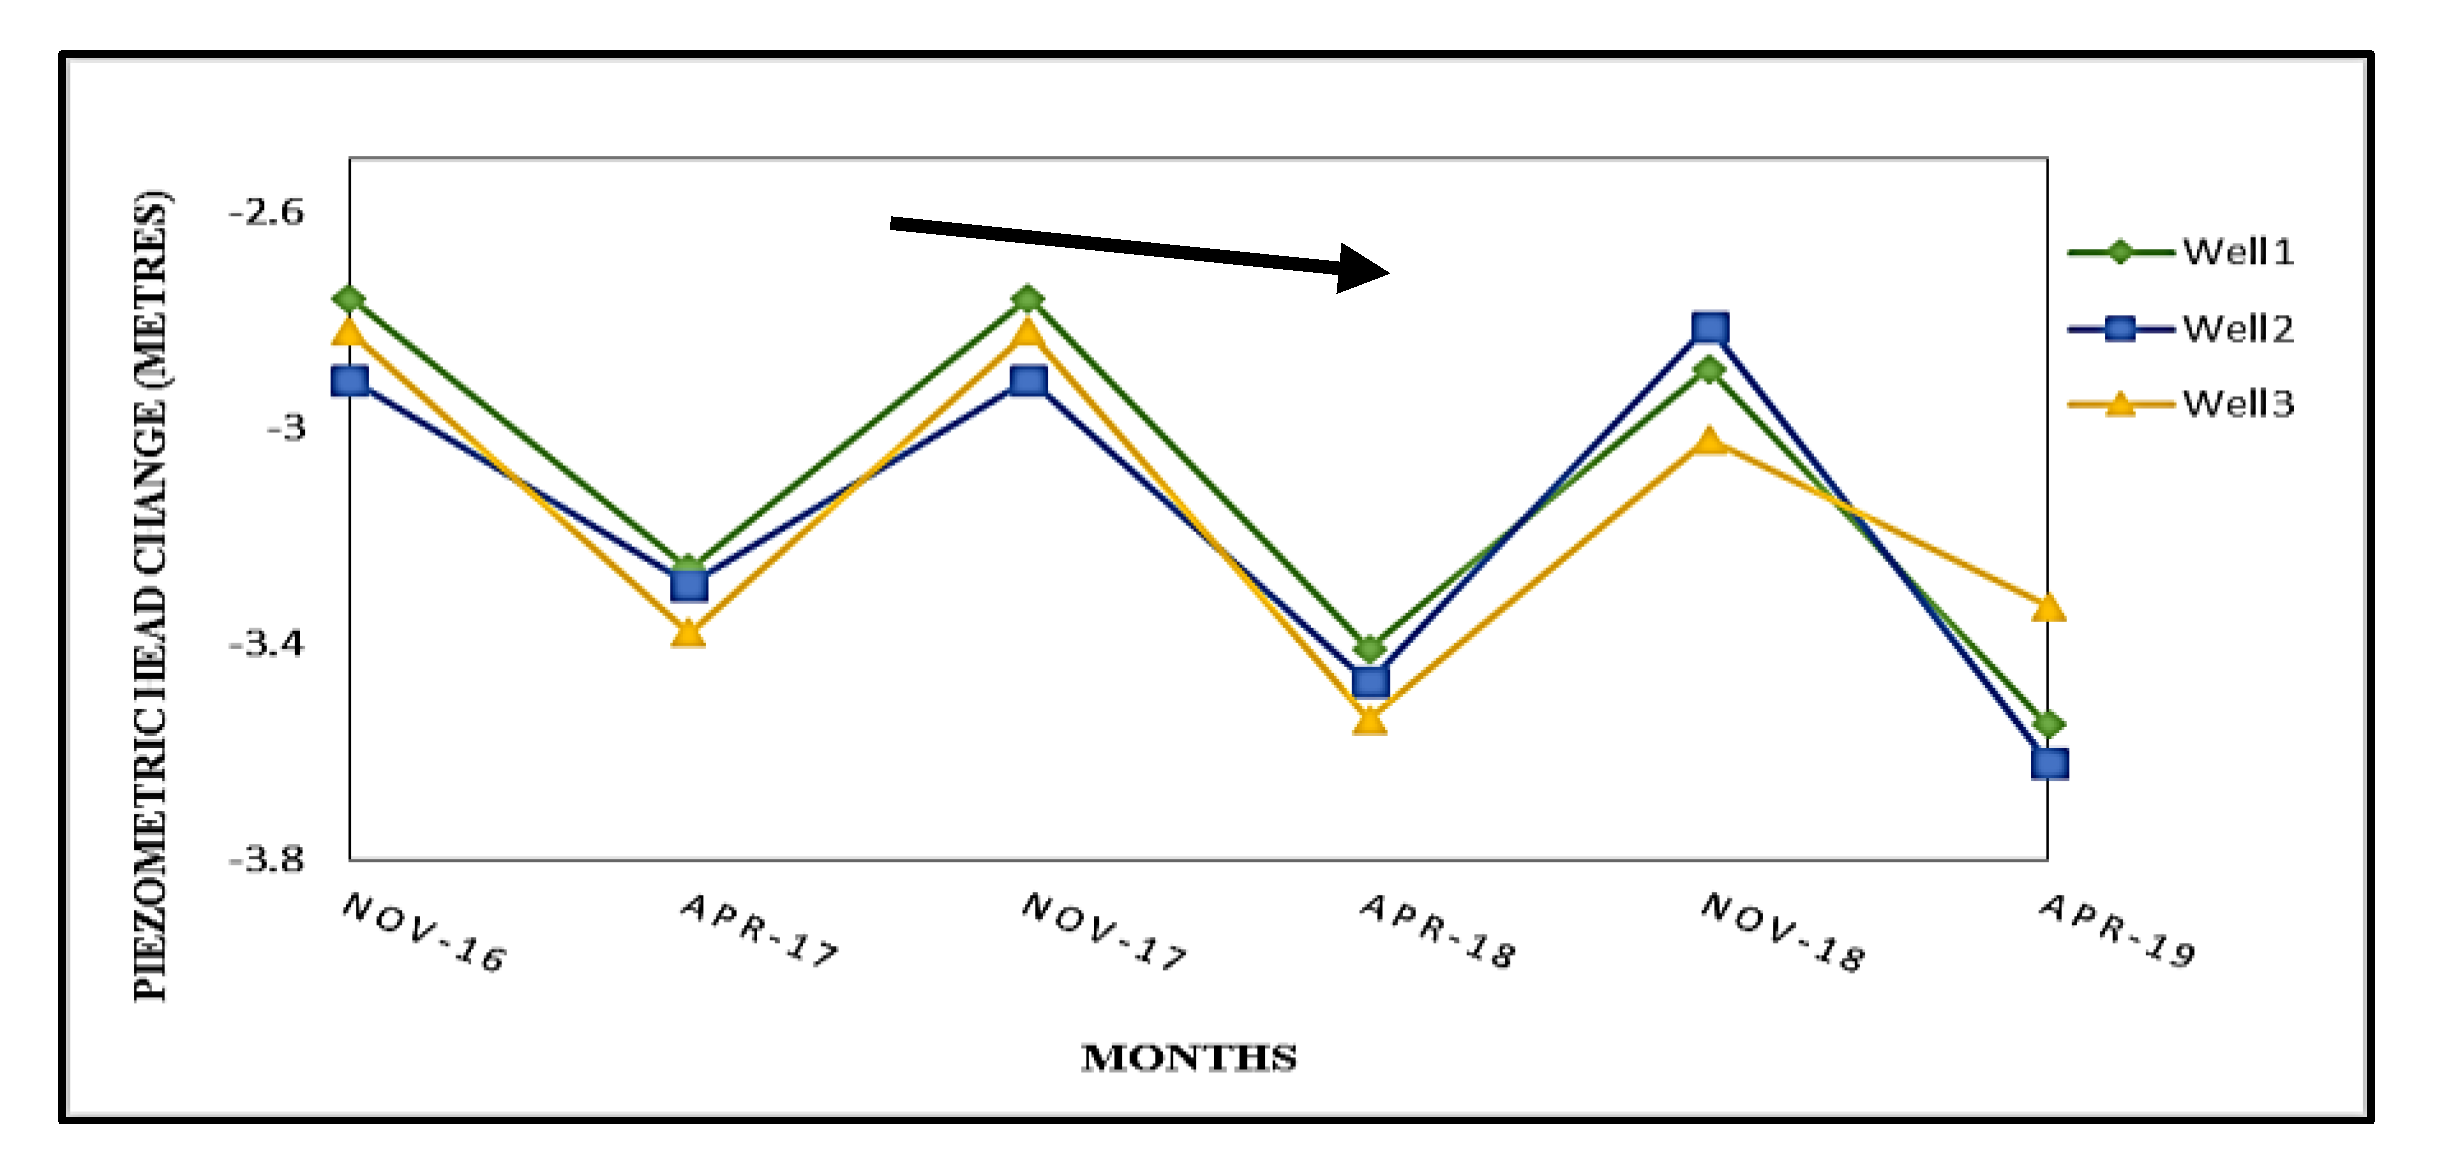
DInSAR technique with three pair of Sentinel 1A images of the years 2017–19 was used to study the temporal and spatial evolution of land subsidence in the study region of Jagadhri city area. Using these three pairs of SENTINEL 1A data for 2017–19, the generated D-InSAR interferograms are shown in Figure 4 for 2017–19, while the mean coherence obtained for these three D-InSAR pairs are 0.36, 0.41, and 0.39 respectively (Figure 5). The specular pattern of deformation fringes is observed at the central part of the city area centered at 30°08′N, 77°18′E. The consistency of this fringes during three consecutive years shows that the subsidence in this area is not any sudden activity, it is a result of regular exploitation for human resources. Not only that, it also indicates that the fringes are not because of atmospheric noise. The pattern of fringe is found to be almost similar for each year. The areal extent of the fringe is around 25 sq.km. and slightly more stretched in south-west to north-east direction by 10.75 km. The displacement from the fringes and subsequent observation from DGPS survey method is tabulated in Table 2 which shows that the mean displacement in the fringe area during 2017–19 estimated by D-InSAR method was 4.98 cm, while the mean displacement over a selected location (30°11′N, 77°27′E) at the city area during the same years acquired by DGPS survey was 4.44 cm. Therefore, the estimation carried by the relative error of overestimating by the magnitude of 0.56, 0.67, and 0.39 cm during 2017–19, respectively. Another specular feature has been pointed out from the coherence images that the areas with the footprint of deformation are spreading out away from the city center area radially which signifies that the settlements situated along the roadside are most responsible for excessive exploitation of groundwater, thus facing the threat of subsidence. Therefore, this settlement area is surely endangered for unexpected destructions in the near future. The displacement rate was noticed to be higher during 2019 than 2017 but a little lesser than 2018. Hence, more consecutive investigation might get a more accurate trend of change in displacement rate. The lithology data shows a thick and alternative layer of clay underneath the area. The upper fine-textured soil leads to a slow rate of liquefaction of water hence the rate of percolation followed by the rate of groundwater recharge will be very slow in such region. On the other hand, the underneath alternative layer of brownish clay with grained sand material is prone to be suppressed and hence the extraction of groundwater at a higher rate than recharge can be able to create a vacuum which may lead to local subsidence. The piezometric data from three different wells during November and April also show a subsequent decrease in the water level in the wells (Figure 6). It was purposefully collected during November and April to get the scenario of extraction of water from the wells during non-monsoon months. Observation shows that the average depth of water table during November was 2.86 m and during April it was 3.43 m., the decrease in water level in April was 1.2 times than November. Hence, it is well supported by the incidence of over-exploitation of groundwater in the city area.

Figure 4.
Interferograms generated during 2017–2019.

Figure 5.
Coherence images.
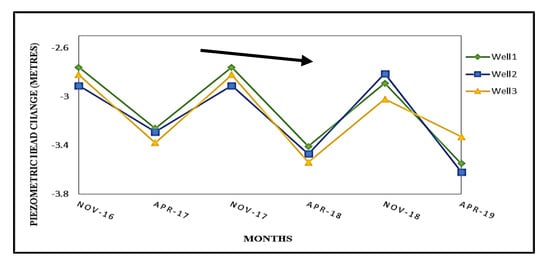
Figure 6.
Piezometric head change in wells located in and around the fringe.
4. Conclusions
Identifying the exact location of the land subsidence area in any city area is the foremost task before taking any action plan and making policy to execute. Sentinel 1A data was sufficiently able to solve this issue, however, longer temporal observation will be further beneficial to make any judgment on this aspect. Late winter and early half of pre-Monsoon season was the ideal time frame to avoid the atmospheric noise in a differential interferogram. Following the D-InSAR approach, the mean displacement rate was found 4.98 cm which is quite valid with respect to ground observation by DGPS survey. The piezometric data also indicate the decrement in the water table in the wells by 1.2 times in April with respect to November, hence, depict the occurrence of excessive extraction of groundwater. The radially centrifugal pattern of deformation through the coherence images also conclude about major responsibility of local residence in the settlement area of the city for over-exploitation. The rate of displacement found in this study should alarm the city corporation to take immediate action in order to prevent serious damage in social and human resources.
Author Contributions
For research articles with several authors, a short paragraph specifying their individual contributions must be provided. The following statements should be used “Conceptualization, Rajarshi Bhattacharjee and Udit Asopa; Methodology, Rajarshi Bhattacharjee; Software, Rajarshi Bhattacharjee; Validation, Rajarshi Bhattacharjee, Udit Asopa; Formal Analysis, Amitesh Gupta.; Investigation, Amitesh Gupta; Resources, Rajarshi Bhattacharjee; Data Curation, Udit Asopa; Writing-Original Draft Preparation, Amitesh Gupta.; Writing-Review & Editing, Amitesh Gupta.; Visualization, Rajarshi Bhattacharjee.
Funding
This research received no external funding.
Acknowledgments
Authors are thankful to Indian Institute of Remote Sensing for providing the necessary computational facilities and research requirements.
Conflicts of Interest
The authors declare no conflict of interest.
References
- Hu, B.; Zhou, J.; Wang, J.; Chen, Z.; Wang, D.; Xu, S. Risk assessment of land subsidence at Tianjin coastal area in China. Environ. Earth Sci. 2009, 59, 269–276. [Google Scholar] [CrossRef]
- Strozzi, T.; Wegmüller, U.; Tosi, L.; Bitelli, G.; Spreckels, V. Land subsidence monitoring with differential SAR interferometry. Photogramm. Eng. Remote Sens. 2001, 67, 1261–1270. [Google Scholar]
- Chatterjee, R.S.; Thapa, S.; Singh, K.B.; Varunakumar, G.; Raju, E.V.R. Detecting, mapping and monitoring of land subsidence in Jharia Coalfield, Jharkhand, India by spaceborne differential interferometric SAR, GPS and precision levelling techniques. J. Earth Syst. Sci. 2015, 124, 1359–1376. [Google Scholar] [CrossRef]
- Holzer, T.L.; Galloway, D.L. Impacts of land subsidence caused by withdrawal of underground fluids in the United States. Rev. Eng. Geol. 2005, 16, 87–99. [Google Scholar]
- Abidin, H.Z.; Djaja, R.; Andreas, H.; Gamal, M.; Hirose, K.; Maruyama, Y. Capabilities and constraints of geodetic techniques for monitoring land subsidence in the urban areas of Indonesia. Geomatics Res. Aust. 2004, 81, 45–58. [Google Scholar]
- Galloway, D.L.; Hudnut, K.W.; Ingebritsen, S.E.; Phillips, S.P.; Peltzer, G.; Rogez, F.; Rosen, P.A. Detection of aquifer system compaction and land subsidence using interferometric synthetic aperture radar, Antelope Valley, Mojave Desert, California. Water Resour. Res. 1998, 34, 2573–2585. [Google Scholar] [CrossRef]
- Mora, O.; Mallorqui, J.J.; Broquetas, A. Linear and nonlinear terrain deformation maps from a reduced set of interferometric SAR images. IEEE Trans. Geosci. Remote Sens. 2003, 41, 2243–2253. [Google Scholar] [CrossRef]
- Guoqing, Y.; Jingqin, M. D-InSAR Technique for Land Subsidence Monitoring. EARTH Sci. Front. 2008, 15, 239–243. [Google Scholar] [CrossRef]
- Hongdong, F.; Kazhong, D.; Chengyu, J.; Chuanguang, Z.; Jiqun, X. Land subsidence monitoring by D-InSAR technique. Min. Sci. Technol. 2011, 21, 869–872. [Google Scholar]
- Ghazifard, A.; Akbari, E.; Shirani, K.; Safaei, H. Evaluating land subsidence by field survey and D-InSAR technique in Damaneh City, Iran. J. Arid Land 2017, 9, 778–789. [Google Scholar] [CrossRef]
- Chatterjee, R.S.; Fruneau, B.; Rudant, J.P.; Roy, P.S.; Frison, P.L.; Lakhera, R.C.; Dadhwal, V.K.; Saha, R. Subsidence of Kolkata (Calcutta) City, India during the 1990s as observed from space by Differential Synthetic Aperture Radar Interferometry (D-InSAR) technique. Remote Sens. Environ. 2006, 102, 176–185. [Google Scholar] [CrossRef]
- Strozzi, T.; Wegmuller, U. Land subsidence in Mexico City mapped by ERS differential SAR interferometry. In Proceedings of the IEEE 1999 International Geoscience and Remote Sensing Symposium. IGARSS’99 (Cat. No.99CH36293); 1999; Volume 4, pp. 1940–1942. [Google Scholar]
- Sato, C.; Haga, M.; Nishino, J. Land subsidence and groundwater management in Tokyo. Int. Rev. Environ. Strateg. 2006, 6, 403–423. [Google Scholar]
- Ortega-Guerrer, A.; Rudolph, D.L.; Cherry, J.A. Analysis of long-term land subsidence near Mexico City: Field investigations and predictive modeling. Water Resour. Res. 1999, 35, 3327–3341. [Google Scholar] [CrossRef]
- Bankher, K.A.; Al-Harthi, A.A. Earth fissuring and land subsidence in Western Saudi Arabia. Nat. Hazards 1999, 20, 21–42. [Google Scholar] [CrossRef]
- Abidin, H.Z.; Andreas, H.; Gumilar, I.; Wibowo, I.R.R. On correlation between urban development, land subsidence and flooding phenomena in Jakarta. IAHS-AISH Proc. Rep. 2015, 370, 15–20. [Google Scholar] [CrossRef]
- Teatini, P.; Ferronato, M.; Gambolati, G.; Bertoni, W.; Gonella, M. A century of land subsidence in Ravenna, Italy. Environ. Geol. 2005, 47, 831–846. [Google Scholar] [CrossRef]
- Phien-wej, N.; Giao, P.H.; Nutalaya, P. Land subsidence in Bangkok, Thailand. Eng. Geol. 2006, 82, 187–201. [Google Scholar] [CrossRef]
- Hung, W.C.; Hwang, C.; Chen, Y.A.; Zhang, L.; Chen, K.H.; Wei, S.H.; Huang, D.R.; Lin, S.H. Land subsidence in Chiayi, Taiwan, from compaction well, leveling and ALOS/PALSAR: Aquaculture-induced relative sea level rise. Remote Sens. 2018, 10, 40. [Google Scholar] [CrossRef]
- Chen, B.; Gong, H.; Li, X.; Lei, K.; Zhu, L.; Gao, M.; Zhou, C. Characterization and causes of land subsidence in Beijing, China. Int. J. Remote Sens. 2016, 38, 808–826. [Google Scholar] [CrossRef]
- Malik, K.; Kumar, D.; Perissin, D. Assessment of subsidence in Delhi NCR due to groundwater depletion using TerraSAR-X and persistent scatterers interferometry. Imaging Sci. J. 2018, 67, 1–7. [Google Scholar] [CrossRef]
- Suganthi, S.; Elango, L.; Subramanian, S.K. Microwave D-InSAR technique for assessment of land subsidence in Kolkata city, India. Arab. J. Geosci. 2017, 10, 458. [Google Scholar] [CrossRef]
- Kim, J.; Lin, S.Y.; Singh, S.; Singh, T.; Tsai, Y.L.; Gupta, S.; Save, H. Surface deformations by ground water depletion over N. W. India: Local and global scale observations using InSAR and space geodesy and their geological implications. Geophys. Res. Abstr. 2018, 20, 17305. [Google Scholar]
- Kim, J.; Kim, D.-J.; Kim, S.-W.; Won, J.-S.; Moon, W.M. Monitoring of urban land surface subsidence using PSInSAR. Geosci. J. 2007, 11, 59–73. [Google Scholar] [CrossRef]
- Lachaise, M.; Bamler, R.; Gonzalez, F.R. Multibaseline Gradient Ambiguity Resolution to Support Minimum Cost Flow Phase Unwrapping. IEEE Int. Geosci. Remote Sens. Symp. 2010, 4411–4414. [Google Scholar]

Publisher’s Note: MDPI stays neutral with regard to jurisdictional claims in published maps and institutional affiliations. |
© 2019 by the authors. Licensee MDPI, Basel, Switzerland. This article is an open access article distributed under the terms and conditions of the Creative Commons Attribution (CC BY) license (https://creativecommons.org/licenses/by/4.0/).