Published: 23 September 2019
1. Introduction
Additive manufacturing (AM) is a relatively new technique wherein objects are gradually created based on the design of a computer model. In the case of powder bed fusion processes, a layer of powder is deposited and then fused with the underlying layer. This process is repeated layer by layer, and in this way the component is built. In particular, in most cases AM is used to build small and complex objects as a single piece. Today, plastics, ceramics and metals are already being produced with AM. However, the quality does not always live up to the requirements. Highly stressed components are only considered as safe if they have no defects or if any existing defects do not exceed a certain dimension. A variety of methods can be deployed to measure and ensure the accuracy and integrity of parts. Non-destructive testing (NDT) is commonly used to inspect parts for defects or irregularities. Fluorescent penetrant inspection (FPI) is one NDT method used for detecting surface anomalies like cracks being open to the surface. Given the layered nature of AM processes, internal cracks and microcracking cannot be detected with FPI. The volume of parts can be inspected non-destructively with ultrasonic, radiography and CT.
Alternatively, passive and active thermography can be applied. It could be a promising choice both for on-site control (passive thermography) and offline (active thermography) due to its versatility, costs and the time required for testing and analysis, which are remarkably competitive with other methods of NDT.
One of the most advanced technologies of metal AM is the Laser Powder Bed Fusion process (L-PBF), also known as Selective Laser Melting (SLM). In the following study, several components made of AISI 316L steel have been produced by means of the L-PBF technique, varying the process parameters at certain positions within the component in order to induce the presence of typical defects of different size, shape, thickness and depth. High and low energy settings of the laser were used to induce different types of porosity (keyhole and lack of fusion pores).
The test specimens were examined afterwards using pulsed and stepped thermography and the algorithms for post-processing analysis enabled the detection of the different defects [
1,
2,
3,
4].
2. Materials and Methods
Active thermography needs an external heat source to stimulate non-stationary heat diffusion inside the test object for inspection. Pulsed (PT) [
1,
2,
3,
4,
5,
6] and Stepped Thermography (ST) [
7,
8] are the techniques most used in literature and they differ in the technique used for heating the material. PT employs a short thermal stimulation to produce a thermal perturbation at the surface of the test object.
The presence of a defect can be revealed by monitoring the surface temperature decay of the specimen. In fact, the defect appears at the surface as an area of different temperature with respect to a reference sound area and it produces a different behaviour of the temperature decay curve. As known [
4], the presence of a defect at depth z changes the temperature decay at the surface T (z, t), whose analytical formulation is:
where
is the effusivity, α is the thermal diffusivity and
is the absorbed energy density. Here, the purely one-dimensional case, neglecting finite pulse duration effects and thermal losses, is considered. In the case of a Dirac pulse, the temperature trend is described by the Equation (1) and can be considered still valid also for finite short pulse duration. However, this equation is only valid in the case of very large defects in relation to defect depth and if the defect is filled with air.
The temperature decay process is generally not sufficient by itself to obtain information about the size and depth of defects, but a postprocessing is needed such as, for example, Thermal Signal Reconstruction TSR® [
5] and Slope and Square Correlation Coefficient R
2 [
1].
Unlike the pulsed approach, during the step heating (using an extended heating pulse duration), very often the thermal wave reaches the defect during the heating phase [
7]. If the sound area is more thermally diffusive than the defect, at the end of heating, the surface above the defect is warmer than the sound material, and exchanges heat by conduction and convection more quickly than the sound material. Similar to the pulsed approach, the difference in temperature reached during the heating and the following cooling behavior will depend on the different thermo-physical properties between defective and sound material as well as on the depth and type of defect.
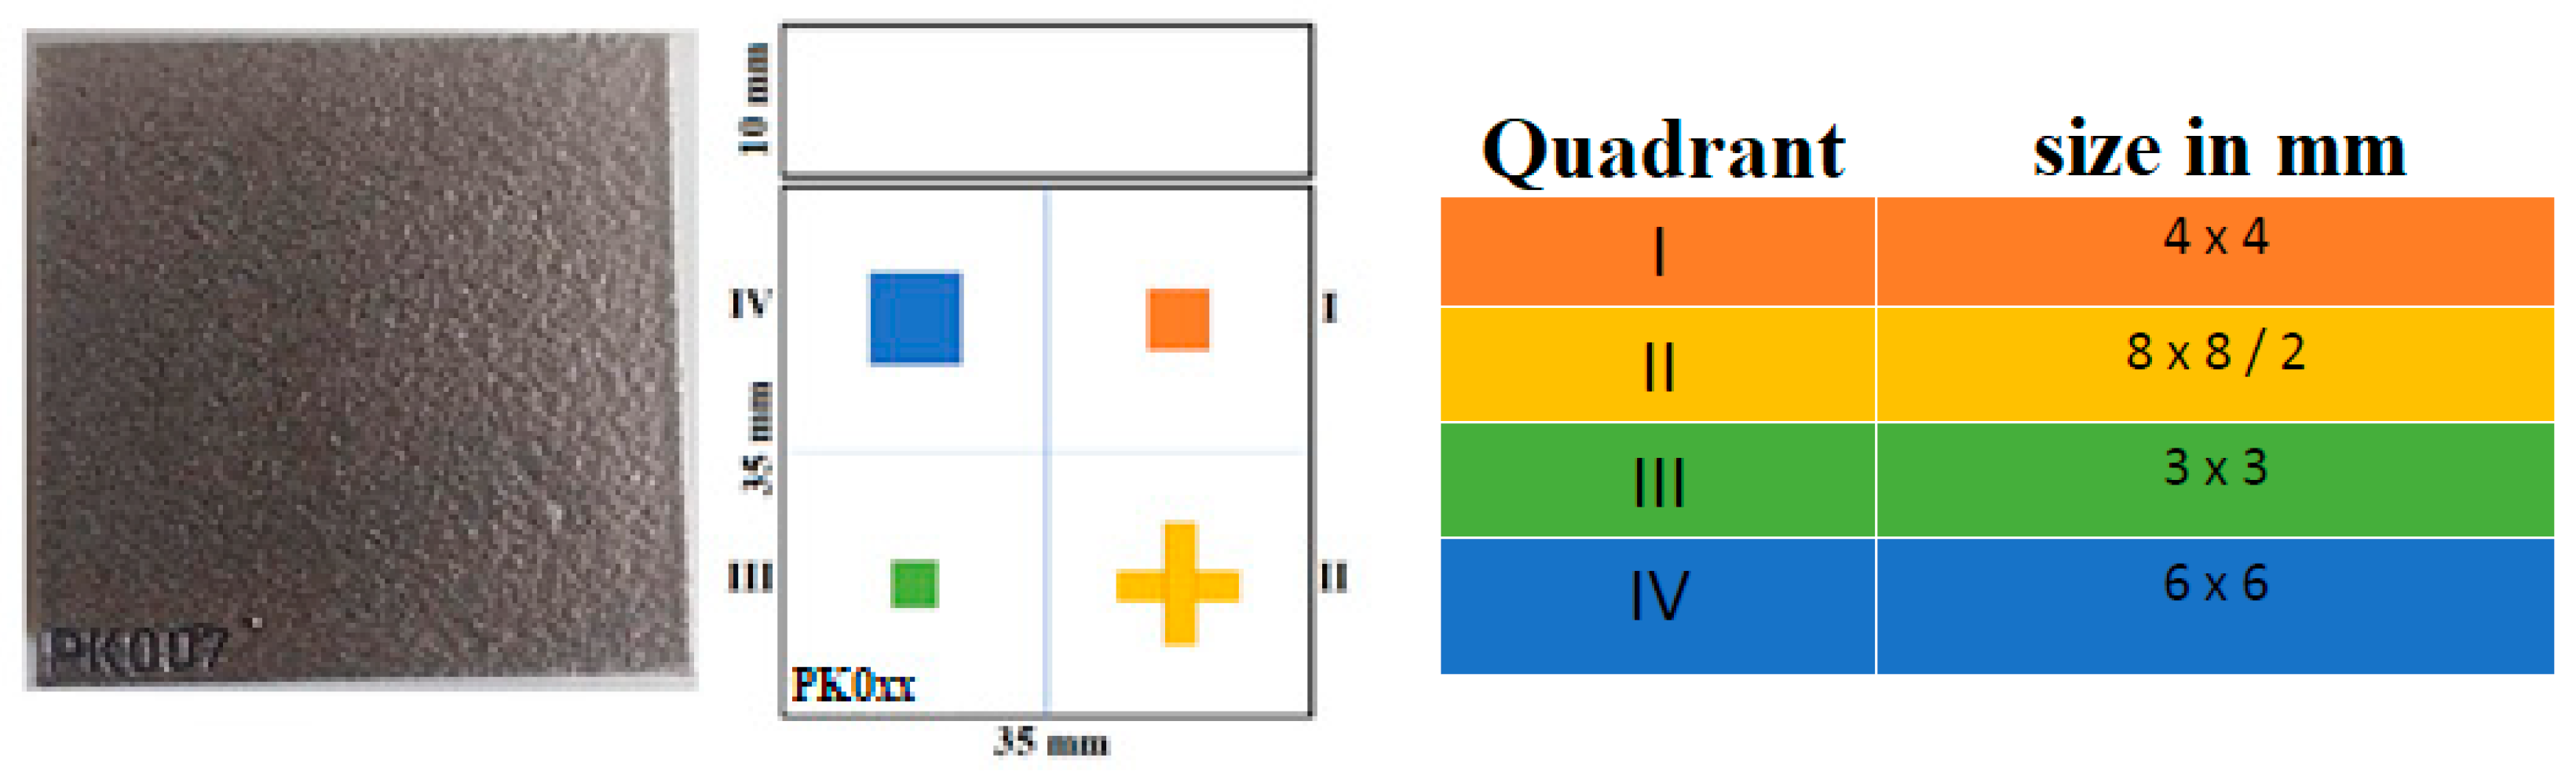
Several components made of AISI 316L steel (example depicted in
Figure 1) have been produced by means of the L-PBF technique, varying the process parameters.
The standard process parameters of the laser used to build this sample are a laser power of 275 W and a scanning speed of 700 mm/s. The different samples have different defects inside. There are some samples with buried regions with keyhole defects, produced by locally increased energy density during the build (275 W; 300 mm/s) and there are some other samples with lack of fusion defects, produced by locally decreased energy density during the build (150 W; 700 mm/s). The samples were produced with defects of different heights (height range 0.25 to 1 mm) and in different depths (depth range 0.1 to 0.4 mm). Thus, we used different possible combinations of thermographic tests and analysis, in order to identify the defects inside the samples, and to identify the best thermographic techniques and parameters to discern the different types of defects.
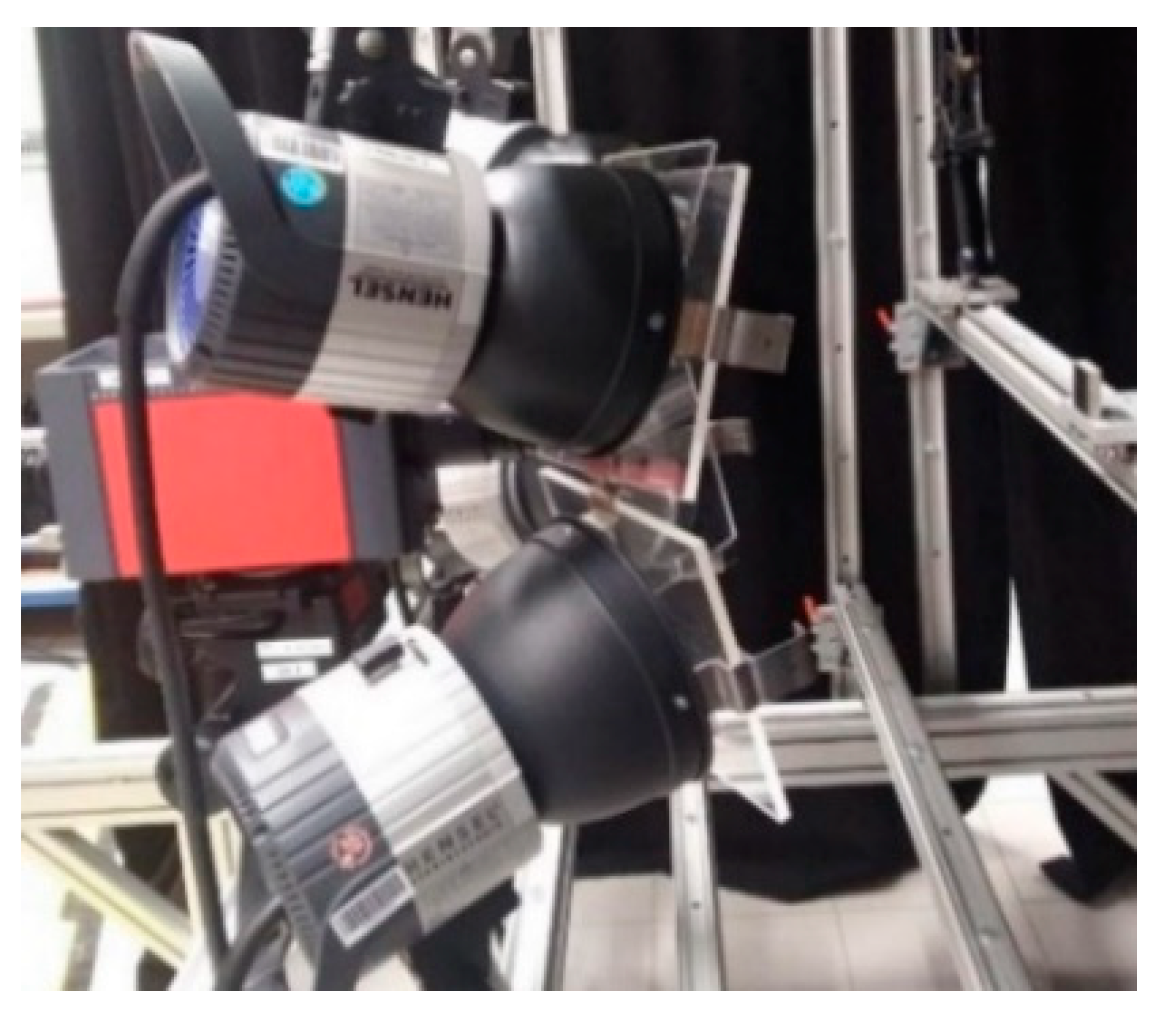
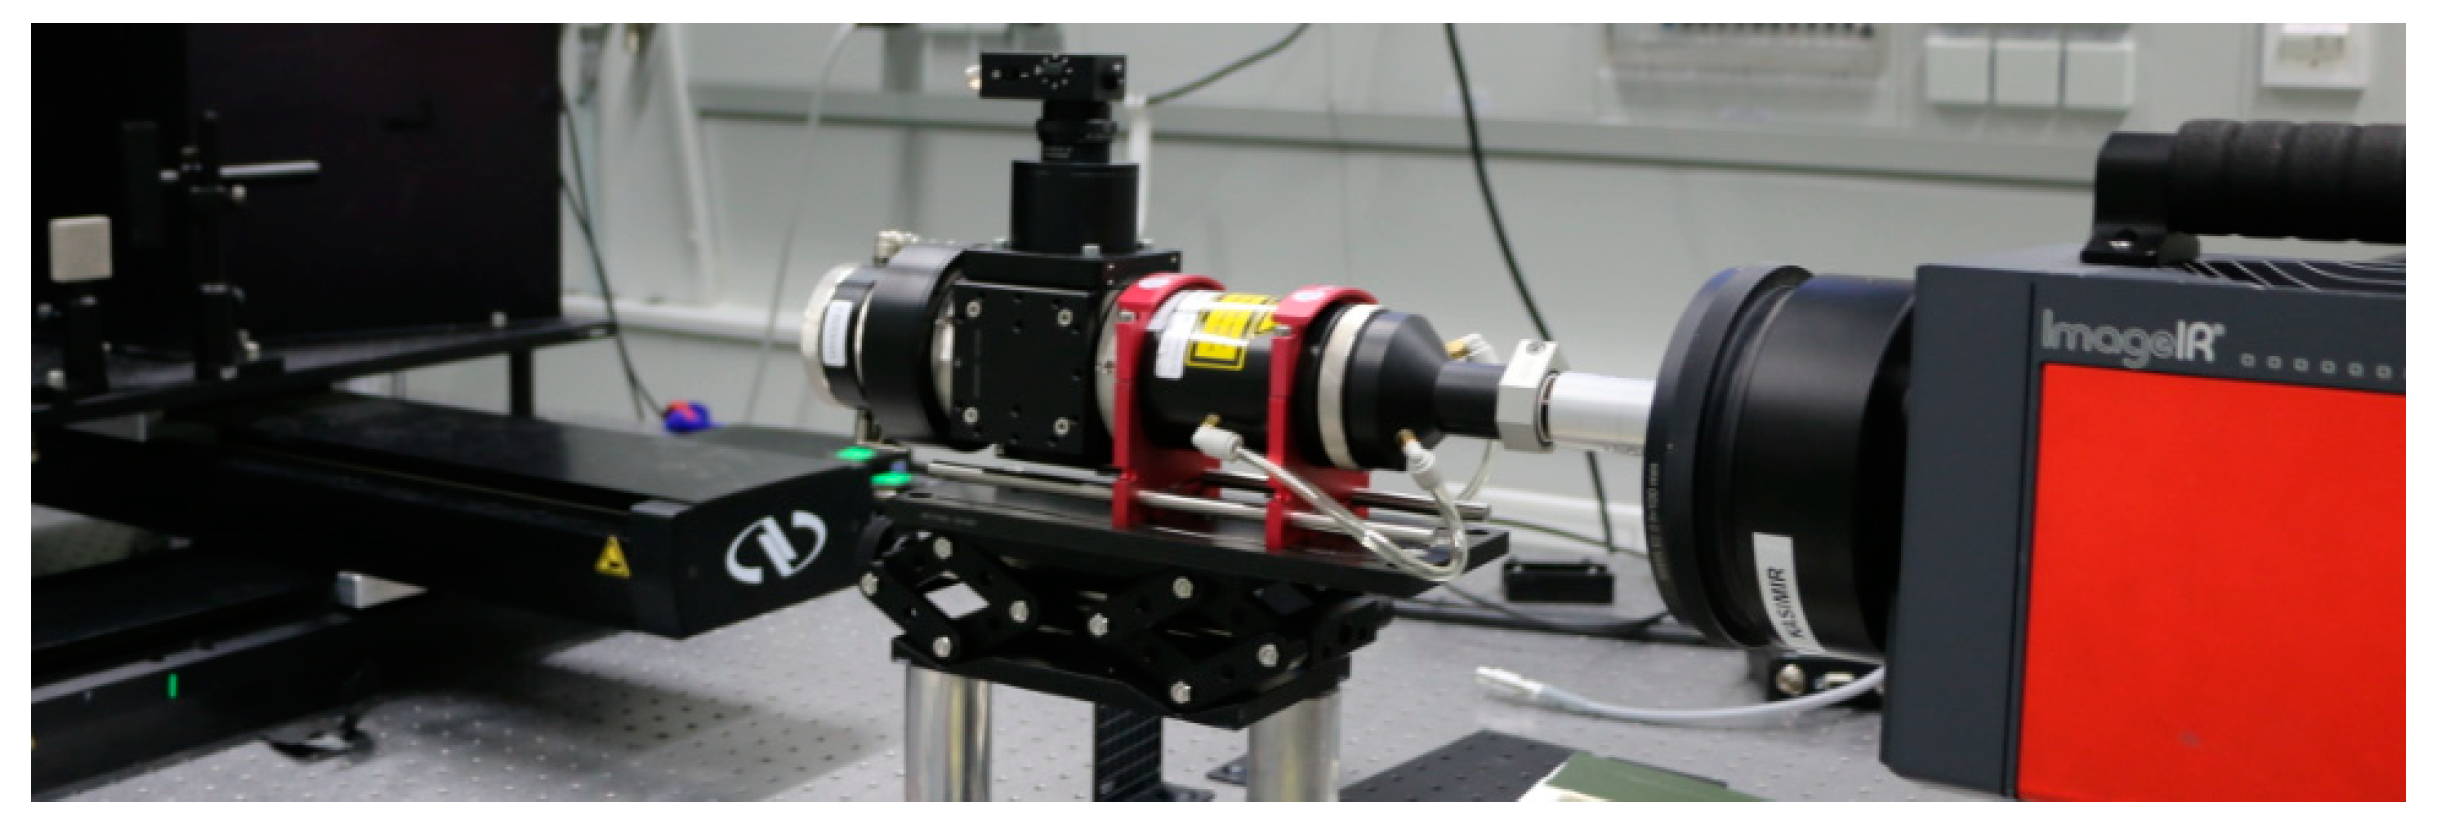
The experimental setups for both techniques (pulsed and stepped thermography) used to detect the defects inside these components are reported, respectively, in
Figure 1 and in
Figure 2. The main thermographic parameters and the principal distances are reported in
Table 1 and in
Table 2. The samples were coated with graphite before the experiments in order to increase the temperature rise.
3. Results
For brevity, the obtained results for only one sample, by comparing the two used thermographic techniques, are reported. In both cases, the cooling down is analysed by the application of different post processing algorithms (the TSR results in terms of 1
st and 2
nd derivative and slope and square correlation coefficient maps are obtained by using a generic MATLAB function routine to provide a polynomial fitting respectively of 5 and 1 degree). In order to compare the obtained maps, the signal background contrast (SBC) [
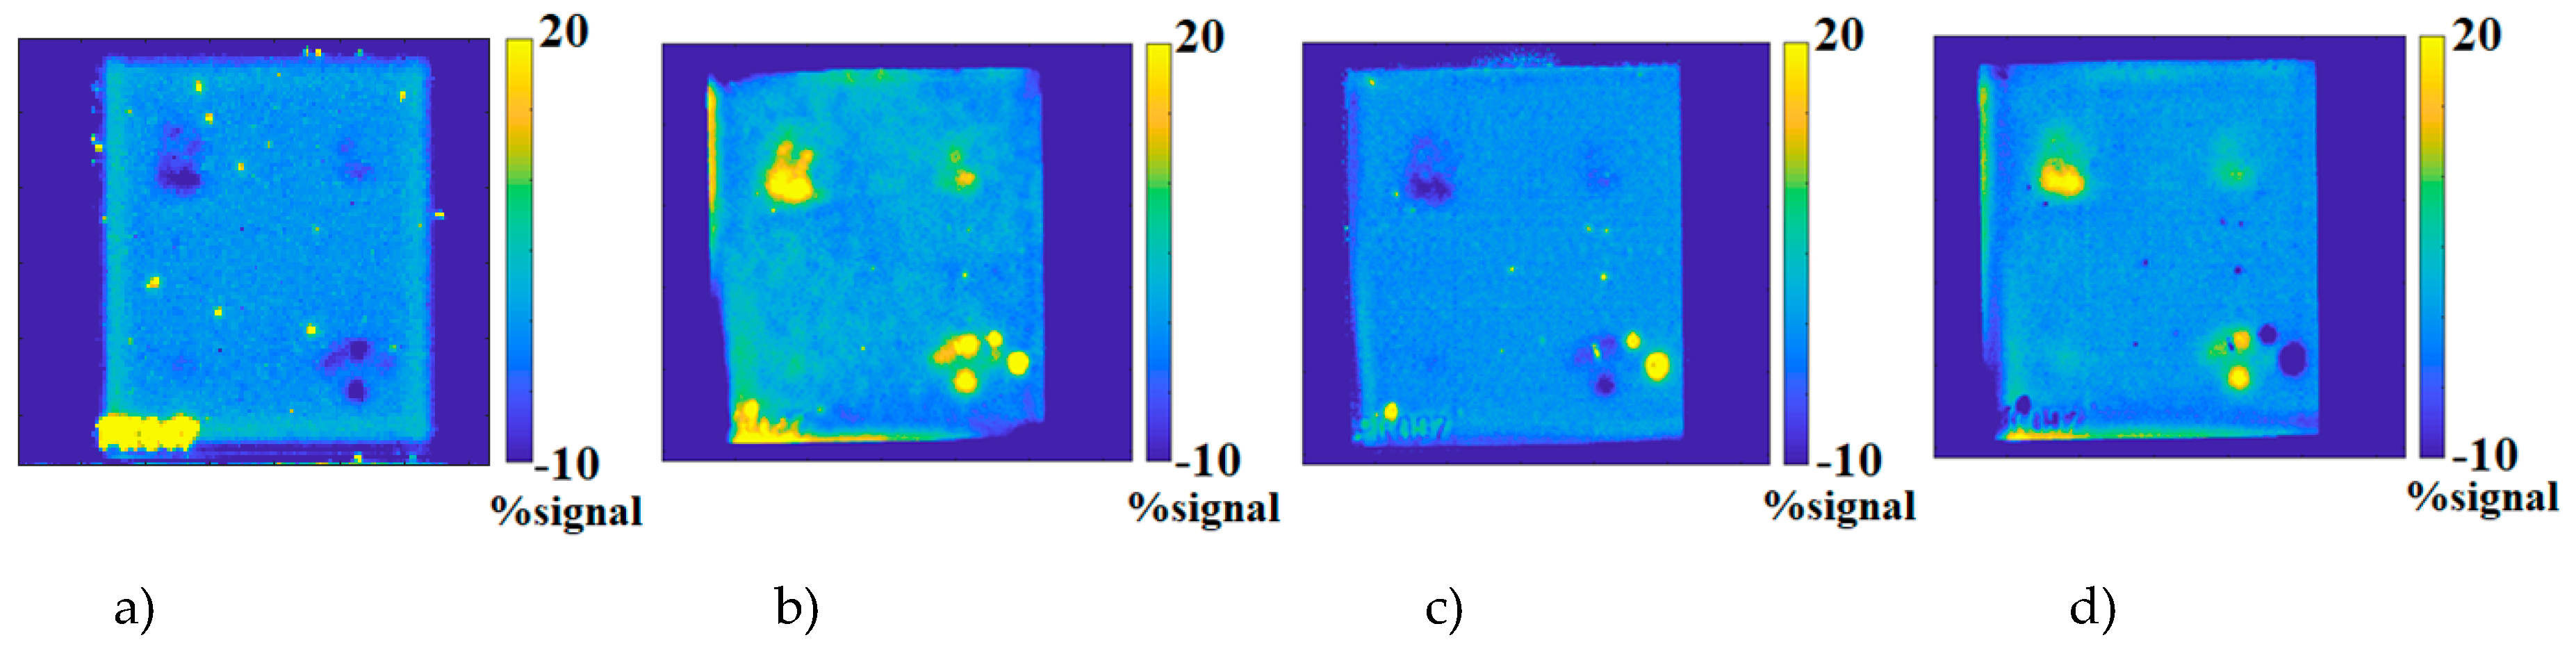
1] is computed pixel for pixel, by subtracting the mean of the central sound area and by dividing by the standard deviation of the same area. For brevity, only the best results are reported in both cases in
Figure 4. The analysis was computed by choosing different truncation window sizes [
1] and by analyzing the influence of this choice on the achieved SBC. It is necessary to highlighted that the points and regions with very high values (excluding the induced defects) are due to the very reflective surface own of the basic material.
3. Conclusions
In this work, a first approach to use thermographic techniques with the aim of detecting the defects produced intentionally by the L-PBF process is shown. It is a comparison of two different thermographic techniques and post-processing algorithms of analysis. The SBC obtained by using a laser source turns out to be higher than that achieved by heating with flash lamps. A frequency of 500 Hz was enough to detect the defects created by the increased energy density. It is necessary to improve the high spatial resolution as much as possible to see this type of defect; for this reason, the results reached with stepped thermography in terms of SBC are better than the pulsed one.


