Abstract
Nondestructive inspection (NDI) has immensely contributed to the restoration of historic and artistic works. As one of the most common used NDI methods, active thermography is an easy-to-operate and efficient technique. Principal component thermography (PCT) has been widely used to deal with thermographic data for enhancing the visibility of subsurface defects. Unlike PCT, edge-group sparse PCT introduced herein enforces sparsity of principal component (PC) loadings by considering the spatial connectivity of thermographic image pixels. The feasibility and effectiveness of this method is illustrated by the experimental results of the defect characterization in an ancient marquetry sample with a fir wood support.
Published: 27 September 2019
1. Introduction
In the restoration of historic and artistic works, nondestructive inspection (NDI) can help us with a good understanding of the state of antiques or finding the invisible details. As one of the commonly used NDI methods, active thermography is an imaging procedure [1], which is based on the analysis of heat flow induced by an energetic excitation of a test object. The resulting heat flow is influenced by interior material layers and defects. As a result, the inhomogeneity caused by defects can be captured on the object surface by infrared cameras.
Active thermography has the characteristics of detection in large areas, recording in real time, and being easy to operate. Despite these advantages, objects can become indistinguishable in the thermal images because of the existence of inhomogeneous backgrounds. To solve this problem, plenty of thermographic data analysis methods have been developed. Among them, principal component thermography (PCT) [2] is widely recommended.
PCT can capture the linear relationship between pixels and extracts the latent patterns of thermographic data with loading images. However, the non-sparsity of PCT loadings (called empirical orthogonal functions in the original paper [2]) often leads to results that are difficult to interpret. Motivated by the fact that defects always behave as spatially connected pixel groups in the thermal images, an edge-group sparse PCT (ESPCT) method is utilized for thermographic data analysis to reveal the defects in an ancient marquetry sample. Inspired by the research in bioinformatics [3], ESPCT considers the spatial connectivity among pixels and imposes sparsity on the loadings. By doing this, the defects can be revealed more clearly.
2. Methodology
As shown in Figure 1, the thermographic data set recorded in an experiment can be viewed as a three-dimensional matrix with a size of , where x y represents the number of pixels contained in each thermal image and n denotes the number of frames collected during the process of heating and cooling. Before conducting ESPCT, each frame is unfolded to a column vector. Without loss of generality, it is assumed that the unfolded thermographic data matrix has been centered.
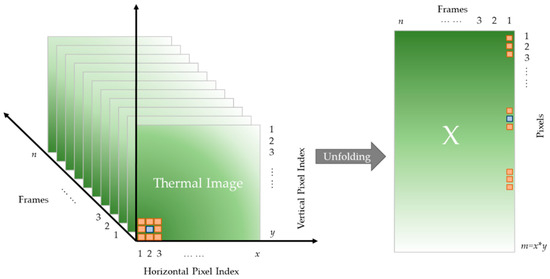
Figure 1.
Structure of thermographic data.
The optimization problem of extracting the first principal component (PC) is formulated as:
where is the first loading vector of dimension 1, is the first PC of dimension 1, and denotes the norm. represents a group structure, which is an edge set denoting the connectivity among pixels. For thermographic data analysis, each pixel connects only to its eight nearest neighbors. In Fig. 1, the nearest neighbors of the pixel in blue are illustrated as the orange points. is a subset of . is a vertex (pixel) set induced from the edge set . denotes the number of elements of . Support() denotes the set of indices of the nonzero elements in . is an edge-group sparse penalty (ES-penalty) leading to a sparse loading vector whose nonzero elements are determined based on some important edges in , where the importance of each edge is quantified with the weight () on it. Here, i and j are the indices of pixels, .
where is the i-th element in the vector . is an adjusting parameter that controls the number of selected edges, which in turn controls the sparsity of the loading vector. The above-mentioned optimization problem can be solved by applying a greedy strategy until convergence. After obtaining the first PC and loading pair, the following components can be calculated sequentially. More details of the learning algorithms can be found in the literature [3].
To visualize the defects, each loading vector can be reshaped to a two-dimensional matrix of size . Accordingly, loading images are produced for visual analysis.
3. Ancient Marquetry Sample
This ancient sample (Figure 2) is composed of three parts. The deepest layer is the support made of fir wood, in the middle part there is the animal glue, while the upper layer is the decorative layer made with multiple materials such as pearl (white tesserae), a horn of bovine horn (some brown/black tesserae), boxwood, among others. In the left subplot of Figure 2, seven defects are labeled.
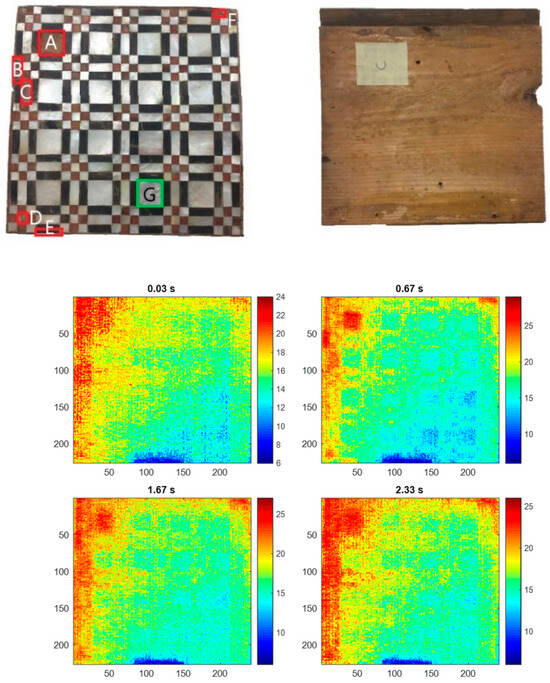
Figure 2.
(top) ancient marquetry sample, (middle) back of the sample, and (bottom) raw thermal images collected at the 0.03, 0.67, 1.67, and 2.33 s during the heating and cooling process.
4. Experimental Results
The authors applied ESPCT to the thermographic data of the ancient marquetry and compared the result with PCT. The experimental setup is shown in Figure 3. The sample was heated by two flashes (FORCE) which delivered a thermal pulse of energy 2560 J within 3 ms. The thermal images were photographed with an infrared camera (TAS-G100EXD, NEC) whose resolution is 320 240 pixels and sampling rate is 30 frames per second.
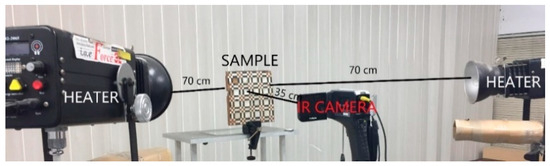
Figure 3.
Experimental setup.
The region of interest is 226241 pixels. As shown in Figure 2, identifying the defects from the raw thermal images is difficult because of the effect of inhomogeneous background. After unfolding, the size of the thermographic data matrix is 54,466 70. The analysis results, that is, the loading images, of both PCT and ESPCT are shown in Figure 4. In the ESPCT analysis, k was selected to be 2800, which was specified according to the estimated size of the defective regions. PCT discovers the missing tesserae on the left (A, B, C, D, and E), whereas the other defects (F and G), i.e., the detachments, are not clearly detected because of their depths. The loading image corresponding to PC2 extracts most of the defect features, whereas other loadings also contain some relevant information. Such information dispersion is not desired. Meanwhile, the background patterns retained in the loading images are also unfavorable for defect identification. ESPCT provides much clearer results, in that all defects of missing white tesserae and the detachment F are well detected by the loading corresponding to PC1, while the detachment G is discovered by PC3. Other loading images, such as PC2 and PC4, contain only noises. Moreover, according to the signal-to-noise ratio (SNR) [4] presented in Table 1, ESPCT demonstrates much a better SNR for every defect.

Table 1.
SNR values of PCT and ESPCT.
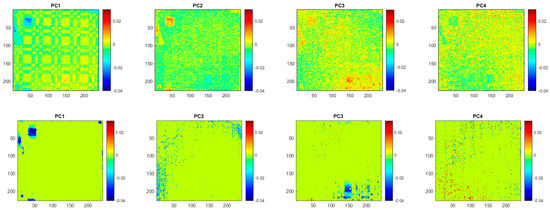
Figure 4.
PCT (upper) and ESPCT (lower) loading images corresponding to PC1-PC4.
5. Conclusions
In this study, a novel thermographic data analysis method, named ESPCT, is adopted for defect detection in an ancient marquetry sample. Not only the missing tesserae but also the invisible detachments are successfully identified. Compared with PCT, ESPCT shows better performance in terms of feature extraction by incorporating spatial connection information and sparsity.
Author Contributions
Conceptualization, Y.Y. and S.S.; methodology, Y.Y. and C.-M.W.; software, C.-M.W.; validation, Y.Y.; Y.Y. and formal analysis, C.-M.W.; investigation, C.-M.W.; resources, Y.Y., S.S., and G.G.; data curation, Y.Y., S.S., and G.G.; writing—original draft preparation, C.-M.W.; writing—Y.Y. and S.S.; visualization, Y.Y. and C.-M.W.; supervision, Y.Y.; project administration, Y.Y.; funding acquisition, Y.Y.
Funding
This research was funded by Ministry of Science and Technology, ROC under grant number MOST 108-2622-8-007-016.
Conflicts of Interest
The authors declare no conflict of interest. The funders had no role in the design of the study; in the collection, analyses, or interpretation of data; in the writing of the manuscript, or in the decision to publish the results.
References
- Yao, Y.; Sfarra, S.; Lagüela, S.; Ibarra-Castanedo, C.; Wu, J.-Y.; Maldague, X.P.V.; Ambrosini, D. Active thermography testing and data analysis for the state of conservation of panel paintings. Int. J. Therm. Sci., 2018, 126, 143–151. [Google Scholar] [CrossRef]
- Rajic, N. Principal component thermography for flaw contrast enhancement and flaw depth characterisation in composite structures. Compos. Struct. 2002, 58, 521–528. [Google Scholar] [CrossRef]
- Min, W.; Liu, J.; Zhang, S. Edge-group sparse PCA for network-guided high dimensional data analysis. Bioinformatics 2018, 34, 3479–3487. [Google Scholar] [CrossRef] [PubMed]
- Ibarra-Castanedo, C.; Piau, J.-M.; Guilbert, S.; Avdelidis, N.P.; Genest, M.; Bendada, A.; Maldague, X.P.V. Comparative study of active thermography techniques for the nondestructive evaluation of honeycomb structures. Res. Nondestruct. Eval. 2009, 20, 1–31. [Google Scholar] [CrossRef]
© 2019 by the authors. Licensee MDPI, Basel, Switzerland. This article is an open access article distributed under the terms and conditions of the Creative Commons Attribution (CC BY) license (https://creativecommons.org/licenses/by/4.0/).