Proceeding Paper

A Sensing Architecture Based on Head-Worn Inertial Sensors to Study Drivers’ Visual Patterns †

by
Josué S. Armenta
,
Marcela D. Rodríguez
* and
Angel G. Andrade
Computer Engineering, Faculty of Engineering, Universidad Autónoma de Baja California, UABC, C.P. 21100 Mexicali, Mexico
*
Author to whom correspondence should be addressed.
Presented at the 13th International Conference on Ubiquitous Computing and Ambient Intelligence UCAmI 2019, Toledo, Spain, 2–5 December 2019.
Proceedings 2019, 31(1), 34; https://doi.org/10.3390/proceedings2019031034
Published: 20 November 2019

Abstract

:
Most studies on driving behaviors use video-cameras and simulators. It involves human observers to code the video data to be later analyzed, which can be a demanding task. We propose a sensing architecture to conduct studies on driving behaviors under naturalistic conditions. It includes smart glasses and a classifier algorithm to infer the vehicle’s cockpit’s spot drawing drivers’ visual attention. Thus, our architecture facilitates annotating the collected datasets with codes corresponding to classes of the cockpit’s spots. We have collected data with the sensing architecture from 15 young drivers to study how glances duration and frequency to cockpit’s spots are correlated with driving speed. Our results suggest that the incidence of drivers’ glances at all spots is less on high-speed roads than in low-speed roads. And that even though participants limited their interaction with the audio system, this is the spot that most eye fixation demanded to interact with.

1. Introduction

Several studies have been conducted to discover how attentional factors affect driving behaviors. For instance, how attention deterioration of older adults may underlie crashes in various driving dangerous situations [1], or how multitasking affects the young and old persons’ gaze towards the road [2]. In studies such as the mentioned-above, video-cameras, and driving simulators have been mainly used to collect data. These techniques involved human observers in coding the video data to be later analyzed. Coding can be a demanding task that may require the involvement of more than one observer either to reduce the time spent on this task or to reduce errors. Based on our literature review, we identified the lack of sensing architectures that facilitate collecting data in naturalistic driving conditions. The general objective of this project is to develop a sensing architecture that can be used to study driving behaviors based on variables associated with the drivers’ visual focus of attention. To this end, our architecture determines the driver’s head pose and the driving context, such as driving speed. It has been shown that the head pose is a good predictor of driver intent and a good proxy for estimating eye gaze [3]. The proposed sensing architecture includes smart glasses as the primary sensing component and a classifier algorithm that infers the visual focus of attention (VFoA). Specifically, the inertial sensors of the smart glasses are used to detect the pitch and roll of drivers’ heads, which are inputted to the k-nearest neighbor (k-NN) classifier algorithm. It infers if the driver’s attention is on the road or in specific spots of the vehicle’s cockpit, such as the dashboard, radio, and central mirror.
This paper presents preliminary results of the development of our sensing architecture that we have already used to conduct a study. We have already conducted a study using the architecture, which had the aim to examine how young adults’ glance duration and frequency to the road and cockpit’s spots are correlated with driving speed. We identified that the architecture is useful to determine drivers’ attentional patterns, and also opportunities for improving it.
In the next section, we present the related work that motivated us to propose the sensing architecture. Section 3 presents the scope of our project. Section 4 describes the components of the sensing architecture. Section 5 explains the procedure followed for conducting the sensing study. Section 6 describes the study results. Finally, Section 7 presents conclusions and future work.

2. Related Work

2.1. Studies on Driving Behavior

Several studies have been conducted to study how several attentional factors affect driving performance and behaviors. Most of the studies analyzed the head and eye dynamics of the driver through the use of cameras. Thus, it was identified that searching head movements and speeding behavior at intersections affect more the driving performance of elderly drivers than younger ones [4]. Wikman and Summala found that the elderly spend a longer total time looking at the in-car display and that they travel a longer distance with eyes away from the road than young drivers [5].
Other studies have used eye trackers to video-record the place where the user is focusing their attention. For example, Kim et al. analyzed the visual scanning time on intersections spent by young and older adults. The younger group was more confident when driving since they passed the intersections faster than the older group [6]. Fancello et al. analyzed the visual perception of young drivers and elderly drivers while they went through a roundabout. The older group concentrated only on traffic arriving from the right arm of the roundabout and the vehicle in front [7]. It has also been identified that elderly drivers are less successful in recognizing on-road visual signs than middle-age drivers [8]. Finally, eye fixations have been studied to determine how they are correlated with collisions [9,10]. It has been found that older adults tend to have longer visual fixation duration and more visual fixation counts than younger drivers, but with no difference in the number of collisions [9]. Moreover, a better executive function is related to more frequent eye fixations on the road and inside vehicle features [10].
Thus, in driving behavior studies, the use of camera-based technology to collect events inside and outside the vehicle is a prevalent practice. A disadvantage of this method lies in the analysis of the data because a video recording must be manually coded to extract the desired behavior information. To optimize the time spent to code the data, a trained analyst observes short segments of video sequences (e.g., less than 10 s long) in randomly sampled and controlled periods (e.g., every 10 miles) to identify possible collisions or risky events [11]. Even though the events and drivers’ behavior codes are clearly defined in advance, an analyst is prone to make mistakes. Therefore, studies may involve several analysts to agree on how to label the observed events, which could entail a high time cost to prepare the data for their later analysis.
On the other hand, research has been carried out to address the technical challenges to track the dynamics of the head and infer behaviors related to the lack of attention. These related research papers are summarized in the next section.

2.2. Sensing Techniques to Infer Driving Behaviors

Head posture is the signal most studied through camera-based techniques since it requires developing complex and robust computer vision algorithms to detect face and eye features under various lighting conditions [12,13].
On the other hand, wearable computing has become mainstream, as evidenced by the large-scale market uptake of smartwatches and smart glasses [14]. These devices embed motion sensors that can make the detection of driving behaviors more feasible and affordable in real-world settings. However, we have identified only two works that made use of the inertial sensors of smart glasses [15,16], both of the same research group. In [16], the authors focus on detecting driver’s pure head motion through a dual compass-based system that estimates the angular velocity from a head-mounted compass (magnetometer) and then subtracts the angular velocity from a vehicle-end compass. Moreover, in [16], they used raw data from accelerometer, gyroscope and magnetometer sensors of smart glasses to estimate seven specific head postures based on rotation angles of yaw, pitch, and roll (e.g., ‘yaw right’, ‘yaw left’, ‘pitch right’, and ‘pitch left’). In this direction, inertial sensors and GPS have been used to develop a system in Japan that automatically evaluates safe-driving skills during a training program [17]. The system consists of inertial sensors that have to be worn on drivers’ head and a shoe to measure their motions, and then, a support vector machine (SVM) classifier decides if the visual scanning was appropriate for safe driving [17].
Thus, in the approach mentioned above, additional processing is required to infer the drivers’ visual focus of attention (VFoA). On the contrary, our approach is to generate a sensing component that infers the cabin spot drawing the driver’s VFoA based on their head posture.

3. Scope of This Work

Inferring VFoA can be useful for studying and monitoring drivers’ performance. For instance, VFoA on some cabin spots are highly related to conducting secondary tasks while driving, and therefore, cause distractions [18]. The increasing use of in-vehicle information systems (IVISs) and the prevalence of mobile devices may affect driving performance in different ways by inducing visual and cognitive distractions [18]. Not only secondary tasks are risky, but also those tasks highly related to driving, which demand glances away from the roadway [19]. The types of driver inattention are four categories [19]:
  • secondary task distraction, which refers to the diverting of the driver’s attention away from the driving task, for instance, handling CDs and reaching for an object on the seat;
  • driving-related inattention, it is directly related to the driving task such as checking the speedometer and mirrors;
  • drowsiness, which includes eye closures and repeated yawing;
  • non-specific eye-glance away from the forward roadway, it involves glances at no discernible object, person, or unknown location.
Our work copes with the two first categories in which drivers conduct activities that may involve changing their head pose to glance at specific spots of the car’s cabin. The literature review presented previously revealed that the driving context influences how drivers manage their VFoA, such as driving in intersections and roundabouts. However, it has not been studied the visual interaction patterns with the vehicle’s cockpit. Therefore, we identified the following research:
  • RQ1: How variables associated with the driving context, such as speed and hierarchy of road, influence focusing visual attention on specific spots of the vehicle’s cockpit?
  • RQ2: What are the technical design characteristics for developing a sensing architecture useful to characterize the drivers’ VFoA on spots of the vehicle’s cockpit?

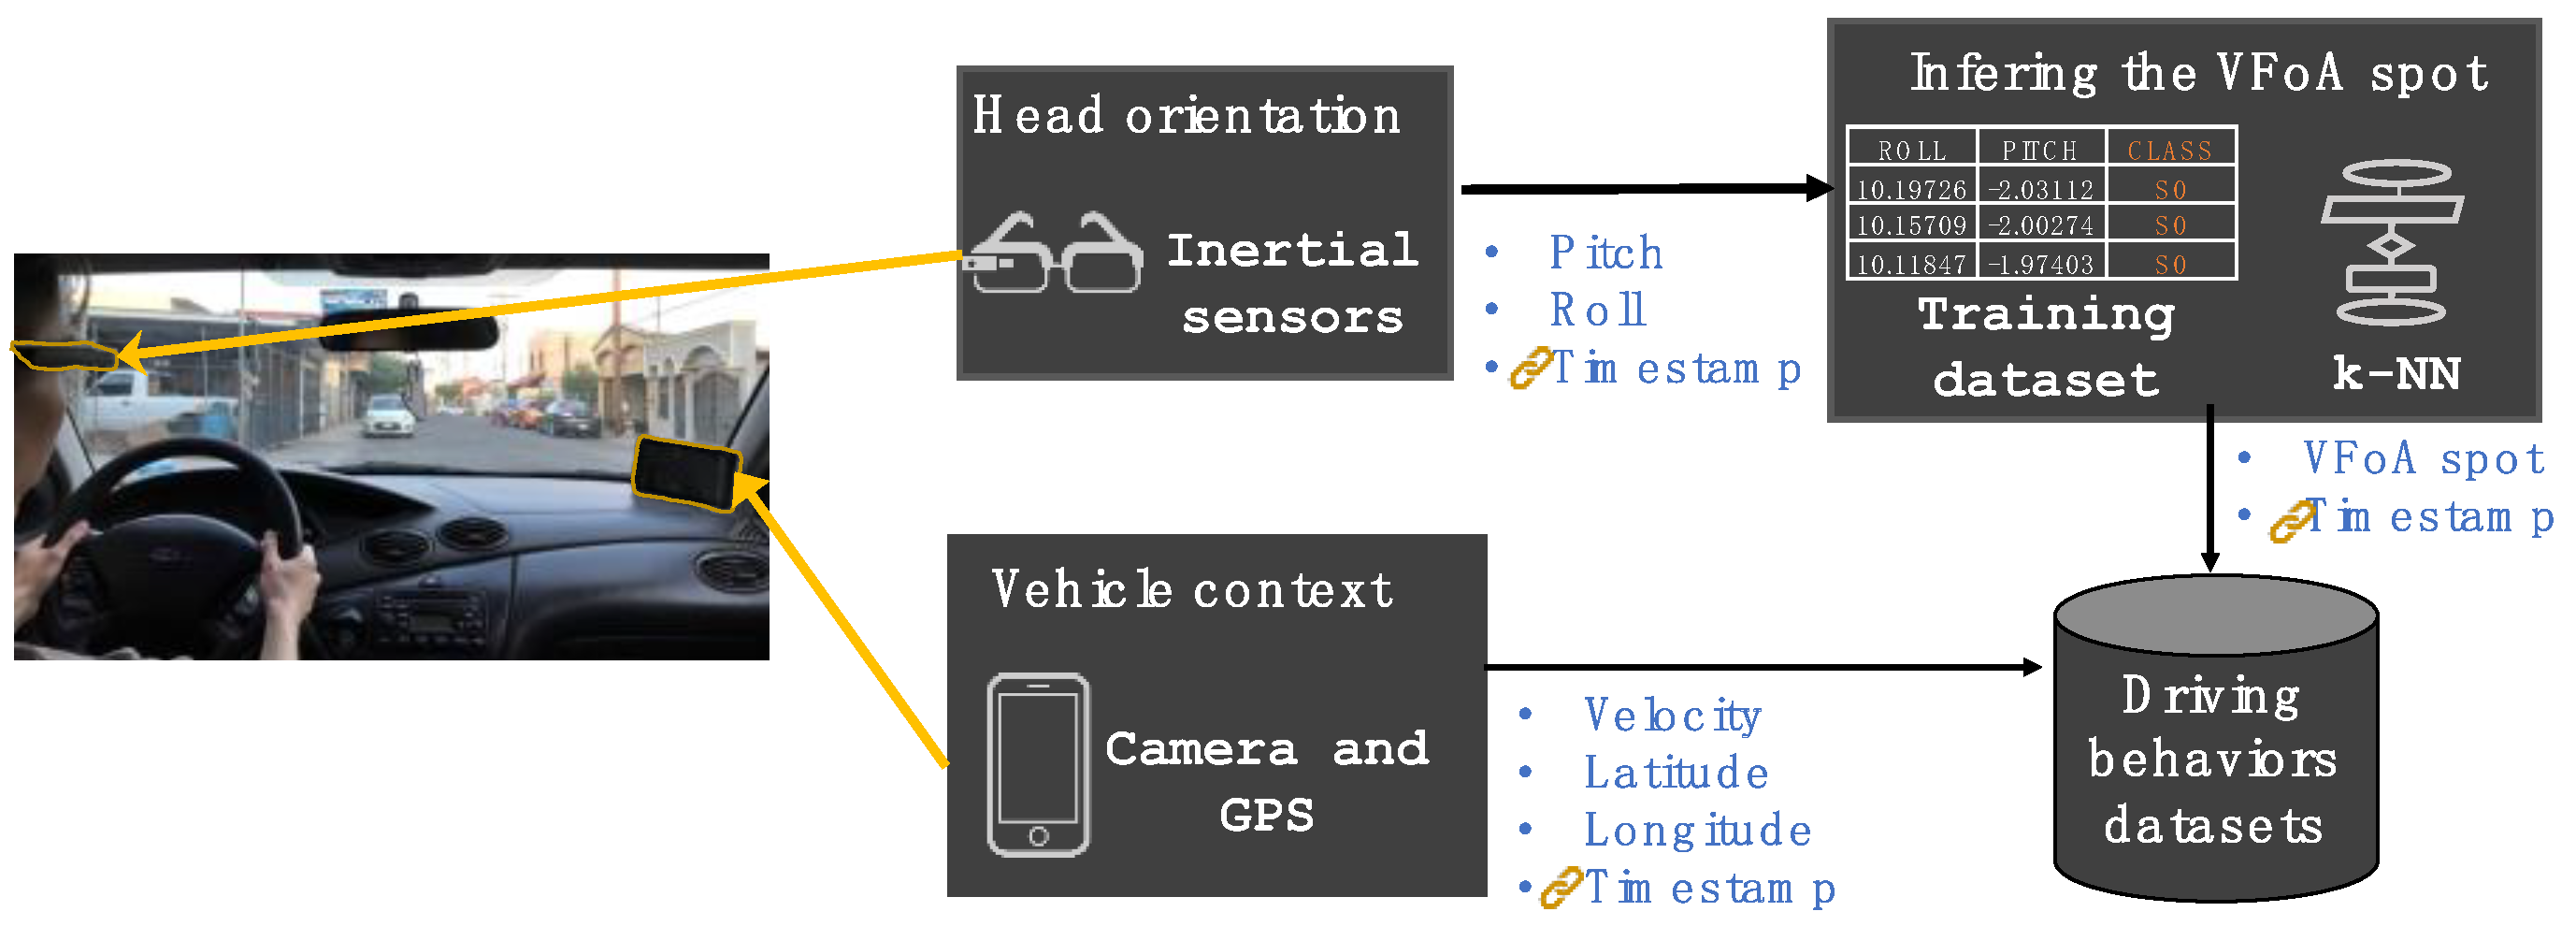
4. Sensing Architecture

As illustrated in Figure 1, the design of the sensing architecture consists of three components that collect data related to the driving context and the VFoA.

4.1. Vehicle Context Sensing Component

This component was implemented for the Android platform to use a mobile device to record data related to the driving context. It records drivers’ head orientation through the device’s camera sensor, and the driving speed and geographical position of the vehicle through the GPS sensor. Video is recorded continuously over the trip, and every frame includes the Unix timestamp in milliseconds. Driving speed and location are sampled with a rate of 1 Hz, including the Unix timestamp in milliseconds. The timestamp is used to link the data with those collected through the head-mounted component.

4.2. Head-Orientation Sensing Component

This component was implemented on the Google Glass platform. It uses the rotation vector sensor to report the orientation of the device relative to the East-North-Up coordinates frame. The Google Glass orientation is obtained by the integration of accelerometer, gyroscope, and magnetometer readings. These readings are processed by the platform’s sensor manager, which returns the values for the azimuth, pitch, and roll rotation angles in radians. Pitch is the rotation angle (RA) about the x-axis and represents the angle between a plane parallel to the device and a plane parallel to the ground. Roll is the RA about the y-axis. It represents the angle between a plane perpendicular to the device and a plane perpendicular to the ground. Moreover, azimuth or yaw is the RA about the z-axis. Since the azimuth represents the angle between the device’s z-axis and the magnetic pole, it changes even if drivers are not moving their heads while their vehicles are moving, and thus it was discarded from the sample recordings. Currently, this component has two modes for collecting data with the sampling rate set at 50 Hz:
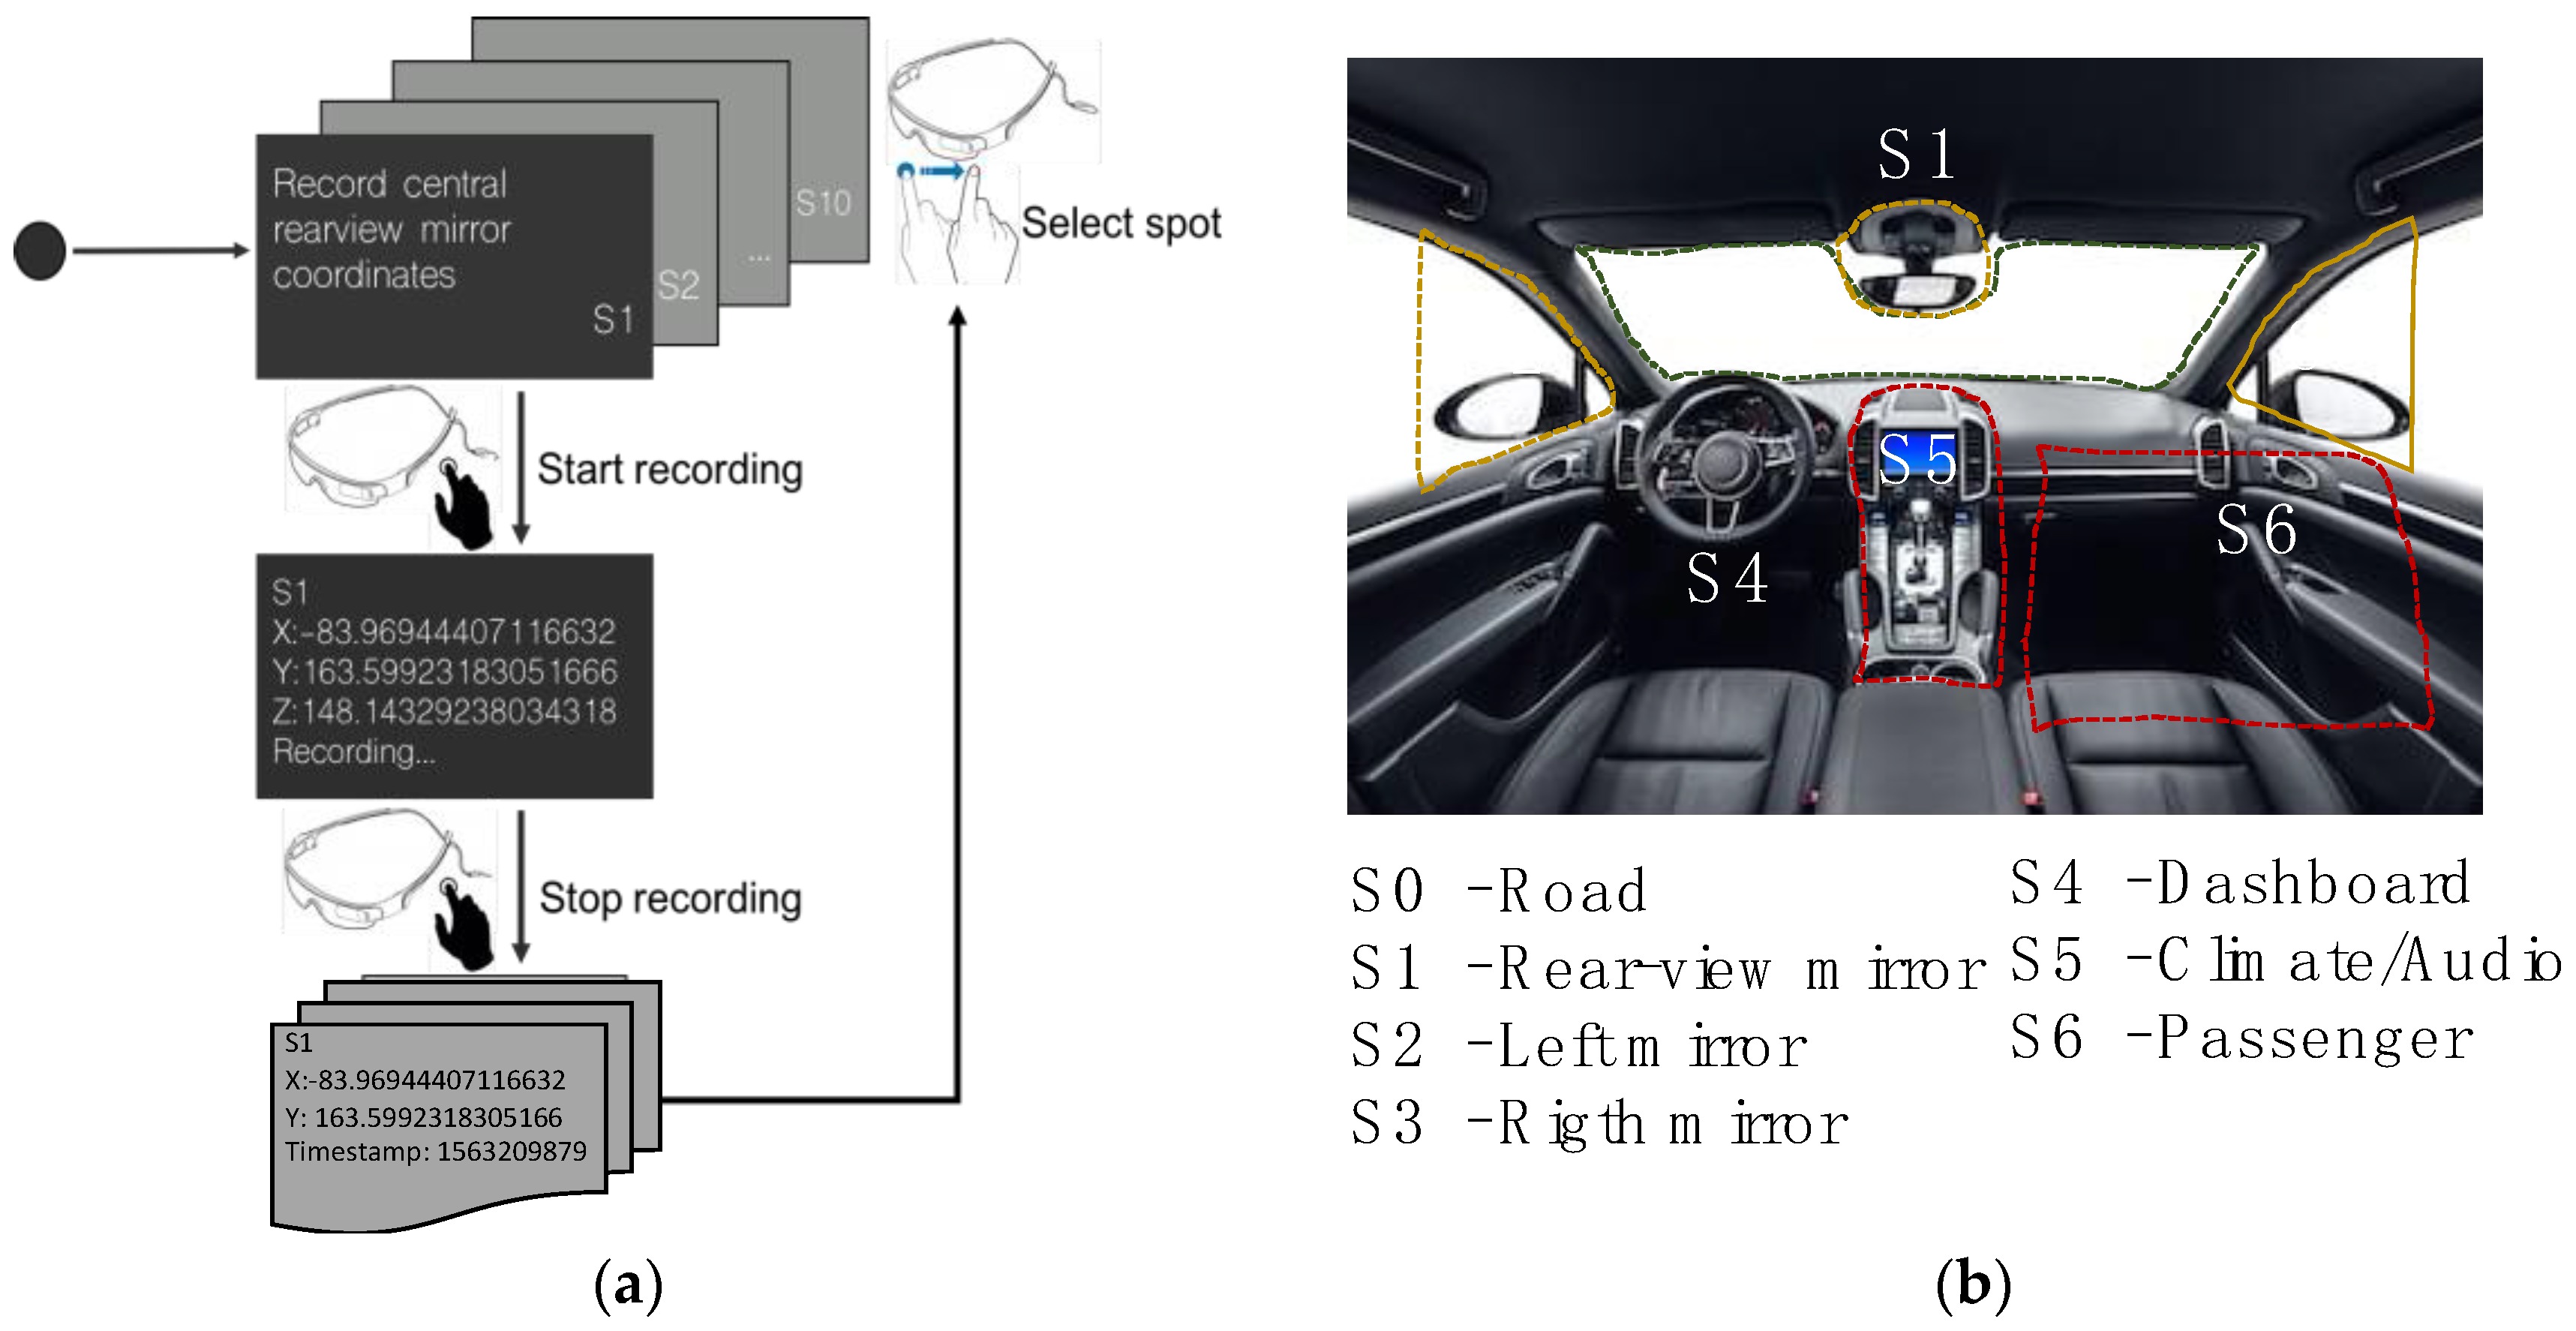
  • Static sensing. In this mode, the component provides an application for the Google Glass to collect the head RA data and to label them with the corresponding cabin spot class drawing the drivers’ VFoA. The spot classes used for the aim of our study are presented in Figure 2b. The component should be used with the vehicle parked for safety reasons. As depicted in Figure 2a, the application requires to select the cabin spot to record through a sliding gesture, and a tap gesture to control (start/stop) the data recording. Thus, four-tuple vectors are registered to contain the RA of the head in x and y, the timestamp, and the label associated with the cabin spot drawing drivers’ VFoA. Thus, this component’s functioning mode is used to collect the training dataset that the k-NN algorithm uses to classify the data collected during driving sessions.
  • Dynamic sensing. It is used to collect the head’s x and y RA during driving sessions and the corresponding Unix timestamp in milliseconds for every reading. The dataset gathered under this modality should be inputted into the k-NN algorithm to be classified as cabin spots classes.

4.3. Inferring the VFoA Spot

As mentioned earlier, to classify the inclination angle of the head as a cockpit spot attracting the drivers’ VFoA, we use the k-NN algorithm which is simple to implement. It is considered a direct classification method because unlike other supervised learning algorithms, such as SVM, it does not produce a mapping function from a training stage, but it only uses a training dataset at the test time to make predictions [20]. Therefore, k-NN requires the storage of a dataset labeled in advance with the classes to infer, which is called the training dataset. For classifying a new observation, k-NN uses the principle of similarity (distance measurement) between the training dataset and the observation to classify. Then, it is assigned to the most common class through a majority vote of its k nearest neighbors. We used the Euclidean distance as a metric of similarity and k = 3 neighbors.

5. Sensing Study Design

The inclusion criteria to participate in the study were: To have a valid driving license and a vehicle. The experiment included three stages. The first one was a session to collect data with the car parked. Participants wore Google Glass with the head-orientation sensing component functioning in the static sensing mode. Thus, we collected training datasets for the k-NN algorithm.
The second stage consisted of a session that included driving for two types of streets defined in the hierarchy of roads [21]. We included arterials and local roads. Arterials are high speed-roads of our city, which may carry large volumes of traffic. In our municipality, these are called boulevards in which the maximum speed allowed is 60 km/h. Local roads have the lowest speed limit (40 km/hour). All participants drove through the same path, which included 3.1 km of trails in the selected residential area and 3.9 km of a boulevard.
The third stage consisted of preparing and analyzing the collected datasets. They were indexed using the timestamp, and a repository of .csv archives was created. As illustrated in Figure 1, this repository contains the driving behaviors datasets. We used the k-NN algorithm to classify the drivers’ head rotation angles (RA) on cockpits’ spots classes. Then, we used descriptive statistics tools [20] to analyze the driving behavior datasets. We conducted tests of correlation by estimating the Pearson correlation coefficient and setting the confidence level p to 0.05. The variables analyzed included the driving speed and hierarchy of road, and variables related to the VFoA behaviors:
  • Glance frequency: We counted the times that drivers look at (eyes off-on-off) each spot.
  • Glance duration: We estimated the time that each drivers’ glance lasts to a spot.
Correlations results were interpreted according to the following criteria: 0 < |r| < 0.3 is a weak correlation, 0.3 < |r| < 0.7 represents a moderate correlation, and |r| > 0.7 is a strong correlation.

6. Results

6.1. Participants Data

Fifteen students from our university were recruited to participate in this study, 12 men and 3 women. Their ages ranged between 20 and 29 years old. Some of their demographic characteristics and driving performance are shown in Table 1. It shows that the average driving speed was lower on the local roads (M = 16.12, SD = 3.46) than on the arterial roads (M = 30.25; SD = 5.15). The individual training datasets obtained using the static mode of the sensing architecture yielded the classification performance summarized in Table 1. These training datasets were used for classifying the datasets collected through the head-orientation sensing component during the driving sessions.

6.2. Frequency of Glances and Hierarchy of Road

Table 2 presents the frequency of glances to the cockpit’s spots, inferred through the k-NN algorithm for all the participants. The road (S0) was most frequently glanced at (901 times), followed by the rearview (S1), left and right mirrors (S2–S3). S6 (passenger) had more glances than the other non-critical spots to drive, i.e., dashboard (S4) and audio/climate (S5). Video recordings show that subjects tended to interact visually with the copilot while talking to him. In general, the glance frequency at all spots was reduced when driving on the arterial road (boulevard) in contrast to the local roads (residential zone). We deduce that participants tend to limit their interaction with non-critical to-drive spots when driving on the boulevard since they demand more visual attention on the road (S0). It was especially evident with the audio system (S5), which was almost ignored by all the participants as they drove down the boulevard.

6.3. Glances Frequency and Driving Speed

We estimated the correlation between glance frequency and driving speed for each spot. Most of the estimations represent weak negative correlations, except for S6 which got a moderate negative correlation between the two variables (r = −0.5104, N = 618, p = 0.00001). These results are significant at p < 0.05. This means that as the driving speed increases, participants tend to visually interact less with the cockpit’s spots, especially with the copilot.

6.4. Glances Duration and Driving Speed

Similarly, most of the correlations between glance duration and speed resulted negatively weak, except for glance duration at S5 (the audio system) in which a weak positive correlation between the two variables was found (r = 0.4002, N = 52, p = 0.003286). Our results are significant at p < 0.05. Thus, even though participants limited their interaction with S5, this is the spot that demanded most eye fixation when interacting with it. This may be due to this age group is more confident to interact with non-critical to drive spots. However, we do not have evidence from other age groups to make a strong asseveration. For the rest of the cockpit’s spots, we conclude that participants tended to shorten their glances duration as the driving speed incremented.

7. Conclusions and Future Work

In this work, we have presented a sensing platform and illustrated how it facilitates collecting driving behavior datasets in naturalistic conditions. Our results suggest that glance frequency at all cockpit’s spots is more reduced when driving on high-speed roads than in low-speed roads. Even though participants limited their interaction with the audio system, this is the spot that demanded most eye fixation. We found that as the driving speed increases, participants tend to visually interact less with the cockpit’s spots, especially with the copilot. Thus, we have presented preliminary evidence about how variables associated with the driving context, such as speed and hierarchy of road, influence focusing visual attention on specific spots of the vehicle’s cockpit. Therefore, we provided results in direction to address RQ1. However, we consider that the inclusion of more subjects in the study will enable us to obtain more asserted correlations. We plan to extend this study to contrast visual behavior patterns of young adults with those of older adults. Given that the processing speed of older adults is slower than the group of young drivers, we hypothesize that the older drivers glance longer at cockpit spots than young drivers. Additionally, older adults look at the points that are not critical for driving, such as the radio or the passenger area, less frequently.
Extending our study will enable us to test the mentioned hypothesis and also generate a more robust sensing architecture to address RQ2. In this work, we have described the technical characteristics of our proposed sensing architecture and demonstrated its utility to characterize the drivers VFoA. Future work could include modifying the head-orientation sensing component to detect in real-time the drivers’ VFoA in order to validate its accuracy on dynamic sensing mode.

Funding

This research was funded in part by the National Council of Science and Technology (CONACyT, México) through the Fondo Sectorial de Investigación para la Educación under Grant number 288670.

Acknowledgments

We thank to CONACyT for the scholarship granted to the first author.

Conflicts of Interest

The authors declare no conflict of interest.

References

  1. Choi, H.; Kasko, J.; Feng, J. An Attention Assessment for Informing Older Drivers’ Crash Risks in Various Hazardous Situations. Gerontologist 2019, 59, 112–123. [Google Scholar] [CrossRef] [PubMed]
  2. Wechsler, K.; Drescher, U.; Janouch, C.; Haeger, M.; Voelcker-Rehage, C.; Bock, O. Multitasking During Simulated Car Driving: A Comparison of Young and Older Persons. Front. Psychol. 2018, 9, 910. [Google Scholar] [CrossRef] [PubMed]
  3. Murphy-Chutorian, E.; Trivedi, M.M. Head Pose Estimation and Augmented Reality Tracking: An Integrated System and Evaluation for Monitoring Driver Awareness. IEEE Trans. Intell. Transp. Syst. 2010, 11, 300–311. [Google Scholar] [CrossRef]
  4. Kazumi, R.; Masaaki, O.; Tomikazu, I.; Hiro, O.; Shigeyuki, T.; Marwhiro, M. Elderly Drivers’Hazard Perception and Driving Performance. In Proceedings of the International Conference of Traffic and Transport Psychology (ICTTP 2004), Nottingham, UK, 5–9 September 2004. [Google Scholar]
  5. Wikman, A.S.; Summala, H. Aging and time-sharing in highway driving. Optom. Vis. Sci. 2005, 82, 716–723. [Google Scholar] [CrossRef] [PubMed]
  6. Kim, B.-S.; Yi, Y.-C.; Kim, H.-W.; Lim, D.-H.; Bak, M.-S.; Ji, D.-H.; Min, Y.-K. The Characteristics of Elderly Drivers’ Driving Behavior on Intersection Using Graphic Driving Simulator. J. Ergon. Soc. Korea 2010, 29, 611–617. [Google Scholar] [CrossRef]
  7. Fancello, G.; Pinna, C.; Fadda, P. Visual perception of the roundabout in old age. WIT Trans. Built Environ. 2013, 130, 721–732. [Google Scholar] [CrossRef]
  8. Lau, M.Y.; Kaber, D. Driving performance, adaptation, and cognitive workload costs of logo panel detection as mediated by driver age. Adv. Intell. Syst. Comput. 2018, 597, 775–786. [Google Scholar] [CrossRef]
  9. Chen, Y.-L.; Ma, M.-Y.; Tseng, P.-Y.; Liu, Y.-C.; Ou, Y.-K. Study on the Analysis of Traffic Accidents Using Driving Simulation Scenario. In Advances in Intelligent Systems and Computing, Proceedings of the 20th Congress of the International Ergonomics Association (IEA 2018), Florence, Italy, 26–30 August 2018; Springer: Cham, The Netherlands, 2019; Volume 823, pp. 209–216. [Google Scholar] [CrossRef]
  10. Sun, Q.C.; Xia, J.C.; He, J.; Foster, J.; Falkmer, T.; Lee, H. Towards unpacking older drivers’ visual-motor coordination: A gaze-based integrated driving assessment. Accid. Anal. Prev. 2018, 113, 85–96. [Google Scholar] [CrossRef]
  11. Klauer, S.G.; Guo, F.; Simons-Morton, B.G.; Ouimet, M.C.; Lee, S.E.; Dingus, T.A. Distracted Driving and Risk of Road Crashes among Novice and Experienced Drivers. N. Engl. J. Med. 2014, 370, 54–59. [Google Scholar] [CrossRef]
  12. Dong, Y.; Hu, Z.; Uchimura, K.; Murayama, N. Driver Inattention Monitoring System for Intelligent Vehicles: A Review. IEEE Trans. Intell. Transp. Syst. 2011, 12, 596–614. [Google Scholar] [CrossRef]
  13. Fernández, A.; Usamentiaga, R.; Carús, J.L.; Casado, R. Driver Distraction Using Visual-Based Sensors and Algorithms. Sensors 2016, 16. [Google Scholar] [CrossRef] [PubMed]
  14. Ploetz, T.; Healey, J. ISWC 2017: Riding the Waves of Wearables. IEEE Pervas Comput. 2018, 17, 78–83. [Google Scholar] [CrossRef]
  15. Chou, W.-Y.; Yang, C.-H.; Tasi, H.-C.; Lin, Y.-C.; Chuang, C.-F.; Chen, K.-H. Driver distraction recognition based on dual compass motion sensoring. In Proceedings of the 17th International IEEE Conference on Intelligent Transportation Systems (ITSC 2014), Qingdao, China, 8–11 October 2014; pp. 1375–1380. [CrossRef]
  16. Chuang, C.-F.; Yang, C.-H.; Lin, Y.-H. HMM-based driving behavior recognition for in-car control service. In Proceedings of the 2015 IEEE International Conference on Consumer Electronics, Taipei, Taiwan, 6–8 June 2015; pp. 258–259. [Google Scholar] [CrossRef]
  17. Segawa, M.; Okada, M.; Renge, K.; Tada, M.; Noma, H.; Utsumi, A. Elderly driver retraining using automatic evaluation system of safe driving skill. IET Intell. Transp. Syst. 2014, 8, 266–272. [Google Scholar] [CrossRef]
  18. Sajan, S.; Ray, G. Human Factors in Safe Driving—A Review of Literature on Systems Perspective, Distractions and Errors. In Proceedings of the 2012 IEEE Global Humanitarian Technology Conference, Seattle, WA, USA, 21–24 October 2012; pp. 83–88. [Google Scholar] [CrossRef]
  19. Caird, J.K.; Johnston, K.A.; Willness, C.R.; Asbridge, M. The use of meta-analysis or research synthesis to combine driving simulation or naturalistic study results on driver distraction. J. Saf. Res. 2014, 49, 91.e1–96.e1. [Google Scholar] [CrossRef] [PubMed]
  20. Altman, N.S. An Introduction to Kernel and Nearest-Neighbor Nonparametric Regression. Am. Stat. 1992, 46, 175. [Google Scholar] [CrossRef]
  21. Chapter 3: Functional Classification—Flexibility—Publications—Environment—FHWA. (n.d.). Available online: https://www.fhwa.dot.gov/environment/publications/flexibility/ch03.cfm (accessed on 16 July 2019).
Figure 1. Sensing architecture.
Proceedings 31 00034 g001
Figure 2. Drivers’ visual focus of attention (VFoA) is captured with the application presented in (a), which enables to label the head rotation angle (RA); (b) Classes used to label the data.
Proceedings 31 00034 g002
Table 1. Participant characteristics.
Demographic Datak-NN Performance on Static ModeDriving Data Collected on Dynamic Mode
ParticipantGenderAgeError Rate (%)Accuracy (%)Speed 1 M (SD)Speed 1 (M) on Local/Arterial Roads
P1Male210.1199.8917.45 (18.17)14.19/21.51
P2Male210.2099.8020.30 (18.33)15.88/25.33
P3Male200.2599.7517.11 (16.70)12.50/33.59
P4Male220.2999.7117.74 (18.61)12.88/32.70
P5Male210.4699.5422.03 (20.18)15.57/32.60
P6Male250.1299.8819.36 (19.90)15.26/29.57
P7Male290.3699.6420.62 (19.28)16.01/33.14
P8Male220.0499.9619.90 (18.67)17.42/22.34
P9Male220.2099.8026.18 (23.21)21.59/31.08
P10Female210.3099.7016.78 (17.47)12.38/30.28
P11Male230.2099.8024.25 (21.34)18.15/34.30
P12Female210.0010020.79 (18.73)15.57/37.03
P13Female220.1499.8630.42 (22.32)24.87/36.70
P14Male250.0299.9816.38 (17.86)12.72/21.89
P15Male210.1599.8521.18 (18.06)16.84/31.74
1 Speed in km/hour.
Table 2. Frequency of glances to each cockpit’s spot.
Road (S0)Rearview Mirror (S1)Left-Mirror (S2)Right-Mirror (S3)Dash-Board (S4)Audio/
Climate (S5)
Passenger (S6)
Local (residential zone)Sum90174822234711144618
Mean60.0749.8714.8023.137.402.9341.20
Std. Dev41.2434.6314.0023.6510.026.4731.04
Arterial (Boulevard)Sum31026968131274255
Mean22.1419.214.869.361.930.2918.21
Std. Dev32.0831.398.4710.923.261.2519.63
TotalSum1322114131148514252922
Mean88.1376.0720.7332.339.473.4761.47
Std. Dev70.0565.1720.4532.6213.166.8149.75
Publisher’s Note: MDPI stays neutral with regard to jurisdictional claims in published maps and institutional affiliations.

