Time Series Land Cover Mapping and Change Detection Analysis Using Geographic Information System and Remote Sensing, North and West of Africa †


Abstract
:1. Introduction
2. Methods
- -
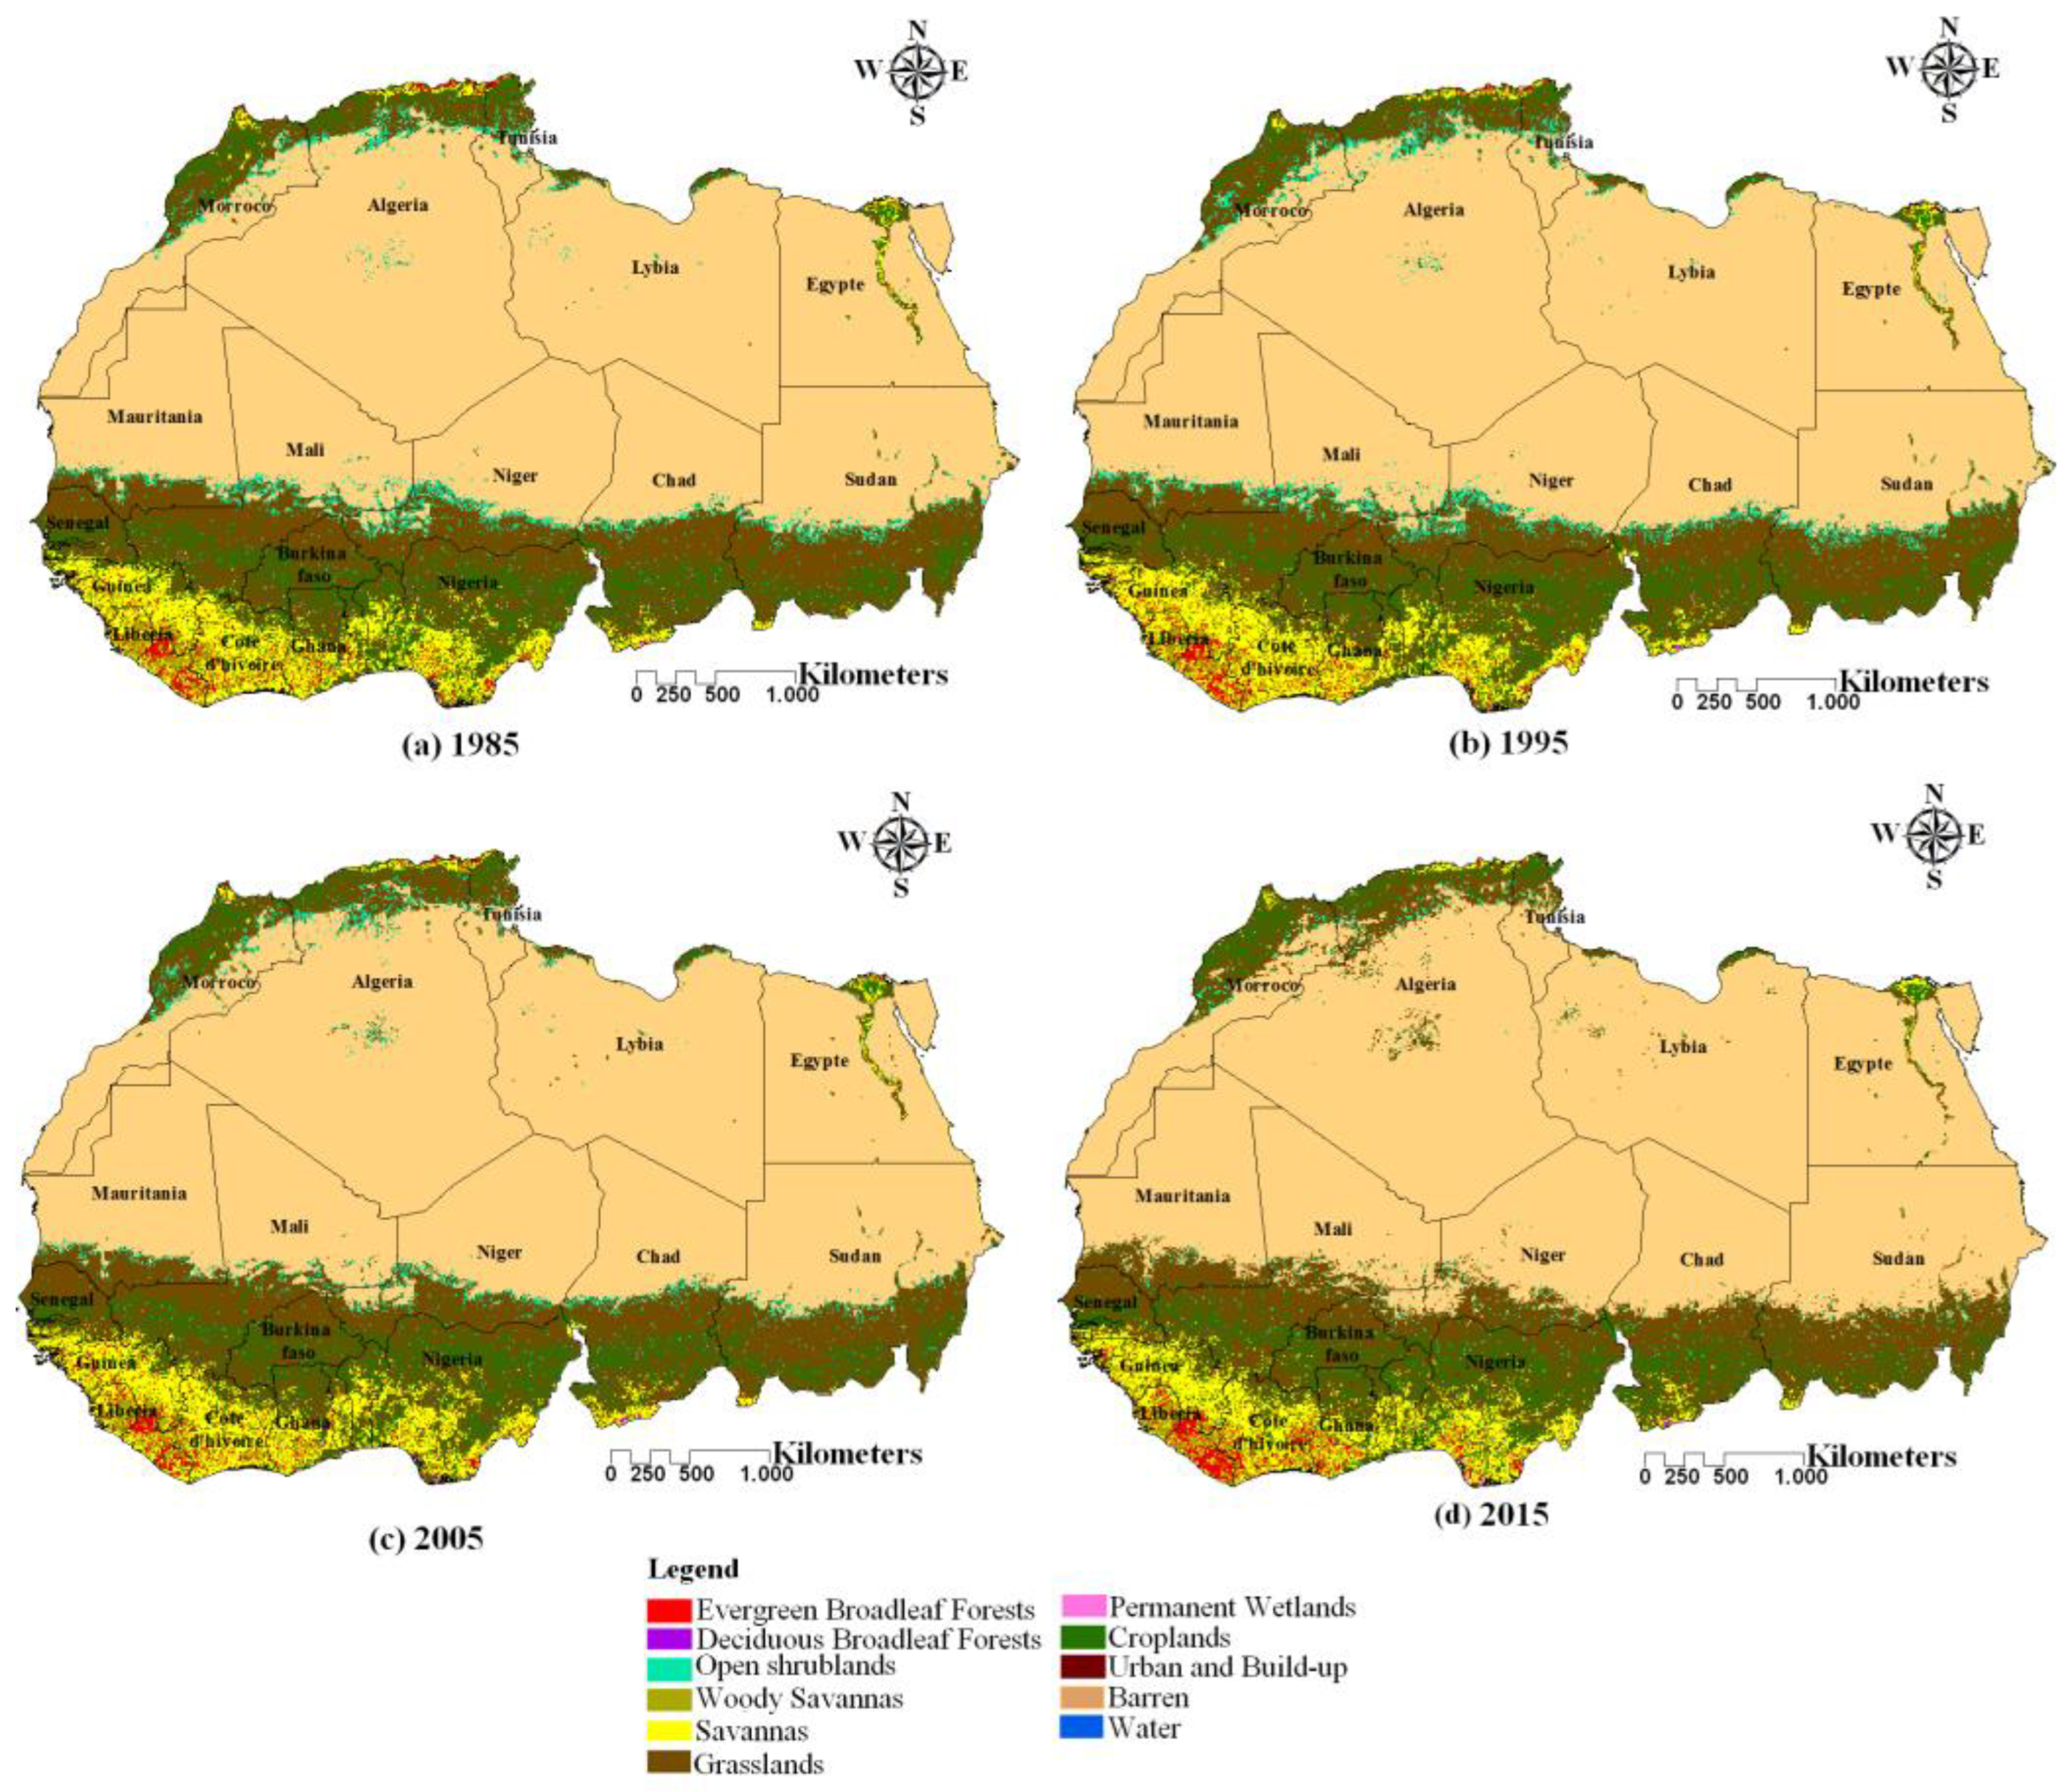
- This study will be applied to the North and West of Africa. It lies between latitudes 4° and 38° N, and longitudes 18° W and 40° E.
- -
- The dataset used in this study have the same resolution of pixels 1/12°. The first dataset utilized is the AVHRR GIMMS NDVI3g from 1982 to 2015, and the second dataset used in this study is MODIS MCD12Q1 from 2002 to 2015. These were used as reference data for the AVHRR classification to identify areas of training and contained a set of annual LULC maps from 2002 to 2015, corresponding to the classification system of International Geosphere-Biosphere Program (IGBP).
- -
- We use the random forest classification to classify the AVHRR data from 1982 to 2015.
- -
- Detect the change in the land cover from 1985 to 1995, from 1995 to 2005, and from 2005 to 2015.
3. Results and Discussion
4. Conclusions
Author Contributions
Funding
Acknowledgments
Conflicts of Interest
References
- Erika, R.; Celso, B.L.; Martin, H.; Erik, L.; Robert, O.; Arief, W.; Daniel, M.; Louis, V. Assessing change in national forest monitoring capacities of 99 tropical Countries. For. Ecol. Manag. 2015, 352, 109–123. [Google Scholar]
- Tappan, G.G.; Cushing, W.M.; Cotillon, S.E.; Mathis, M.L.; Hutchinson, J.A.; Dalsted, K.J. West Africa Land Use Land Cover Time Series: U.S. Geological Survey Data Release; U.S. Geological Survey: Reston, VA, USA, 2016. [Google Scholar]
- Faour, G.; Mhawej, M.; Fayad, A. Detecting Changes in Vegetation Trends in the Middle East and North Africa (MENA) Region Using SPOT Vegetation. Eur. J. Geogr. 2016, 779. [Google Scholar] [CrossRef]
- Hopfner, C.; Scherer, D. Analysis of vegetation and land cover dynamics in north-western Morocco during the last decade using MODIS NDVI time series data. Biogeosciences 2011, 8, 3359–3373. [Google Scholar] [CrossRef]
- Julien, A.; Catherine, M. Vegetation Land Cover Change Mapping of West African Coastal Zone from Remotely Sensed Images: Example of “Rivières-du-Sud” from Salum Delta (Senegal) to Rio Geba (Guinea-Bissau); Paris University Diderot, Pôle de Recherche pour l’Organisation et la Diffusion de l’Information Géographique: Paris, France, 2008. [Google Scholar]
- Lucas, R.; Blonda, P.; Bunting, P.; Jones, G.; Inglada, J.; Arias, M.; Charnock, R. The earth observation data forhabit at monitoring (EODHaM) system. Int. J. Appl. Earth Obser. Geoinfor. 2015, 37, 17–28. [Google Scholar]
- Townshend, J.R.; Justice, C.; Kalb, V. Characterization and classification of South American land cover types using satellite data. Int. J. Remote Sens. 1987, 8, 1189–1207. [Google Scholar] [CrossRef]


| Map Unit | Area 1985 | Area 1995 | Area 2005 | Area 2015 | Change Area km2 | ||
|---|---|---|---|---|---|---|---|
| km2 | km2 | km2 | km2 | 1985/1995 | 1995/2005 | 2005/2015 | |
| Evergreen Broadleaf Forests | 147,408.7 | 144,269.68 | 144,117.4 | 159,132.1 | −3138.98 | −152.25 | 15,014.69 |
| Deciduous Broadleaf Forests | 8246.75 | 8270.13 | 9105.37 | 9208.81 | 23.38 | 835.24 | 103.44 |
| Open Shrublands | 387,886.6 | 353,501.68 | 291,959 | 182,273.2 | −34,385 | −61,542.7 | −109,686 |
| Woody Savannas | 138,728.8 | 122,261.54 | 120,304.1 | 118,926.6 | −16,467.3 | −1957.41 | −1377.53 |
| Savannas | 882,638.4 | 896,636.02 | 927,632.6 | 943,824.9 | 13,997.58 | 30,996.58 | 16,192.28 |
| Grasslands | 3,239,830 | 3,298,144 | 3,224,773 | 3,201,880 | 58,314.01 | −73,370.8 | −22,892.8 |
| permanent Wetlands | 20,302.31 | 14,665.85 | 14,955.08 | 13,888.51 | −5636.46 | 289.23 | −1066.57 |
| Croplands | 1,303,639 | 1,273,444.02 | 1,298,141 | 1,351,932 | −30,194.9 | 24,696.49 | 53,791.36 |
| Urban and Built-up | 3463.03 | 5479.32 | 7020.12 | 9331.29 | 2016.28 | 1540.8 | 2311.17 |
| Barren or sparsely vegetated | 11,192,916 | 11,208,880.48 | 11,289,682 | 11,337,555 | 15,964.3 | 80,801.46 | 47,873.03 |
| Water | 3497.5 | 3004.44 | 867.78 | 604.58 | −493.06 | −2136.66 | −263.19 |
| Total area | 17,328,557 | 17,328,557 | 17,328,557 | 17,328,557 | |||
© 2019 by the authors. Licensee MDPI, Basel, Switzerland. This article is an open access article distributed under the terms and conditions of the Creative Commons Attribution (CC BY) license (http://creativecommons.org/licenses/by/4.0/).
Share and Cite
Henchiri, M.; Kalisa, W.; Sha, Z.; Zhang, J. Time Series Land Cover Mapping and Change Detection Analysis Using Geographic Information System and Remote Sensing, North and West of Africa. Proceedings 2019, 39, 3. https://doi.org/10.3390/proceedings2019039003
Henchiri M, Kalisa W, Sha Z, Zhang J. Time Series Land Cover Mapping and Change Detection Analysis Using Geographic Information System and Remote Sensing, North and West of Africa. Proceedings. 2019; 39(1):3. https://doi.org/10.3390/proceedings2019039003
Chicago/Turabian StyleHenchiri, Malak, Wilson Kalisa, Zhang Sha, and Jiahua Zhang. 2019. "Time Series Land Cover Mapping and Change Detection Analysis Using Geographic Information System and Remote Sensing, North and West of Africa" Proceedings 39, no. 1: 3. https://doi.org/10.3390/proceedings2019039003
APA StyleHenchiri, M., Kalisa, W., Sha, Z., & Zhang, J. (2019). Time Series Land Cover Mapping and Change Detection Analysis Using Geographic Information System and Remote Sensing, North and West of Africa. Proceedings, 39(1), 3. https://doi.org/10.3390/proceedings2019039003