Abstract
Chalcones are a group of compounds that belong to the flavonoid family and have a wide variety of uses, including a high therapeutic potential for multiple diseases, such as, anticancer, antifungal or antibacterial agents. As is well known, chalcones are commonly synthesized by Claisen-Schmidt condensation, aldol condensation involving the appropriate aldehydes and ketones, in presence of acid or base as catalyst followed by dehydration reactions. However, under conventional conditions it is carried out with prolonged reaction times and requires expensive catalysts. For this reason, alternative source of energy, microwave or ultrasound, are employed. On the other hand, in all chemical processes a considerable amount of variables (instrumental parameters, reagents, temperatures, times, etc.) take part so a large number of experiments must be carried out in order to define the optimal conditions. In addition, the experimental design technique -important tool- allows the optimization of conditions leading to better yields in shorter times. Here and in line with previous research, we explore the synthesis, assisted by ultrasound, of (E)-1,3-diphenyl-2-propen-1-one like a model reaction. Taguchi Design was the mathematical method employed to determine the best working condition. In conclusion, the desired product is obtained quantitatively, without undesired by-products, and in short reaction times. Additionally, the reaction was used, as an alternative method, to monitor the ultrasound equipment using the control chart methodology (Shewhart chart), which allowed us to study how a process changes over time.
1. Introduction
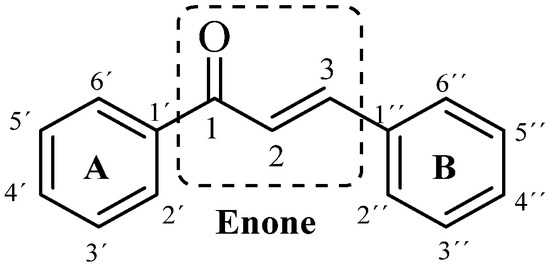
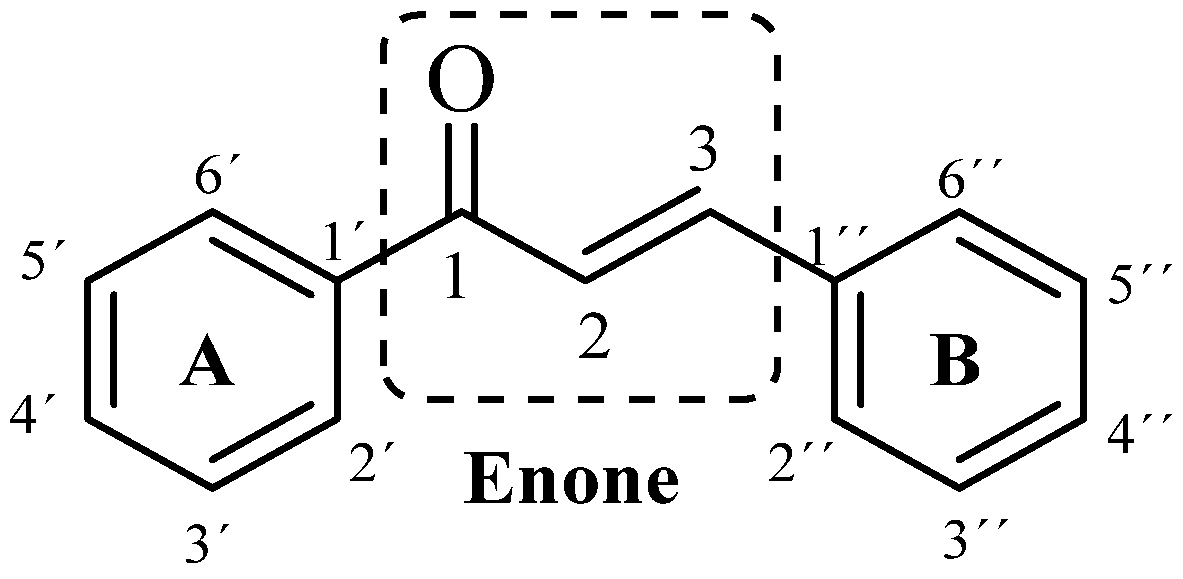
1,3-diaryl-2-propen-1-one is the classical structure of a chalcone in which two aromatic rings are linked by an α, β-unsaturated ketone system. These enonas, known as chalconas or chalconoides, form the central nucleus of a variety of important biological compounds [1] Scheme 1.
Scheme 1.
General structure of chalcone.
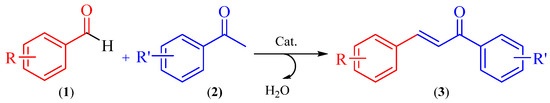
Chalcones are natural compounds that are widely distributed in a variety of vegetables species. These organic compounds are the precursors of flavonoids and isoflavonoids. In addition, chalcone derivatives have shown great attention in organic synthesis because they have numerous biological and pharmacological activities, such as: anti-inflammatory, antituberculous, antifungal, antiproliferative, antibacterial, antimalarial, anticancer, antimutagenic, cytotoxic, antiviral, antioxidant, insecticide [2,3]. Changes in its structure proved to be very useful for the development of new medicinal agents with improved potency and lower toxicity [4]. As is well known, chalcones (3) are commonly synthesized by Claisen-Schmidt condensation, which involves cross aldol condensation of appropriate aldehydes (1) and ketones (2) by base catalysed or acid catalysed reactions followed by dehydration. Scheme 2.
Scheme 2.
Claisen-Schmidt condensation.
The Claisen–Schmidt condensation (cross-aldol condensation) is widely recognized as an effective strategy for the carbon–carbon bond formation. This condensation is carried out in basic or acidic media under homogeneous conditions. As a potential substitutional, the heterogeneous catalysts also have been used, such us Lewis acids, Brønsted acids, solid acids, and solid bases [5,6,7,8,9,10,11].
However, under conventional conditions it is carried out with prolonged reaction times and requires expensive catalysts [12,13]. For this reason, alternative energy sources, such as microwaves or ultrasound are used [12,14,15].
Ultrasound irradiation is usually applied either in a bath or with a probe. Since the probe directly applies irradiation to the target system treated, it is far more effective compared with bath-type methodology. Standard probes are mostly made from aluminum and titanium and all these probes are subject to process-related wear, which leads to erosion on the sound-emitting surface and thus to a reduction in power. [16] Wear resulting from cavitation erosion, is a normal consequence of ultrasonic processing [17,18]. As a result, standard probes must be maintained systematically and tested for its performance qualification. Therefore, there is a need a routine performance qualification test is needed to ascertain that the sonochemistry equipment consistently performs according to a specification determined by its routine analysis.
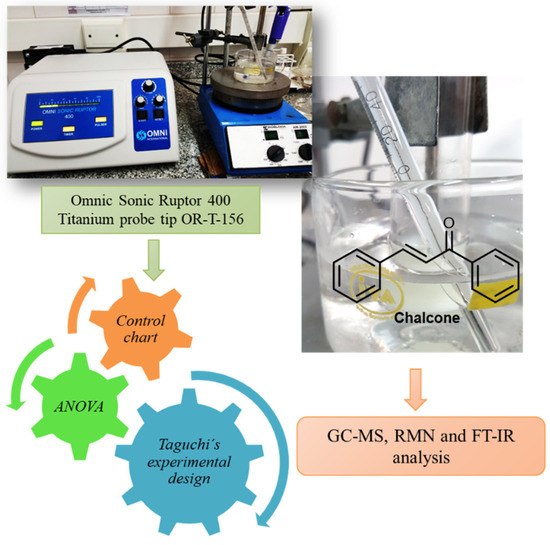
In this communication we present the synthesis of a classical chalcone assisted by ultrasound. On the other hand, the model reaction is used to design, developed and implemented a simple and complete internal quality methodology in order to check the performance of a standard ultrasound probe. Scheme 3.
Scheme 3.
Ultrasound-assisted syntheses of chalcones. Performance of a standard ultrasound probe.
2. Methods
Reagents were obtained from commercial sources and used as received (benzophenone and benzaldehide, Sigma Aldrich; NaOH, Anedra). Organic solvents were distilled prior to use. Reactions were monitored by thin-layer chromatography (Fluka®) on silica gel plates (60F-254) visualized under UV light and using 5% phosphomolibdic acid in ethanol.
The solvents evaporation was carried out in a rotary evaporator (Büchi) at reduced pressure (Büchi V-700 pump). Melting points were determined on a Büchi 530. Ultrasound assisted reactions were carried out using a Omnic Sonic Ruptor 400 series ultrasonic homogenizer operating at 20 KHz (400 W). The titanium probe tip OR-T-156 “Stepped Micro Processing Tip, 5/32” (3.8 mm diameter and 25.6 cm large) was immersed in the mixture. NMR spectra were recorded on a Bruker ARX 300 (300.1 MHz for 1H and 75.5 MHz for 13C) using CDCl3 as solvent. Chemical shifts (δ) are reported in ppm and coupling constants (J) are in Hz. Gas chromatography (GC) was performed on a Agilent 7890B equipped with a mass detector 5977A and a HP5-Ms capillary column (30 m × 0.25 mm × 0.25 um). The operating conditions of GC were: Helium (percentage purity > 99.999%) was used as carrier gas at a flow rate of 1 mL/min, 1 uL of organic fase was injected in split mode 20:1, and injector temperature was 250 °C. Oven temperature was programmed as follows: started from 50 °C (hold for 2 min), increase to 280 °C (hold for 10 min) at the rate of 10 °C/min. The mass spectrometer was operated in an electron-impact mode of 70 eV. The MSD transfer line was 250 °C; ion source temperature was 230 °C; quadrupole temperature was 150 °C. Based on the mass scan range of 50–350 atomic mass units (amu) with SCAN mode, retention times of compounds were determined by comparing the MS fragmentation pattern of the standards and the National Institute of Standards and Technology (NIST) 2.0 GC–MS library. The UV-visible spectra were recorded in a Carey 60 version 2.0 instrument with Xenon lamp. A quartz 5 mL cell was chosen for the measurements. Infrared spectra were collected on a FT-IR Spectrometer Nicolet Nexus-470.
General Procedure for the Synthesis of (E)-1,3-Diphenyl-2-Propen-1-One
2.1.1. Conventional Method
The reaction was carried out in a 20-mL one-necked round-bottomed flask equipped with a Teflon valve (vessel). To a stirred solution of benzophenone (2 mmol, 0.244 g, 0.23 mL) and benzaldehyde (2 mmol, 0.210 g, 0.20 mL) in ethanol (2 mL) was added a 2.5 M solution of NaOH (2 mL). The reaction solution was magnetically stirred for 4 h at room temperature (monitoring the disappearance of reagents by TLC). The solution was extracted with dichloromethane (3 × 4 mL). The combined organic layers were dried over Na2SO4 and concentrated under reduced pressure to give 0.37g (1.8mmol, 90%) [19] of (E)-1,3-diphenyl-2-propen-1-one as a yellow solid. m.p.: 55–60 °C;1H NMR (CDCl3): δ 7.43–7.45 (2H, m, Ph-H), 7.51–7.68 (7H, m, = CH, Ph-H), 7.82–7.87 (1H, d, = CH, 3J(H,H) = 15.4 Hz), 8.04–8.07 (2H, d, Ph-H, 3J(H,H) = 7.9 Hz); 13C NMR (CDCl3): δ 190.6, 144.9, 138.2, 134.9, 132.8, 130.6, 129.0, 128.7, 128.5, 128.5, 122.1,190.4, 144.7, 138.1, 132.7, 130.5, 128.9, 128.55, 128.4, 128.4, 122.0; MS (m/z, relative intensity): 209, (11), 208 (M+,75), 207 (100), 180 (5), 179 (20), 178 (10), 165 (9), 131 (35), 130 (10), 105 (27), 103 (32), 102 (10), 89 (9), 78 (5), 77 (64), 76 (8), 51 (18), 50 (5); FT-IR (KBr) νmax (cm−1): 3100-2950, 1661, 1603, 1574, 1444.
2.1.2. Ultrasonic Assisted Synthesis
The ultrasound-assisted reaction was carried out in a 10 mL flask which contains a solution of benzophenone (2 mmol, 0.244 g, 0.23 mL) and benzaldehyde (2 mmol, 0.210 g, 0.20 mL) in ethanol (2 mL) was added a 2.5 M solution of NaOH (2 mL) and the yields vary according to the parameters used.
The product was purified by liquid - liquid separation with dichloromethane, then the combined organic extracts were dried over anhydrous Na2SO4, filtered, evaporated, and weighed in analytical balance to calculate the yield.
3. Results and Discussion
The experimental results confirm that the ultrasound-assisted reaction was 225 times faster than the conventional one (15 min vs 4 h). It is important to mention that under the reaction conditions, the Michael addition product or the cis isomer was not observed. Therefore, the formation of chalcones takes place with excellent selectivity since no competitive side reactions were observed (GC) [14].
Taking into account the purification procedure, the recovery percentage is 92.84% (n = 3) with a standard deviation, S, of 2.17%.
3.1. Taguchi´s Experimental Design
To develop a methodology to permit control the internal quality we use the chalcone reaction as in-house control material (IHRM). The working conditions for the synthesis of the IHRM have been selected by using design of experiment (DOE). This allowed determining which tests should be performed in order to obtain data to be analyzed statistically that provide objective evidence for the choosing of the best working condition of the probe [20]. In this case, we used the Taguchi method of optimization, which is a partial factorial design of experiments to investigate how different factors, both internal and external, affect the mean and variance of a response variable [21].
The L4 × L4 arrangement of the Taguchi’s matrix was chosen based on a number of controllable variables available on the ultrasound probe and the non-controllable supposedly involved (environmental conditions, wearing, and instrumental noise). Each orthogonal L4 is designed for the evaluation of two factors and an interaction (saturated design), or three factors (confused design) as it was in this case. Each of these factors was evaluated at 2 levels (Table 1). The performance percentage of reaction has been used as the response variable (Yi) since their value has a direct and specific relationship with the operation of the probe.

Table 1.
L4 × L4 arrangement of the Taguchi’s matrix
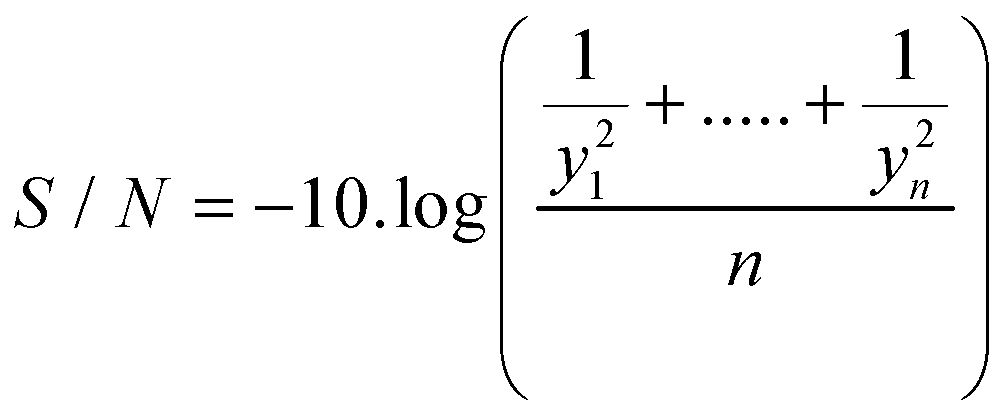
In this case, we used the S/N ratio (Scheme 4) best is better because it is the most consistent since the objective is to reduce the variability with respect to a maximum value, therefore, the statistician to use was:

Scheme 4.
S/N ratio.
where: yi is the yield production of the IHRM in terms of percentage recovery.
The choice of the values levels was based on two criteria:
- The experiences were performed on two different days, in this way the non-controllable variables could be fixed, the humidity differed by 7%, the ambient temperature was controlled by a spatial heater and the volumetric material was separated into 2 groups (each group corresponded at one level).
- The choice of controllable variables was made taken into account: (a) the probe tip supports a 50% of maximum power, therefore was used 30% as top level and 10% (minimum of use) as the lower level. (b) In the instrument, the pulse mode applies ultrasonic energy to the tip at a rate of one pulse per second. The pulse duration can be adjusted from 10% to 90%, in our case; we decided to use levels above the 50%. (c) The levels of reaction time were chosen considering the lower times that can be used (Table 2 and Table 3). We applied 4 replicas for each test and each one was subjected to different external conditions. The fact of have made more than one replica per test allowed greater sensitivity to detect changes [22]. With each replica value, we have calculated de S/N ratio per experience.
Table 2. Choice of controllable variables.
Table 3. Choice of noise factors.
3.2. ANOVA
According to the Taguchi method, the percentage contribution of each parameter was determined by ANOVA [23]. ANOVA helps in formally testing the significance of all main factors and their interactions by comparing the mean square against an estimate of the experimental errors at specific confidence levels. In other words, we can determinate which parameters have significantly influence in the response variable, to subsequently select the optimal level in the significant factors for the best response.
In our experiment, the analysis was performed with a 5% level of significance. The variation of the factor is statistically significant (p-value <0,05).
For the performance of percentage of reaction, the power is the only significant factor with 5% significance. While for the S/N index have not found, for the variation in the levels assessed, any significant factor with a risk of 5%.
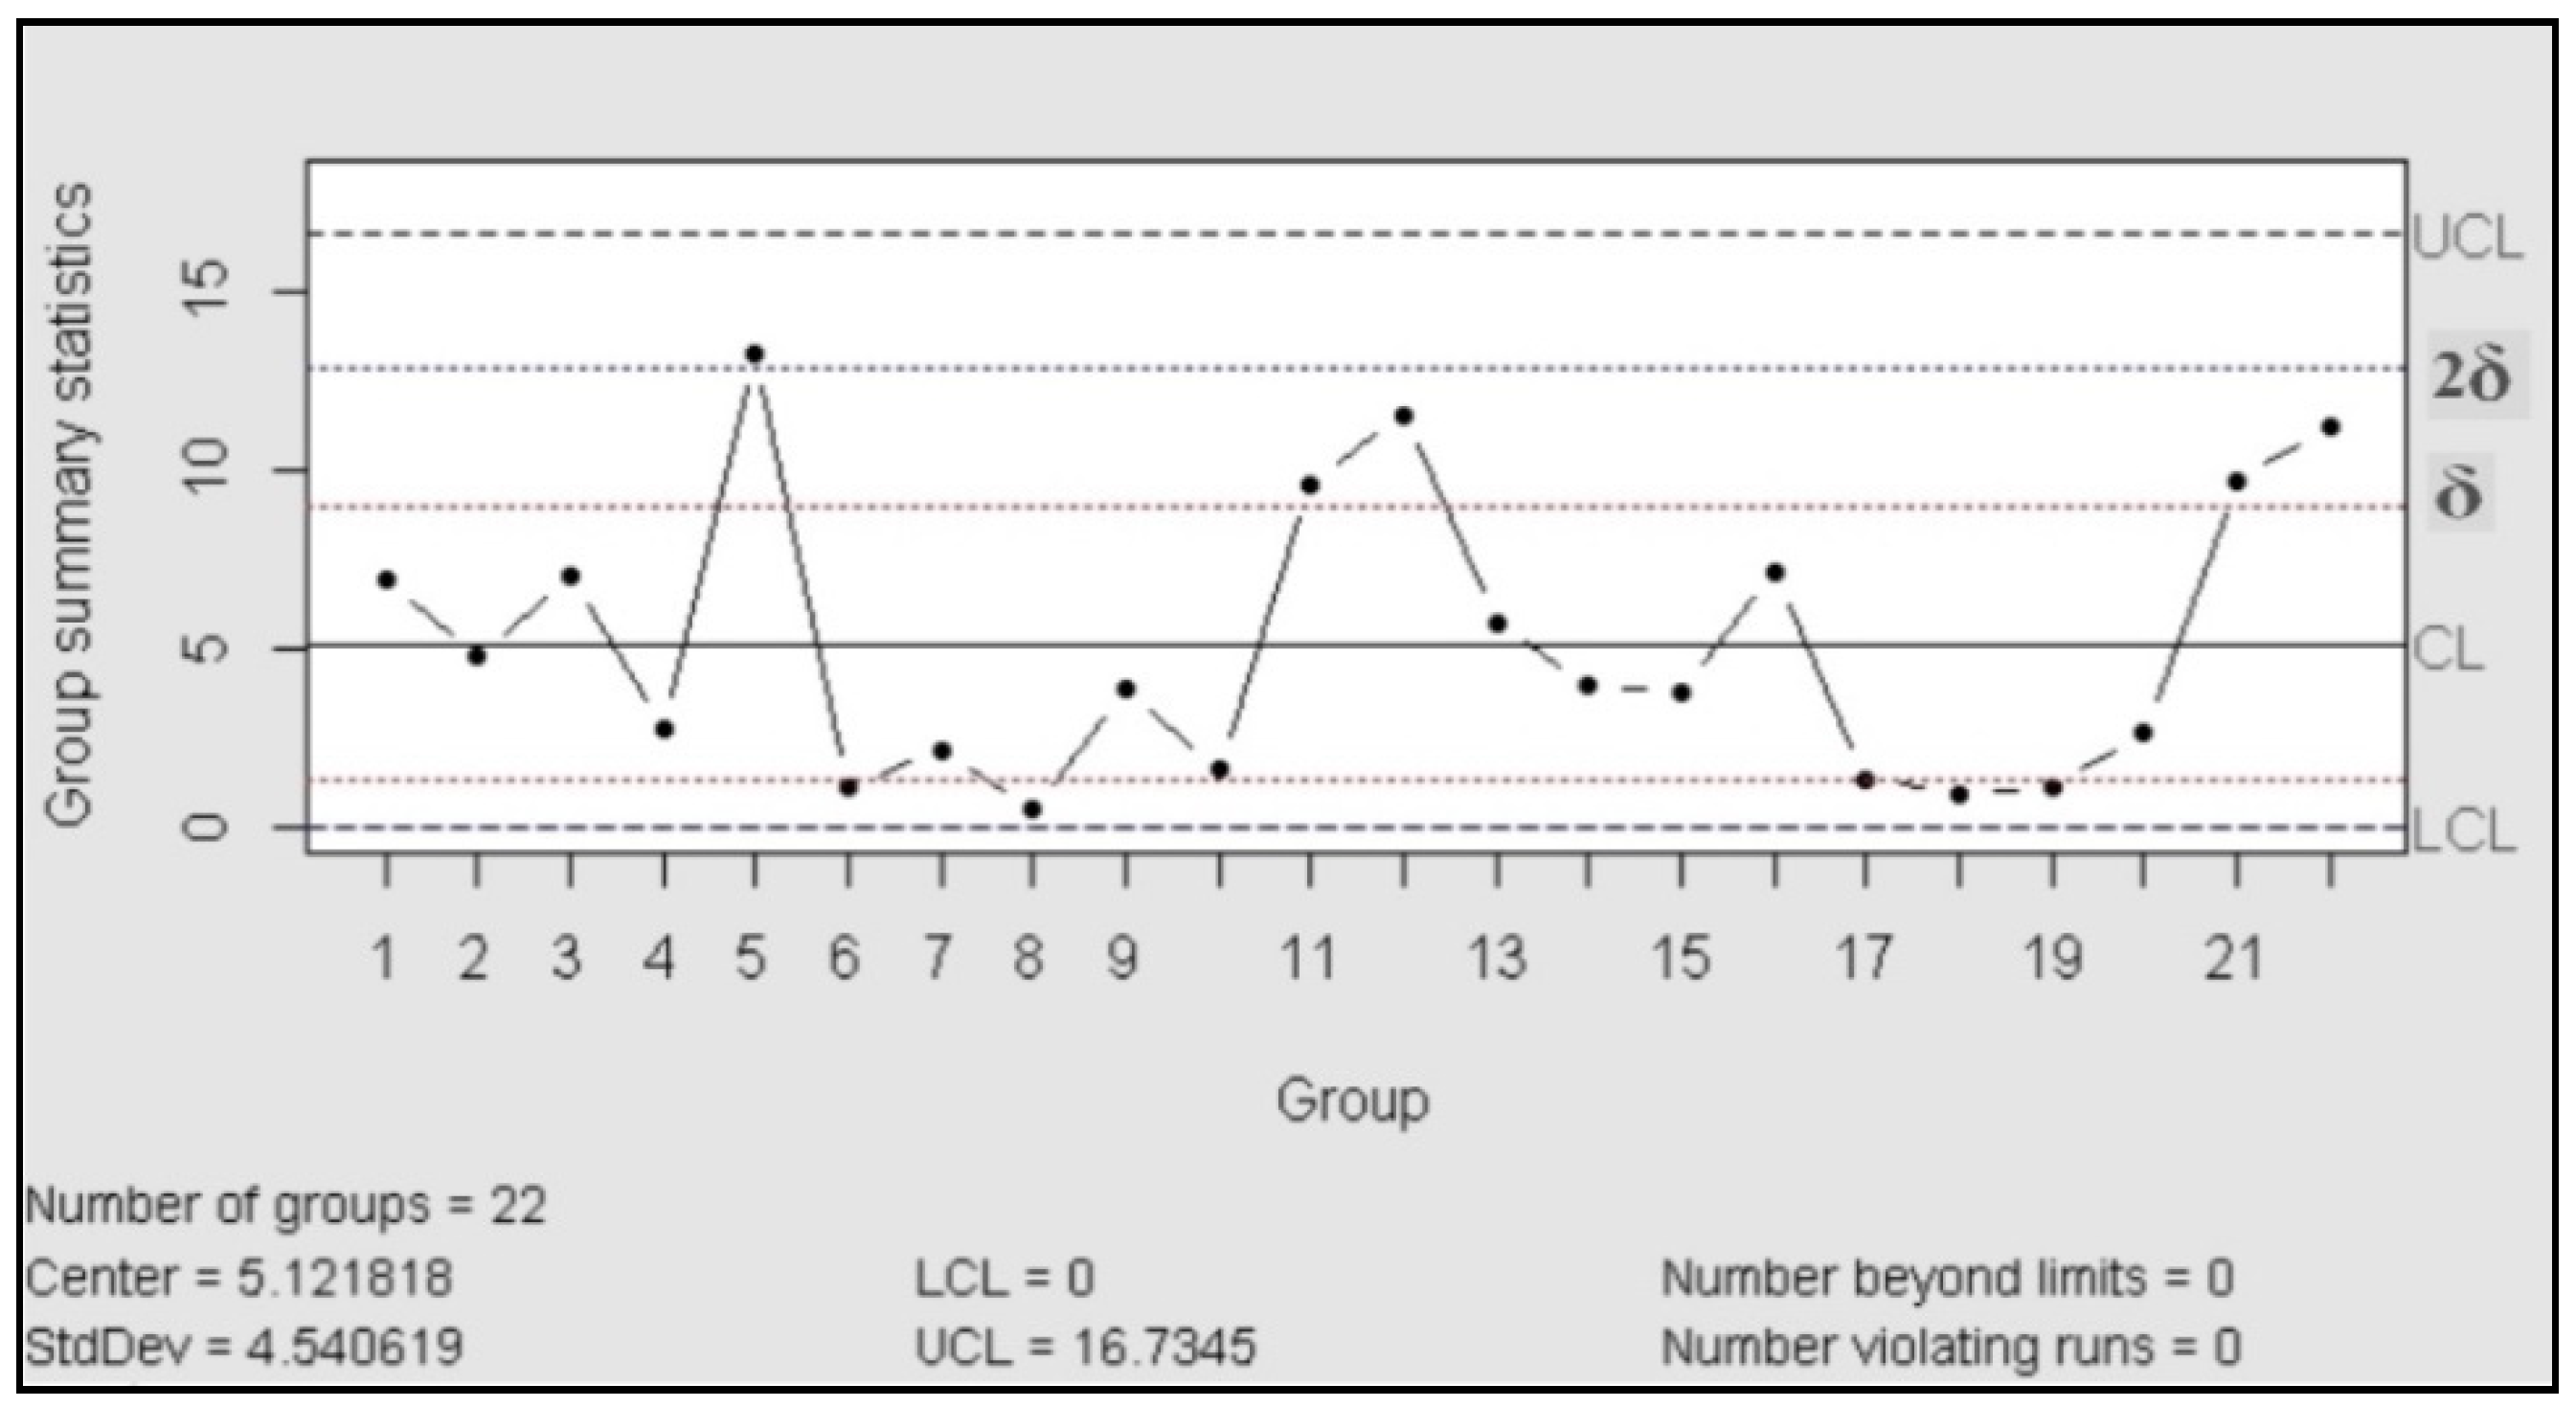
3.3. Control Chart
The control charts are used to check the stability of the process; they work as a tool for detection of changes in the behavior of the variables and, in consequence, anticipate the possible change in the behavior of the probe. According to ASTM, the purpose of the control charts is to find out if the values observed differ from the expected value, in an amount greater than that should be attributed to the random [24]. In our case, we used control charts of the type X individual-Rm (movil range), “This type of control chart is particularly useful in the process control when only one observation is obtained by a lot or batch of material, at regular intervals of a process. This situation often arises when (a) sampling or testing are destructive, (b) expensive chemical analysis or physical evidence, and (c) the material sampled at any time (as in a batch) is normally quite homogeneous, as a well-mixed fluid or added” [24].
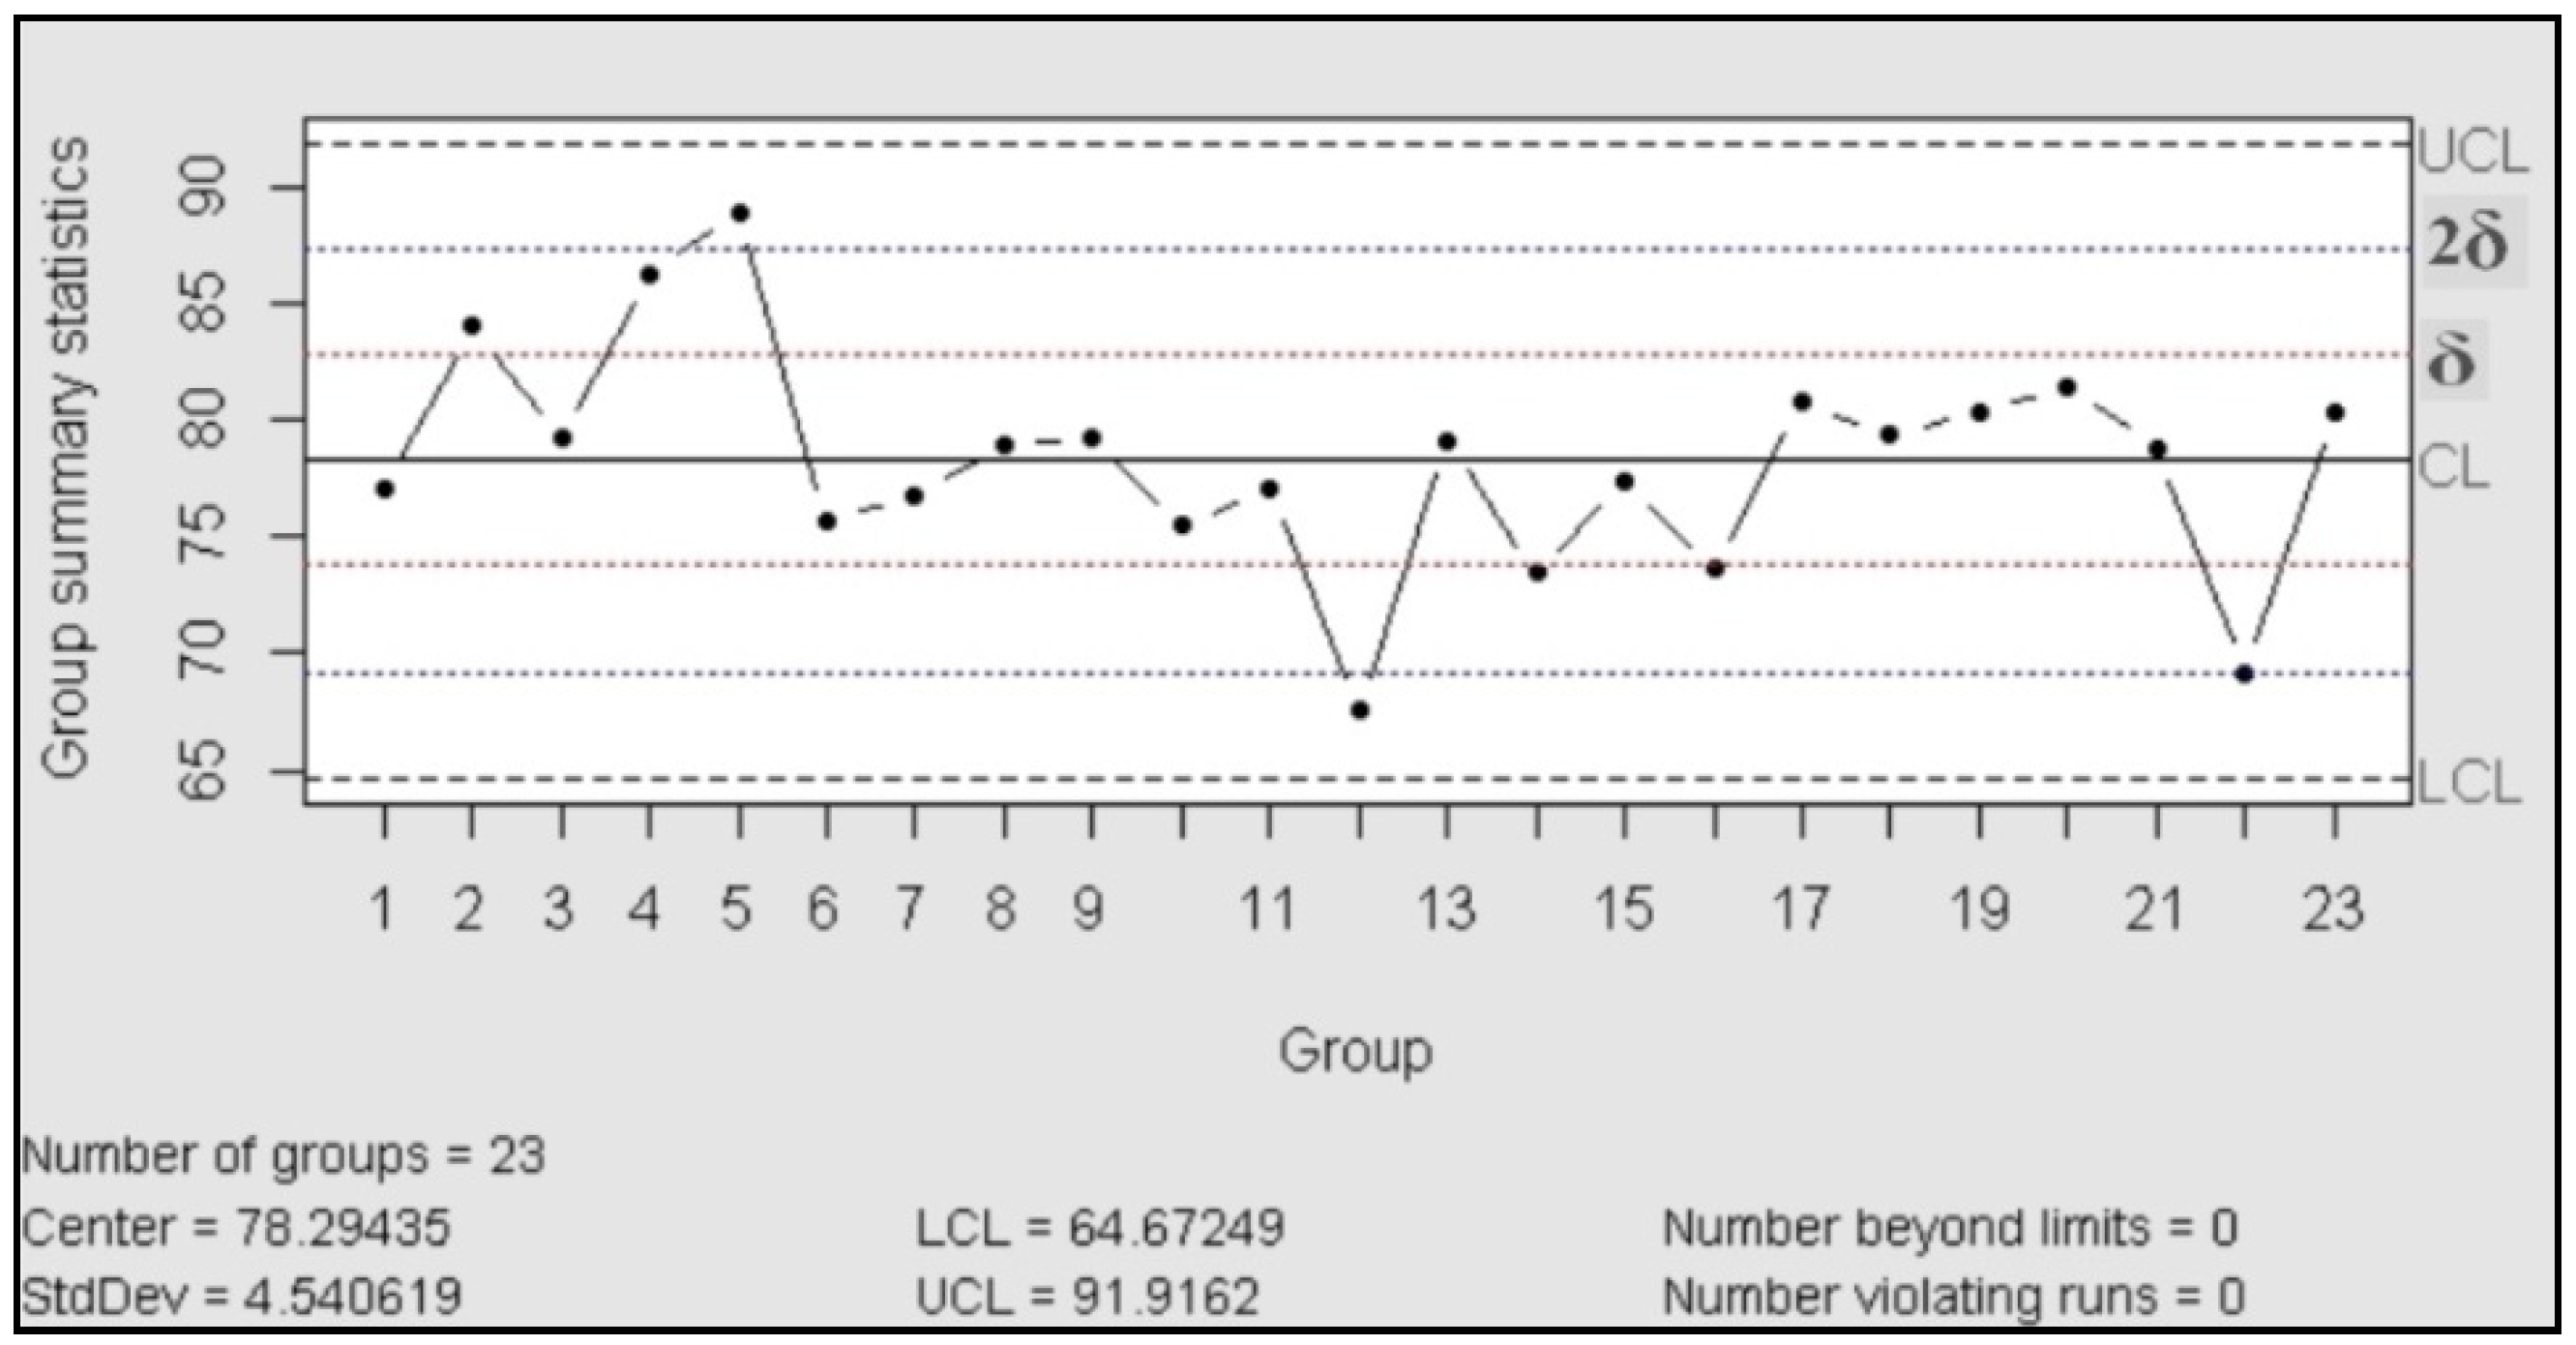
For the control chart assessment was necessary proved the normal distribution, for this was performed a test of normality with 23 assays (Shapiro Wilk: n = 23; p > 0.05)
Then the process was evaluated in accordance with the manual published| by the International Association ASTM, which exhibited the rules to follow for a correct control [24]. The result is that the process was under statistical control, in both charts (centralization and dispersion charts) did not recognize patterns or trends and the data behaved in random distribution.
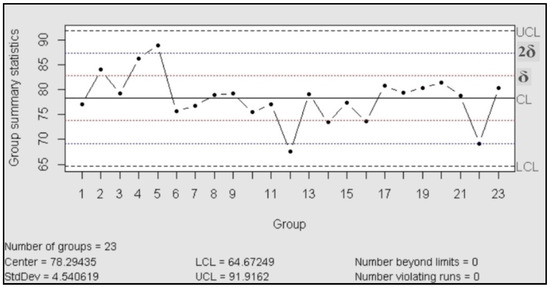
Figure 1.
Control chart (X individual).
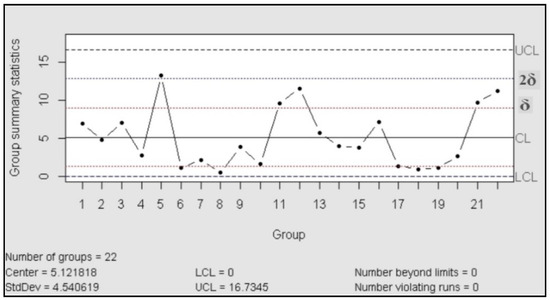
Figure 2.
Control chart (mobile range).
4. Conclusions
In conclusion, the desired product was obtained in quantitatively yield, without undesired by-products, and in short reaction times. It is important to mention that during the whole process most of the principles of green chemistry were fulfilled [25]. Additionally, the reaction was used, as an alternative method, to monitor the ultrasound equipment using the control chart methodology (Shewhart chart), which allowed us to study how a process changes over time.
According to the Taguchi method, the percentage contribution of each parameter was determined by ANOVA and the power is the only significant factor with 5% significance. It was found that if there is a decline in power will be reflected in the control charts.
Finally, the use of a model organic synthesis was of great value to evaluate the quality of an ultrasound probe.
Acknowledgment
This work was supported by INQUISUR-CONICET (Bahía Blanca, Argentina) and Universidad Nacional del Sur (Bahía Blanca, Argentina).
References
- Chtourou, M.; Abdelhédi, R.; Hédi Frikha, M. Solvent free synthesis of 1, 3-diaryl-2-propenones catalyzed by commercial acid-clays under ultrasound irradiation. Ultrason. Sonochem. 2010, 17, 246–249. [Google Scholar] [CrossRef] [PubMed]
- Li, J.; Yang, W.-Z.; Wang, S.-X.; Li, S.-H. Improved synthesis of chalcones under ultrasound irradiation. Ultrason. Sonochem. 2002, 9, 237. [Google Scholar] [CrossRef] [PubMed]
- Bhuiyan, M.M.H.; Hossain, M.I.; Mahmud, M.M.; Al-Amin, M. Microwave-assisted efficient synthesis of chalcones as probes for antimicrobial activities. J. Chem. 2008, 1, 21–28. [Google Scholar]
- Syam, S.; Abdelwahab, S.I.; Al-Mamary, M.A.; Mohan, S. Synthesis of chalcones with anticancer activities. Molecules 2012, 17, 6179. [Google Scholar] [CrossRef] [PubMed]
- Climent, M.; Corma, A.; Iborra, S.; Velty, A. Activated hydrotalcites as catalysts for the synthesis of chalcones of pharmaceutical interest. J. Catalysis 2004, 221, 474–482. [Google Scholar] [CrossRef]
- Ballini, R.; Bosica, G.; Ricciutelli, M.; Maggi, R.; Sartori, G.; Sartorio, R.; Righi, P. Clay-catalysed solventless synthesis of trans-chalcones. Green Chem. 2001, 3, 178–180. [Google Scholar] [CrossRef]
- Sebti, S.; Solhy, A.; Tahir, R.; Boulaajaj, S.; Mayoral, J.A.; Fraile, J.M.; Kossir, A.; Oumimoun, H. Calcined sodium nitrate/natural phosphate: an extremely active catalyst for the easy synthesis of chalcones in heterogeneous media. Tetrahedr. Lett. 2001, 42, 7953–7955. [Google Scholar] [CrossRef]
- Fuentes, A.; Marinas, J.M.; Sinisterra, J.V. Catalyzed synthesis of chalcones under interfacial solid-liquid conditions with ultrasound. Tetrahedr. Lett. 1987, 28, 4541–4544. [Google Scholar] [CrossRef]
- Climent, M.J.; Corma, A.; Iborra, S.; Primo, J.J. Base catalysis for fine chemicals production: Claisen-Schmidt condensation on zeolites and hydrotalcites for the production of chalcones and flavanones of pharmaceutical interes. J. Catal. 1995, 151, 60–66. [Google Scholar] [CrossRef]
- Saravanamurugan, S.; Palanichamy, M.; Arabindoo, B.; Murugesan, V. Liquid phase reaction of 2′-hydroxyacetophenone and benzaldehyde over ZSM-5 catalysts. J. Mol. Catal. A Chem. 2004, 218, 101–106. [Google Scholar] [CrossRef]
- Bing, W.; Wei, M. Recent advances for solid basic catalysts: Structure design and catalytic performance. J. Solid State Chem. 2019, 269, 184–194. [Google Scholar] [CrossRef]
- Li, J.; Yang, W.-Z.; Wang, S.-X.; Li, S.-H. Improved synthesis of chalcones under ultrasound irradiation. Ultrason. Sonochemestry 2002, 9, 237–239. [Google Scholar] [CrossRef] [PubMed]
- Bhuiyan, M.; Hossain, M.; Mahmud, M.; Al-Amin, M. Microwave-assisted Efficient Synthesis of Chalcones as Probes for Antimicrobial Activities. Chem. J. 2011, 1, 21–28. [Google Scholar]
- Palleros, D.R.J. Solvent-Free Synthesis of Chalcones. Chem. Educ. 2004, 81, 1345. [Google Scholar] [CrossRef]
- Polo, E.; Ibarra-Arellano, N.; Prent-Peñaloza, L.; Morales-Bayuelo, A.; Henao, J.; Galdámez, A.; Gutiérrez, M. Ultrasound-assisted synthesis of novel chalcone, heterochalcone and bis-chalcone derivatives and the evaluation of their antioxidant properties and as acetylcholinesterase inhibitors. Bioorg. Chem. 2019, 90, 103034. [Google Scholar] [CrossRef] [PubMed]
- BANDELIN Electronic. Sonoplus Manual; BANDELIN Electronic GmbH & Co. KG: Berlin, Germany, 2000. [Google Scholar]
- QSonica. Sonoplus Manual; QSonica: Newtown, CT 06470, USA, 2000. [Google Scholar]
- Neville, A.; McDougall, B. Erosion–and cavitation–corrosion of titanium and its alloys. Wear 2001, 250, 726–735. [Google Scholar] [CrossRef]
- Suwito, H.; Jumina, M.; Pudjiastuti, P.; Fanani, M.; Kimata-Ariga, Y.; Puspaningsih, N. Design and synthesis of chalcone derivatives as inhibitors of the ferredoxin—Ferredoxin-NADP+ reductase interaction of plasmodium falciparum: Pursuing new antimalarial agents. Molecules 2014, 19, 21473–21488. [Google Scholar] [CrossRef] [PubMed]
- Humberto Gutiérrez Pulido, M.O. Análisis y Diseños de Experimentos; McGraw-Hill: New York, NY, USA, 2008; p. 4. [Google Scholar]
- Mitra, A. Fundamentals of Quality Control and Improvement; Wiley-Blackwell: Hoboken, NJ, USA, 2016. [Google Scholar]
- Hernández, A. Apuntes de Diseño de Experimentos Taguchi; Universidad Nacional de Sur (UNS): Bahía Blanca, Argentina, 2015. [Google Scholar]
- Gopalsamy, B.M. Taguchi method and ANOVA: An approach for process parameters optimization ofhard machining while machining hardened steel. J. Sci. Ind. Res. 2009, 68, 686–695. [Google Scholar]
- ASTM. Manual on Presentation of Data and Control Chart Analysis; Neubauer, D., Ed.; ASTM: West Conshohocken, PA, USA, 2010. [Google Scholar]
- Anastas, P.T.; Warner, J.C. Green Chemistry: Theory and Practice; Oxford University Press: New York, NY, USA, 1998; Volume 19, pp. 21473–21488. [Google Scholar]


© 2020 by the authors. Licensee MDPI, Basel, Switzerland. This article is an open access article distributed under the terms and conditions of the Creative Commons Attribution (CC BY) license (http://creativecommons.org/licenses/by/4.0/).