Proceeding Paper

Fully Coupled Modeling of Athlete Force Application and Power Transfer in Rowing Ergometry †

Department of Mechanical Engineering, McMaster University, Hamilton, ON L8S 4L7, Canada
*
Author to whom correspondence should be addressed.
Presented at the 13th Conference of the International Sports Engineering Association, Online, 22–26 June 2020.
Proceedings 2020, 49(1), 108; https://doi.org/10.3390/proceedings2020049108
Published: 15 June 2020

Abstract

:
A fully coupled model of an athlete’s muscular force output combined with a load resistance is developed and investigated in context of ergometer rowing. The athlete force is based on a simple Hill equation hyperbolic-in-speed, and parabolic-in-length model. Coupling this force function with the dynamics of the ergometer load and inertia and athlete’s own body mass inertia produces a trajectory of the resultant motion in force-speed-length space. The coupled equations were solved using a first order time-marching procedure, and iteratively calculated starting conditions based on ergometer spin-down during the recovery period between strokes. The results agree well with experimental measurements available from Kleshnev particularly given the relatively simple, and untuned, athlete force model used. Changing the load resistance changed the trajectory of the stroke, with qualitative agreement with the expected outcomes.

1. Introduction

In rowing, the athlete’s supplied force to the oar effectively levers the boat past a relatively fixed position of the blade in the water. This leverage is affected principally by the “gearing” of the rigging—the lengths of the oar shaft inboard and outboard of the pin about which the oar rotates. The blade itself moves or “slips” in the water (rather than being effectively stationary) due to the blade shape and hydrodynamics of its motion. The resistance to this levering motion is the boat drag, mainly in the water, but there is an aerodynamic component, both of which have a force proportional to the velocity squared. How effective the athlete force is in propelling the boat is then a question of the match between the athlete force application (force-velocity-length relationship) and the geared boat drag acting as a load.
Combined athlete force-velocity relationships have been studied in cycling and rowing. Hartmann [1] and Sprague [2] tested athletes on rowing ergometers for maximal power over very short intervals (5–10 strokes, <15 s) measuring handle force, velocity and power. They saw force-velocity relationships that could be interpreted as either Hill-like hyperbolae or linear, with issues that data from different athletes and ergometer drag settings were not separated.
Similar work in cycling has mainly concentrated on determining an “optimal” cadence, so again there is little modeling of the coupling of the athlete power out to the load. Short duration maximal efforts under varying loads can give torque and power (which in cycling is simply the cadence × torque) versus cadence relationships to find the cadence of peak power e.g., Vanderwalle et al. [3]. For longer cycling intervals, there has been more concentration on the effort required to produce fixed powers under various cadences; attention has then focused on using measures of effort, such as VO2, HR, blood lactate and perceived effort [4,5,6].
The objective here is different than previous work as the intent is to develop and investigate a fully-coupled model of an athlete muscle force-velocity-length relationship with a model for the resistance of the athlete load in the context of rowing. As such, it is then analogous to the coupling done in more industrial applications such as motor (athlete) driven gearbox (rowing/ergometer gearing) connected to pumped load (the hydrodynamic resistance of a boat through the water). Here, we first consider a rowing ergometer-based model, removing the blade-slip hydrodynamic coupling of a blade in the water, which is analogous to a pump efficiency. Previous models by this group [7] have coupled rowing boat motion (drag forces and boat and rower mass accelerations) to blade forces, but still treated the athlete as a fully independent power source; a given experimentally observed handle speed, which when combined with a time varying boat velocity, gave a blade path through the water that was then used in a CFD(Computational Fluid Dynamics)-based blade force calculation. These blade forces, together with rower/boat mass acceleration calculations and boat drag force calculations, were used to calculate the time varying boat velocity needed previously. The solution was then obtained by iterating through enough strokes to eliminate starting conditions.
The Concept2 ergometer [8] is used extensively in rowing training and testing and is acknowledged to provide a good simulation of the rowing stroke [9]. It consists of a fan flywheel driven by a rower on a sliding seat. The rower pulls on a short section of oar handle using essentially the same technique as used in the boat. The oar handle is connected with a chain to a racket cog on the fan flywheel. The boat drag resistance is simulated by a fan aerodynamic resistance. Varying the damper on the inlet to this fan varies the torque-load relationship of the fan. The ergometer uses a clever technique continuously measuring only the instantaneous fan flywheel speed. Power input is determined by the fan flywheel angular acceleration, while the flywheel resistance is determined by the spin down rate of the flywheel during the recovery phase of the stroke between the athlete power applications.

2. Methods

2.1. Muscle Force-Velocity-Length Model

The quasi-steady F-v-l model of athlete force output is based on what is essentially a Hill Model of the muscle force Fapp as a hyperbolic function of velocity v [10,11] and parabolic function of length l [12]:
(Fmax + a) (v + b) = (Fiso + a) b,
Fapp(v,l) = 4 Fmax l (1 − l)
with parameters (Table 1) taken from lower limb [13] and squat [14] measurements. Here, the length l corresponds to the rower’s fractional body position relative to the muscles used through the entire stroke. The start of the stroke (the catch) is almost entirely a leg drive with the legs bent in what is essentially a very deep squat, which is here treated as a length l = 0.1. In mid-stroke, the leg drive is able to provide very large forces, as are the back muscles which are now fully activated. At the end of the stroke, the leg drive and back swing are finished and the force is provided only by the relatively weak arms pulling with a steadily lowering force as they reach the end of their range of motion at the chest, which is here treated as length l = 0.9. Obviously, a parabolic F(l) relationship is considerably simplifying the combination of leg, back and arm muscle forces as applied in the stroke technique, which is not uniform among athletes, coaches or national teams. Simply in terms of muscle application timing, the F(l) relationship will likely have a slightly more flat-topped curve that is shifted earlier in the rower’s position l (toward the initial leg drive). However, such a parabolic profile is a reasonable starting assumption without having a full experimentally mapped out F-v-l relationship, and an objective of this study is to evaluate whether such a simplified approach can be used to model the “athlete-as-a-power source”. It is acknowledged that such a simplified approach also does not include effects such as stimulation-activation, dynamic history and fast/slow twitch fiber force activation, but the relatively long duration of rowing events and the stroke itself (at the rate of 30 strokes/min here, the power phase is almost exactly 1 s) means these factors have minimal effect.
The ergometer fan resistance and characteristics are modeled as by Concept2 [8] as a wheel with a moment of inertia I and an aerodynamics resistance giving a torque Taero as:
Taero (k,ω) = k·ω2,
where k is determined from the Concept2 ergometer’s drag factor parameter. A 14-tooth ratcheted cog on the 1/4” pitch chain transfers the handle velocity (v in Equation (1)) to the fan flywheel rotational speed (ω in Equation (2)).
A time marching procedure is used to step through the muscle force—ergometer resistance model. From an initial fan RPM and rower muscle position, the linear handle velocity and the effective fractional muscle position (l) are respectively obtained. These parameters are then input to the overall F-v-l model to give an athlete force. The force required to accelerate the mass of the rower is subtracted from the athlete force to give a force input to the ergometer handle; the rower centre of mass acceleration could be estimated from the rower muscle position (and so then ultimately to the handle position), however, here it was simply based on the rower trunk speed as measured by Kleshnev [9] (as simply +2 m/s2 for the first half of the stroke and −2 m/s2 for the second—these accelerations correspond to forces of only ±144 N, considerably smaller than the peak force of approx. 800–1000 N). This handle force (given the cog gearing, as a torque) is then combined with the ergometer fan flywheel aerodynamic resistance Taero to give a net torque accelerating the fan flywheel. With the flywheel inertia, an incremental change in RPM is calculated, which then provides the fan RPM for the next time step. Similarly, the handle (rower) position is updated for the next time step. Sufficiently fine time steps (0.01 s) were tested to ensure that the solution is time step independent. Finally, the initial fan RPM used was modified by allowing the fan flywheel to decelerate with the same stepwise aerodynamic torque calculation for the recovery phase fraction of the stroke. The time of this recovery phase was kept constant for all cases examined here, and matched that from the Kleshnev [9] data.
The current model does not account for the rower and handle velocity starting at zero, which on the ergo is allowed by a ratchet on the cog connecting the chain to the fan flywheel. While the handle speed is less than that corresponding to the fan flywheel speed, all of the rower force goes to accelerating that handle speed. As can be seen in the next section, the time of this engagement is about 0.10–0.15 s out of a total power stroke time of about 1 s.

2.2. Kleshnev (2006) Measurements

Measurements are taken from Kleshnev [9] who measured Concept2 rowing of five female rowers (average height 1.80 ± 0.04 m and weight 72.2 ± 3.6 kg). This data set was used as it also includes a range of other measurements including the handle velocity and a breakdown of leg, trunk and arm speeds. A plot of handle force and speed as taken from Kleshnev is shown in Figure 1, together with an obtained force-handle speed relationship.

3. Results and Discussion

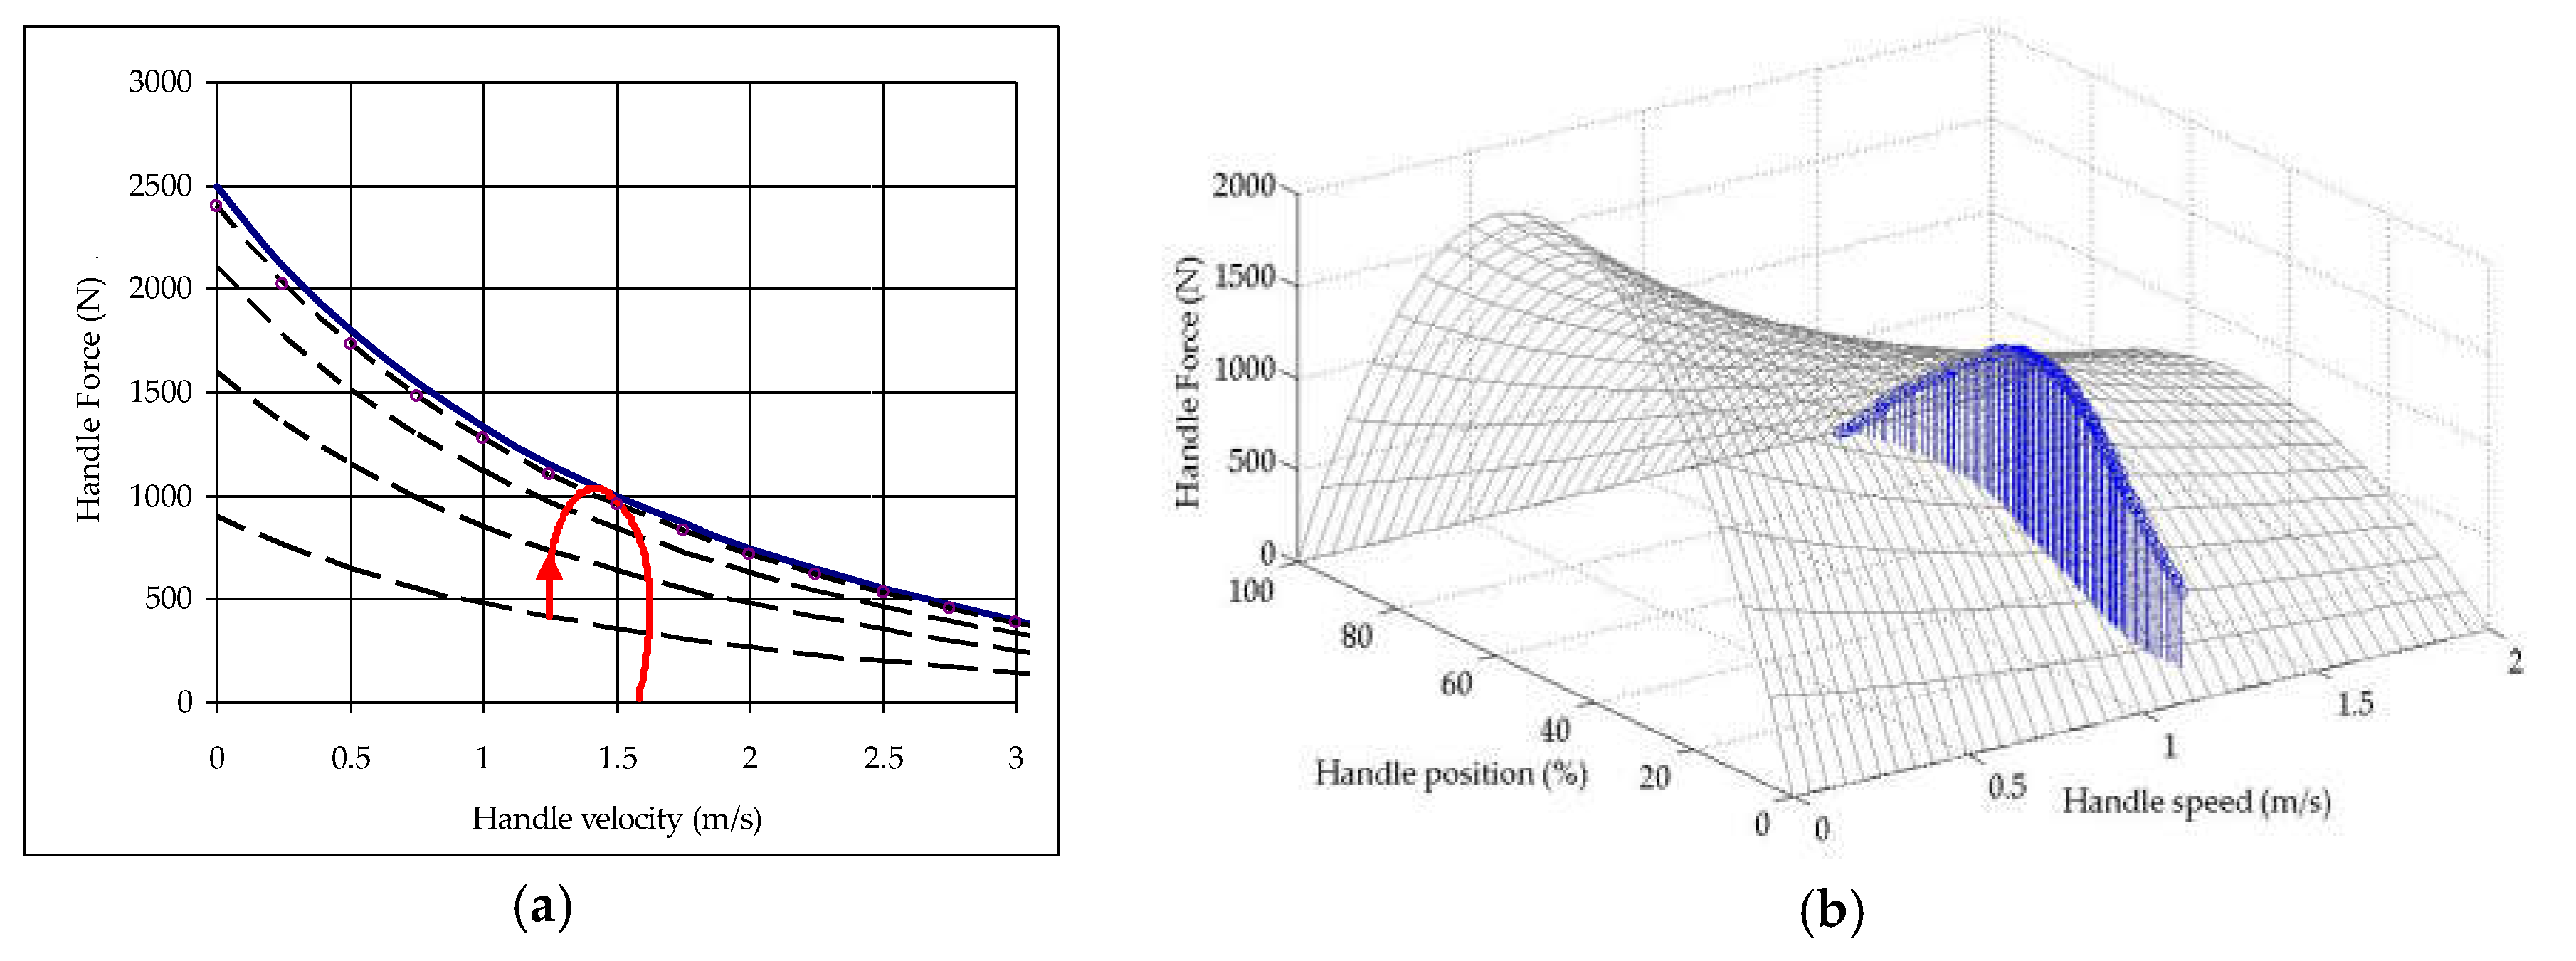
Figure 2 shows the results of the coupled athlete F-v-l model and the ergometer resistance model. In Figure 2b, the athlete F-v-l model maximal force surface can be seen, and the actual stroke “trajectory” over this surface obtained from the athlete force coupled with the ergometer aero drag, and flywheel and rower mass inertias. From the initial fan flywheel and handle velocity, the relatively low athlete force (due mainly to the effect of rower position l) results in very little increase in fan flywheel speed. As the rower’s leg drive and trunk/back muscle activation become fully engaged, the rower’s available force increases, but the handle speed still does not increase substantially as the increased handle force is absorbed by the inertia of the flywheel’s acceleration and the fan aerodynamic (2) resistance. The handle force increases to a maximum of about 1000 N, slightly (16%) greater than that seen in the Kleshnev measured data. Now the fan flywheel (and handle speed) does increase, but only by about 30%, again agreeing with the small handle speed increase seen by Kleshnev. Later in the stroke, the handle force decreases (as incorporated by the larger rower position l values), and, in what is almost the opposite of that seen in the early part of the stroke, the flywheel inertia and decreasing aero resistance allow the fan flywheel and handle speeds to remain relatively steady.
The overall behavior of the modeled handle force-velocity relationship agrees qualitatively well with the relationship obtained from the Kleshnev measurements, and it should be noted that the model parameters were not specifically tuned to improve the comparison. The main discrepancy seen is that the overall handle speeds are lower (1.25–1.6 m/s) than those measured (1.5–1.8 m/s). This could result from either the athlete F-v-l model: increasing the athlete force (increasing Fiso) does increase the handle speeds, but we see a further increase in the already slightly overestimated maximum handle force. Tuning the other F-v-l model parameters without changing the peak handle force (i.e., the details of the shape of the force surface seen in Figure 2b) does not change the results significantly.
Tuning the ergo model parameters does change the athlete-experienced load, so then the handle force-speed curve. Increasing the fan flywheel moment of inertia, as expected, decreases the handle acceleration so the difference between the minimum and maximum handle speeds is slightly decreased, but without significantly changing the peak force handle speed—basically, the flywheel inertia has a much smaller effect than the fan aerodynamic load. The handle chain to flywheel cog could also be changed, changing the gearing relationship between handle and flywheel speeds, and so significantly shifting the F-v-l model trajectory. Here, this gearing is kept fixed, but it was actually how load was adjusted in the earlier versions of the Concept2 ergometer.
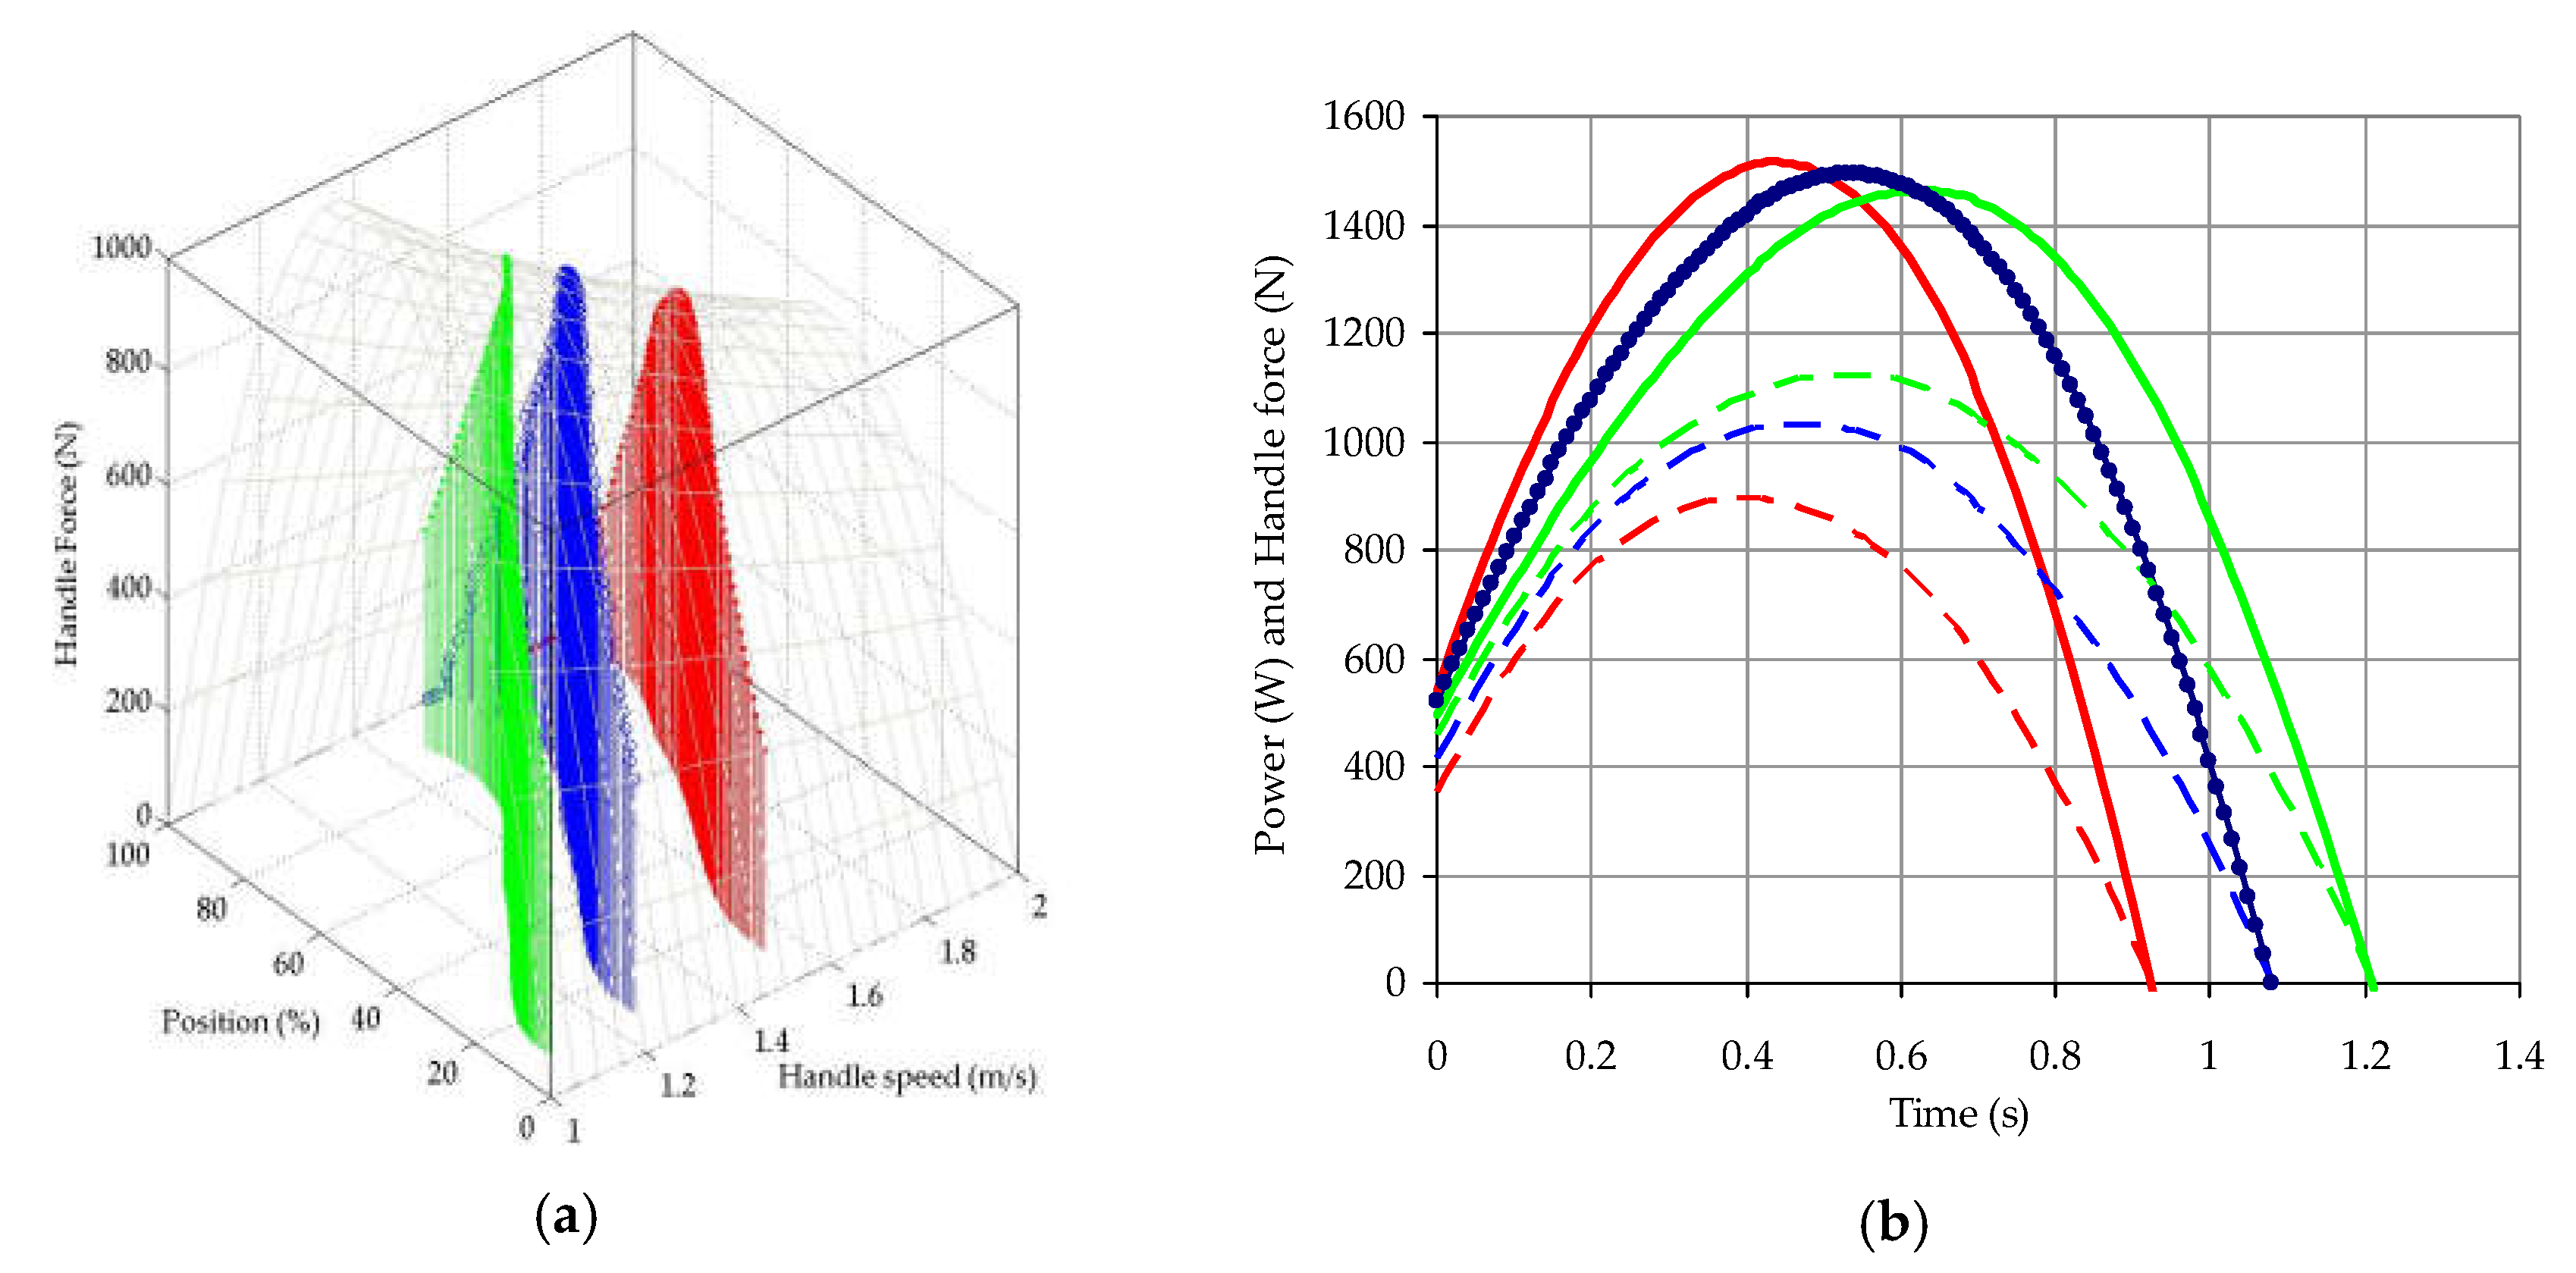
With current Concept2 ergometers, the resistance is set by the fan damper as the aero drag factor k, and the results of doing this on the coupled model are shown in Figure 3. As expected, increasing the aero drag factor increases the peak force as the trajectory is shifted toward lower handle speeds, exactly analogous to a cyclist experiencing a strong headwind without changing gears. During the stroke recovery (between power strokes), the fan flywheel also decelerates faster, keeping the RPM and handle speeds lower. Details of the stroke F-v-l trajectory also change—here, the relative effect of athlete and flywheel inertia are less, and with the lower starting speed, the speed increase early in the stroke is more prominent. The time evolutions of the handle forces clearly show the increased peak force and increased stroke time required with the increased fan resistance. The peak athlete powers are close (mainly due to the Hill relationship of F∝1/v) with discrepancies due to time (and the length l) alignments of force and speed, as well as the varying amounts of power going into athlete and flywheel accelerations.

4. Conclusions

The coupling of an athlete’s muscular force output as a F-v-l model has been successfully coupled to a load resistance model in ergometer rowing. The results with an untuned athlete force (a simple Hill equation hyperbolic-in-speed, and parabolic-in-length) model produce a trajectory in F-v-l space that agrees well with experimental measurements available from Kleshnev [9]. More accurate athlete force models could be obtained from specific measurements that would effectively map out the F-v-l surface that the athlete can provide for that specific athletic motion (here, the rowing ergometer stroke). Changing the load resistance changes the trajectory of the stroke, with qualitative agreement with the expected outcomes.
Being able to incorporate an “athlete-as-a-power source” in a fully coupled manner with a sports engineering model of the sport/equipment load/resistance will provide huge benefits. These include adapting equipment for the specific force output that an athlete can provide—examples include the gearing of oar lengths and rigger pivot locations in rowing; and possible variation in athlete technique to provide better co-ordination of peak force application with the most favorable load conditions (an example in rowing would be fore-aft positioning of the oar pivot location to match peak force with peak propulsive efficiency). Equipment design would also benefit from such coupled models—by seeing how the athlete can respond to the design (and hence, load) changes, the true effects can be evaluated.

Acknowledgments

Funding was provided by the Natural Sciences Engineering Research Council of Canada.

Conflicts of Interest

The authors declare no conflict of interest. The funding sponsors had no role in the study design; collection, analyses, or interpretation of data; the writing of the manuscript, nor the decision to publish.

References

  1. Hartmann, U.; Mader, A.; Wasser, K.; Klauer, I. Peak force, velocity, and power during five and ten maximal rowing ergometer strokes by world class female and male rowers. Intl. J. Sports Med. 1993, 14, S42–S45. [Google Scholar] [CrossRef] [PubMed]
  2. Sprague, R.C.; Martin, J.C.; Davidson, C.J.; Farrrar, R.P. Force–Velocity and Power–Velocity Relationships during Maximal Short-Term Rowing Ergometry. Med. Sci. Sports Exerc. 2007, 39, 225–230. [Google Scholar] [CrossRef] [PubMed]
  3. Vandewalle, H.; Peres, G.; Heller, J.; Panel, J.; Monod, H. Force-velocity relationship and maximal power on a cycle ergometer. Eur. J. Appl. Physiol. 1987, 56, 358–364. [Google Scholar] [CrossRef] [PubMed]
  4. Coast, J.R.; Cox, R.H.; Welsh, H.G. Optimal pedalling rate in prolonged bouts of cycle ergometry. Med. Sci. Sports Exerc. 1986, 18, 225–230. [Google Scholar] [CrossRef] [PubMed]
  5. Marsh, A.P.; Martin, P.E.; Foley, K.O. Effect of cadence, cycling experience, and aerobic power on delta efficiency during cycling. Med. Sci. Sports Exerc. 2000, 32, 1630–1634. [Google Scholar] [CrossRef] [PubMed]
  6. Ansley, L.; Cangley, P. Determinants of ‘‘optimal’’ cadence during cycling. Eur. J. Sport Sci. 2009, 2, 61–85. [Google Scholar] [CrossRef]
  7. Sliasas, A.; Tullis, S. The dynamic flow behaviour of an oar blade in motion using a hydrodynamics-based shell-velocity-coupled model of a rowing stroke. Proc. Inst. Mech. Eng. Part P J. Sports Eng. Technol. 2010, 224, 9–24. [Google Scholar] [CrossRef]
  8. Concept2 Ergometers. Available online: www.concept2.com/indoor-rowers (accessed on 30 September 2019).
  9. Kleshnev, V. Comparison of on-water rowing with its simulation on Concept2 and Rowperfect machines. In Proceedings of the International Society of Biomechanics in Sports XXIII Conference, Beijing, China, 22–27 August 2005; pp. 130–133. [Google Scholar]
  10. Hill, A.V. The heat of shortening and the dynamic constants of muscle. Proc. R. Soc. B 1938, 126, 136–195. [Google Scholar]
  11. Huijing, P.A. Muscle as a collagen fiber reinforced composite: A review of force transmission in muscle and whole limb. J. Biomech. 1999, 32, 329–345. [Google Scholar] [CrossRef]
  12. Gordon, A.M.; Huxley, A.F.; Julian, F.J. The variation in isometric tension with sacromere length in vertebrete muscle fibres. J. Physiol. 1966, 184, 170–192. [Google Scholar] [CrossRef] [PubMed]
  13. Wickiewicz, T.L.; Roy, R.R.; Powell, P.L.; Perrine, J.J.; Edgerton, V.R. Muscle architecture and force-velocity relationships in humans. J. App. Physiol. 1984, 57, 435–443. [Google Scholar] [CrossRef] [PubMed]
  14. Rahmani, A.; Viale, F.; Dalleau, G.; Lacour, J. Force/velocity and power/velocity relationships in squat exercise. Eur. J. Appl. Physiol. 2001, 84, 227–232. [Google Scholar] [CrossRef] [PubMed]
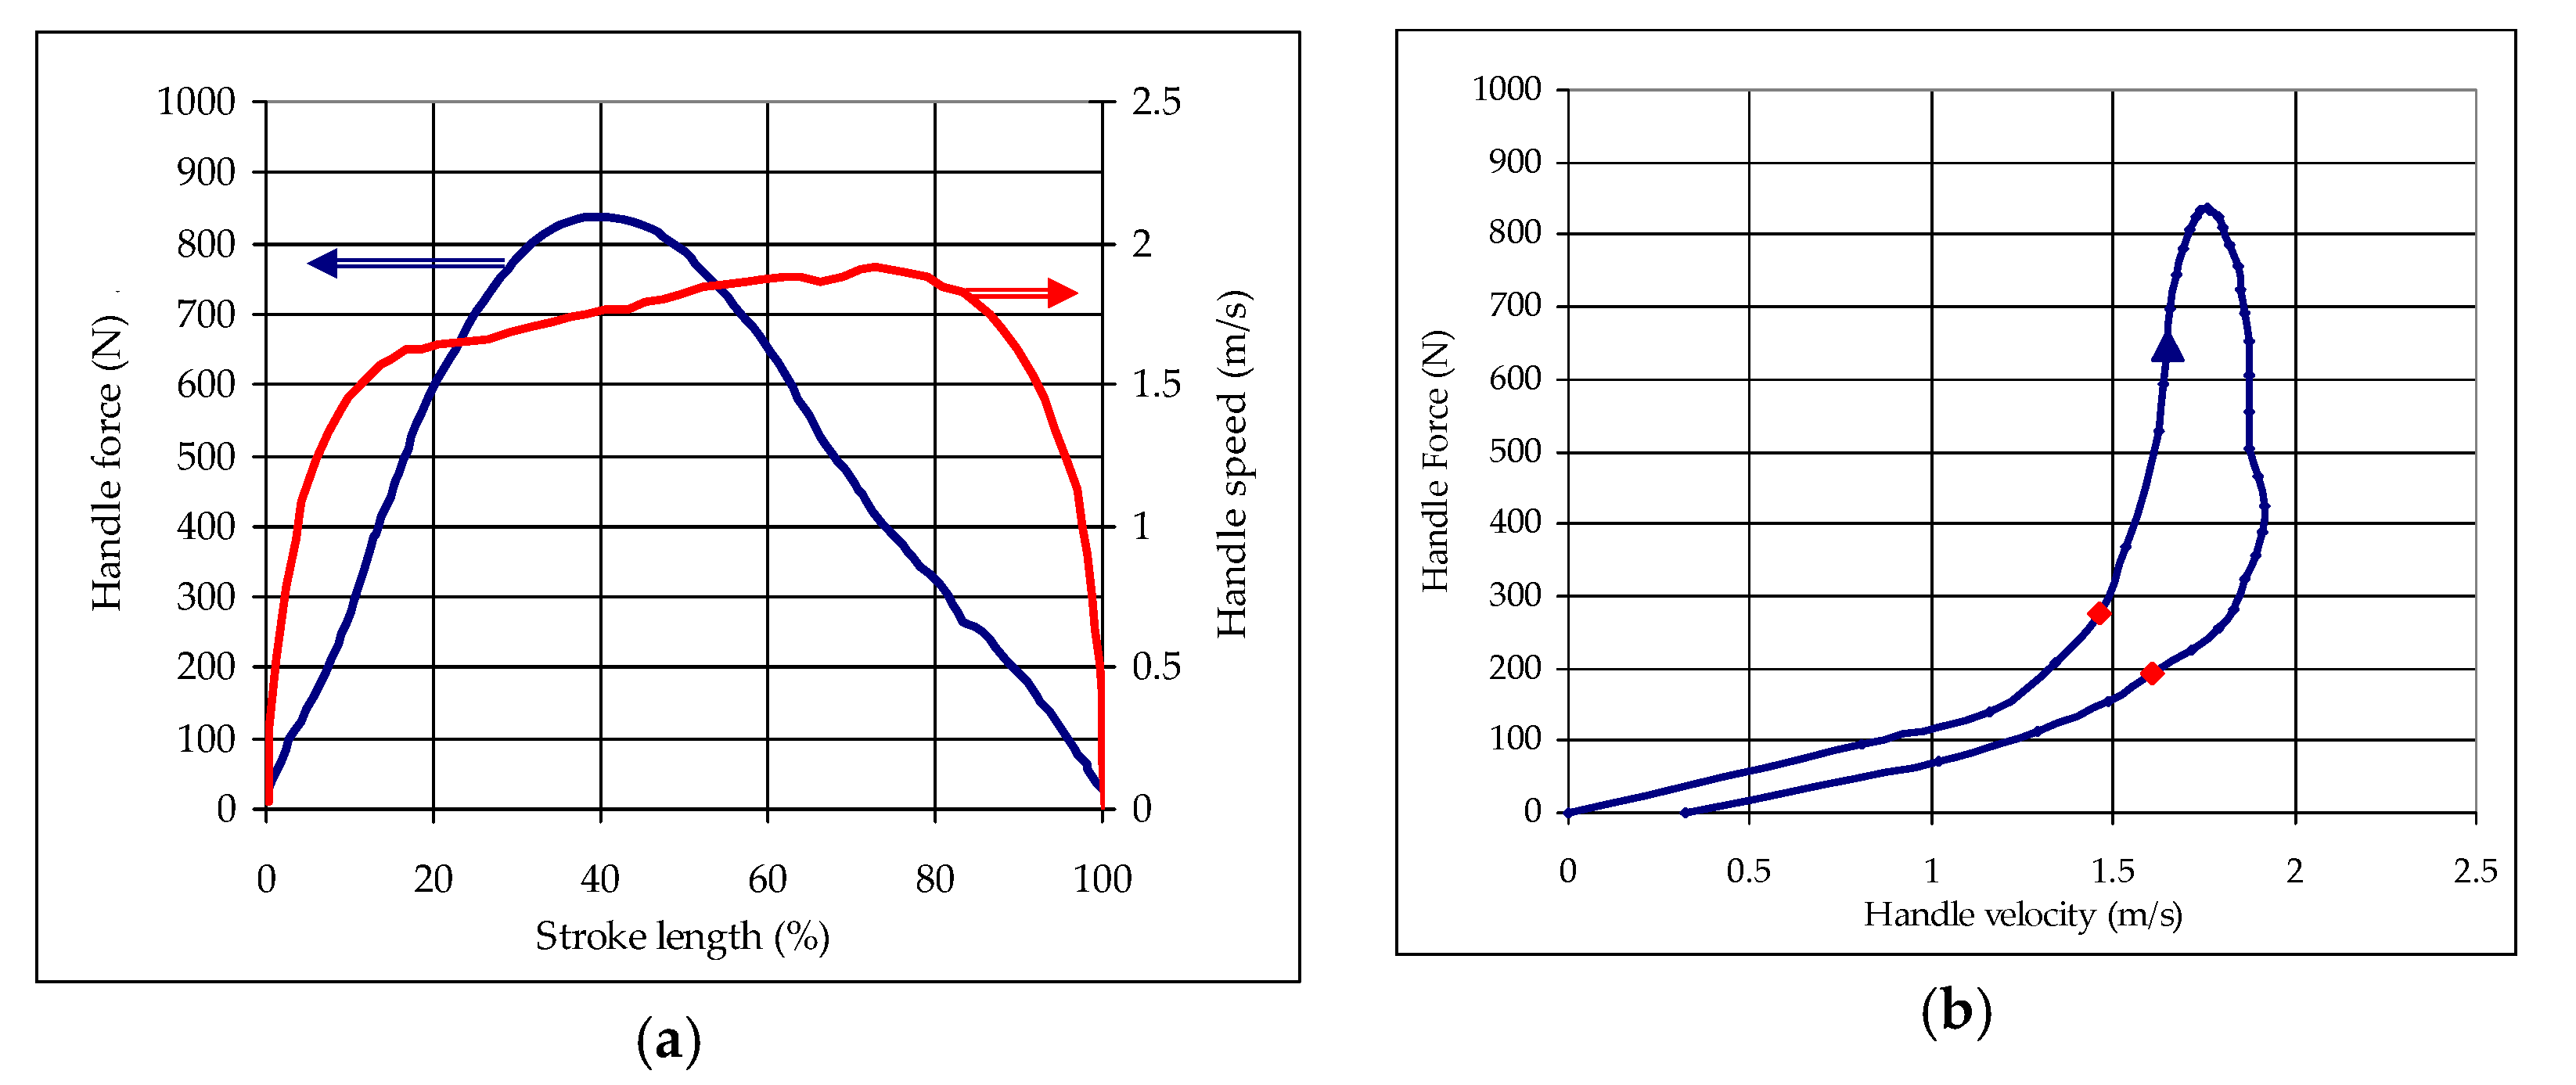
Figure 1. Concept2 ergometer rower force-speed relationships with raw data from Kleshnev [9]. Average of five female athletes, with a drive time of 0.97 s (32.1 strokes/min). (a) Handle force (N) and speed (m/s); (b) Force-speed relationship. The arrow shows the time progression direction, and the red markers, the first and last 10% of the stroke length (where the handle speed is less than the corresponding fan flywheel rotation velocity).
Proceedings 49 00108 g001
Figure 2. Coupled athlete F-v-l model with the ergometer resistance model. (a) Black hyperbolae show the athlete F-v-l relationship (the top solid line is the Fmax-v curve, while the successively lower dashed curves are parabolic decrements as the rower “position” l diverges from the peak. In red is the coupled result, with time progression given by the arrow. (b) The same plot as a 3D trajectory on the surface of athlete maximal muscle force application. Time progression is in the direction of increasing handle position.
Proceedings 49 00108 g002
Figure 3. Effect on ergometer aerodynamic resistance on the coupled athlete F-v-l model—ergometer resistance model. Different ergometer aerodynamic resistances (k) of 0.0005 (red), 0.001 (blue, as in Figure 2), and 0.0015 (green) are shown. (a) 3D (F-v-l) trajectory of the handle force and velocity through the rowing stroke. In light grey is the envelope of the athlete’s (F-v-l) available output. (b) Time evolution of applied power (solid lines) and handle force (dashed lines) through a stroke.
Proceedings 49 00108 g003
Table 1. Model parameters.
Hill Model ParameterValueErgometer ParameterValue
Fiso2500 NFlywheel rotational inertia (I)0.2 kg·m2
a1000 NAerodynamic drag factor (k)0.001 Nm·s2
b2 (m/s)Ratchet cog gearing61.8 rad/s per m/s
lcatch0.1Athlete mass72.2 kg
lfinish0.9
Publisher’s Note: MDPI stays neutral with regard to jurisdictional claims in published maps and institutional affiliations.