Abstract
Variability in the running surface can cause an athlete to alter their gait. Most literature report running on grass, a treadmill or athletics running tracks using inertial sensors. This study compares the signals obtained by 9 degrees of freedom (DOF) inertial-magnetic sensors incorporating an accelerometer (±16 g), gyroscope (±2000°/s) and magnetometer (±8 gauss). The sensors were placed on the participant’s shank, knee, lower spine and upper spine, and the participants were asked to run on three different surfaces (running track, hard sand and soft sand). The calculated player loads for a 400 m run on each surface type was very similar. The mean and standard deviation values were 577 ± 130, 581 ± 128, 568 ± 124 for soft sand, hard sand and the running track, respectively. This did not correlate with the participant’s self-assessment RPE (Rate of perceived exertion), which demonstrated running on soft sand to be significantly more challenging, yielding a mean and standard deviation of 5.3 ± 2.5 (Hard to Very Hard). Soft sand running had a decreased swing time duration but increased variability (0.44 ± 0.02 s—Swing Time, 6.5 ± 1.1%—CV), hard sand running had the longest swing and intermediate variability duration (0.46 ± 0.02 s—Swing Time, 3.30 ± 2.58 %—CV) and running track running had the medium swing time but lowest variability (0.45 ± 0.02 s, 2.7 ± 0.9%—CV). Gait dominance was not consistent across the surfaces for each participant and remained below a ratio of 0.4. These results provide an insight into how athletes modify their gait mechanics to accommodate different running surfaces.
1. Introduction
An athlete’s running gait is a significant indicator of performance. Optimal running biomechanics requires synchronous movements of all components in the kinetic chain [1]. Wearable inertial sensors have been adopted as an inexpensive tool for athlete monitoring [2,3,4] and can be used to analyse gait features such as symmetry, stride, step and stance durations, and differences between walking and running profiles [5,6,7,8]. The majority of reported investigations were conducted on grass, a treadmill or athletics running track [9,10].
A review of the scientific literature pertinent to sand training [11] concluded that the sand surface, compared to firmer surfaces, offers higher energy cost and lower impact-training stimulus. Only one manuscript reported the use of inertial sensors in a sand-surface setting [12]. The investigation focused more on the design and development of the sensor network rather than differences observed in the gait features due to the surface.
The purpose of this study is to compare the signals obtained by 9 degrees of freedom (DOF) inertial-magnetic sensors placed on the participant’s shank, knee, lower spine and upper spine when running on three different surface types: a running track, wet (saturated) compacted sand (stiffness—97(32) kN/m) and dry uncompacted (soft) sand (stiffness—13(2) kN/m). The stiffness of the sand surfaces were quantified in a companion paper using a penetrometer [13]. This research can benefit coaches and athletes involved in sand-based sports and in the development of training schedules in other sports or rehabilitation that intend to implement sand-surface in their programs.
2. Materials and Methods
2.1. Materials
Four identical 9 DOF inertial measurement unit (IMU) (SABELSense, Griffith University, Nathan, Australia) sensors (250 Hz, ±16 g accelerometer, ±2000°/s gyroscope, ±7 Gauss magnetometer, 23 gr weight) were attached to each participant using Velcro™ bands and a specially designed sport harness with a sensor pocket located in close proximity to the third thoracic vertebrae (T3). The IMU sensors were calibrated [14] before the trial and data was logged locally to a micro SD card.
2.2. Methods
Seven healthy participants (4 M, 3 F) consented to participate in the study (ethics approval number: GU 2017/587) (Table 1). The IMU units were postioned above the right medial malleolous (shank), on the lateral right knee and in close proximity to the lumbar spine. Another IMU unit was tightly fitted in close proximity to the T3. The sensors were activated simultaneously and the participant was instructed to run 400 m at a light-moderate pace on soft sand. The participant then ran 400 m back at a light-moderate pace on hard sand. The procedure was repeated on an international standard synthetic tartan surfaced 400 m running track. Each participant was asked for a rate of perceived exertion (RPE) score after completing the run. The RPE scale used was the Borg’s CR10-scale modified by Foster et al. [15,16].

Table 1.
Participant Profile.
3. Results
3.1. Player Load
Player load (PL) can be integrated into periodization models to help optimise training schedules. PL was developed by Catapult (www.catapultsports.com/) with the Australian Institute of Sport (AIS) and uses the cumulative instantaneous rate of change of acceleration in three directions of movement (forward, up, side) to quantify the work rate of an athlete [17]. The expression is then divided by a scaling factor and it is given by
where ax is the forward acceleration, ay is the side acceleration, az is the up acceleration and SF is the scaling factor.
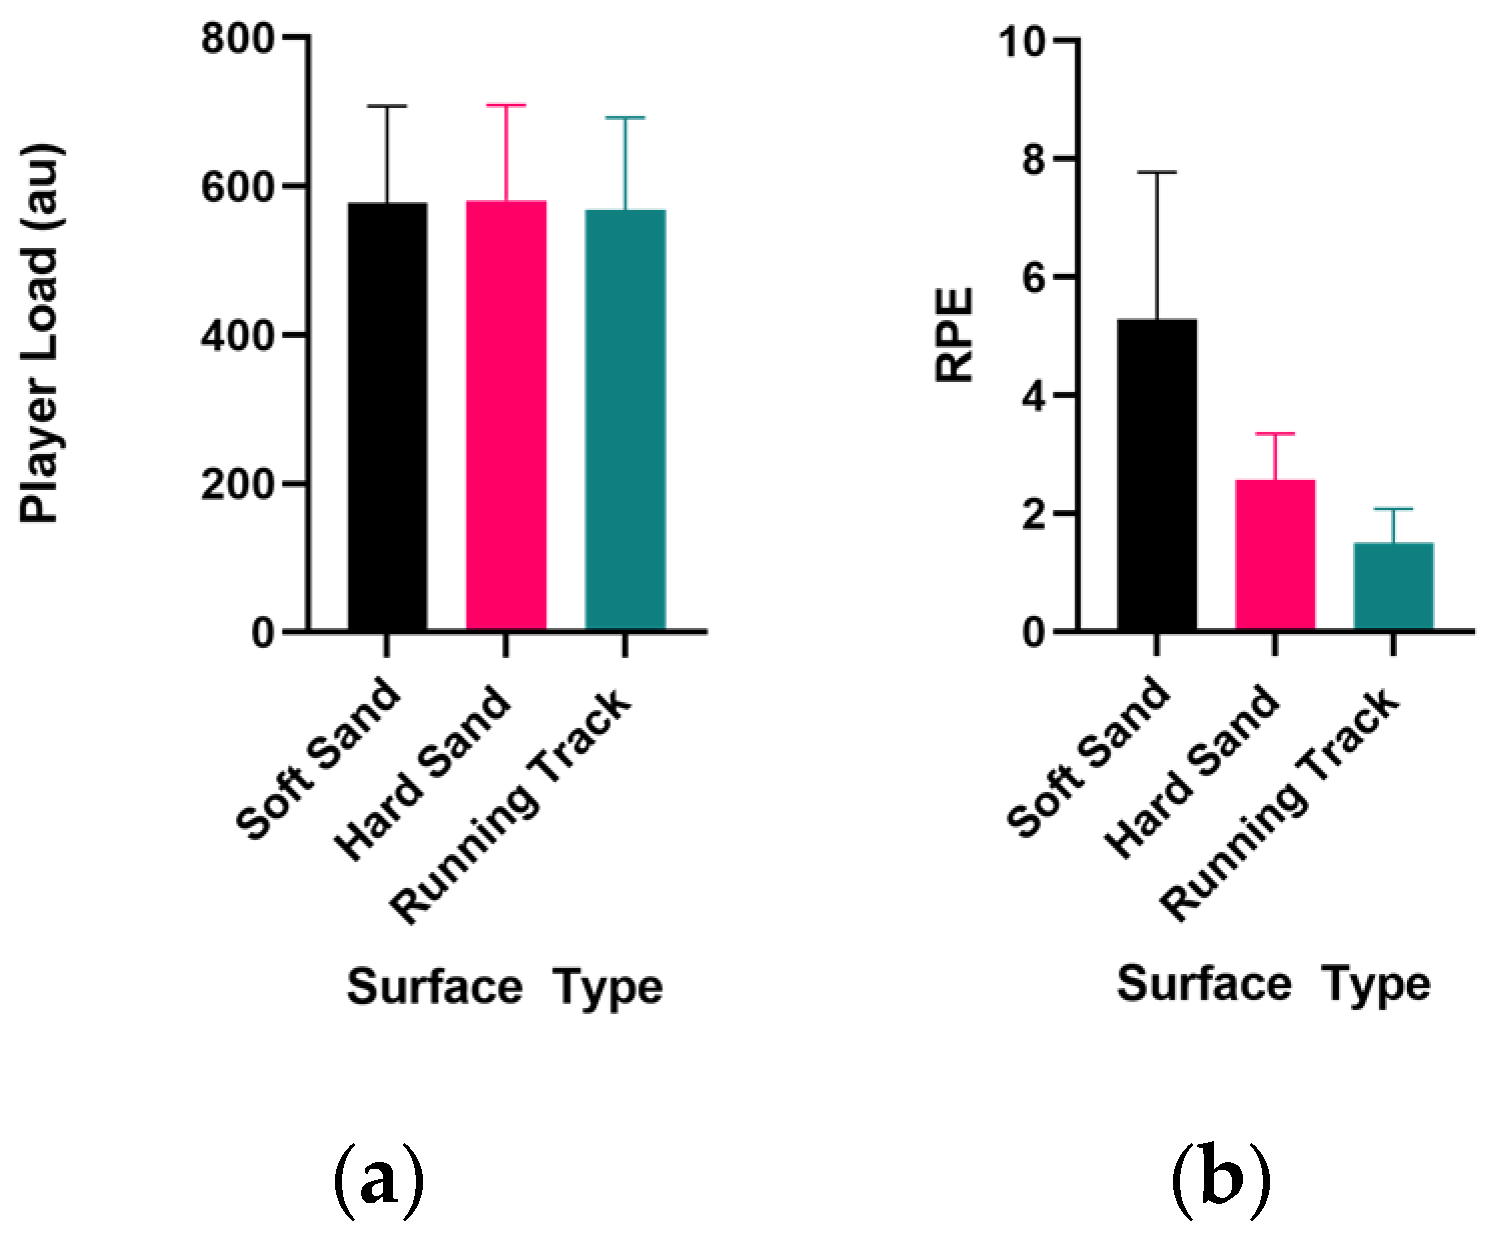
The player load was calculated over a 400 m distance for each running surface using the T3 mounted IMU and a scaling factor of 100. The mean and standard deviation of PL and RPE for each surface type and for all participants are shown in Figure 1.
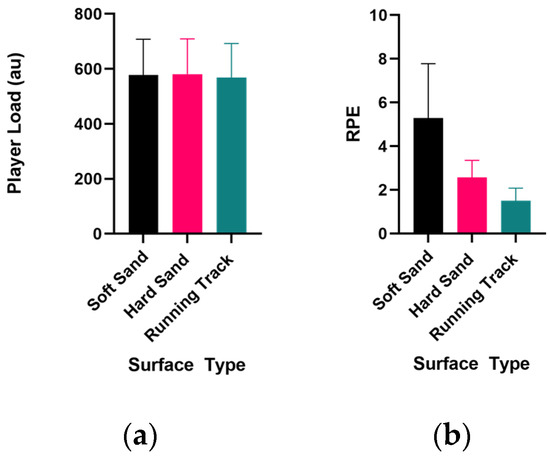
Figure 1.
(a) Mean Player load (PL) and standard deviation bar calculated for each surface type; (b) Mean values of the self-assessed RPE and standard deviation bar calculated for each surface type.
3.2. Gait Analysis
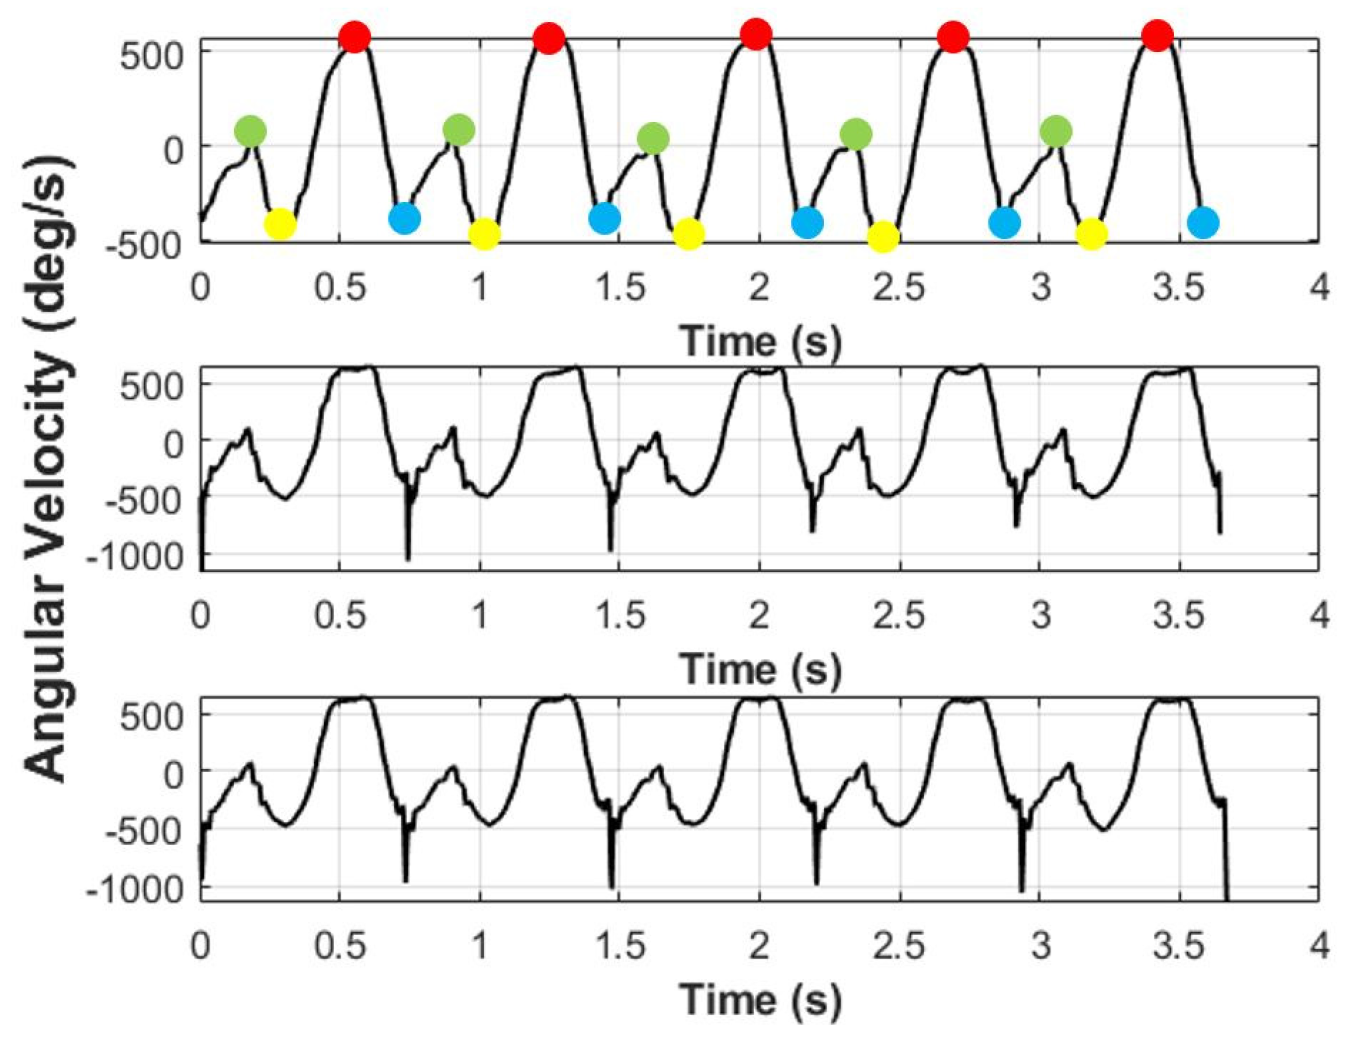
The IMU sensor positioned on the participant’s shank was used to generate running gait profiles for each different surface (Figure 2). Running gait features are easily identifiable in the peaks and troughs of the gyroscope signal measuring the angular velocity about the mediolateral axis of the shank [18,19].
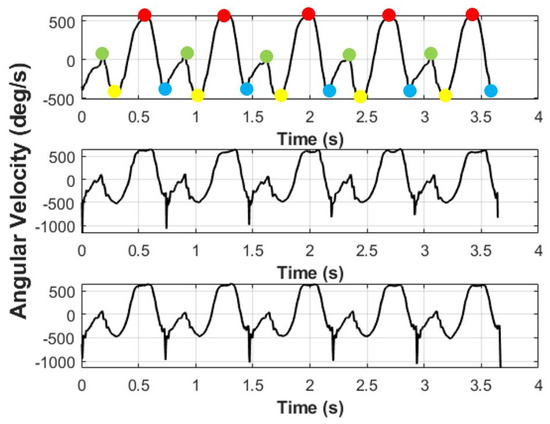
Figure 2.
Gyroscope running gait profile for soft sand (top), hard sand (middle) and running track (bottom) (participant 1); green circle = full contact (FC), yellow circle = terminal contact (TC), red circle = mid-swing (MS) and blue circle = initial contact (IC).
The reproducibility of the gait cycle signal for each running surface have observable differences between each surface type: particularly between the soft sand and the other two surfaces. A notable difference is seen at the initial contact (IC) point. For hard sand and track running, the initial contact point registers a high angular velocity, spiking towards troughs of −1000°/s, where-as for the soft sand surface, the initial contact point shows a much lower value of angular velocity.
3.2.1. Swing Time
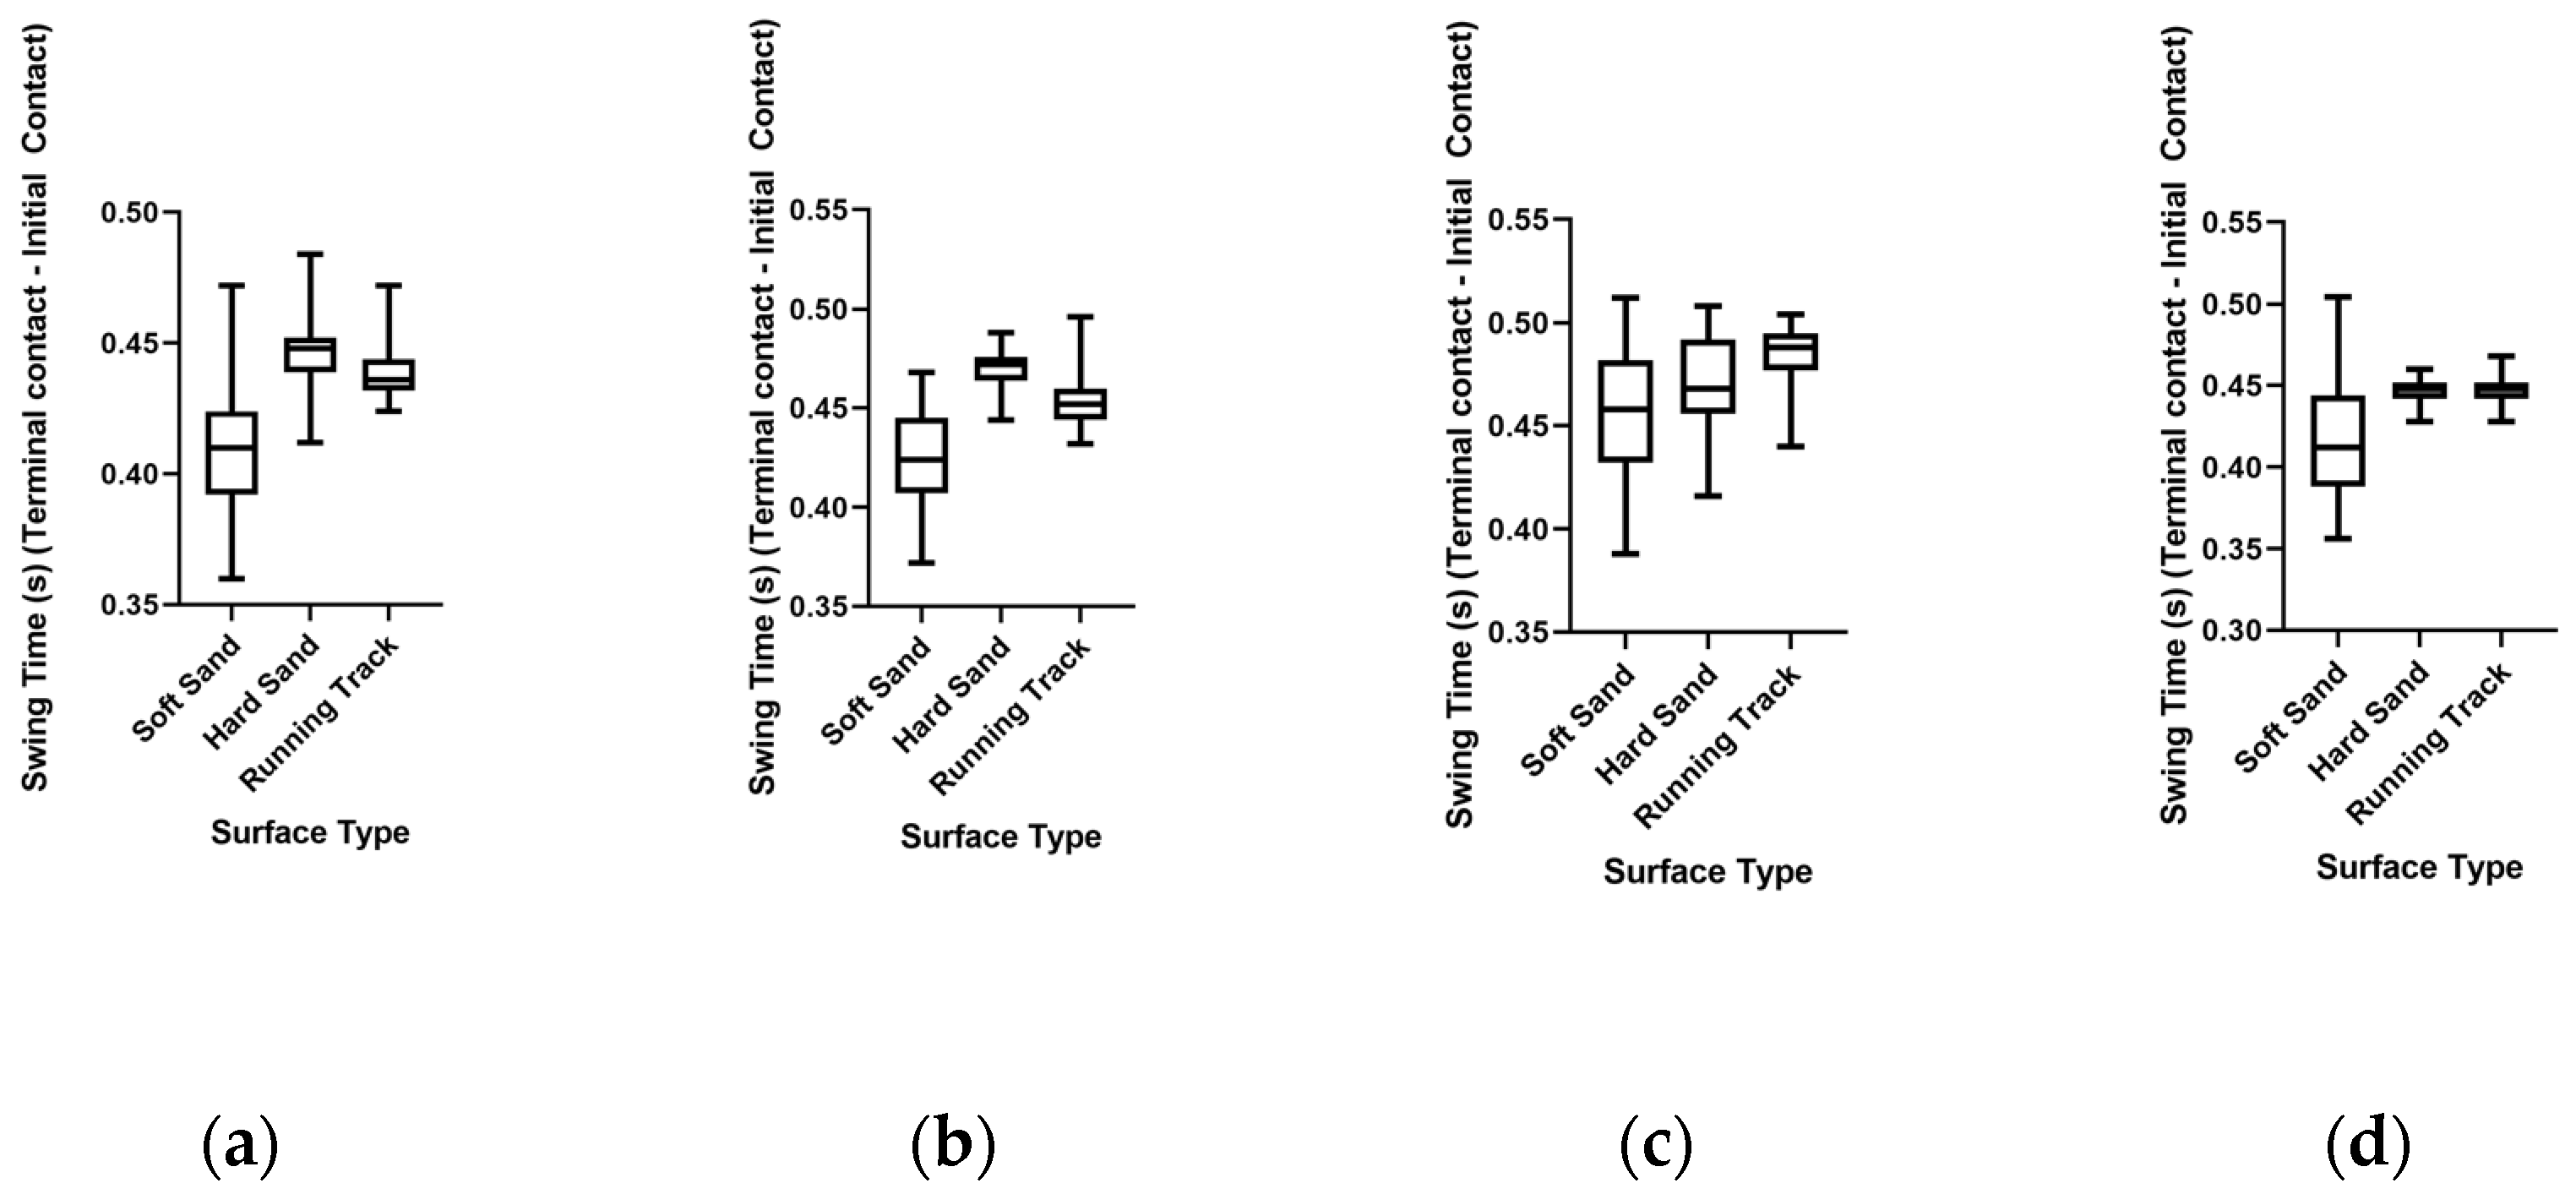
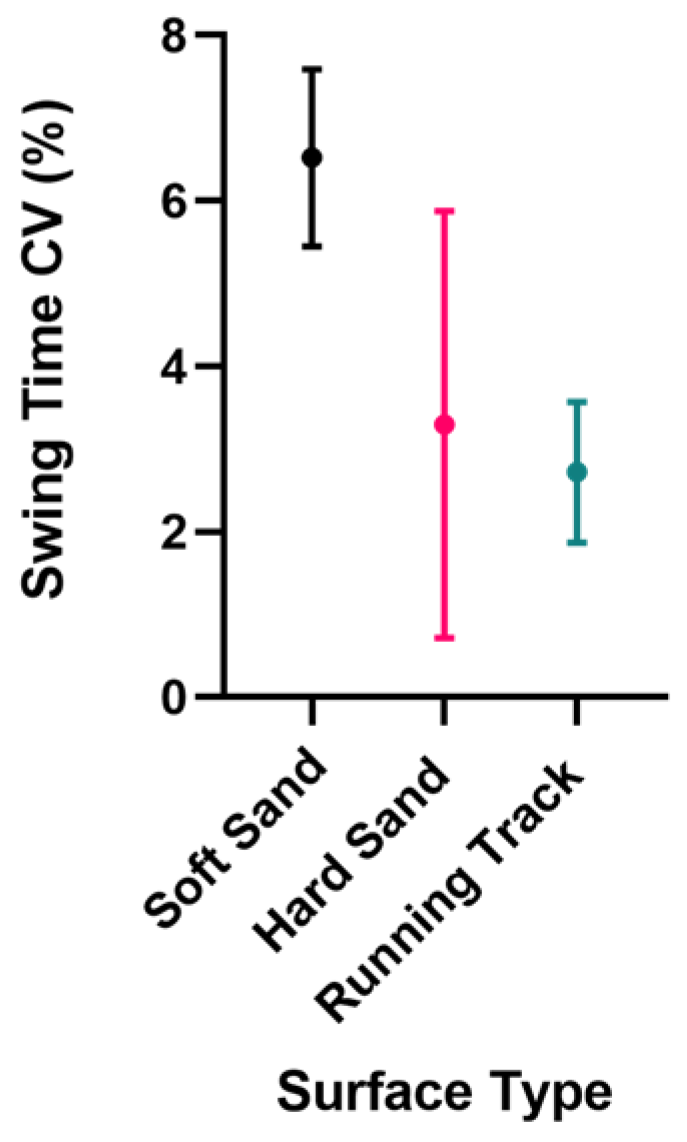
The swing time period in the soft sand gait profile generally has a shorter duration than the hard and running track profiles. The swing time duration extracted from the gyroscope signal was compared using box and whisker plots (Figure 3). The swing time coefficient of variation (CV) for each surface type was calculated to assess swing time variability (Figure 4).
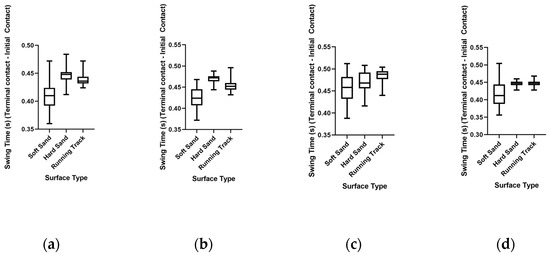
Figure 3.
Box and whisker plot showing gait swing time for each surface type for participants 1–4 (a–d). Note the much larger variability during soft sand running.
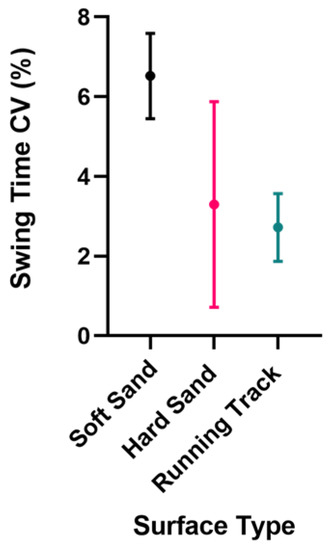
Figure 4.
Mean and standard deviation swing time CV for all participants on each running surface (6.5 ± 1.1), (3.3 ± 2.6), (2.7 ± 0.9).
3.2.2. Symmetry
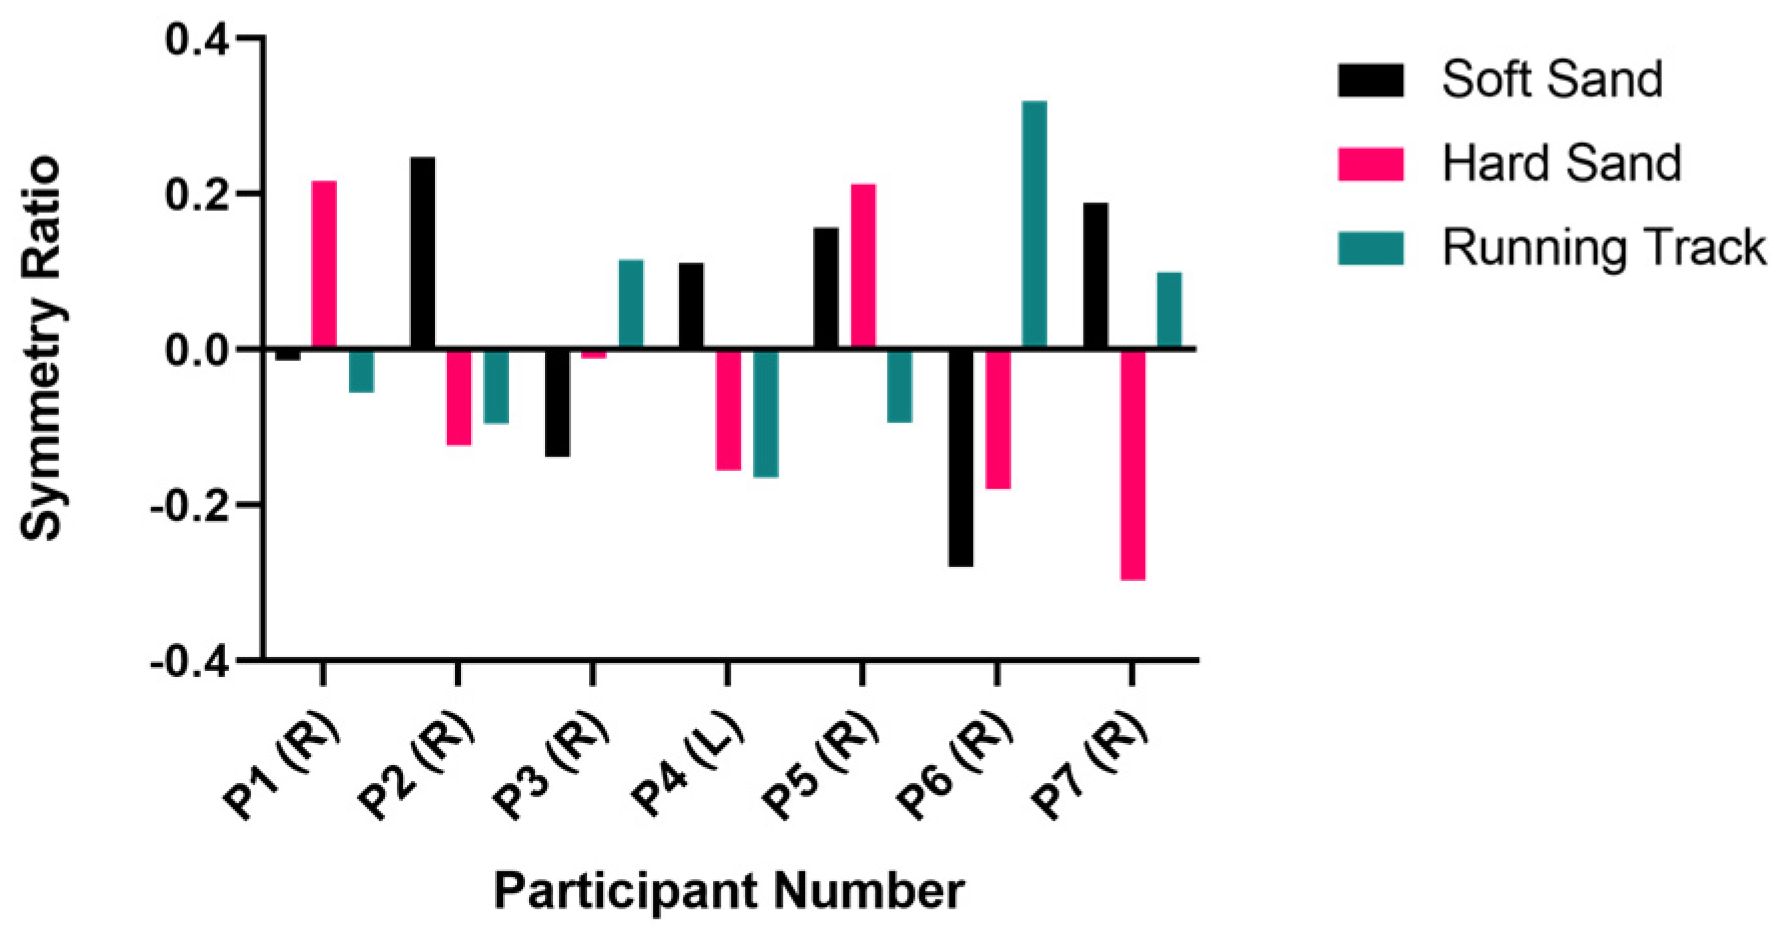
Gait symmetry was compared using the lumbar sensor (centre of mass (COM)) (Figure 5). A symmetry ratio (SR) equation defined by Lee et al. was used (Equation (2)) [6]
where LI is the lower back sensor’s left foot vertical impact and RI is the lower back sensor’s right foot vertical impact.
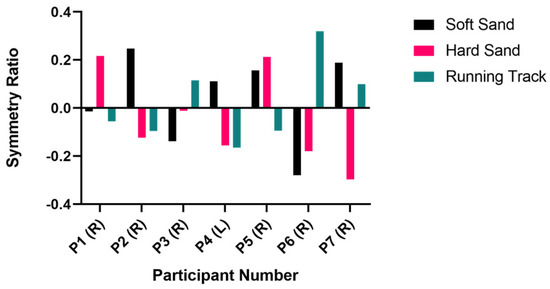
Figure 5.
Symmetry ratio calculated for participants on each running surface, positive shows left dominance, negative shows right dominance; (R) and (L) denotes the foot dominance of each participant.
4. Discussion
The mean and standard deviation PL across the participants calculated for each running surface show little difference across the surfaces (577 ± 130, 581 ± 128, 568 ± 124) for soft sand, hard sand and running track, respectively. Binnie et al. [11] suggested that sand training involves a higher energy cost and thus it was expected that running 400 m on soft sand as opposed to hard sand and the running track would produce a significantly greater PL value. PL can show how efficiently an athlete moves and it is clear that an athlete would run 400 m more efficiently on hard sand and a running track than on soft sand [17]. Conversely, the RPE scores show large differences between the running surfaces. Running on soft sand was significantly more challenging for the participants yielding a RPE mean and standard deviation of 5.3 ± 2.5 (Hard to Very Hard) compared to 2.6 ± 0.8 (Easy to Moderate) and 1.5 ± 0.6 (Very, Very easy to Easy). These values reinforce the literature that sand training requires a higher energy output, however this did not correlate with the values obtained for PL. The authors speculate that the reason for this is that running on soft sand has lower foot-strike impact [11], which reduces the magnitude of vertical acceleration recorded by the IMU, leading to an underestimate of PL.
The duration of swing time is shorter for soft sand than for the other surfaces (Figure 3). Swing time variability also increased for soft sand running (Figure 4). This variability may be caused by the leg instability experienced in soft sand running which leads to runners not maintaining a consistent gait. The authors believe that the decrease in the swing duration time on soft sand is the result of runners having to generate more power during the terminal contact phase when the foot sinks into the sand. This in turn makes it harder to produce a longer swing. The running track had the lowest mean CV, as there is less surface variability enabling the athlete to maintain a consistent gait. Hard sand running demonstrated similar properties to the running track surface with an average longer swing time duration, however there was greater variability than on a running track.
Lee et al. [6] findings showed that most athletes demonstrated a change in symmetry with 1 km/h changes in running velocity and 3 of the 10 athletes changed dominance. Figure 5 shows that gait dominance was not consistent across all three running surfaces for any of the participants. This result reinforces the literature, which suggests that gait biomechanics can change with variation in running surface [20]. This result stresses the importance of training in the competition setting and will help sand-based athletes’ conditioning as they become accustomed to the altered gait biomechanics.
5. Conclusions
This study demonstrated that data obtained from wearable IMU sensors attached to multiple parts of the body can be used to identify changes in biomechanical processes across running surfaces; in particular soft-hard sand and an international standard running track. Significant differences were highlighted in the swing time and gait symmetry across the different surfaces. While the 400 m run on soft sand should result in a higher work rate (as reflected by participants self-reflected RPE scores), this was not the case in the PL data (This was similar across all the surfaces). The results from this investigation can be used by coaches and athletes of sand-based sports such as surf lifesaving, triathlon and beach team sports (volleyball, soccer, etc.) to make more informative decisions about their training programs. The observed running gait profiles show that the running pattern of individuals changed for each surface and thus it is essential that, where possible, athletes train in their competition environment.
This study involved participants that were not elite runners or sand-based athletes. Future advancements on this study should include elite sand-running participants. An additional IMU sensor mounted on the shoe of the participant should provide insightful differences in gait biomechanics across running surfaces. A more biomechanical analysis study using a golden standard technology such as retro-reflective motion capture should be conducted to assess the implications that the different running surface gait parameters has on athletes.
Acknowledgments
This research received no external funding.
Conflicts of Interest
The authors declare no conflict of interest.
References
- Dugan, S.A.; Bhat, K.P. Biomechanics and analysis of running gait. Phys. Med. Rehabil. Clin. N. Am. 2005, 16, 603–621. [Google Scholar] [CrossRef] [PubMed]
- Espinosa, H.G.; Shepherd, J.B.; Thiel, D.V.; Worsey, M.T.O. Anytime, anywhere! Inertial sensors monitor sports performance. IEEE Potentials 2019, 38, 11–16. [Google Scholar] [CrossRef]
- Worsey, M.T.O.; Pahl, R.; Thiel, D.V.; Milburn, P.D. A comparison of computational methods to determine intrastroke velocity in swimming using IMUs. IEEE Sens. Lett. 2018, 2, 1–4. [Google Scholar] [CrossRef]
- Worsey, M.; Espinosa, H.; Shepherd, J.; Thiel, D. Inertial sensors for performance analysis in combat sports: A systematic review. Sports 2019, 7, 28. [Google Scholar] [CrossRef] [PubMed]
- Lee, J.B.; Mellifont, R.B.; Burkett, B.J. The use of a single inertial sensor to identify stride, step, and stance durations of running gait. J. Sci. Med. Sport 2010, 13, 270–273. [Google Scholar] [CrossRef] [PubMed]
- Lee, J.B.; Sutter, K.J.; Askew, C.D.; Burkett, B.J. Identifying symmetry in running gait using a single inertial sensor. J. Sci. Med. Sport 2010, 13, 559–563. [Google Scholar] [CrossRef] [PubMed]
- Little, C.; Lee, J.B.; James, D.A.; Davison, K. An evaluation of inertial sensor technology in the discrimination of human gait. J. Sports Sci. 2013, 31, 1312–1318. [Google Scholar] [CrossRef] [PubMed]
- Thiel, D.V.; Shepherd, J.; Espinosa, H.G.; Kenny, M.; Fischer, K.; Worsey, M.; Matsuo, A.; Wada, T. Predicting ground reaction forces in sprint running using a shank mounted inertial measurement unit. Proceedings 2018, 2, 199. [Google Scholar]
- Einicke, G.A.; Sabti, H.A.; Thiel, D.V.; Fernandez, M. Maximum-entropy-rate selection of features for classifying changes in knee and ankle dynamics during running. IEEE J. Biomed. Health Inform. 2018, 22, 1097–1103. [Google Scholar] [CrossRef] [PubMed]
- Wixted, A.J.; Billing, D.C.; James, D.A. Validation of trunk mounted inertial sensors for analysing running biomechanics under field conditions, using synchronously collected foot contact data. Sports Eng. 2010, 12, 207–212. [Google Scholar] [CrossRef]
- Binnie, M.J.; Dawson, B.; Pinnington, H.; Landers, G.; Peeling, P. Sand training: A review of current research and practical applications. J. Sports Sci. 2014, 32, 8–15. [Google Scholar] [CrossRef] [PubMed]
- Chelius, G.; Braillon, C.; Pasquier, M.; Horvais, N.; Gibollet, R.P.; Espiau, B.; Azevedo Coste, C. A wearable sensor network for gait analysis: A six-day experiment of running through the desert. IEEEASME Trans. Mechatron. 2011, 16, 878–883. [Google Scholar] [CrossRef]
- Thiel, D.V.; Worsey, M.T.O.; Klodzinksi, F.; Emerson, N.; Espinosa, H.G. A penetrometer for quantifying the surface stiffness of sport sand surfaces. MDPI Proceedings 2020, 49. (accepted for publication). [Google Scholar]
- Lai, A.; James, D.A.; Hayes, J.P.; Harvey, E.C. Semi-Automatic Calibration Technique Using Six Inertial Frames of Reference; International Society for Optics and Photonics: Bellingham, WA, USA, 2004; pp. 531–542. [Google Scholar]
- Foster, C.; Hector, L.L.; Welsh, R.; Schrager, M.; Green, M.A.; Snyder, A.C. Effects of specific versus cross-training on running performance. Eur. J. Appl. Physiol. 1995, 70, 367–372. [Google Scholar] [CrossRef] [PubMed]
- Impellizzeri, F.M.; Rampinini, E.; Coutts, A.J.; Sassi, A.; Marcora, S.M. Use of RPE-based training load in soccer: Med. Sci. Sports Exerc. 2004, 36, 1042–1047. [Google Scholar] [CrossRef] [PubMed]
- Catapult Fundamentals: What Can PlayerLoad Tell Me about Athlete Work? Available online: https://www.catapultsports.com/blog/fundamentals-playerload-athlete-work (accessed on 3 October 2019).
- Fraccaro, P.; Walsh, L.; Doyle, J.; O’Sullivan, D. Real-world gyroscope-based gait event detection and gait feature extraction. In Proceedings of the 6th International Conference on eHealth, Telemedicine, and Social Medicine, Barcelona, Spain, 23–27 March 2014. [Google Scholar]
- Greene, B.R.; McGrath, D.; O’Neill, R.; O’Donovan, K.J.; Burns, A.; Caulfield, B. An adaptive gyroscope-based algorithm for temporal gait analysis. Med. Biol. Eng. Comput. 2010, 48, 1251–1260. [Google Scholar] [CrossRef] [PubMed]
- Vincent, H.K.; Herman, D.C.; Lear-Barnes, L.; Barnes, R.; Chen, C.; Greenberg, S.; Vincent, K.R. Setting standards for medically-based running analysis. Curr. Sports Med. Rep. 2014, 13, 275–283. [Google Scholar] [CrossRef] [PubMed][Green Version]
Publisher’s Note: MDPI stays neutral with regard to jurisdictional claims in published maps and institutional affiliations. |
© 2020 by the authors. Licensee MDPI, Basel, Switzerland. This article is an open access article distributed under the terms and conditions of the Creative Commons Attribution (CC BY) license (https://creativecommons.org/licenses/by/4.0/).

