1. Introduction
Speed skating is a technical as well as an endurance sport, and at first sight it is quite surprising that hardly any objective feedback is provided during training sessions. An important reason for this is the unique propulsion property in speed skating, which makes speed skating not only challenging to master–the movement being quite different from propulsion methods in daily life, such as walking and cycling–but also challenges biomechanical interpretation [
1]. The force produced to propel a body forward in speed skating is directed almost perpendicularly to the forward motion, because a skate moves nearly frictionless in the fore–aft direction, and is more or less fixed (against the ice) in the sideways lateral direction, resulting in a sliding point to push off against.
The complex biomechanical nature of speed skating challenges the correct framing and observation of the skating movements, and there is therefore ample need for a good and easy to use feedback mechanism. For example, in cycling, it is relatively simple to provide meaningful feedback such as speed, cadence and power. Similarly, in speed skating, the ‘holy grail’ is power per stroke. This implies having to measure forces, velocity and their directions accurately. Both are not easy to measure in an indoor ice rink. Unlike in running or cycling, where the direction of push-off force and the resulting velocity are almost opposite, in speed skating, due to the almost frictionless gliding movement of the skate over the ice, the push-off force and velocity direction are almost perpendicular [
2].
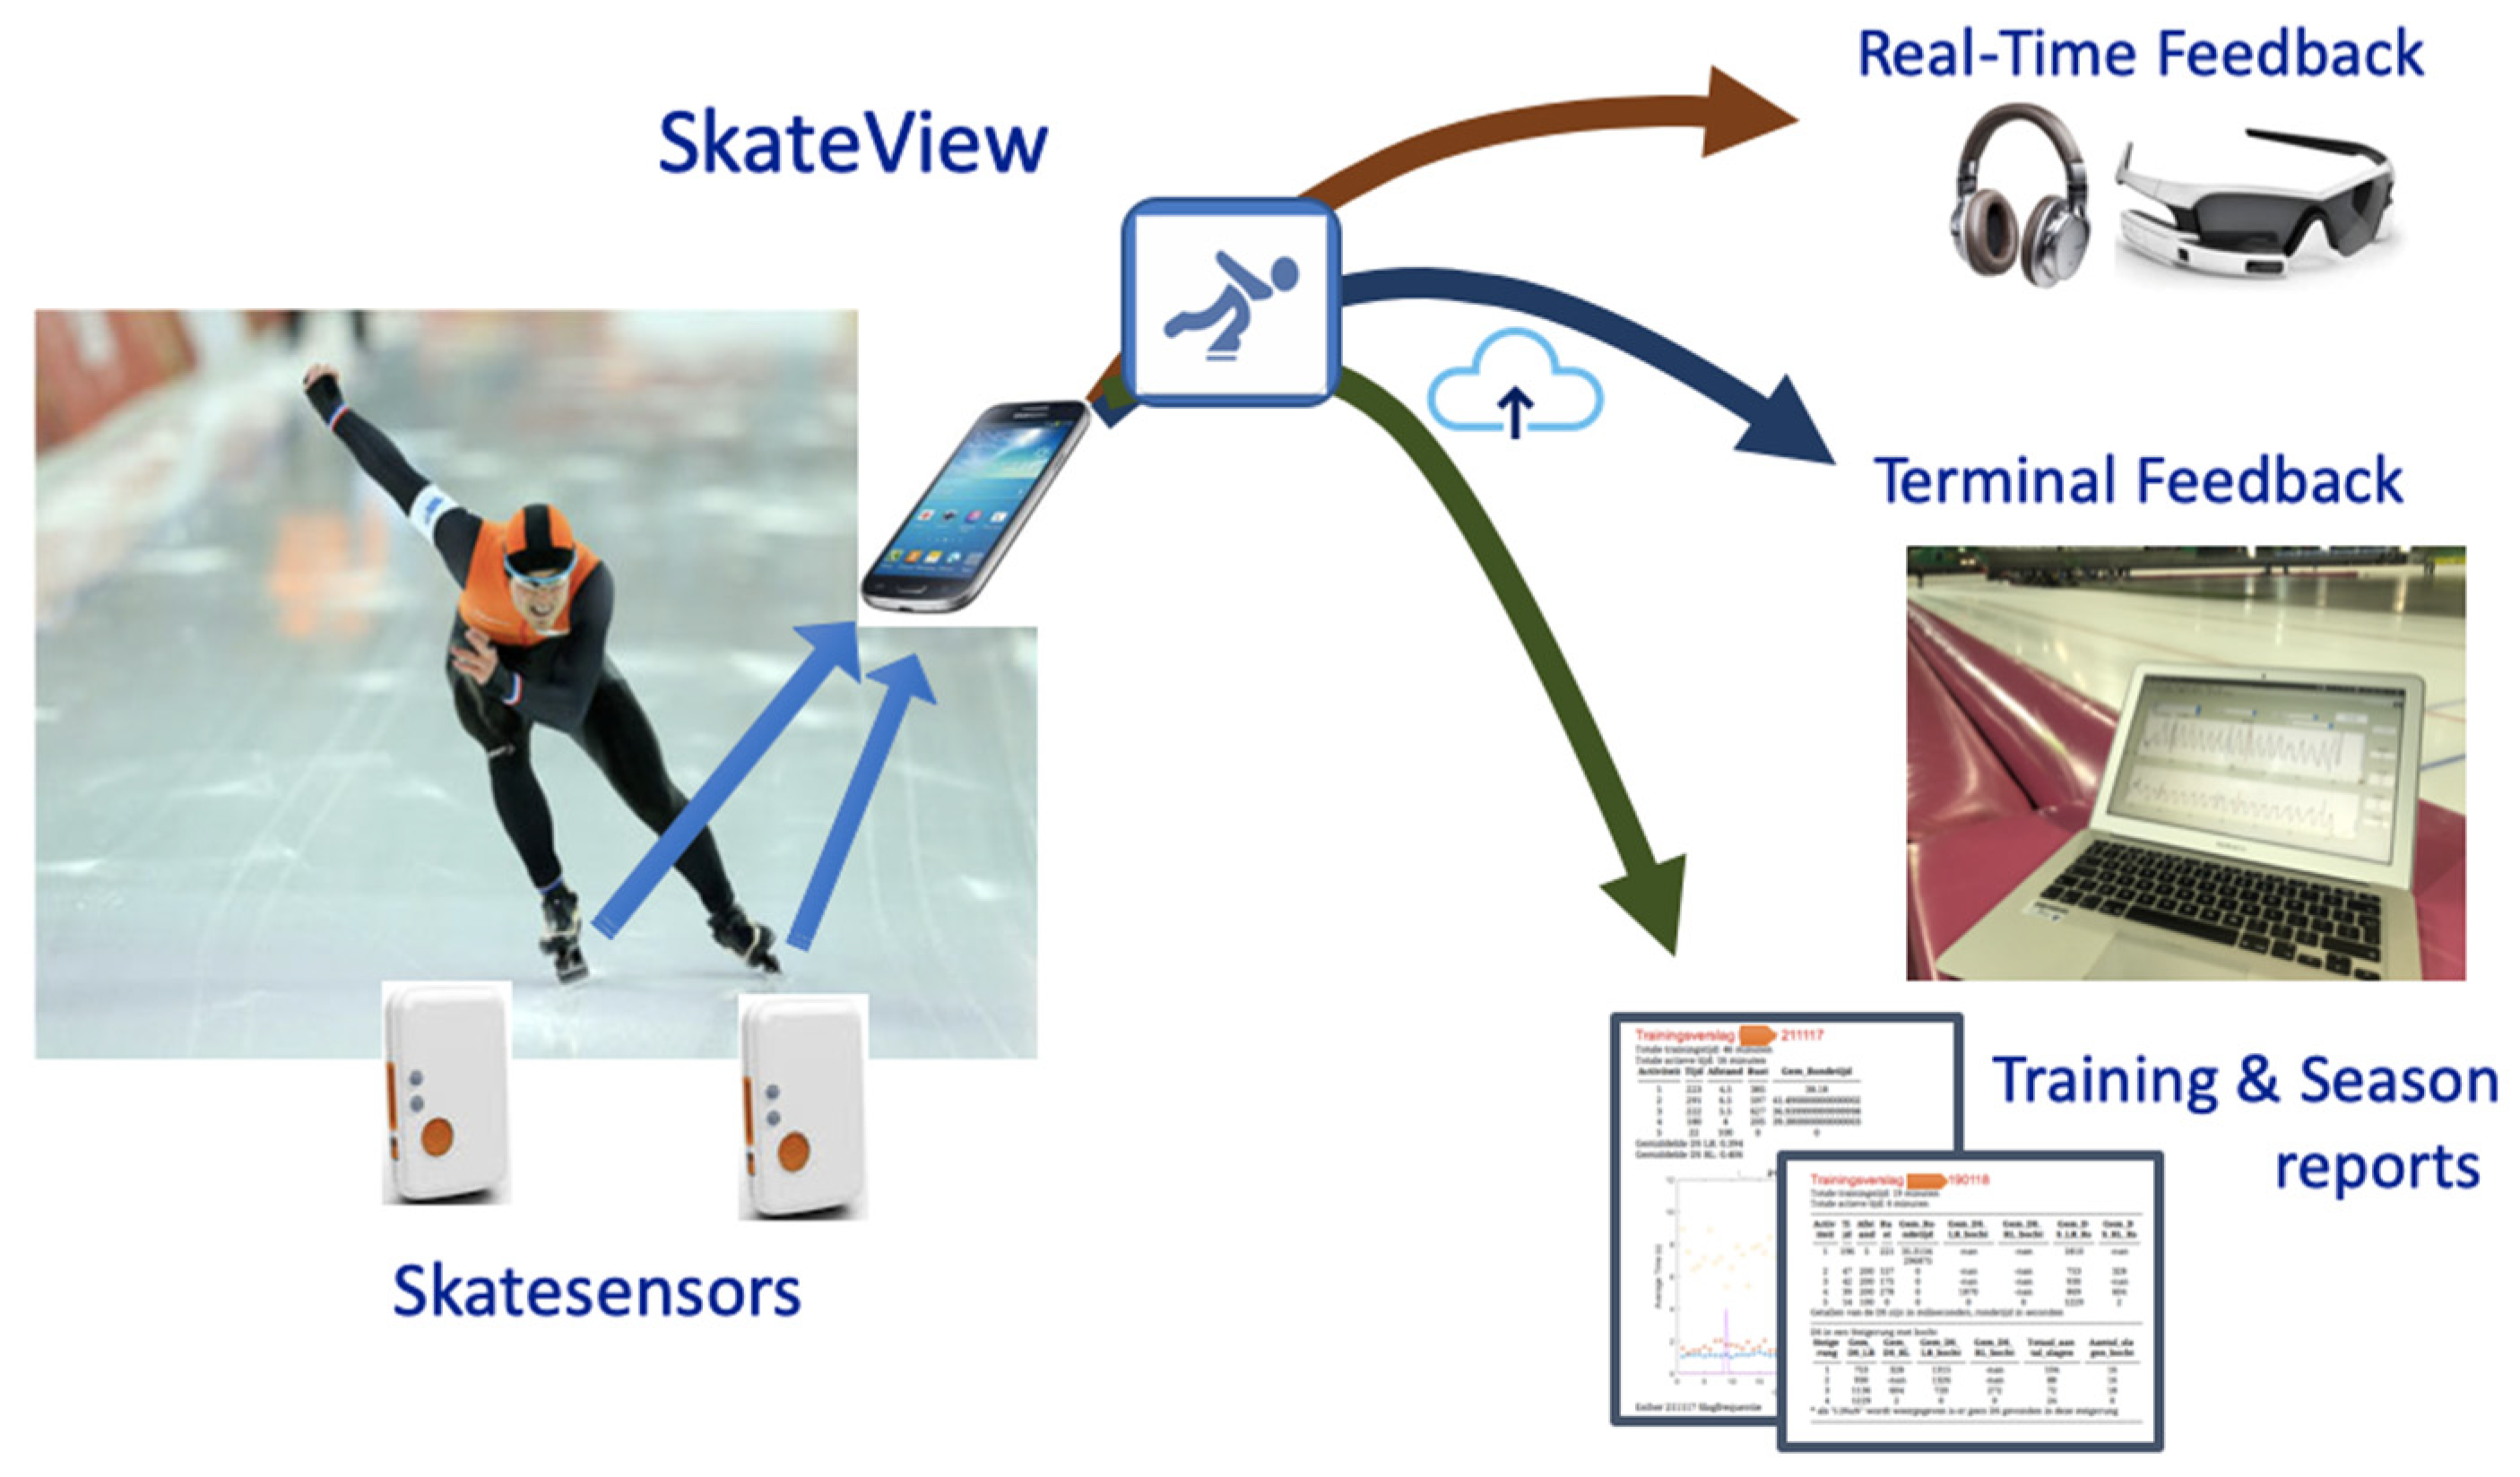
The eventual goal of this research is to quantify power per stroke; however, more easily accessible parameters, such as contact time, stroke frequency (SF) and bipedal phase time, have proven very useful in their own right. Furthermore, advanced parameters, such as push-off force, center of pressure and angles, such as fall angle, are also important in providing technical feedback. To investigate the usefulness of real-time feedback, sensors and an app for a mobile phone have been developed, SkateView, to provide feedback while on the ice and to monitor performance over longer periods of time. Simultaneously, simple force sensors for daily use can be added to SkateView to provide feedback about push-off.
2. Materials and Methods
SkateView consists of 2 IMU’s (Shimmer3 [
3]), ‘Skate Sensors’ from here on, placed one in each skate. Via Bluetooth, data is sent to an app on a mobile phone worn on the chest under the skating suit. The app stores and processes the raw data, and sends performance parameters to a cloud application specifically designed for sport applications (a real-time database that is part of the Sport Data Valley (SDV) platform [
4]), were coach and athlete can view the results in dedicated dashboards. The raw data can be retrieved after the training and analyzed in greater detail.
Skaters of two teams, one junior elite and one professional team (age 16–34, 16 males and 12 females), all of whom provided written informed consent, participated in the research. Just before stepping on the ice, the skater placed the two skate sensors in their shoes and connected them to the app. After the training, the raw data was downloaded from the mobile phone for detailed analysis.
Figure 1 shows the three types of feedback SkateView can provide: real-time, terminal and postponed. Stroke frequency, presented per stroke as one over the time between consecutive touchdowns, is the basic parameter that provides a more or less natural insight into the activity. In the next paragraph, several features are highlighted to show the value of the feedback.
Force sensors can be added to SkateView depending on their relevance to the question at hand. Ultra-light force sensors (UFs) have been developed to fit between the shoe and the bracket. They are approximately 3 mm high and weigh ~10 gr.
3. Results
Postponed feedback of a 500 m race presented in
Error! Reference source not found. shows a rapid decrease in stroke frequency over the first 100 m, and a sudden increase when entering the corner. The top panel shows the contact time per skate and the bipedal phase (two skates on the ice simultaneously). Here, the bipedal phase is negative in the first part after the start, indicating that the skater is running rather than skating, which is the case in a good sprint on skates. A more detailed analysis of the first 100 m is presented in [
5]. In the corners, a clear difference is visible in contact time between left and right, the right being longer on the ice than the left; it is more stable to stand on the right (outer) skate in the corner than on the left. For good sprinters, the contact times in the corner can be equal for left and right at high stroke frequencies when accelerating quickly.
Figure 3 shows the ‘raw’ data of a 1500 m race and the average stroke frequency per segment, both for the corners and straightaways. In the right panel, a rapid decrease is visible of the average stroke frequency in the corner, which is due to the acceleration from the start. In the third and fourth corner, the stroke frequency seems to level out, and after that it starts to decrease gradually again. The skater cannot keep up the high frequency, and one might speculate that the skater gets fatigued after rounding the fourth corner. A question, which coaches regularly ask, is whether stroke frequency can be seen as a proxy for velocity, which is addressed in the discussion.
Force data captured with the ultra-light force sensors (UFs) is shown in [
6]. The plots show a typical force profile of several push-offs of one skate, together with the center of pressure along the blade of the skate. Typical values to use for feedback are: max push-off force, average push-off force per stroke, the ratio between the first and last part of the push-off force. Stienstra et al. [
7] showed that the center of pressure is useful as a real-time feedback parameter.
4. Discussion
SkateView is designed as a tool to provide feedback and monitor an athlete’s performance with two important aspects in mind: user-friendliness and the way feedback is used by the coaches. The experience with these prerequisites is addressed below.
User-friendliness on the ice: most skaters reported that they did not perceive wearing the sensors, although some reported some pressure on their toes. The phone is worn under the skating suit on the sternum. Again, most skaters were not hindered by the phone, although some smaller skaters reported that the phone was quite big.
Provided feedback: some papers report real-time feedback while skating [
7,
8]. SkateView was originally designed to be used for real-time feedback while skating, but coaches prefer terminal feedback on the ice and a detailed (postponed) analysis after the training. The experience with visual feedback (Recon Jet) turned out to be quite negative, as it was too distracting. With improved glasses and very simple visual feedback, this can be reassessed.
The example of a 1500 m race shown in Error! Reference source not found. (left) seems relatively complex to present to a skater. Just after the race, all skaters were able to ‘read’ their race by viewing the stroke frequency profile, and recognized several important details of the race. Aspects of the corner analysis are whether the SF was kept high, and if an increase was still possible at the end of the corner. The last corner in Error! Reference source not found. (left) does not show this increase at the end. The increase in SF happens when the skater accelerates out of the corner, which is typically something that coaches address.
Is Stroke Frequency a proxy for speed? Stroke frequency plots are shown in
Error! Reference source not found. and 3 as if velocity was on the vertical axis, but there is a direct relation between SF and external power. Van Ingen Schenau and Bakker [
2] formulated external power for speedskating as work per stroke times stroke frequency. Van Ingen Schenau et al. [
9,
10] also found that female and male speed skaters control their speed at various race distances by means of their mean stroke frequency. Small differences in performance among female speed skaters were, however, not significantly correlated with differences in stroke frequency, but rather with differences in push-off mechanics. Since these papers have been published, many significant changes have taken place in speed skating: the klap-skate, indoor ice rinks and speeds of up to 60 km/h, to name a few. With the present system, it is now possible to revisit these findings again.
5. Conclusions
SkateView is a useful system to monitor performance and provide feedback to coaches whenever they need feedback. Even though general-purpose sensors are used, the user-friendliness and the wearing comfort are quite good. Real-time feedback has been shown to be useful in speed skating in the past. Here, we found that terminal and postponed feedback, focusing on detailed questions from coaches, turned out to be most useful up to now. The layout and the amount of information in the presentation of the feedback is an important part of feedback that has to be improved when more and less-experienced coaches are to use the system. One of the objectives of Sport Data Valley is to design and present attractive feedback to coaches and athletes, which is more intuitive than the more technical presentation of the results so far. With this system and the important raw parameters, the estimation of power is one step closer.
