Proceeding Paper

Measurement of Dynamic Behavior of Running- Specific Prostheses by an Impact Test †

1
Graduate School of Engineering, Kogakuin University, 1-24-2 Nishi-shinjuku, Shinjuku-ku, Tokyo 163-8677, Japan
2
Department of Mechanical Engineering, Kogakuin University, 1-24-2 Nishi-shinjuku, Shinjuku-ku, Tokyo 163-8677, Japan
*
Author to whom correspondence should be addressed.
Presented at the 13th conference of the International Sports Engineering Association, Online, 22–26 June 2020.
Proceedings 2020, 49(1), 145; https://doi.org/10.3390/proceedings2020049145
Published: 15 June 2020

Abstract

:
The objective of this study was to evaluate rebound characteristics for running-specific prostheses by quantifying their dynamic behavior by an impact experiment. The impact experiment was conducted to produce a typical ground foot strike contact, and to obtain the dynamic behavior of blades during and after impact. The motion of the impactor and displacement of the blade was quantified by tracking markers attached to the surface of the impactor and blade using the digital image correlation method. Impact load was also calculated using the history of acceleration. An average spring stiffness, which was obtained by dividing the maximum impact load by its displacement, was proposed to evaluate the rebound characteristics for prostheses. As a result, the difference between the types of blades can be observed using the proposed stiffness and velocity ratio. This relationship indicates that the stiffness and the ratio may have the potential to be applicable to evaluate the performance of blades.

1. Introduction

A running-specific prosthetic foot consists of a socket, adapter and blade. The blade for running has a structure like a plate spring and is made of carbon fiber reinforced plastics [1]. Blades of various shapes and structures have recently been developed and the blade contributes strongly to the improvement of records coupled with the improvement of athletes’ physical ability through training. However, problems with the selection and use of the blade have occurred simultaneously.
An evaluation method for blades remains to be established to select blades suitable for each runner and to regulate the performance of the blade to ensure fair competition. Selection of the blade has no choice but to rely on subjective information, such as word-of-mouth information on the blade, catalog information provided by manufacturers and the types of blades used by athletes with impressive competition records. In competition rules, blades should not provide enhanced performance beyond the natural physical capacity of an athlete [2]. The substantial improvement of competition records causes doubts about the suitability for all athletes, despite the use of blades which meet the current regulations. In fact, previous studies have discussed the advantage or disadvantage of running-specific prostheses. For example, the lower leg amputee may run the same level of performance as an able-bodied sprinter while keeping metabolic costs down [3], and the advantage or disadvantage has the potential to depend on the combination of the mechanical properties of blades and alignment, etc. [4]. In this way, the advantage of a prosthetic foot remains unclear depending on the research.
There have been some studies in the literature which have attempted to evaluate the blade both mechanically and biomechanically. With reference to research using mechanical tests for example, the inertial properties of the blade were measured [5], and the displacement of lower limb prostheses was measured using the static and drop impact testing apparatus [6]. However, these studies could not be sufficiently analyzed due to the evaluation of the specific target and the preliminary experiment for checking the operational status of the experimental equipment. Studies focusing on the biomechanical evaluation of the blade were conducted by laboratory experiments on a treadmill [7] and an inverse dynamics analysis for running [8]. These studies did not make a detailed observation of the dynamic behavior of the blade due to the biomechanical evaluation including the physical characteristics of the subject. It is therefore desirable to develop a common method for evaluating the rebound characteristics of various blades. The evaluation using the index which represents the rebound characteristics is also expected to support the objective selection of blades suitable for each athlete and to utilize an establishment and modification of the regulations for ensuring fairness and transparency of available blades.
The objective of this study was to measure the rebound behavior using a developed impact testing apparatus for objective evaluation and to propose an index for evaluating rebound characteristics for running-specific prostheses.

2. Experimental Method

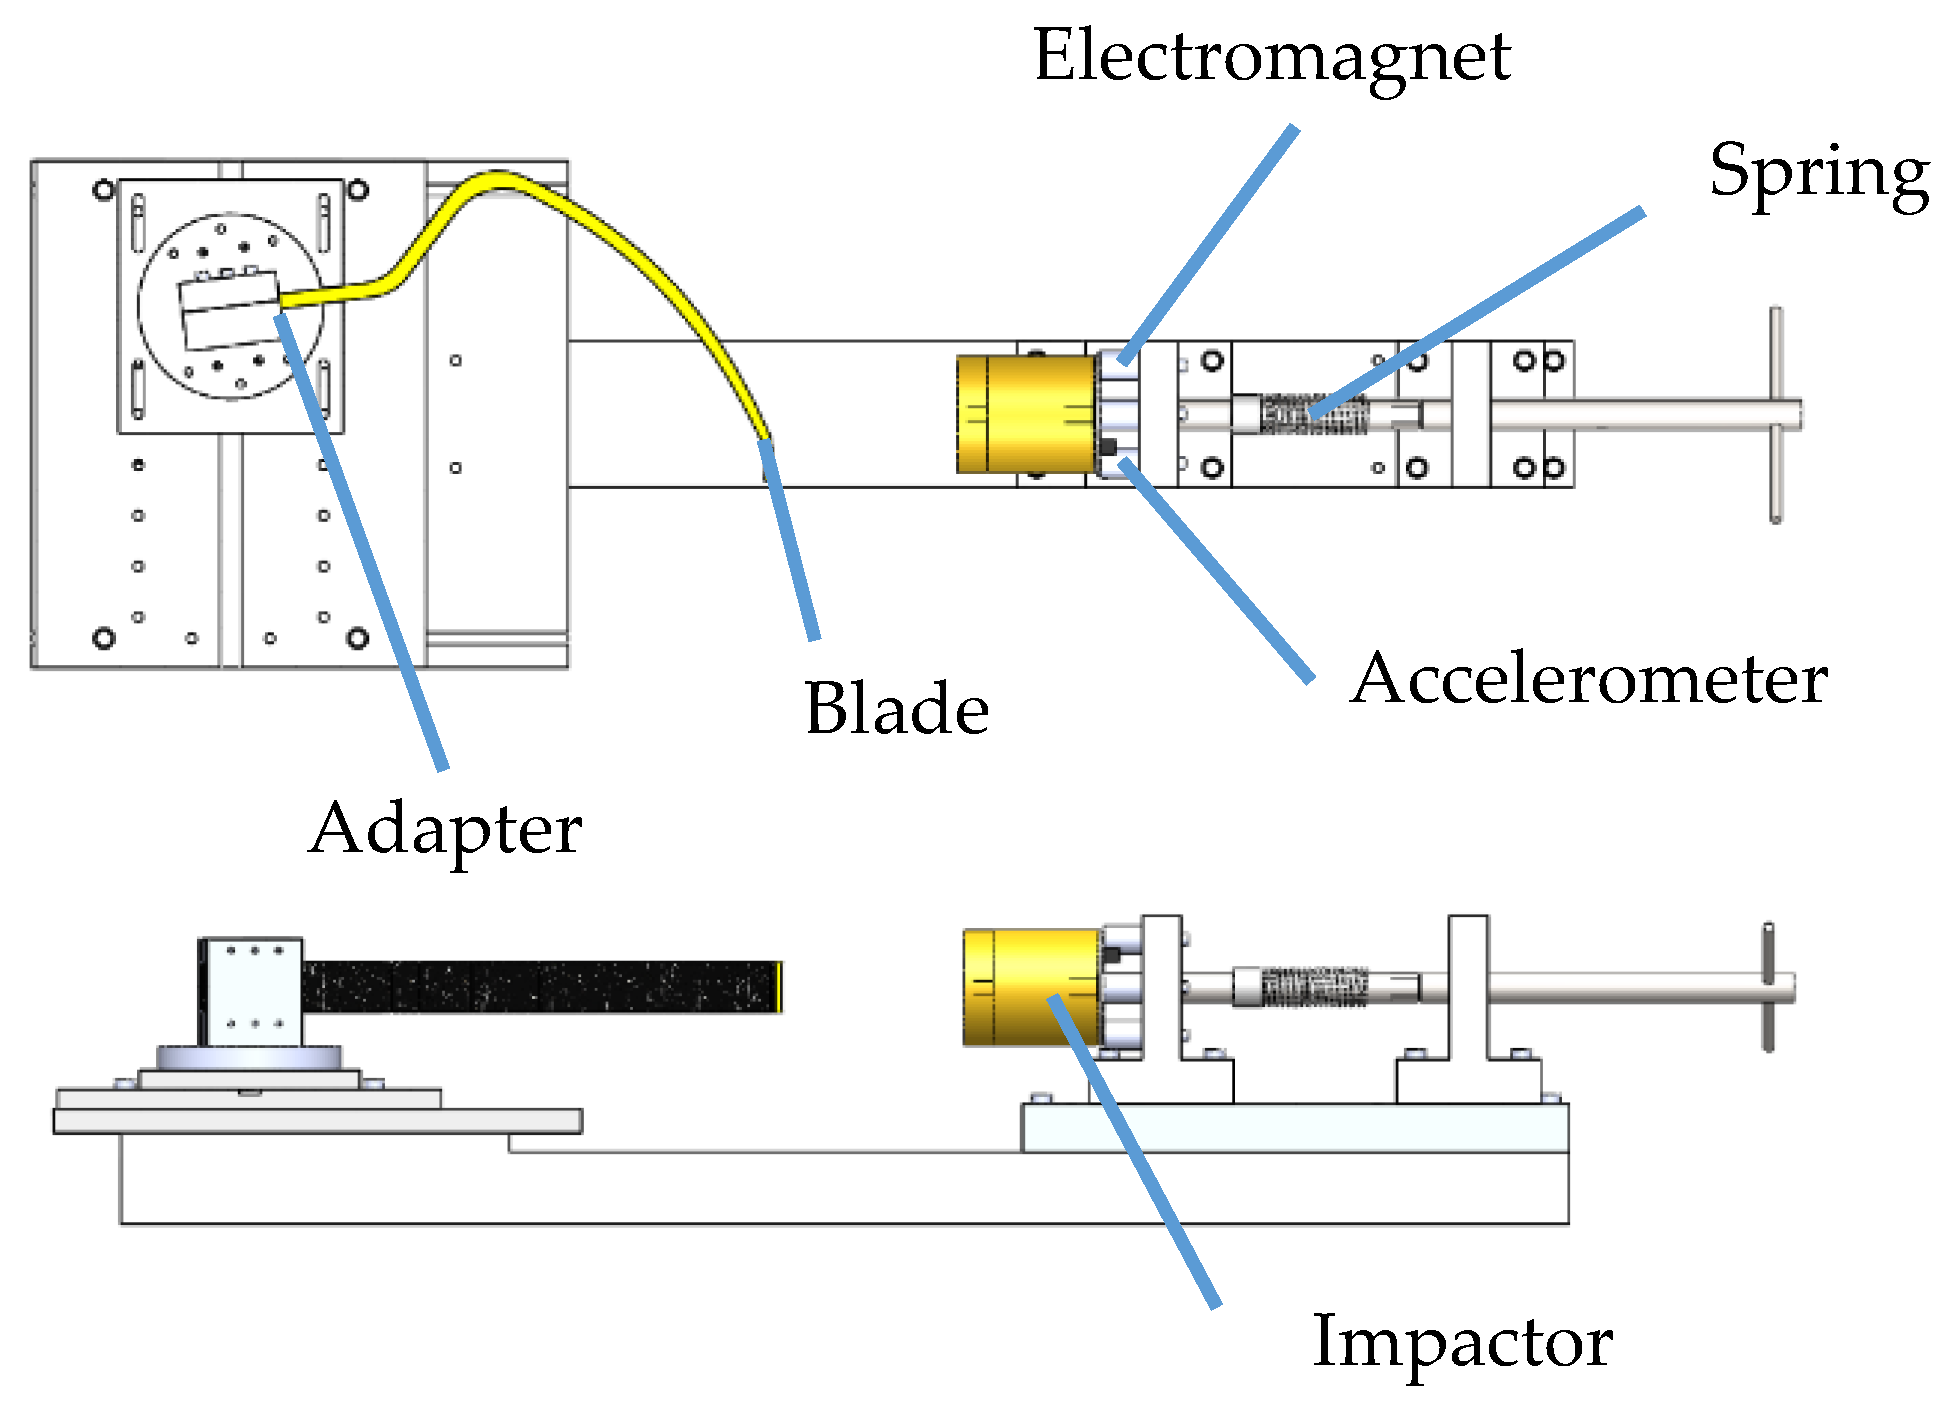
2.1. Design and Manufacture of Impact Testing Apparatus

An impact testing apparatus was designed and manufactured in this study to produce a typical ground foot strike contact, as shown in Figure 1. An impactor is released from electromagnets and collides with the blade fixed by the adapter set in place at a constant speed. The impact speed of the impactor can be controlled by adjusting the compressed length of a coil spring when the impactor is attracted to the electromagnets. The adapter can also adjust the position and the angle to the incidence direction of the impactor, respectively, to fix various blades with different shapes and sizes and to produce various impact conditions in view of the position of the blade to the ground surface line at contact.

2.2. Measurement Objects and Experimental Conditions

Two types of commercially available blades and three different categories for each blade (a total of six blades) were used as measurement objects, as shown in Figure 2, to confirm the efficiency of the rebound characteristics of the blade obtained from the impact experiment using the apparatus. Categories are determined by the manufacturer based on the weight of athletes and are described as category numbers in a product catalog.
The impactor collided with the landing area (around the toe) of the blade parallel to the straight part of the blade fixed by the adapter to evaluate the mechanical characteristics of the blade. The impact speeds of the impactor were varied at 1.0, 1.3 and 1.6 m/s to represent the contact speed from jogging to sprinting of top athletes. Five trials were carried out for each of the experimental conditions to confirm the repeatability of the impact test.

2.3. Measurement Items

Acceleration was measured using a strain gauge type accelerometer affixed on the impactor at a sampling frequency of 2000 Hz. The impact load was calculated by multiplying the measured time responses of the acceleration by the mass of the impactor. The weight of the impactor was set as 18.5 kg.
Motion of the impactor and blade was recorded by two synchronized high-speed video cameras under photography conditions, as shown in Table 1. Markers attached on the surface of the impactor and blade were identified from photographed images by utilizing the digital image correlation method. The displacement of the impactor and blade was obtained from their positional coordinate identified by tracking markers using the software GOM Correlate (Germany, GOM GmbH), as shown in Figure 3. The displacement of the impactor before and after impact was used to obtain the velocities of the incidence and rebound of the impactor.

3. Results and Discussion

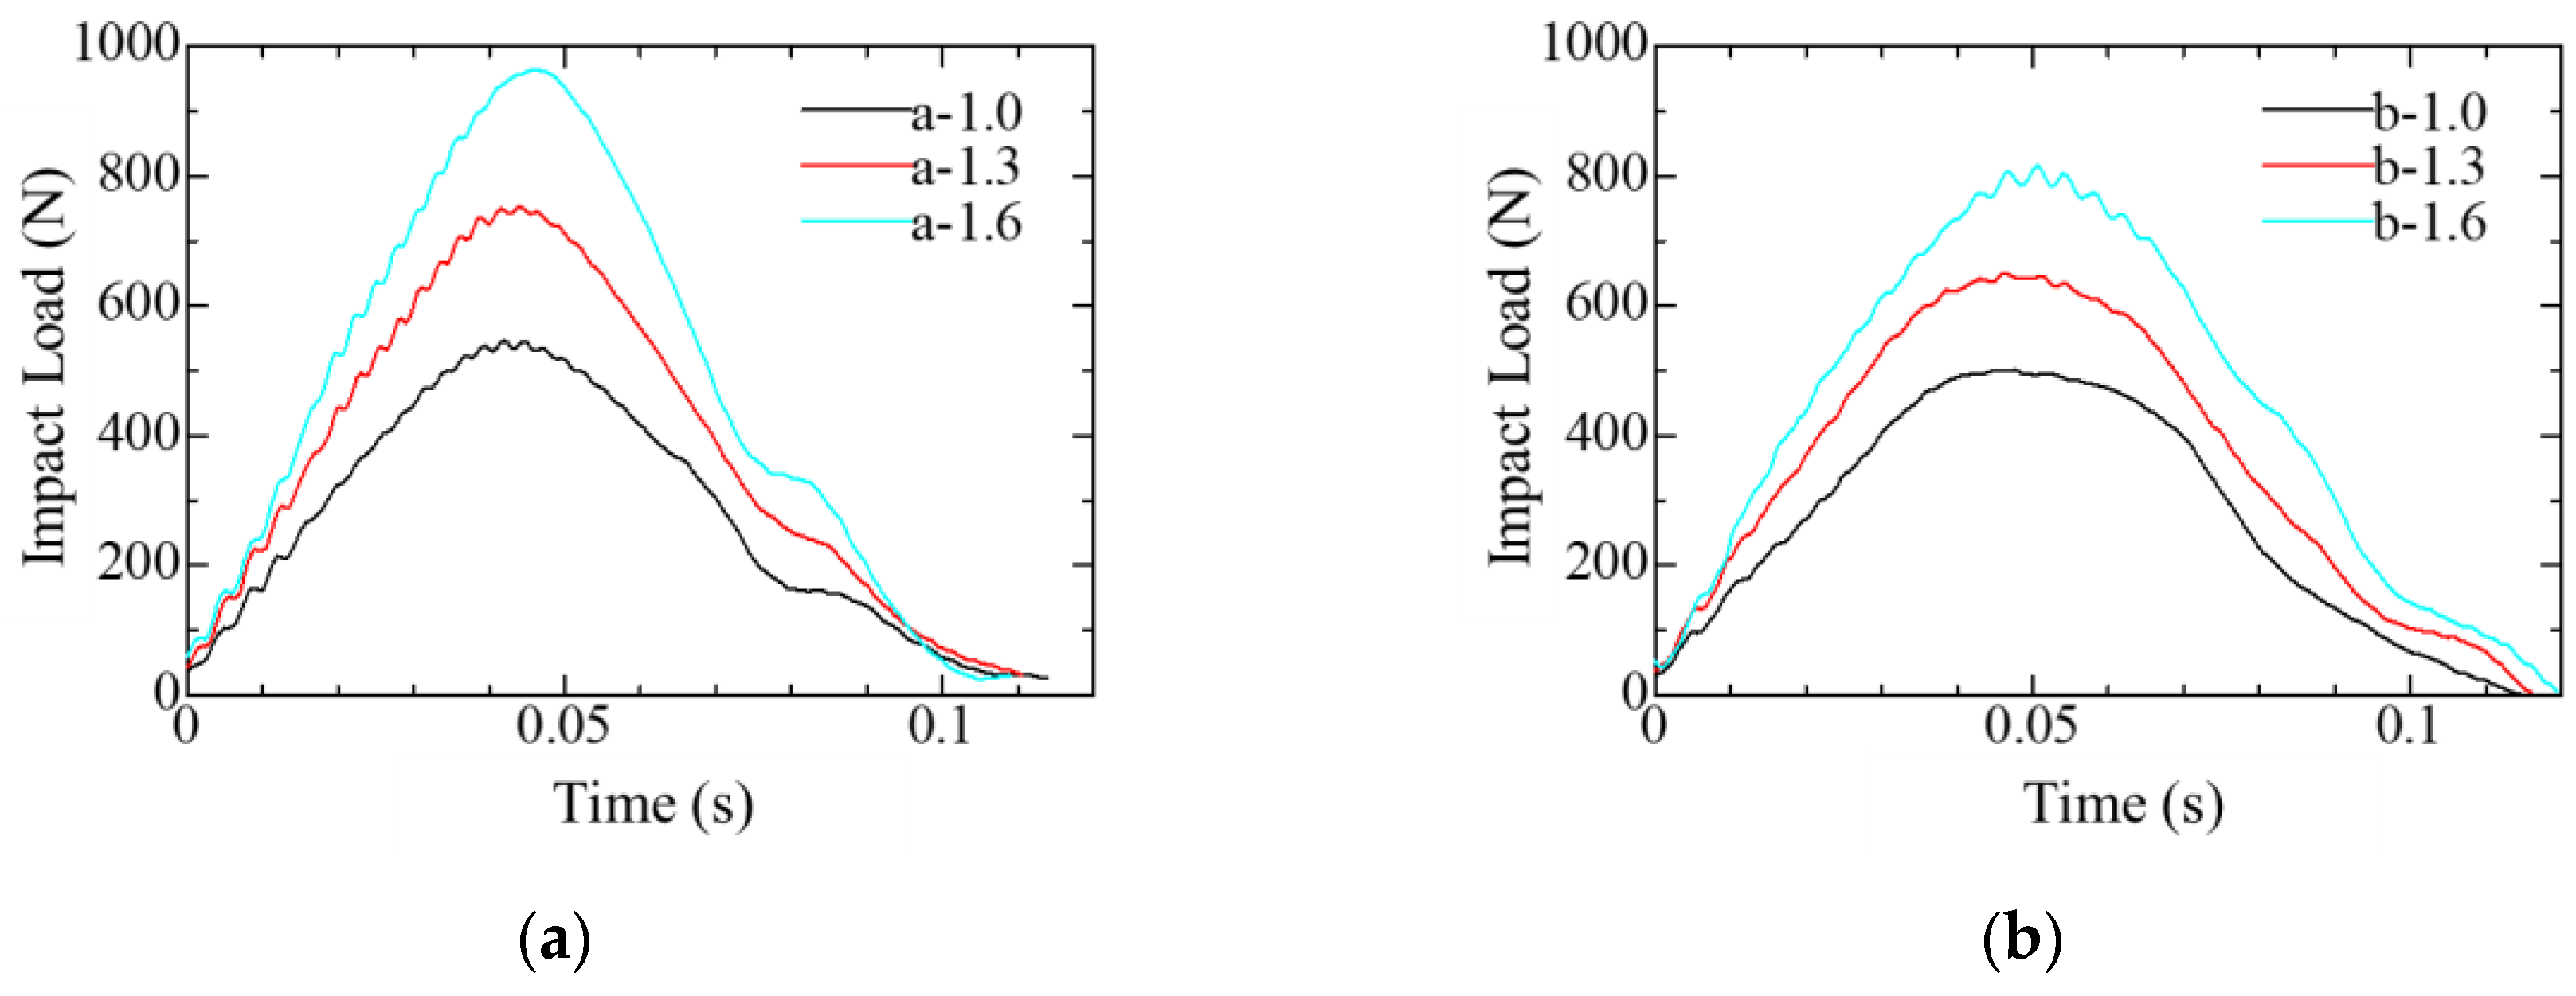
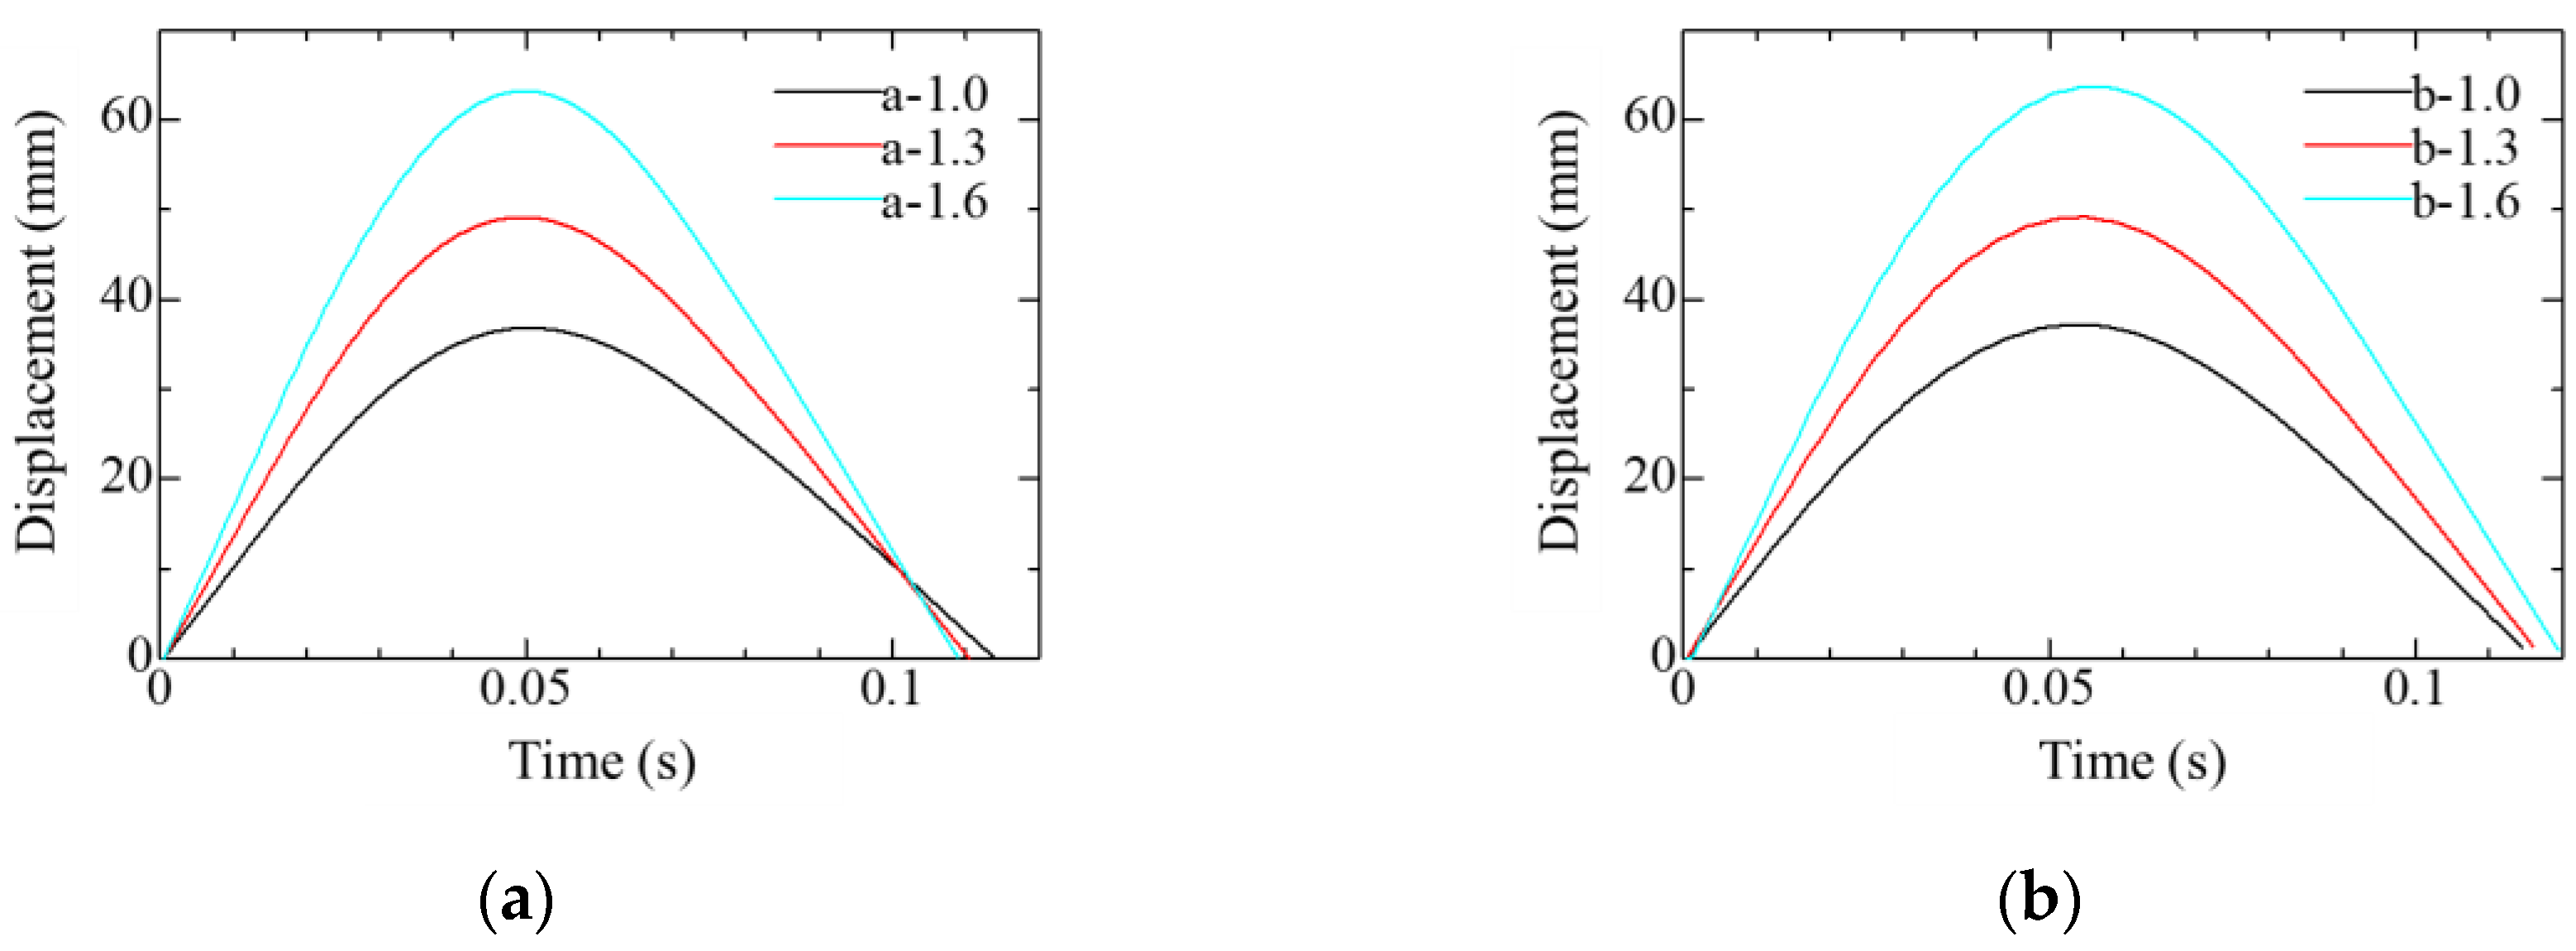
3.1. Impact Load and Displacement

The time histories of the impact load and displacement were measured, as shown in Figure 4 and Figure 5, respectively. Table 2 and Table 3 show the average of the maximum load and displacement with the standard deviation, respectively. The maximum impact load and displacement for both blades tends to increase with the impact speed. The changing rate of the maximum load for blade A, according to the impact speed, tends to be larger than that of blade B. In contrast, the changing rate of the displacement for blades A and B tends to be almost the same. In addition, since the duration time of the impact load and the displacement hardly changes at the same impact speed, the impactor and the blade move together after the impact.

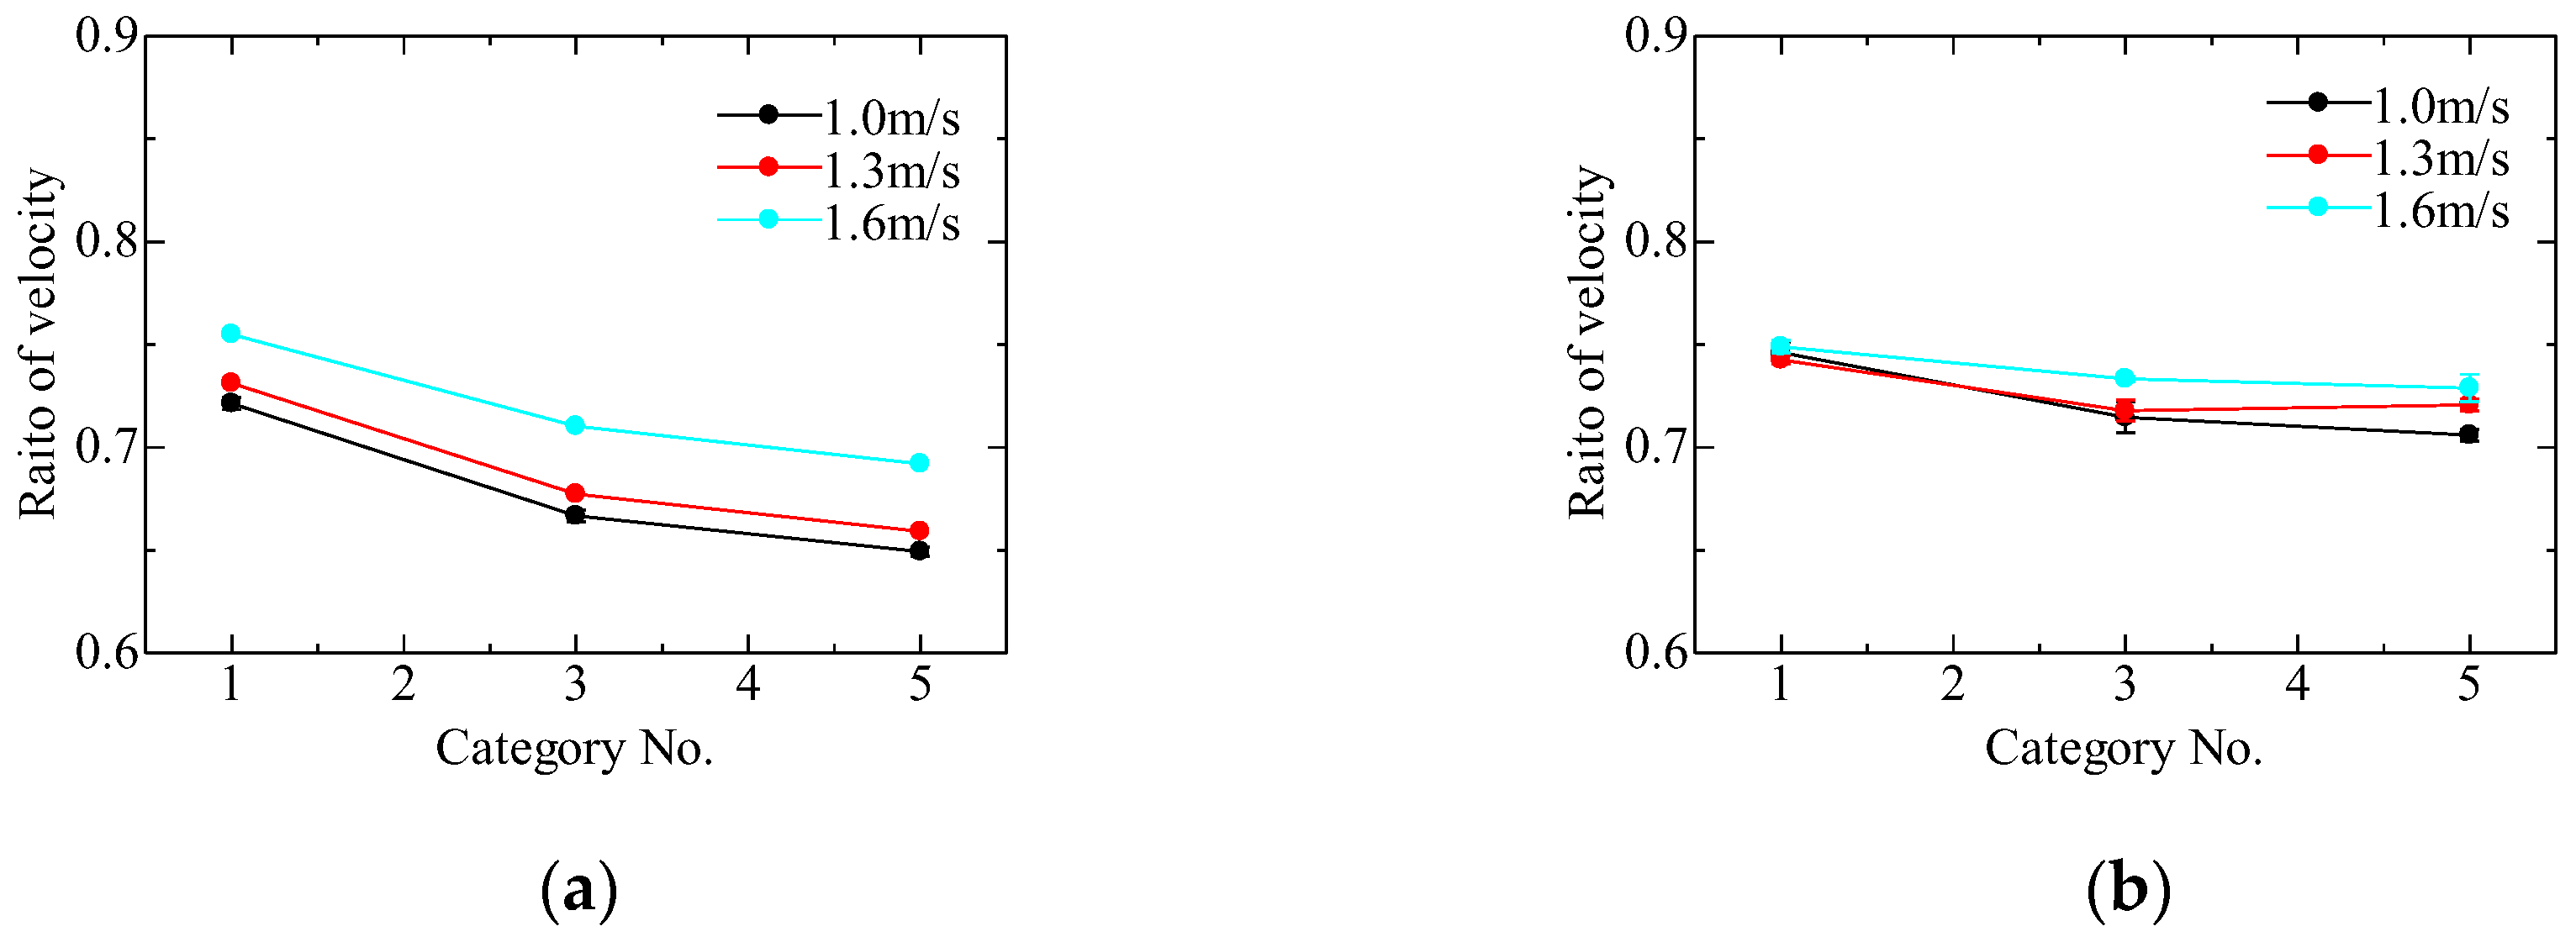
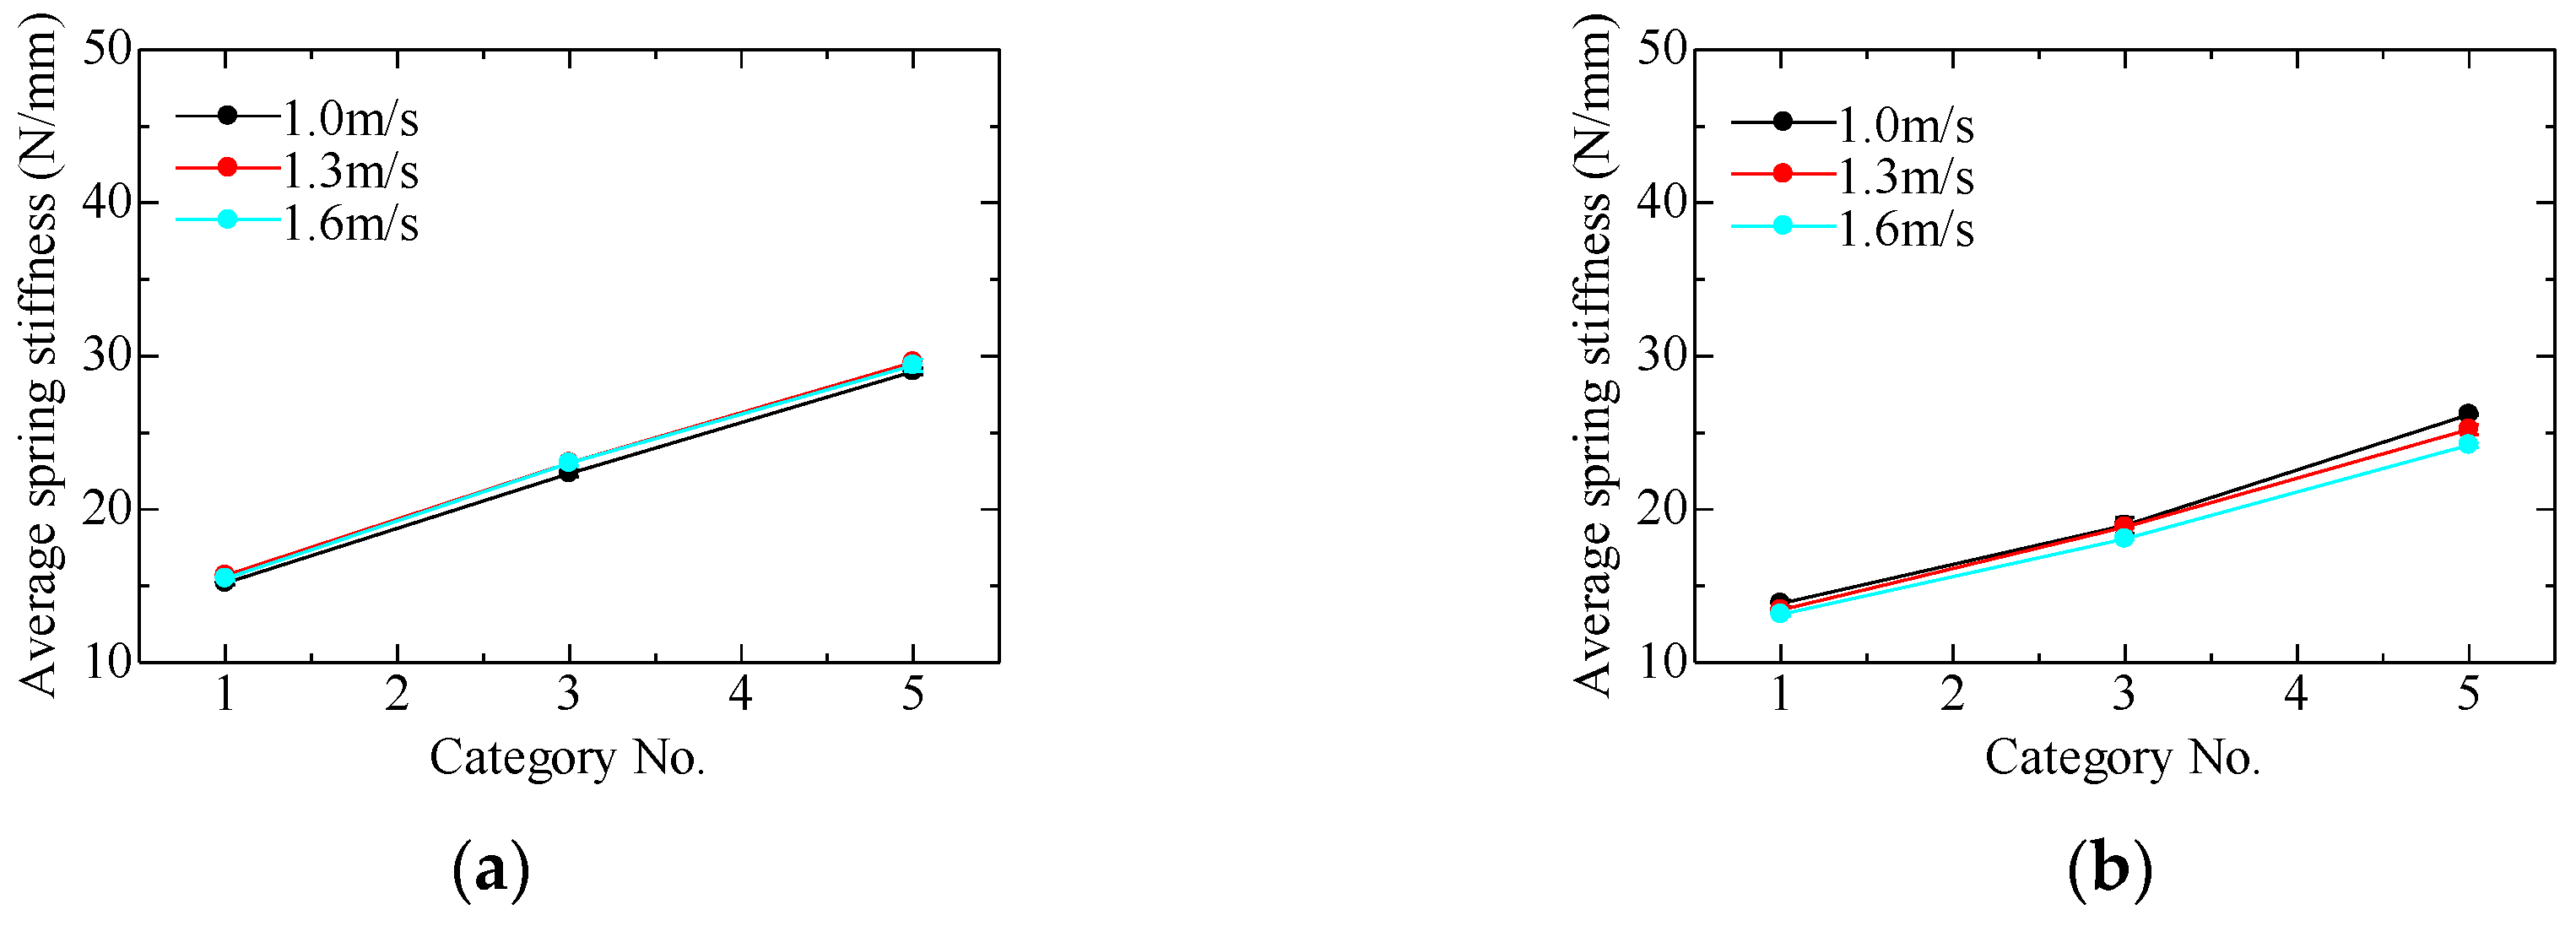
3.2. Ratio of Velocity and Average Spring Stiffness

The ratio of velocity, which was defined as the ratio of the rebound speed to the incidence speed of the impactor, was calculated and is shown in Figure 6. The ratio of the velocity of blade B tends to be larger than that of blade A under all conditions. The ratio of velocity tends to decrease as category numbers increase for each blade. Although there is a difference with blades, the ratio of speed tends to roughly decrease as category numbers increase for each blade.
An average spring stiffness (ASS, unit: N/mm) was calculated, as shown in Figure 7. The ASS was obtained by dividing the maximum impact load by the displacement at the maximum load. The ASS of blade A tends to be larger than that of blade B under the same impact condition. The ASS tends to increase with the category numbers, but there is little difference in the ASS regardless of the impact speed of each blade.
In light of these trends for the ratio of velocity and the ASS, the ratio of velocity can observe both differences between the blades and difference between category numbers in the same blade. The ASS also can observe the difference between the blades, but the difference with changes in the impact velocity cannot be sufficiently observed by the ASS. In addition, the ratio of velocity tends to generally decrease as the ASS increases. It is therefore suggested that the ratio of velocity can be an index which represents the difference between the blades and is advantageous for grasping the difference between categories. The ASS leaves sufficient space for providing an index for the blade, and more tests in various experimental conditions need to be conducted to improve the precision of the ASS index.

4. Conclusions

An impact experiment on prosthetic running blades was performed using a developed impact testing apparatus which produces a typical ground foot strike contact. Dynamic behavior, such as the displacement of the blade and impact load, was measured using high-speed video cameras and an accelerometer. The velocity ratio and the ASS were proposed as the indexes for evaluating the rebound characteristics of the blades. Possibilities of the proposed indexes were as follows:
  • The ratio of velocity can be an index which represents the difference between the types of blades, and roughly grasps the difference within the range of categories.
  • The ASS was proposed as an index which can evaluate the rebound characteristics of the blade obtained from the displacement and the impact load. It could represent the difference between blades, but it could not sufficiently represent the difference of the measurement conditions in the experimental conditions. The characteristics between categories can be represented as the linear relationship between the ASS and category numbers.
  • Regarding the ASS and the ratio of velocity, the ratio of velocity tends to generally decrease as the ASS increases within the range of the categories in this study.

References

  1. Miyata, Y.; Itahana, S. A Development of CFRP athlete’s prosthetic blade. J. Soc. Mater. Sci. 2019, 68, 394–400. (In Japanese) [Google Scholar] [CrossRef]
  2. World Para Athletics Rules and Regulations 2018–2019. Available online: https://www.paralympic.org/sites/default/files/document/180305150449200_World+Para+Athletics+Rules+and+Regulations+2018-2019_February.pdf (accessed on 16 October 2019).
  3. Brüggemann, G.P.; Arampatzis, A.; Emrich, F.; Potthast, W. Biomechanics of double transtibial amputee sprinting using dedicated sprinting prostheses. Sports Technol. 2008, 1, 220–227. [Google Scholar]
  4. Hobara, H. Advantage or Disadvantage? Dynamic Joint Stiffness during Running Using Running-specific Prostheses. Descent Sports Sci. 2014, 35, 140–141. (In Japanese) [Google Scholar]
  5. Baum, B.S.; Schultz, M.P.; Tian, A.; Shefter, B.; Wolf, E.J.; Kwon, H.J.; Shim, J.K. Amputee Locomotion: Determining the Inertial Properties of Running-Specific Prostheses. Arch. Phys. Med. Rehabil. 2013, 94, 1776–1783. [Google Scholar]
  6. Dyer, B.; Sewell, P.; Noroozi, S. How should we assess the mechanical properties of lower-limb prosthesis technology used in elite sport?—An initial investigation. J. Biomed. Sci. Eng. 2013, 6, 116–123. [Google Scholar]
  7. Beck, O.N.; Taboga, P.; Grabowski, A.M. How do prosthetic stiffness, height and running speed affect the biomechanics of athletes with bilateral transtibial amputations? J. R. Soc. Interface 2017, 14, 20170230. [Google Scholar]
  8. Murai, A.; Hobara, H.; Hashizume, S.; Kobayashi, Y.; Tada, M. Modeling and analysis of individual with lower extremity amputation locomotion using prosthetic feet and running-specific prostheses. Conf. Proc. IEEE. Eng. Med. Biol. Soc. 2017, 2017, 901–904. [Google Scholar]
Figure 1. The developed impact testing apparatus. The impact speed can be controlled by adjusting the compressed length of a coil spring, and the position of the blade can be adjusted.
Proceedings 49 00145 g001
Figure 2. The commercially available blades (A and B) selected as measurement objects. Impact experiments were conducted on each blade with three different categories (numbers 1, 3, and 5).
Proceedings 49 00145 g002
Figure 3. Examples of typical high-speed images: (a) high-speed image before impact; (b) tracking image before impact; (c) tracking image at the phase of the maximum deformation of the blade. The x and z axes are defined as the direction parallel and vertical to the incidence direction of the impactor, respectively. Green dots and arrows represent tracked markers and the displacement of markers, respectively. The length and direction of the arrow expresses the magnitude and direction of the displacement, respectively.
Proceedings 49 00145 g003
Figure 4. Experimental results of the impact load response about the x axis: (a) blade A; (b) blade B. Time 0 represents the beginning of the impact, which was identified using high-speed images. The black, red and blue lines represent the results at impact speeds of 1.0, 1.3 and 1.6 m/s, respectively.
Proceedings 49 00145 g004
Figure 5. Experimental results of the displacement response about the x axis: (a) blade A; (b) blade B. The black, red and blue lines represent the results at impact speeds of 1.0, 1.3 and 1.6 m/s, respectively.
Proceedings 49 00145 g005
Figure 6. Experimental results of the ratio of velocity about the x axis: (a) blade A; (b) blade B. The error bars represent the standard deviation. The black, red and blue lines represent the results at impact speeds of 1.0, 1.3 and 1.6 m/s, respectively.
Proceedings 49 00145 g006
Figure 7. Experimental results of the average spring stiffness (ASS): (a) blade A; (b) blade B. The error bars represent the standard deviation. The black, red and blue lines represent the results at impact speeds of 1.0, 1.3 and 1.6 m/s, respectively.
Proceedings 49 00145 g007
Table 1. Photography conditions.
Frame rate (fps)2000
Shutter speed (s)1/5000
Image resolution (pixels)2560 × 1440
F number16
Lens focal length (mm)20
Distance between blade and cameras (mm)750–800
Table 2. The average and standard deviation of the maximum impact load (unit: N).
Blade1.0 m/s1.3 m/s1.6 m/s
A555 ± 8.74751 ± 3.14965 ± 2.89
B501 ± 4.94650 ± 2.76824 ± 6.18
Table 3. The average and standard deviation of the maximum displacement (unit: mm).
Blade1.0 m/s1.3 m/s1.6 m/s
A37.9 ± 1.3548.7 ± 0.39262.7 ± 0.569
B37.2 ± 0.24949.2 ± 0.10863.2 ± 0.576
Publisher’s Note: MDPI stays neutral with regard to jurisdictional claims in published maps and institutional affiliations.

