Proceeding Paper

Comparison between Indoor Sled Tests on the SkillrunTM Treadmill and Outdoor Field Tests at Increasing Sled Loads †

1
Department of Industrial Engineering, University of Padua, 35131 Padova, Italy
2
Department of Biomedical Sciences, University of Padova, 35131 Padova, Italy
3
Technogym Scientific Department, 47521 Cesena, Italy
*
Authors to whom correspondence should be addressed.
Presented at the 13th conference of the International Sports Engineering Association, Online, 22–26 June 2020.
Proceedings 2020, 49(1), 18; https://doi.org/10.3390/proceedings2020049018
Published: 15 June 2020

Abstract

:
The aim of the study was to compare the power output during indoor sprints on a SKILLRUNTM treadmill with the power output expressed in outdoor sprints pushing an instrumented sled. The SKILLRUNTM has been chosen because it is able to simulate the outdoor sprint pushing a sled setting different loads and providing performance output data like speed and power. Two athletes were involved in this pilot study and were asked to perform indoor and outdoor sprints with the same overloads. Two dynamometric handles were designed and applied both on the treadmill for the indoor sprints and on the sled for the outdoor sprints. Power data were calculated throughout the force measured at the handles and the speed collected during the sprints. Kinematics data of trunk and lower limbs were also calculated by means of a set of inertial sensors (Xsens, Enschede, The Netherlands). The power–speed and the load–speed curves together with the kinematics results derived from the indoor and outdoor tests were compared, showing, in general, a good agreement between the indoor and outdoor conditions. These results highlighted the validity of the SKILLRUNTM treadmill in simulating a sprint with overloads.

1. Introduction

Power production capability is a critical factor in sports performance, especially in sports which involve fast accelerations like sprinting. It is also correlated with the efficiency of sports activities [1,2].
SKILLRUNTM by Technogym is a motorized treadmill and can be used to simulate a sled push exercise, used by athletes and trainers to enhance neuromuscular performance [3] and muscular power. Research also showed that these exercises could engage a Post Activation Potentiation (PAP) effect with beneficial effects on performance [4].
Force and power during running were measured by several authors, [5,6] typically with a load cell attached with a cable to the athlete’s upper body [6] or on a nonmotorized force treadmill [5]. Only one study measured these parameters indoor with a treadmill instrumented with force plates and dynamometric handlebars [7].
Therefore, the main goal of this work was to investigate whether the sled push exercise simulated on the treadmill (indoor) was similar to the real one (outdoor) in terms of kinematics and power output.

2. Materials and Methods

2.1. Participants

Two athletes were enrolled for this pilot study (Table 1).

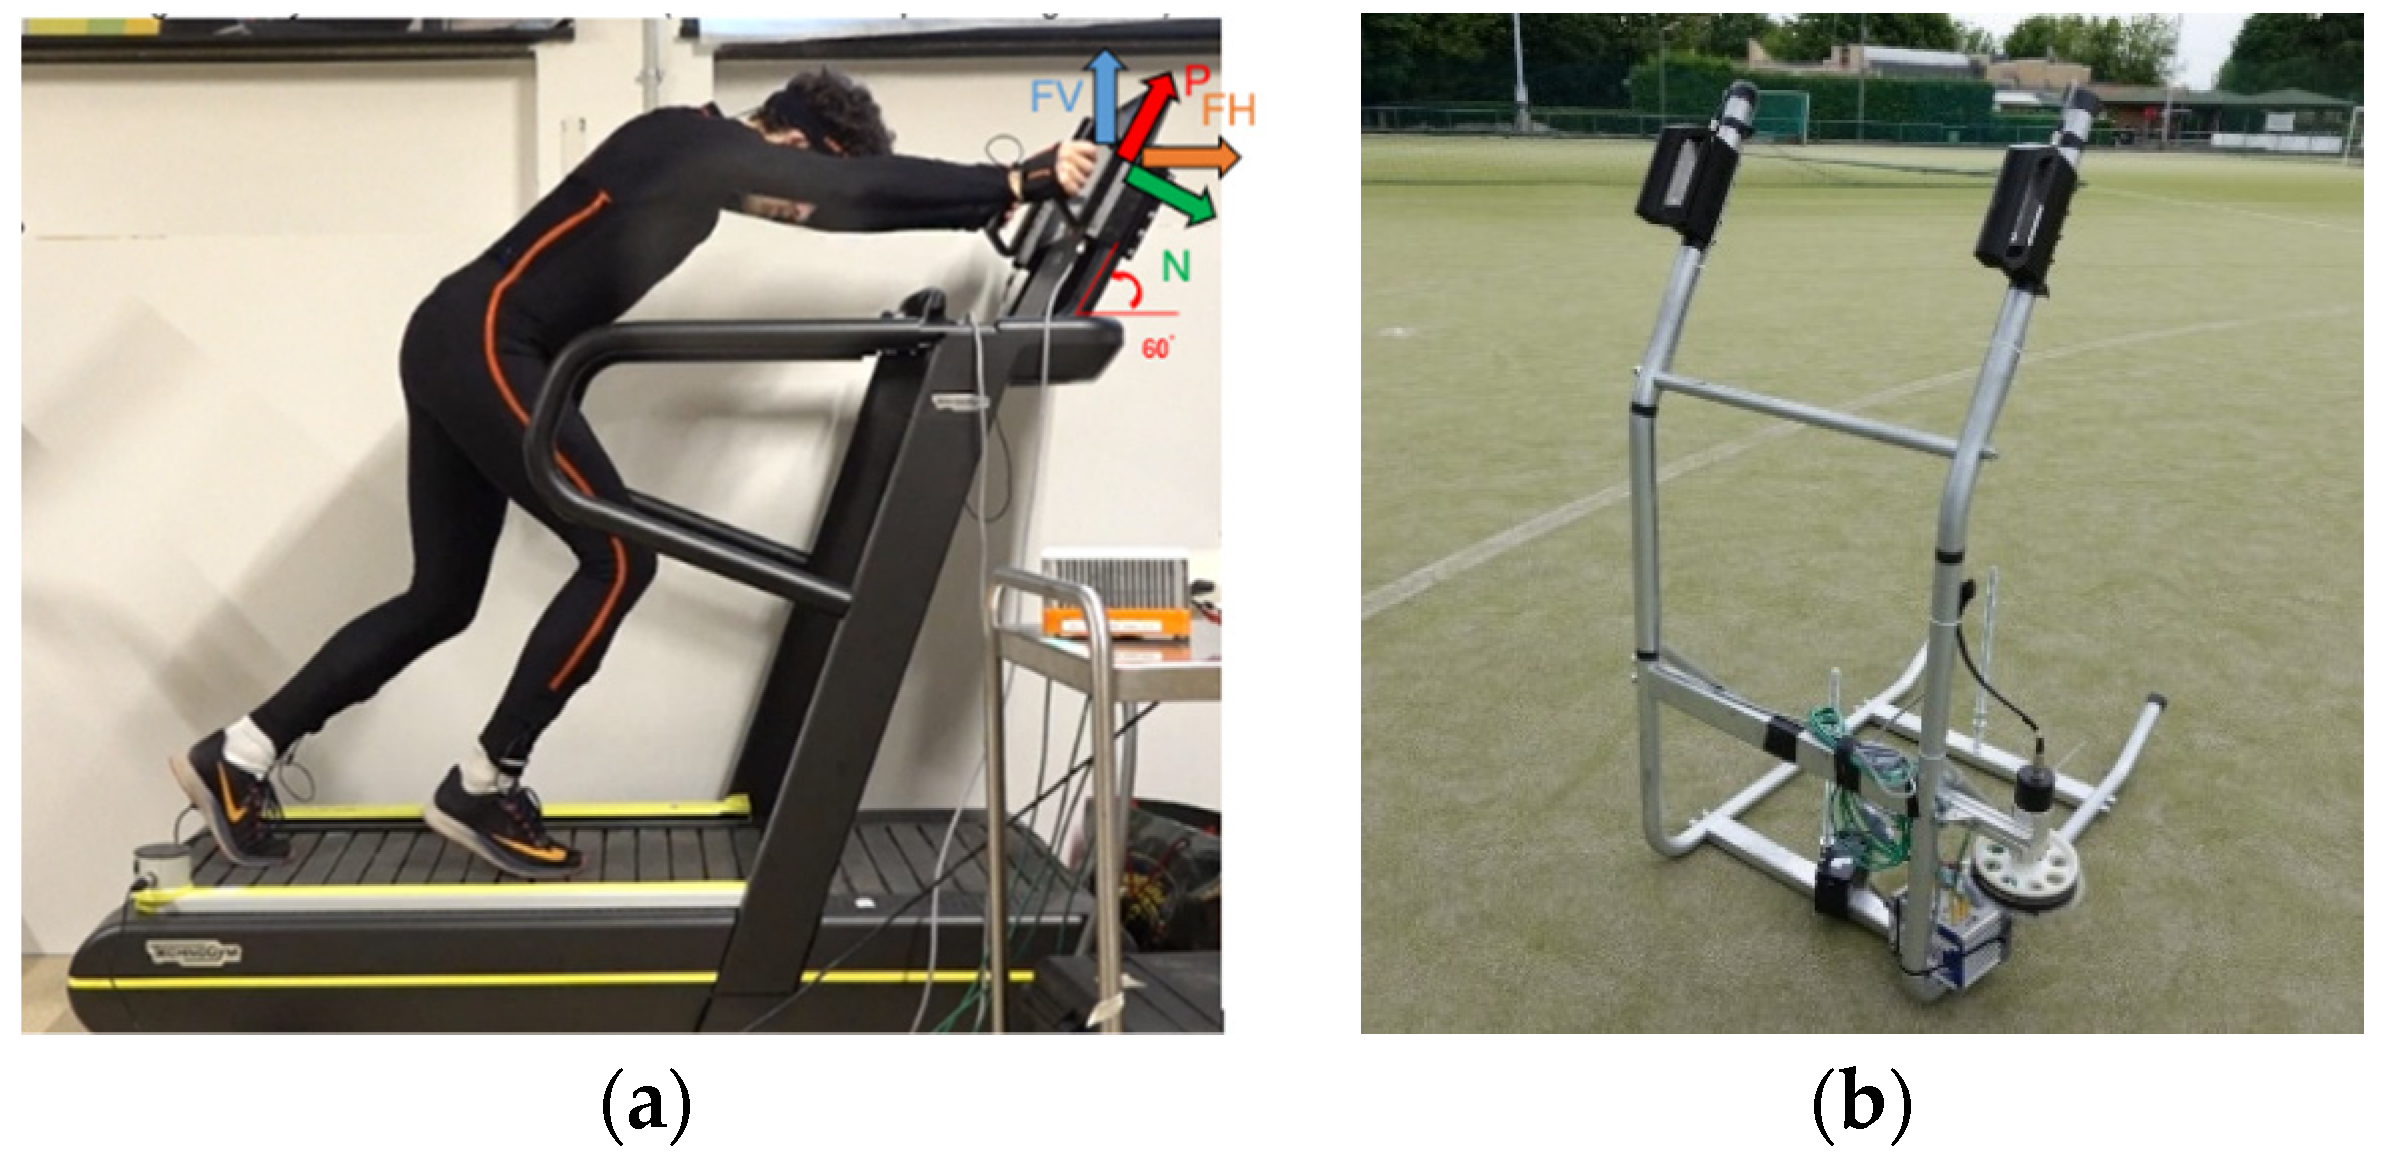
2.2. Instruments and Procedures

The kinematic variables were measured thanks to an Xsens suit (Enschede, The Netherlands) while to investigate the forces during sprinting a set of two dynamometric handles was specifically designed (see Figure 1a,b).
The dynamometric handles measured the Normal (N) and Parallel (P) force components (Figure 2a) in their reference system, which have been then converted into total horizontal and vertical forces.

2.3. Tests Protocol

For the indoor tests, a SKILLRUNTM treadmill was equipped with the 2 instrumented handles (Figure 2a). For the outdoor tests a specifically designed sled (Figure 2b) was equipped with:
  • Two instrumented handles (same as indoor tests);
  • One uniaxial accelerometer;
  • One encoder to measure the sled’s speed;
  • Somat eDAQ for data acquisition.
Several sprints with increasing sled loads were performed by each athlete and the temporal variation of the force applied to the handles was collected at 5 kHz with Somat eDAQ datalogger at each load step both indoor and outdoor.
More in detail, different loads were employed in the sprints as reported in Table 2. For each load condition, the two athletes performed 2 sprints of 25-m length. Rest after each sprint was set to 3 min. The fastest sprint for each load condition was used for the data analysis.
Loads were the same during the indoor and outdoor tests. However, since the weight of the outdoor sled was 30 kg, the outdoor sprints missed the 15-kg load step (Table 2).

2.4. Measured Variables

To compare the outdoor and indoor condition, the following variables were investigated:
  • Trunk lean angle;
  • Left and right hip angle (sagittal plane, flexion/extension);
  • Left and right knee angle (sagittal plane, flexion/extension);
  • Left and right ankle angle (sagittal plane, plantar/dorsiflexion);
  • Total horizontal force produced (FH, in orange, Figure 2a);
  • Total vertical force produced (FV, in blue, Figure 2a);
  • Power output calculated with handles’ measured forces.

2.5. Data Analysis

Post-processing analysis was carried out with a customized MATLAB script (MathWorks, Natick, MA, USA, r2019a). The power exerted during the tests was obtained multiplying the horizontal force (sum of horizontal force on both handles, left and right) elicited during the test by the average speed, when a steady state was reached (i.e., excluding the acceleration phase). The following Equation (1) was used for the indoor tests:
      P o w e r I N = F H i n d o o r x   B e l t _ S p e e d m e a n
The power in the outdoor tests was calculated as for the indoor tests with Equation (2):
P o w e r O U T = F H o u t x   S l e d _ S p e e d m e a n
For each load condition, the mean power value was computed as the average of the value obtained during the time integration period of 3 consecutive gait cycles at the steady-state condition subsequent to the acceleration phase. The SKILLRUNTM belt speed was obtained from its own datalogger and the sled’s speed during the outdoor tests from the encoder. The power values obtained for each load condition were then interpolated throughout a quadratic fit which allows estimating the power–velocity (P–V) relationship. A linear fit was employed to estimate the load–velocity (Load–V) relationship. This method of plotting P–V and Load–V relationships is called the multiple trial method [8].
Kinematics data were referred to as hip, knee and ankle angles in the sagittal plane. Raw data from the pelvis sensor (quaternion components) were post-processed to get the trunk inclination angle while the other flex/extension angles were given automatically by the full-body Xsens system.
Finally, two non-dimensional parameters were defined (Equations (3) and (4)):
R V = S p e e d _ O u t d o o r S p e e d _ I n d o o r  
R P = P _ H a n d l e s _ O u t d o o r P _ H a n d l e s _ I n d o o r  

3. Results

The figure below shows the plot obtained for athlete 1 (Figure 3). RMSE between each estimated curve was calculated for the P–V relationships of all testers (Table 3), as well as optimum velocities for power production v p .
Results for the kinematic comparison are reported in Table 4. Figure 4 shows the non-dimensional parameters’ trends defined in Equations (3) and (4).

4. Discussion

Power–velocity profiling is useful because it allows the athlete to train at the optimal load [9] to maximize power output (i.e., v P , i n in Figure 3).
The method developed allowed plotting P–V and Load–V relationships (both indoor and outdoor) with a good accuracy in terms of data fitting (Figure 3). Moreover, it can theoretically estimate the maximum velocity at 0-kg load (i.e., v_(max.out) in Figure 3), and the maximum load at zero velocity (i.e., L_(max.out) in Figure 3) [8].
However, looking at the P–V and Load–V plots, the theoretical maximum speed predicted by the P–V relationship is greater than that predicted by the load–velocity relationship.
This could be due to:
  • Experimental points are hard to obtain after the P–V curve maximum because a very lightweight sled (≈0 kg would be needed to reach maximum theoretical speed);
  • Possible influence on the power output of the running aerial phase, which increases as the speed increases.
As far as the non-dimensional parameters defined in Equations (3) and (4) are concerned:
  • RV seems to exponentially increase. We can speculate that higher sled loads can be pushed at higher running velocities in outdoor sprints;
  • RP seems to be around one for lighter sled load and suddenly increased at higher loads. We can hypothesize that the indoor sprints on the SKILLRUNTM did not allow pushing very heavy loads due to ergonomic issues.
Future research could also exclude the aerial phases in power computation, which tend to be predominant as the running speed increases, possibly using IMU’s data to calculate foot contact times [10]. A single-trial method to calculate power [8] could also be applied using the instantaneous velocity of the sled and force output on the handles during a single test.
A difference in results could also be caused by a different coefficient of friction between the real and simulated sled.

5. Conclusions

A method to compare indoor (simulated) and outdoor sled pushing exercise was developed. Although some differences were noticed, for the two athletes we tested, the exercise performed on the SKILLRUNTM was comparable to that performed outdoor in terms of kinematics (ROM) and power output. The increase in the sample size will be the next step to confirm these preliminary results.

Funding

This research did not receive any specific grant from funding agencies in the public, commercial, or not-for profit sectors.

Acknowledgments

The authors would like to thank Technogym Spa which provided the SKILLRUNTM for the indoor tests.

Conflicts of Interest

The authors declare no conflicts of interest.

References

  1. Cavagna, G.A.; Kaneko, M. Mechanical work and efficiency in level walking and running. J. Physiol. 1977, 268, 467–481. [Google Scholar] [CrossRef] [PubMed]
  2. Kaneko, M. Mechanics and energetics in running with special reference to efficiency. J. Biomech. 1990, 23, 57–63. [Google Scholar] [CrossRef]
  3. Morin, J.B.; Petrakos, G.; Jimenez-Reyes, P.; Brown, S.R.; Samozino, P.; Cross, M.R. Very-heavy sled training for improving horizontal-force output in soccer players. Int. J. Sports Physiol. Perform. 2017, 12, 840–844. [Google Scholar] [CrossRef] [PubMed]
  4. Seitz, L.B.; Mina, M.A.; Haff, G.G. A sled push stimulus potentiates subsequent 20-m sprint performance. J. Sci. Med. Sport 2017, 20, 781–785. [Google Scholar] [CrossRef] [PubMed]
  5. Brughelli, M.; Cronin, J.; Chaouachi, A. Effects of Running Velocity on Running Kinetics and Kinematics. J. Strength Cond. Res. 2011, 25, 933–939. [Google Scholar] [CrossRef] [PubMed]
  6. Morin, J.B.; Samozino, P.; Bonnefoy, R.; Edouard, P.; Belli, A. Direct measurement of power during one single sprint on treadmill. J. Biomech. 2010, 43, 1970–1975. [Google Scholar] [CrossRef] [PubMed]
  7. Funato, K.; Yanagiya, T.; Fukunaga, T. Ergometry for estimation of mechanical power output in sprinting in humans using a newly developed self-driven treadmill. Eur. J. Appl. Physiol. 2001, 84, 169–173. [Google Scholar] [CrossRef] [PubMed]
  8. Cross, M.R.; Samozino, P.; Brown, S.R.; Morin, J.B. A comparison between the force-velocity relationships of unloaded and sled-resisted sprinting: Single vs. multiple trial methods. Eur. J. Physiol. 2017, 118, 563–571. [Google Scholar] [CrossRef]
  9. Cross, M.R.; Lahti, J.; Brown, S.R.; Chedati, M.; Jimenez-Reyes, P.; Samozino, P.; Eriksrud, O.; Morin, J.B. Training at maximal power in resisted sprinting: Optimal load determination methodology and pilot results in team sport athletes. PLoS ONE 2018, 13, e0195477. [Google Scholar] [CrossRef] [PubMed]
  10. Schmidt, M.; Rheinländer, C.; Frederic, K.; Wille, S.; Wehn, N.; Jaitner, T. IMU-based determination of stance duration during sprinting. Procedia Eng. 2016, 147, 747–752. [Google Scholar] [CrossRef]
Figure 1. (a) Three-dimensional (3D)-printed handle and force channels; (b) Force components channels scheme.
Proceedings 49 00018 g001
Figure 2. (a) Unit vectors of measured and computed force components; (b) Sled for outdoor testing.
Proceedings 49 00018 g002
Figure 3. P–V and Load–V relationships for Athlete 1.
Proceedings 49 00018 g003
Figure 4. Non-dimensional parameters.
Proceedings 49 00018 g004
Table 1. Height, bodyweight, athletic level and age of the two participants.
Athletic LevelHeight (m)BW (kg)Age
ATHLETE 1Soccer player1.747223
ATHLETE 2Soccer player1.797423
Table 2. Sled loads used in the sprints.
Indoor Sled Loads (kg)Outdoor Sled Loads (kg)
ATHLETE 115-30-45-60-75-90-10030-45-60-75-90-100
ATHLETE 215-30-45-60-7530-45-60-75
Table 3. RMSE between curves and optimum velocities for power production.
AthleteRMSEIN−OUT (W) v P , I N [ k m h ] v P , O U T   [ k m h ] Lopt,out [kg]Lopt,in [kg]
13112.7146150
29912.7136848
Table 4. Mean kinematic data.
Total Load (kg) H i p   A n g l e K n e e   A n g l e A n k l e   A n g l e T r u n k   A n g l e
30Outdoor70°/−1°121°/14°35°/−37°51°/30°
Indoor70°/115°/5°33°/45°47°/36°
45Outdoor81°/−6°128°/13°34°/−35°52°/30°
Indoor68°/0°115°/9°26°/42°46°/34°
60Outdoor67°/−1°112°/15°32°/−35°51°/28°
Indoor70°/3°107°/11°36°/40°45°/33°
75Outdoor72°/−3°105°/12°35°/−35°44°/28°
Indoor70°/1°106°/9°33°/37°41°/32°
Publisher’s Note: MDPI stays neutral with regard to jurisdictional claims in published maps and institutional affiliations.

