Proceeding Paper

Use of an Inertial Measurement System to Calculate Maximal Power during Running Sprint Acceleration: Comparison with the Radar System †

1
French National Institute of Sport, Expertise and Performance, Sport, Expertise and Performance Lab, EA7370, 75012 Paris, France
2
Research Center on Sports and Mouvement, University of Paris Nanterre UFRSTAPS, 92001 Nanterre, France
3
Laboratory of Performance, Health, Metrology and Society, University of Reims, Champagne Ardennes UFRSTAPS, 51100 Reims, France
*
Author to whom correspondence should be addressed.
Presented at the 13th Conference of the International Sports Engineering Association, Online, 22–26 June 2020.
Proceedings 2020, 49(1), 23; https://doi.org/10.3390/proceedings2020049023
Published: 15 June 2020

Abstract

:
The maximal total power (Pmax) is one of the major determinants of sprint performance. It can be calculated using a simple model based on the runner’s velocity. This velocity has already been measured with force plates, video cameras or a radar system, but not with an inertial system. The purpose of this study was to compare Pmax measured with a radar system and with a multiple inertial sensors system. Seven participants (174.0 ± 6.9 cm; 67.7 ± 10.1 kg; 22.3 ± 1.7 years) realized two maximal 40-m sprints. Each athlete was equipped with an instrumented suit composed of 17 inertial measurement units (IMU) (Xsens), and a radar (Stalker ATS) was placed behind them. Both systems measured the athletes’ instantaneous horizontal velocity during the acceleration phase. Using an exponential model, Pmax, maximal velocity (Vmax), the slope of the exponential model (τ), maximal force (F0) and the slope of the force, the velocity relationship ( S F V ) was calculated. The results showed that Pmax, Vmax, τ, F0 and S F V were not significantly different between the radar and the Xsens system (p > 0.13). Pmax, Vmax and F0 measured with the radar were correlated with the same parameters measured with Xsens (r > 0.81 and p ≤ 0.03). The IMU system can be accurately used to measure the main parameters that determine the sprint running performance: Pmax, Vmax and F0. Moreover, contrary to the radar system, multiple inertial sensors will allow for an understanding of the role of the segments in maximal sprint running.

1. Introduction

The measurement of the force-velocity and power-velocity profiles (F-v and P-v) allows researchers to perform a precise analysis of the sprint performance determinants [1,2,3]. These authors demonstrated that, during the acceleration phase, the ability of the sprinter to produce force at high running velocities, magnitude, orientation of the horizontal ground reaction force (FH and DRF) and maximal power (Pmax) were highly correlated to sprint performance.
The reference technology for measuring F-v and P-v profiles is a series of force plates (FP) integrated in the ground on which the athlete is running. However, the number of FP generally integrated in the ground is limited and “requires data to be aggregated from multiple sprints to form a compiled single acceleration profile” [1,4]. Therefore, a more simple method has been developed and validated in order to measure F-v and P-v profiles [5]. This method is based on the measurement of the running velocity during the acceleration phase, and the data showed a good to very good agreement with the velocity assessed with a reference FP system.
One major limitation of the FP system or simple method is that only the measurement of the centre of mass’ (CoM) velocity or an associated point is possible. Therefore, these macroscopic methods do not allow us to understand the role of the different limbs. To go deeper into the sprint performance comprehensive mechanisms, the analysis of the limbs’ influence on the F-v and P-v profiles is key [6].
Optoelectronic systems are generally used in order to accurately measure the motion of human CoM and segments. However, optoelectronic recording confines the measurements to laboratories and is very time consuming in terms of marker positioning on the participants, marker digitalization and tracking. These past few years, devices with small sensors have been increasingly used for measuring human motion in sport. The Xsens MVN Biomech Link system allows for specific human motion measurements in sport training, using 17 connected inertial sensors (MVN Biomech). This system has recently been validated for postural human motion [7] and kicking biomechanical analysis [8]. However, a complete inertial measurement system (IMS) allowing to reconstruct the position of the CoM has never been used in sprint running. Within this specific activity, IMS allows for the measurement of both CoM and limbs motion during the entire acceleration phase. Therefore, it constitutes a unique way for future analyses to understand the sprint running performance determinants. Thus, the purpose of this study was to compare F-v and P-v profiles measured with a radar system and with an IMS during a single sprint acceleration.

2. Materials and Methods

2.1. Participants

Seven experienced sprint runners volunteered to participate in this study (mean stature: 174.0 ± 6.9 cm; body mass: 67.7 ± 10.1 kg; age: 22.3 ± 1.7 years). This study was carried out in accordance with the Declaration of Helsinki. All the participants were informed of the objectives and risks of the study.

2.2. Protocol

Before the testing session, a standardized warm-up was organized under the supervision of the investigator. The participants were asked to perform two maximal 40-m sprints. Sprint performance was measured regarding the 40-m time (Brower Timing System Draper, Draper, UT, USA). Each participant’s best sprint performance was kept and analyzed. Participants wore an IMS (MVN Biomech Link suit; Xsens Technologies BV, Enschede, The Netherlands) collecting live kinematic data throughout the entire movement. This suit was composed of 17 miniature inertial measurement units (IMU) strapped onto the body. Each IMU contains a 3D gyroscope, a 3D accelerometer and a 3D magnetometer encased in an 18 g box (about the size of half a matchbox: 3.5 × 2.5 × 0.8 cm). Each IMU captures the 6 degrees of freedom of the body segments to which it is fixed, in real time, at a sampling frequency of 240 Hz. Based on the linear velocity and acceleration of each segment computed from the IMU, the Xsens software gives the instantaneous runner’s CoM velocity during the acceleration phase.
A radar (Stalker ATS II, Richardson, TX, USA) was placed behind the runner in order to measure his instantaneous velocity during the acceleration phase.

2.3. Data Processing

Both systems measured either the runner’s instantaneous horizontal velocity (radar system) or his CoM velocity (IMS). For both systems, velocity over time (V) during the acceleration phase was fitted using an exponential model [5,9]:
V t = V m a x . 1 e t τ
where V m a x is the maximal velocity reached at the end of the acceleration phase and τ is the acceleration time constant. The acceleration a of the runner, or his CoM acceleration, over time during the acceleration phase can be expressed after derivation of V (t) over time, respectively, as follows:
a t = V m a x τ . e t τ
Applying the fundamental laws of dynamics, the ground reaction force ( F ) applied to the body’s CoM can be modeled over time as [5]:
F t = m . a t + F a e r o t
where m is the body mass of the runner (kg) and F a e r o t the aerodynamic drag to overcome during sprint running. The measurement with the radar and the Xsens system was made during the same run. Thus F a e r o t was the same for both systems. To compare both systems, F t can be simplified as m . a t . Power is calculated as the product of F t with V t .
Individual F-v and P-v relationships were determined for both methods from V values using the least-square method [1,3,5]. F-v relationships were extrapolated to obtain maximal theoretical force and velocity ( F 0 and V 0 ) as the intercepts of the F-v curve with the force and velocity axes, respectively. The slope of the F-v ( S F V ) value was determined for each subject as the slope of the F-v relationship, and maximal power ( P m a x ) was determined as the maximum of the P-v relationship.

2.4. Statistical Analyses

Differences between both methods (Radar vs. IMS) were analyzed with a non-parametric Wilcoxon test and a Spearman test correlation. For all statistical analyses, a p value of 0.05 was considered to indicate significance. All data are presented as means ± standard deviations (SD) unless otherwise indicated. A Bland & Altman test was also conducted to compare the data on force, power and velocity obtained during the entire acceleration phase.

3. Results

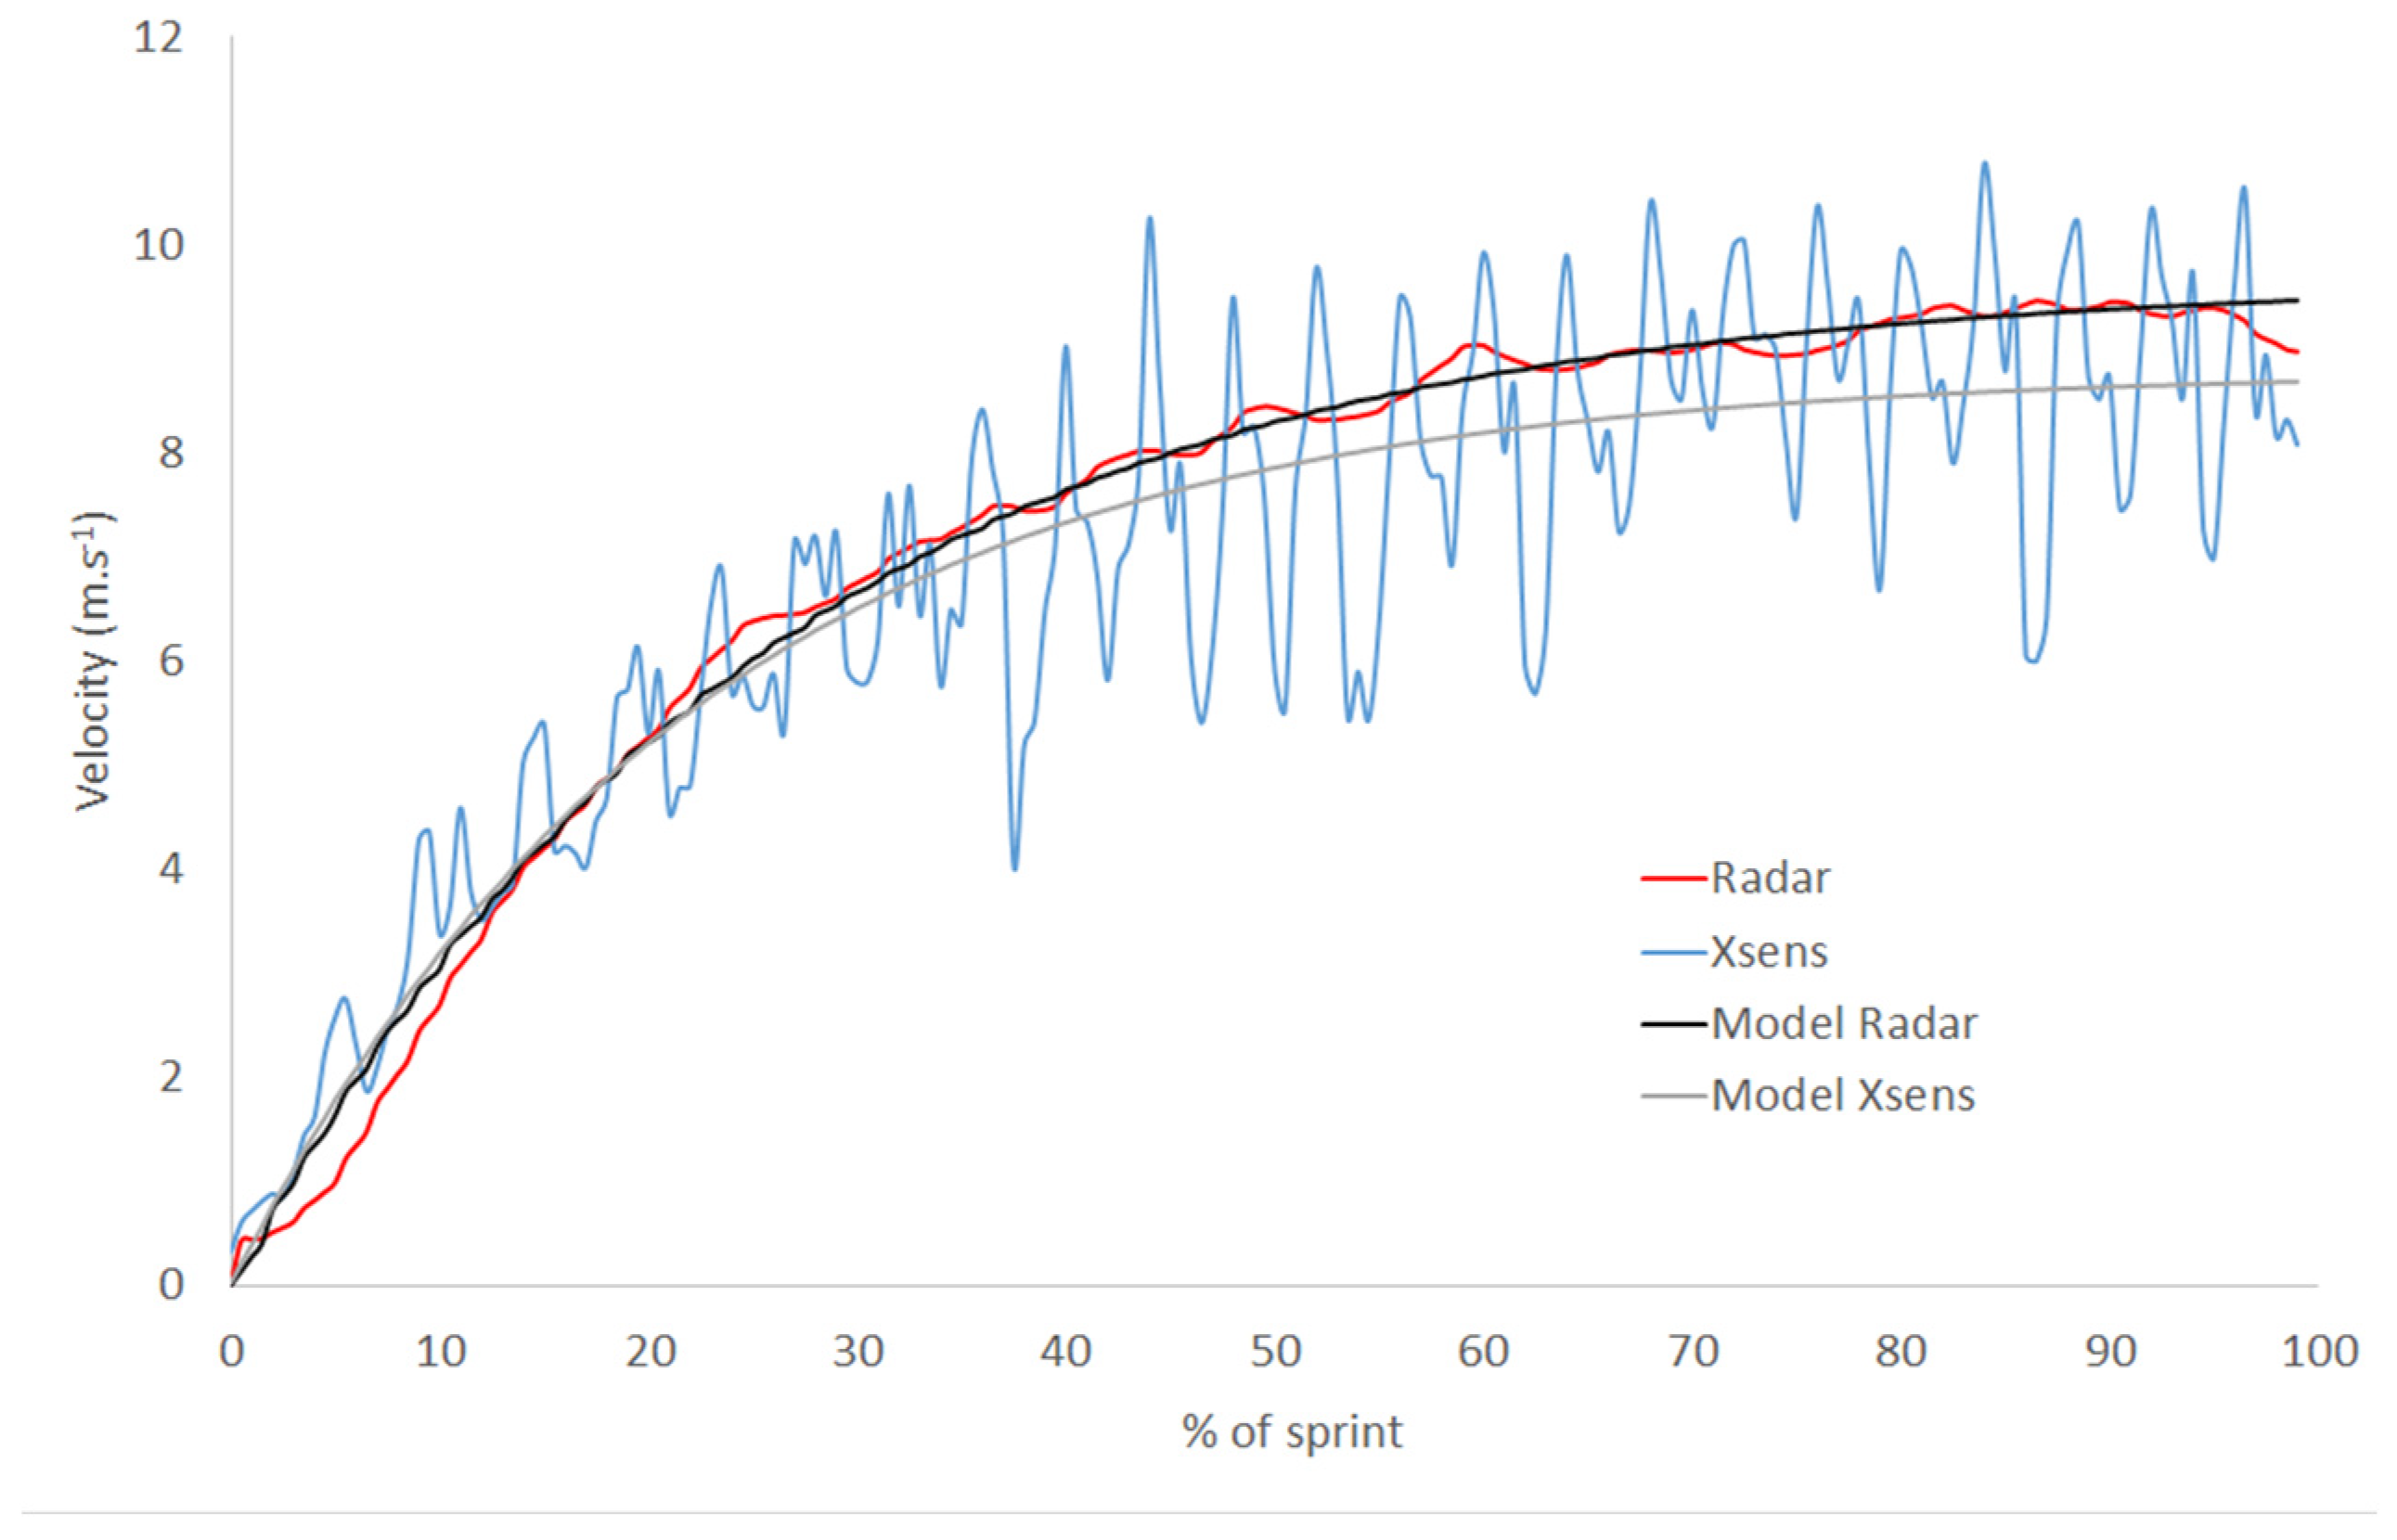
3.1. Velocity Time Relationship

Figure 1 illustrates a typical velocity-time relationship obtained with the IMS and radar systems. Both curves were fitted using the equation of V t and allowed to extrapolate V m a x and τ, for the Xsens and the radar system. The data are presented in Table 1.

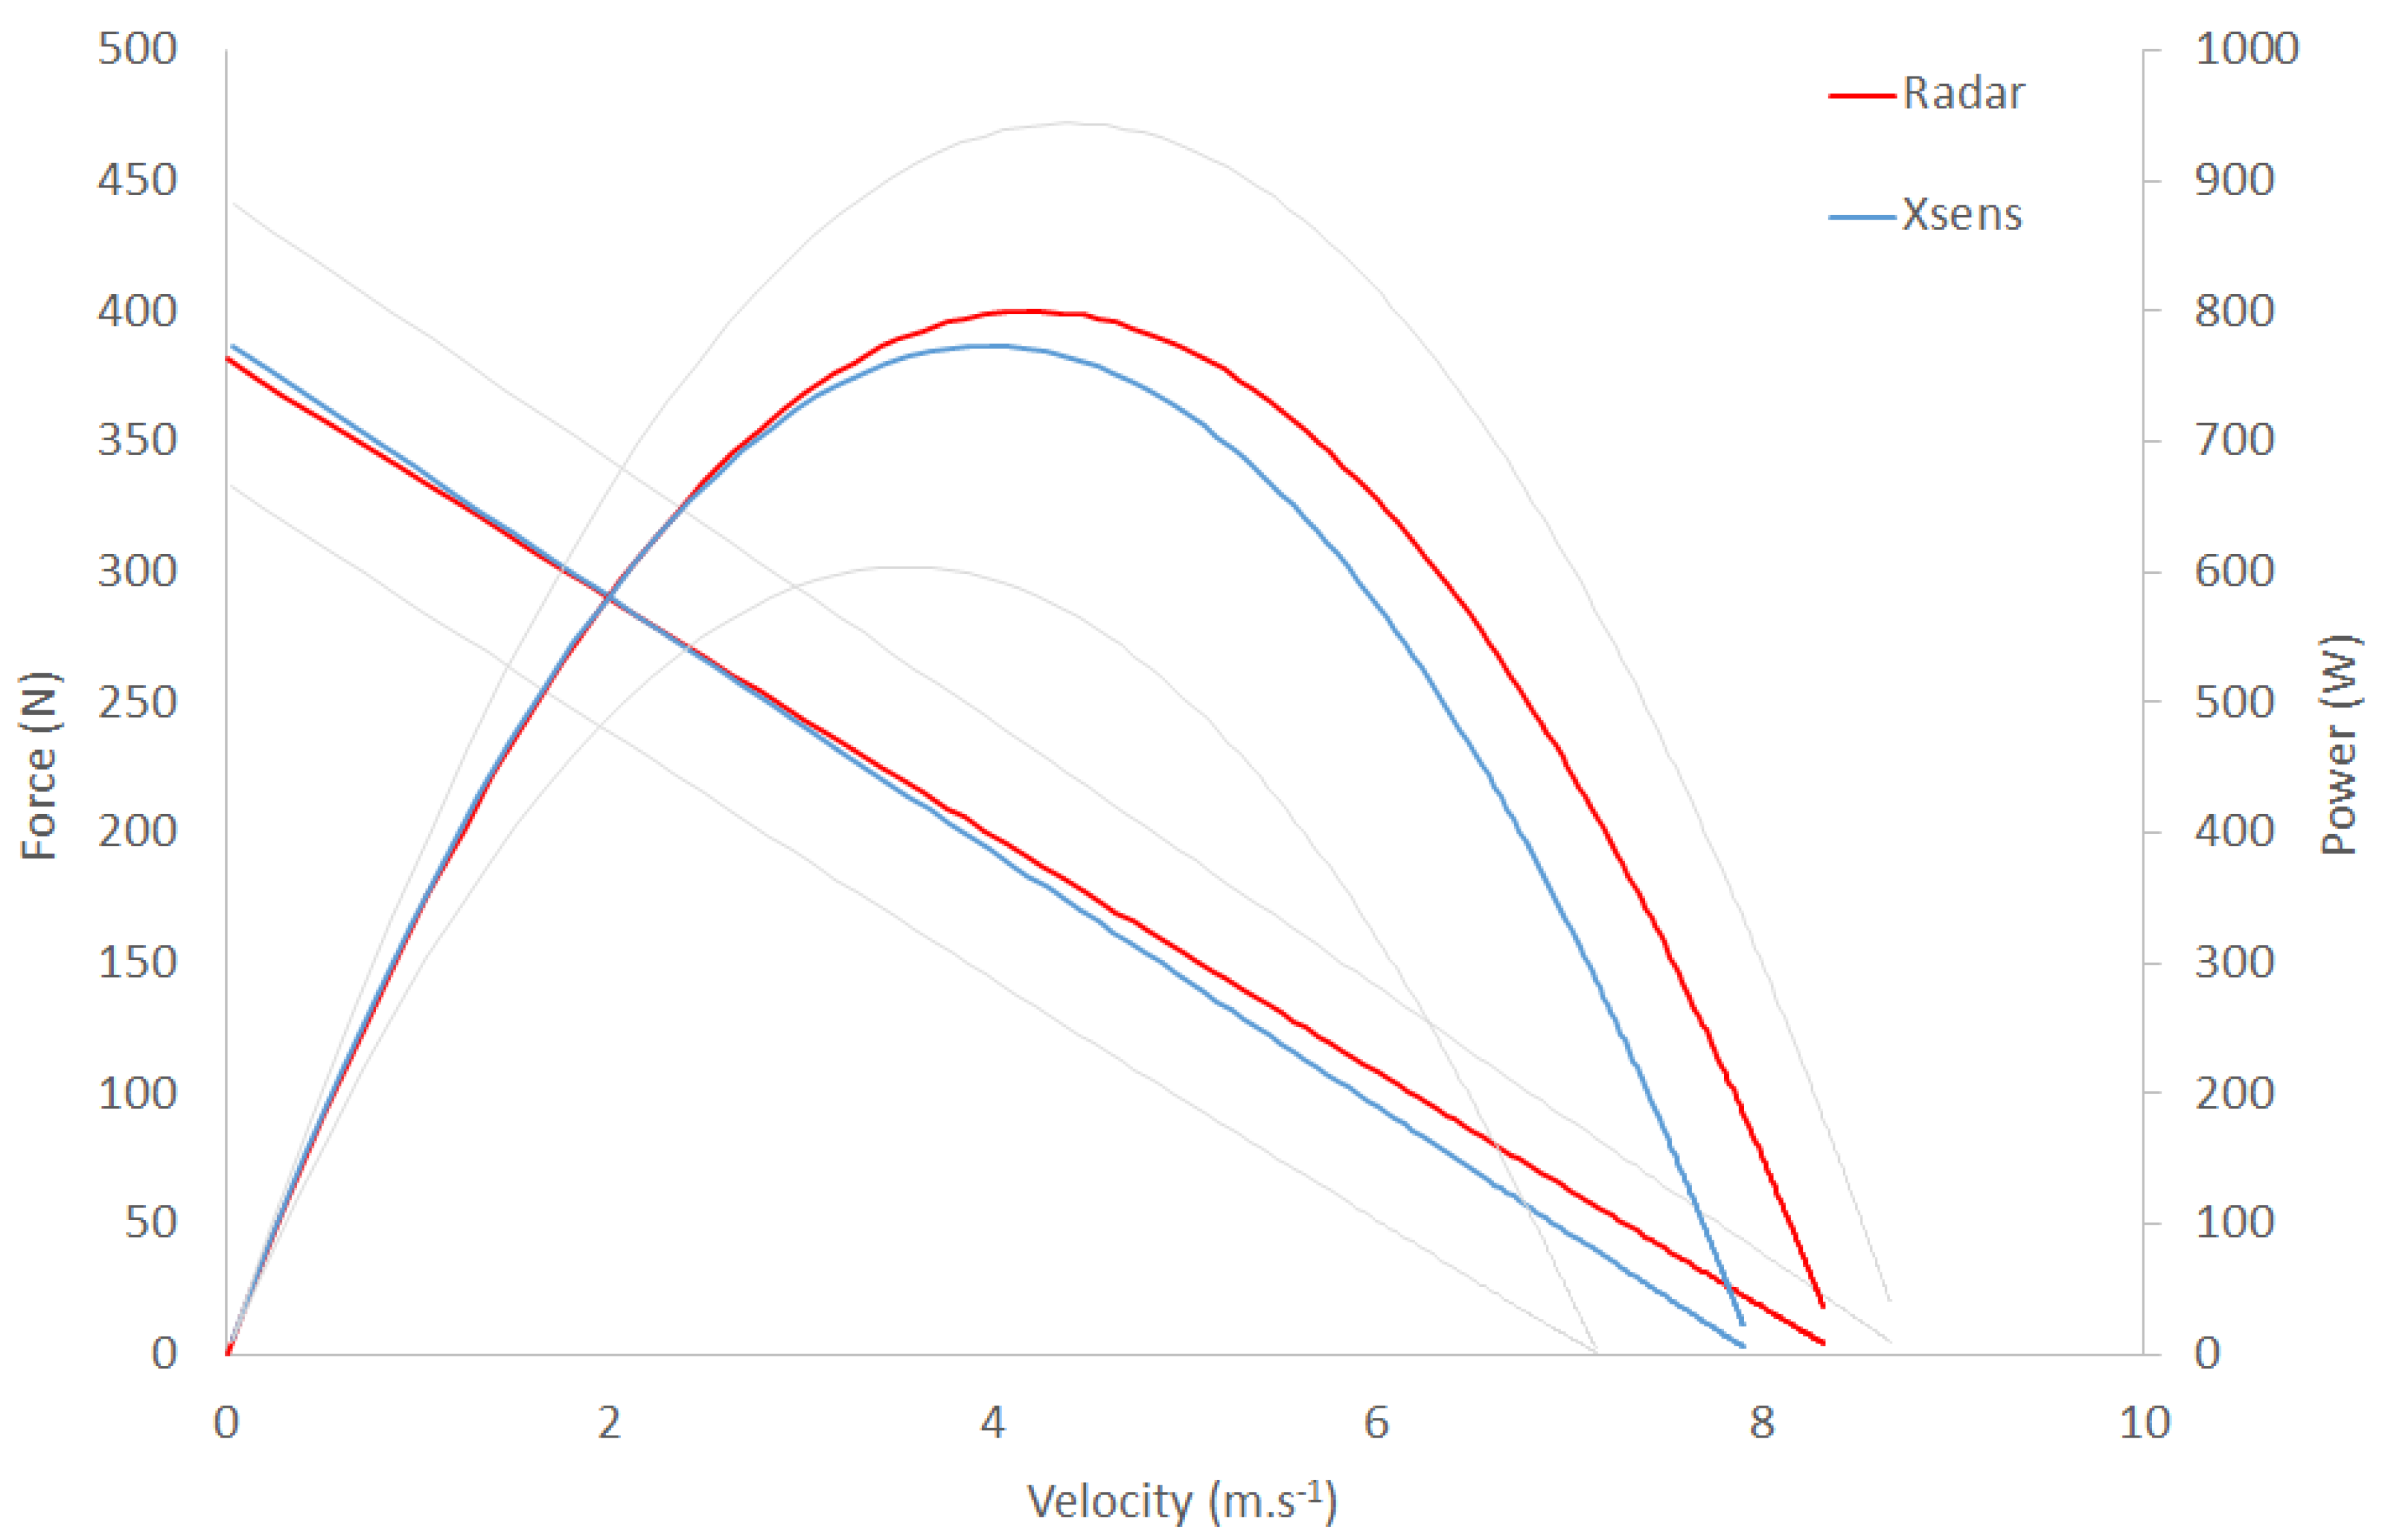
3.2. F-v and P-v Relationships

Figure 2 presents typical F-v and P-v profiles obtained with the radar and IMS. Table 2 shows that there were no significant differences between F 0 , V 0 , S F V or P m a x calculated either with the radar or IMS.

4. Discussion

The purpose of this study was to compare F-v and P-v profiles measured with a radar system and with an IMS during a single sprint acceleration. The present results demonstrate that during a single sprint running, no significant differences and good correlations were observed in the velocity-time curve and in the F-v and P-v profiles between radar and IMS. The Bland & Altman test only demonstrated low reliability for power.
The present data, obtained with both systems, are slightly different from those recently obtained in the literature with a radar system [10]. These authors found values of F0, V0, Pmax and SFV about 20% greater than those of the present study. The participants involved in this study were less experimented in sprint running and may have presented poorer F-v and P-v profiles than the other ones presented in previous studies [11].
Radar and IMS produced results that were not significantly different when measuring the velocity of the body’s CoM during sprinting. The coefficient of variation between both systems was within 1.5% to 7%. No significant differences were observed, and good correlations were established (Table 2). These results suggested that either the IMS or radar system can be used with confidence to measure F0, V0, Pmax and SFV during the sprint acceleration phase. The Bland & Altman test demonstrated good reliability for force and velocity but not for power. We did not find differences in Pmax between system however, the Band Altman test demonstrated low reliability for power. This result can be associated to measurement errors in the IMS and in the radar. On the one hand, the magnetic distortion caused by ferrous objects in the testing area induced a drift in the measurement [8]. On the other hand, the radar system does not directly measure CoM velocity, but only one point in the back of the body (the radar was placed behind the runner). The running velocity estimated from one point in the back is up to 25% larger than the running velocity measured at the CoM level [12]. Moreover, compared to the force plates, the radar system recorded a higher running velocity (around 3%) [5]. However, the Xsens system has never been validated against the force plate system, which represents the gold standard method. Compared to the radar system, the Xsens system measures the CoM velocity and the position of the CoM of each body segment. Thus, the Xsens system allows for the measurement of the F-v and P-v profiles (as the radar system) and the opportunity to go deeper into the understanding of the role of the body segments during sprinting.

5. Conclusions

The results of the present study support the use of IMS to accurately measure the CoM velocity and to extrapolate the F-v end P-v profiles. In comparison to the radar system, IMS offers the advantage of enabling an easy investigation of the movements of the joints and segments. IMS offers various benefits over the radar system or classical motion analysis system during the sprint acceleration phase, allowing for the understanding of the body segments’ role throughout the whole movement. This approach will provide valuable information for practitioners and athletes to refine their training practices. It can be assumed that the Xsens system can also be used during training without a restriction of the area recording or light conditions.

Conflicts of Interest

All authors approved the final version of the article and all declare that they have no conflicts of interest in relation to the present study.

References

  1. Rabita, G.; Dorel, S.; Slawinski, J.; Sàez-de-Villarreal, E.; Couturier, A.; Samozino, P.; Morin, J.B. Sprint mechanics in world-class athletes: A new insight into the limits of human locomotion. Scand. J. Med. Sci. Sports 2015, 25, 583–594. [Google Scholar] [CrossRef] [PubMed]
  2. Morin, J.; Samozino, P.; Edouard, P. Effectiveness of force application in sprint running: Definition of concept and relationship with performance. Comput. Methods Biomech. Biomed. Eng. 2011, 14, 173–175. [Google Scholar] [CrossRef]
  3. Slawinski JTermoz, N.; Rabita, G.; Guilhem, G.; Dorel, G.; Morin, J.B.; Samozino, P. How 100-m event analyses improve our understanding of world-class men’s and women’s sprint performance. Scand. J. Med. Sci. Sports. 2017, 27, 45–54. [Google Scholar] [CrossRef]
  4. Morin, J.B.; Samozino, P.; Murata, M.; Cross, M.; Nagahara, R. A simple method for computing sprint acceleration kinetics from running velocity data: Replication study with improved design. J. Biomech. 2019, 94, 82–87. [Google Scholar] [CrossRef] [PubMed]
  5. Samozino, P.; Rabita, G.; Dorel, S.; Slawinski, J.; Peyrot, N.; De Villarreal, E.; Morin, J.B. A simple method for measuring power, force, velocity properties, and mechanical effectiveness in sprint running. Scand. J. Med. Sci. Sports 2016, 26, 648–658. [Google Scholar] [CrossRef] [PubMed]
  6. Slawinski, J.; Bonnefoy, A.; Ontanon, G.; Leveque, J.M.; Miller, C.; Riquet, A.; Chèze, L.; Dumas, R. Segment-interaction in sprint start: Analysis of 3D angular velocity and kinetic energy in elite sprinters. J. Biomech. 2010, 43, 1494–1502. [Google Scholar] [CrossRef] [PubMed]
  7. Dinu, D.; Fayolas, M.; Jacquet, M.; Leguy, E.; Slawinski, J.; Houel, N. Accuracy of Postural Human-motion Tracking Using Miniature Inertial Sensors. Procedia Eng. 2016. [Google Scholar] [CrossRef]
  8. Blair, S.; Duthie, G.; Robertson, S.; Hopkins, W.; Ball, K. Concurrent validation of an inertial measurement system to quantify kicking biomechanics in four football codes. J. Biomech. 2018, 73, 24–32. [Google Scholar] [CrossRef] [PubMed]
  9. di Prampero, P.E.; Botter, A.; Osgnach, O. The energy cost of sprint running and the role of metabolic power in setting top performances. Eur. J. Appl. Physiol. 2015, 115, 451–469. [Google Scholar] [CrossRef] [PubMed]
  10. Jimenez-reyes, P.; Cuadrado, V. Differences in sprint mechanical force-velocity profile between trained soccer and futsal players. J. Sport. Physiol. Perform. 2019, 14, 478–485. [Google Scholar] [CrossRef] [PubMed]
  11. Helland, C.; Haugen, T.; Rakovic, E.; Eriksrud, O.; Seynnes, O.; Mero, A.A.; Paulsen, G. Force–velocity profiling of sprinting athletes: Single-run vs. multiple-run methods. Eur. J. Appl. Physiol. 2019, 119, 465–473. [Google Scholar] [CrossRef] [PubMed]
  12. Slawinski, J.; Billat, V.; Koralsztein, J.P.; Tavernier, M. Use of lumbar point for the estimation of potential and kinetic mechanical power in running. J. Appl. Biomech. 2004, 20, 324–331. [Google Scholar] [CrossRef]
Figure 1. Time-velocity relationship obtained with the inertial measurement system (IMS) (Xsens) and the radar system and fitted using an equation.
Proceedings 49 00023 g001
Figure 2. Average force-velocity and power-velocity profiles calculated either with the radar or IMS (Xsens). Grey lines represent the standard deviation for Xsens system.
Proceedings 49 00023 g002
Table 1. Comparison of maximal velocity and the acceleration time constant calculated using the radar and the IMS (Xsens).
Mean Radar (±SD)Mean IMS (±SD)WilcoxonSpearman
V m a x (m·s−1)8.42 ± 1.117.96 ± 0.800.13r = 0.97; p ≤ 0.001
τ (s)1.26 ± 0.121.18 ± 0.110.45r = 0.35; p = 0.44
Table 2. Comparison of maximal velocity and the acceleration time constant calculated using either the radar or IMS (Xsens).
Mean Radar (±SD)Mean IMS (±SD)WilcoxonSpearman
V 0 (m·s−1)8.42 ± 1.117.94 ± 0.800.13r = 0.97; p ≤ 0.001
F 0 (N)381.5 ± 50.0387.0 ± 54.10.61r = 0.81; p = 0.03
S F V (N/ m·s−1)−45.5 ± 4.4−48.7 ± 4.50.45r = 0.31; p = 0.5
P m a x (W)811.5 ± 183.8780.1 ± 168.10.45r = 0.96; p ≤ 0.001
The Bland & Altman test showed a good reliability for force and velocity (respectively, limit of agreement <4 N and <3 m·s−1 and bias 1 N and 1.8 m·s−1), but low reliability for power (limit of agreement of 103 W and bias of 50 W).
Publisher’s Note: MDPI stays neutral with regard to jurisdictional claims in published maps and institutional affiliations.

