Proceeding Paper

Numerical Investigation of the Flow around a Feather Shuttlecock with Rotation †

1
Centre for Sports Engineering Research, Academy of Sport & Physical Activity, Sheffield Hallam University, Sheffield S10 2NA, UK
2
Engineering & Mathematics, Faculty of Science Technology & Arts, Sheffield Hallam University, Sheffield S1 1WB, UK
*
Author to whom correspondence should be addressed.
Presented at the 13th Conference of the International Sports Engineering Association, Online, 22–26 June 2020.
Proceedings 2020, 49(1), 28; https://doi.org/10.3390/proceedings2020049028
Published: 15 June 2020

Abstract

:
This paper presents the first scale resolving computational fluid dynamic (CFD) investigation of a geometrically realistic feather shuttlecock with rotation at a high Reynolds number. Rotation was found to reduce the drag coefficient of the shuttlecock. However, the drag coefficient is shown to be independent of the Reynolds number for both rotating and statically fixed shuttlecocks. Particular attention is given to the influence of rotation on the development of flow structures. Rotation is shown to have a clear influence on the formation of flow structures particularly from the feather vanes, and aft of the shuttlecock base. This further raises concerns regarding wind tunnel studies that use traditional experimental sting mounts; typically inserted into this aft region, they have potential to compromise both flow structure and resultant drag forces. As CFD does not necessitate use of a sting with proper application, it has great potential for a detailed study and analysis of shuttlecocks.

1. Introduction

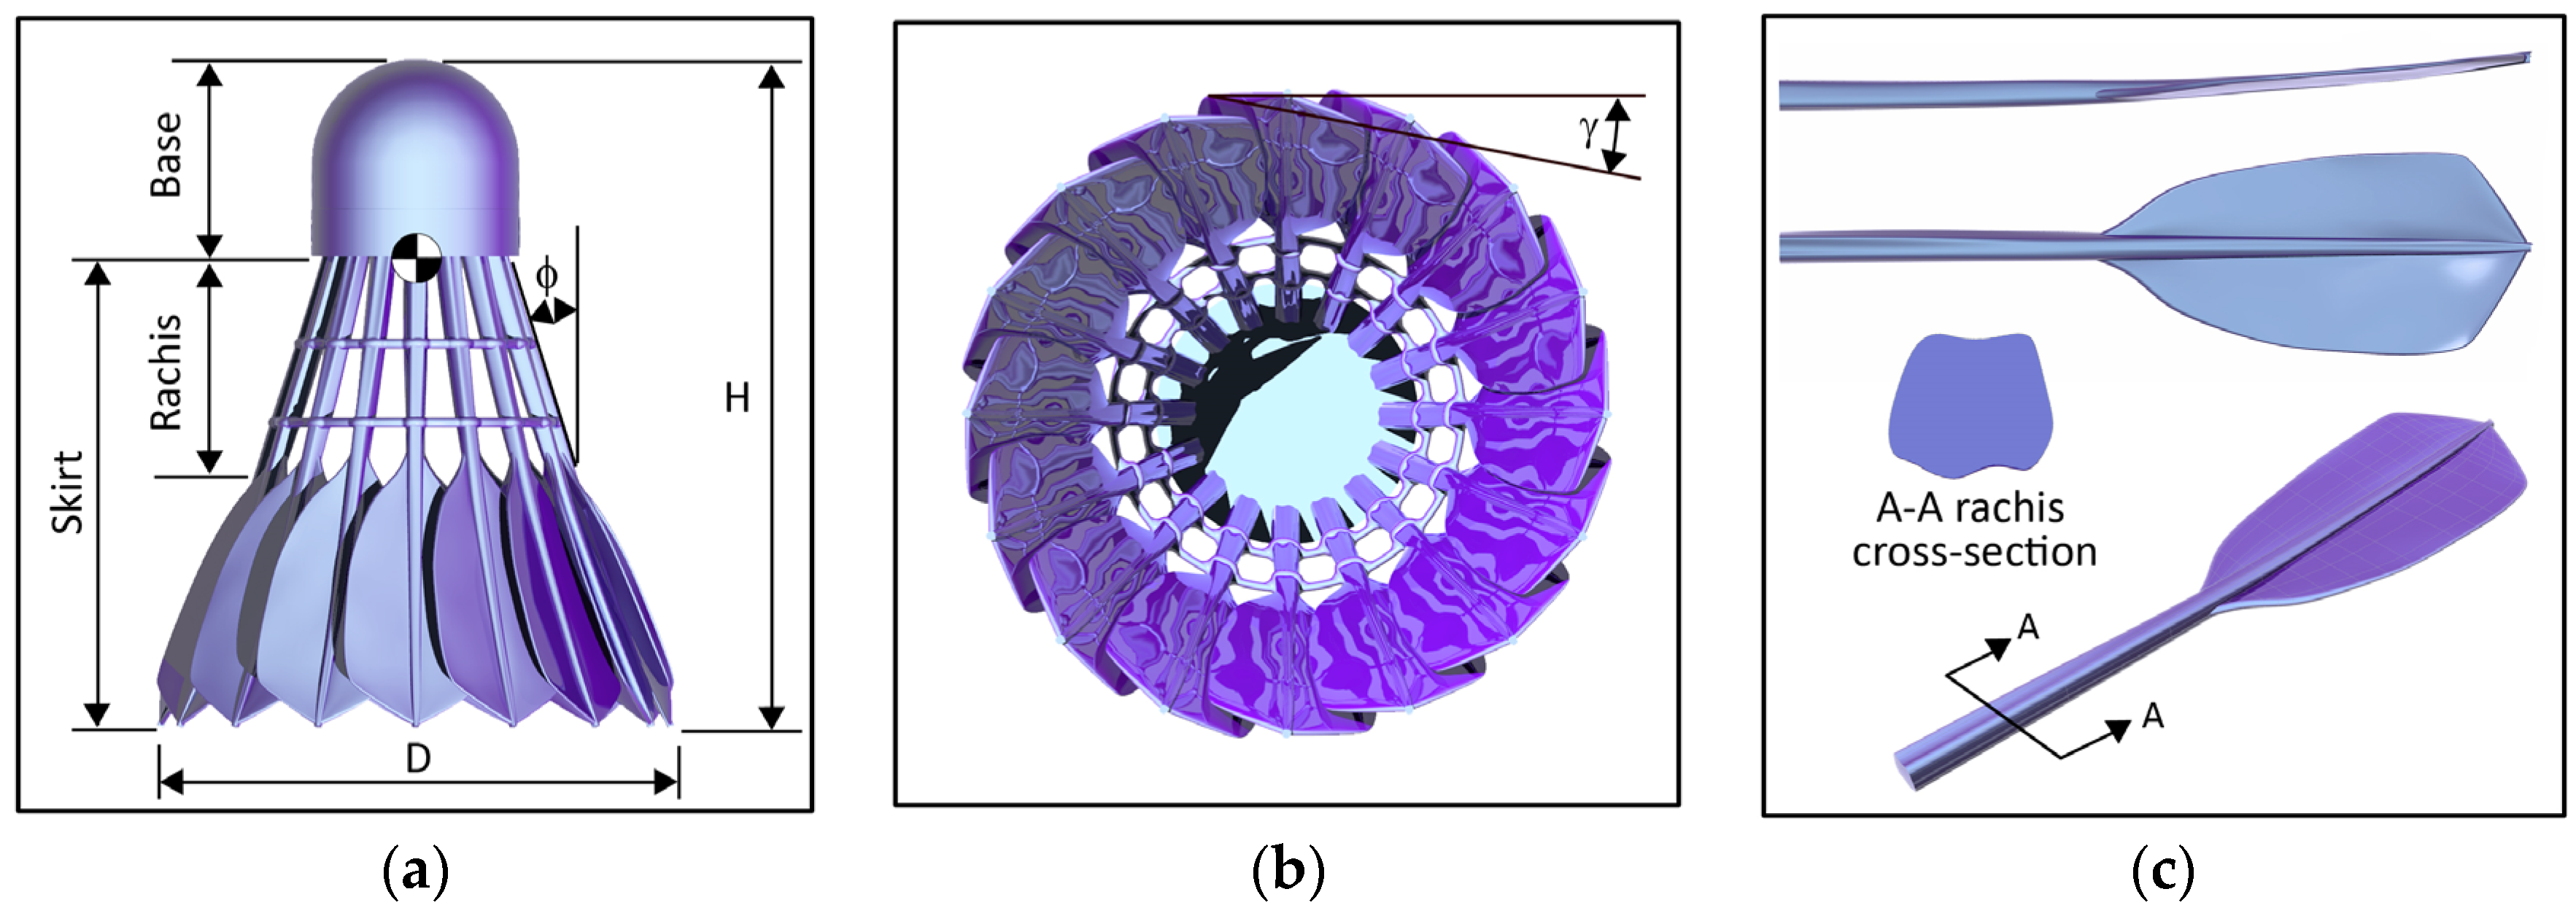
Feather shuttlecocks, as porous conical bluff bodies, are aerodynamically unique sports projectiles. Incomparable in form and mass, and associated with high flight speeds and high spin, shuttlecocks exhibit the largest inflight deceleration of any sports projectile. These traditional shuttlecocks are constructed using 16 waterfowl feathers that have been trimmed to create a specific vane shape. The shaped feathers are inserted into a predrilled fabric covered cork base and aligned to create a conical skirt of overlapping feather vanes. Feather shuttlecocks are considered aerodynamically superior to synthetic polymer variations, despite the extensive efforts of manufacturers to create a synthetic shuttle with comparable performance. As such, the aerodynamic behavior of these projectiles has proved of interest to researchers. However, published experimental and wind tunnel investigations of shuttlecocks present values of drag coefficients that vary widely [1], ranging from 0.48 < Cd < 0.74. Some variance may be expected for a natural product, however many of these investigations use different designs of experimental sting to support the shuttlecock. Some designs allow for free rotation of the shuttlecock about the longitudinal axis, whilst others hold the shuttlecock statically fixed. Differing effects of rotation have been demonstrated [2,3]. Cohen et al. [2] reported a lower average drag coefficient (Cd ~ 0.68) for a freely rotating shuttlecock, than when statically fixed (Cd ~ 0.74). In contrast, Kitta et al. [3] reported a marginally higher average drag coefficient (Cd ~ 0.61) for freely rotating conditions compared to statically fixed (Cd ~ 0.56). It is known that shuttlecocks experience a reduction in skirt diameter as the Reynolds number Re increases [3,4]. However, it has been shown that there is no significant difference in skirt diameter, between rotating and static conditions; until Re > 2.1 × 10⁵ when centrifugal forces acting on a spinning shuttlecock caused an abrupt expansion of the skirt [3,4]. There is no doubt that the variation in drag between rotating and static conditions may be considered slight, however this is still an important aspect of performance to understand. It is believed that reported differences in behavior with rotation may be attributable to the aerodynamic sting. Traditionally inserted into the aft of the shuttlecock base, air movement through this region is known to have a significant influence on aerodynamic performance [1,4,5]. Concerns have been raised about the insertion of such experimental equipment into a region that has been shown to have significant influence on the measured performance of the shuttlecock [1]. Computational fluid dynamics (CFD) do not require use of an experimental sting. With careful and robust application, CFD has been shown to have great potential for the prediction and understanding of the aerodynamic performance of shuttlecocks [1]. All previous CFD studies [1,5,6,7,8] however have considered the projectile as being stationary. This paper presents a numerical comparison between a rotating and statically fixed geometrically realistic feather shuttlecock at high Re. Scale resolving turbulence models are applied to study the formation and structure of vortices.

2. Method

2.1. Shuttlecock Geometry

The geometry was based on a readily available Yonex Aerosensa 50, a traditional cork and goose feather shuttlecock. This geometry was created using a combination of traditional measures and laser scanning metrology. The modeled geometry is shown in Figure 1. Laser scanning was used to accurately capture the complex form of the individual feather vanes and their shaft, or rachis. It can be seen that the vanes curve along their length and it is not possible to accurately recreate this detail or the rachis cross-section shape without scanning the original forms. The shuttlecock skirt comprises 16 individual feathers inserted into the cork base with angles ϕ = 20° and γ = 12° (defined in Figure 1). Twine binding the individual feathers has a cord diameter of 1.4 mm. Total shuttlecock height was H = 86 mm and the maximum skirt diameter D = 66 mm.

2.2. Boundary Conditions

A global stationary cylindrical domain of diameter 9D was created around the shuttlecock, with the major rotation axis of the shuttlecock and domain aligned. This global domain was split to create a subdivided rotating region, called the rotating domain. The rotating domain is specified as a cylinder that entirely encloses the shuttlecock geometry. Splitting the domains in this manner permits the use of a sliding mesh approach to model rotation of the shuttlecock. Velocity flow inlet, and pressure flow outlet boundary conditions of the stationary domain were placed 5H upstream, and 12H downstream of the shuttlecock, respectively. The stationary domain outer walls were modeled with a slip condition. The rotating domain enclosure was set to be 1.5D and 2.3H. Inlet boundary conditions and corresponding rotational rates ω of the rotating domain can be seen in Table 1. Rates of rotation are based on values as obtained from Kitta [3], who measured ω for a free spinning Yonex shuttlecock with increasing Re.

2.3. Computational Approach

The study used ANSYS Fluent v19.1. Turbulence phenomena were resolved using a scale resolving delayed detached eddy simulation (DDES) model. This model was coupled with an underlying k-ω SST (shear stress transport) model, with the inclusion of Wilcox low Reynolds number terms [9], for near wall modeling. The governing equations and turbulence model were solved using non-iterative time advancement. This was implemented using a fractional step coupling of pressure and velocity, and a bounded second-order temporal discretization. Finite volume spatial discretization utilized comparable second-order methods. A time step of Ts = lmin/U where lmin is the minimum cell length, and U is the freestream velocity was applied for advancing the simulation. A time stepped solution is essential in shuttlecock simulation if a correct solution convergence is to be obtained [1].

2.4. Computational Grids

Computational grids were hybrid in construction and used a polyhedral-hexcore structure. The applied computational grid resolutions were based upon values identified [1] as necessary to obtain a grid independent solution of a feather shuttlecock. The shuttlecock therefore had a minimum polyhedral surface cell resolution of 0.1 mm and a maximum of 0.3 mm. Ten layers of prismatic boundary layer grids were constructed over the entire shuttlecock surface. The final grid size was 14.4 million elements, which is comparable to a tetrahedral-hexcore grid size required (21 million cells) to ensure sufficient scale resolution of synthetic shuttles [1].

3. Results & Discussion

Simulations were conducted over the range of Reynolds number (90,000 < Re < 271,000) with and without rotation. Time-averaged force coefficient values are presented in Figure 2a, in comparison to values obtained from wind tunnel investigation [2,3]. These values were obtained by averaging instantaneous force values over the normalized period 20 = TsU/D.
Drag coefficient can be seen to be largely independent of Re. The static shuttlecock had an average time-averaged drag coefficient of Cd = 0.76. When rotational motion was applied to the shuttlecock drag coefficient reduced to Cd = 0.73, a 4% reduction was found (experimental studies reported ~8% difference [2,3]). It should be noted that the shuttlecock feathers are rigid in this simulation, therefore D is constant, however as stated, no significant difference in D between rotating and static conditions was observed in experiment [3,4] until Re > 2.1 × 10⁵. Pressure drag was found to account for 95% of measured Cd for both conditions, and the contribution of each shuttle component was found independent of Re (~13.5% base, ~22% rachis, ~56.5% vanes, ~7.4% twine).
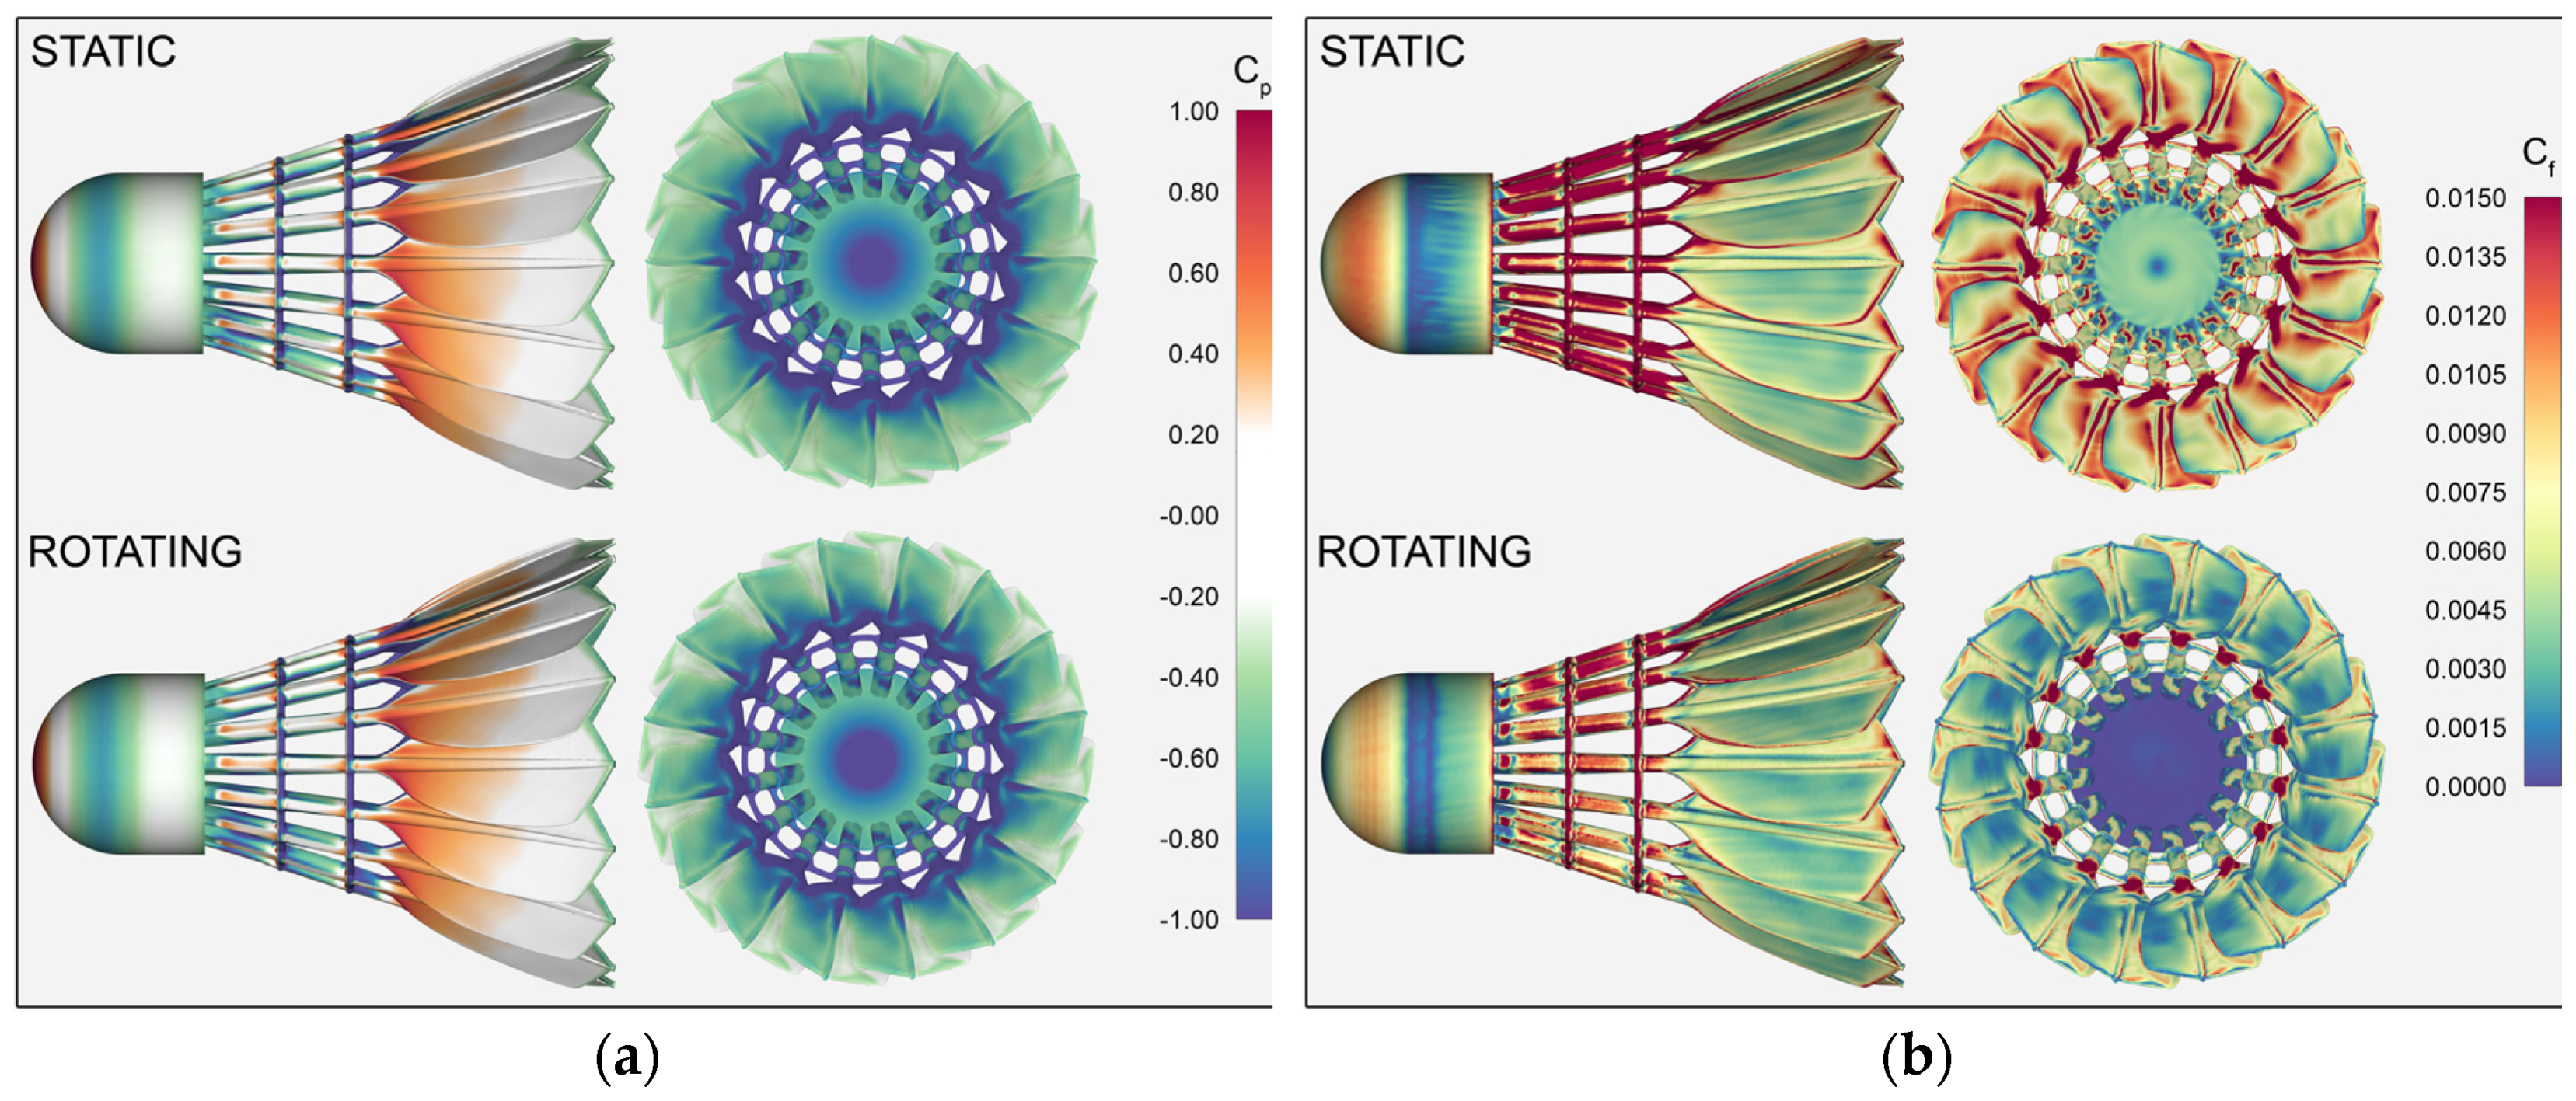
Applying rotation to the shuttlecock increased drag on the shuttlecock base by 1.1%, this increase is attributable to a decrease in pressure coefficient Cp acting on the aft of the base, Cp = −1.15 static, Cp = −1.46 rotating, as can be seen in Figure 2b at x = 0 and Figure 3a. As Cd and statistical surface values were found to be independent of Re, all results plotted herein are for Re = 2.7 × 10⁵. Plots of skin friction coefficient Cf are shown in Figure 3b. It can be seen that for the rotating condition, a lower Cf is evident on the domed portion of the base, followed by a clear band of flow separation and subsequent reattachment. A significant difference in Cf is visible on the aft of the base between the static and rotating conditions. When the shuttlecock is rotating, Cf values indicate a completely separated internal flow.
In contrast to the base, individual component drag is seen to reduce on the vanes, rachis, and twine, by approximately 5% when a rotational condition is applied. This again can be seen in Figure 2b, however the difference is too subtle to be clear in Figure 3a. Plots of skin friction coefficient Cf again however reveal a difference in the movement of flow across the rachis, and in particular on the vane surfaces internal to the shuttlecock. Flow movement across the internal vane surfaces appears to be separated when the shuttlecock is rotating. A lower value of Cf can also be seen between adjacent vane surfaces, suggesting a lower velocity passage of flow between the vanes.
The mean velocity flow field is shown in Figure 4, revealing the movement of flow internal to the shuttlecock, while clear differences in flow structure as indicated by plots of Cf are confirmed. A significant region of stagnant flow is visible behind the shuttlecock base for the rotating condition. Adjacent to this stagnant region, it can be seen that flow enters the shuttlecock between the base aft and the first twine band at a reduced velocity. A significant region of accelerated flow passing between the second band of twine and leading edge of the vane is still evident. Within this region, the pressure coefficient on the leading edge of the vane internal surface reduces to as low as Cp = −3.3.
For the static shuttlecock a thin region of high velocity flow is seen adjacent to the internal vane surface. This originates from flow external to the shuttlecock entering and accelerating between the adjacent vane surfaces, as indicated in Figure 3b. As a result, the separated circulating flow behind the vanes is offset from the vane surface. In contrast when the shuttlecock is rotating, this passage of fluid between adjacent vanes is no longer evident and a stronger region of circulating flow is seen to form behind the vane surface. The shape of the flow at the trailing edge of the vane is also seen to change, suggesting that the vortex roll up and separation in this region is altered.
Figure 5a shows center plane contours of instantaneous vorticity in the applicate (z) direction. It is clear the formation of the trailing edge vortices is indeed influenced by the rotation of the shuttlecock. The transient structures that from at this edge appear to extend less distance behind the shuttle and to breakdown quickly. Internally there appears to be little difference in the formation of the transient smaller scale structures, attributable to passage of flow through the shuttlecock rachis region.
The visualization of wake structures using the Q-criterion method [10] confirm the differences in flow that exist at the shuttlecock vane trailing edges, as seen in Figure 5b and Figure 6. Thin streamwise cores can be observed to roll up between adjacent vane surfaces when the shuttlecock is statically fixed. These can be seen to extend as distinct features a short distance behind the trailing edge before they begin to merge and roll up into larger structures. When the shuttlecock is rotating, these thin streamwise core structures are not observed to form, instead vortices are seen to originate across the length of the trailing edge at regular intervals from the internal vane surface. These quickly begin to merge into larger structures, as was suggested by the contours of instantaneous vorticity, Figure 5a. However, no other significant differences in vortical structures are observed within the large wake that extends behind the shuttlecock. Other differences can be seen in the formation of vortices around the shuttle between the static and rotating conditions. Small streamwise vortices are seen to roll up and traverse across the external surface of the vane when the shuttlecock is rotating. Whilst when the shuttlecock is statically fixed, vortices can be seen to spiral around the shuttlecock cylindrical section of the base, as swirling around this section is induced by the flow being drawn into the shuttlecock rachis region.

4. Conclusions

A computational fluid dynamics study of a geometrically realistic feather shuttlecock rotating about the longitudinal axis was presented in comparison to a statically fixed shuttlecock. The following main conclusions can be made:
  • The rotating shuttlecock was found to have a drag coefficient that is 4% lower than a statically fixed shuttlecock. Flow structures and therefore measured Cd, were clearly shown to be influenced by rotation, particularly aft of the shuttlecock base, at the vane trailing edges and across the vane surfaces.
  • The use of CFD in the visualization of the complex flow fields that are associated with shuttlecocks, and in the analysis of their performance has great potential. As CFD does not necessitate the use of an experimental sting, it does not compromise flow structure aft of the base. It is recommended that the use of experimental stings and the influence of their geometry within this region should be considered in future studies.

Conflicts of Interest

The authors declare no conflict of interest.

References

  1. Hart, J.H.; Potts, J.R.; James, D.J. Comparison of turbulence modelling approaches in simulation of a feather shuttle: A porous conical bluff body. Sports Eng. 2018, 21, 465–478. [Google Scholar] [CrossRef]
  2. Cohen, C.; Texier, B.D.; Quere, D.; Clanet, C. The physics of badminton. New J. Phys. 2015, 17. [Google Scholar] [CrossRef]
  3. Kitta, S.; Hasegawa, H.; Murakami, M.; Obayashi, S. Aerodynamic properties of a shuttlecock with spin at high Reynolds number. Procedia Eng. 2011, 13, 271–277. [Google Scholar] [CrossRef]
  4. Hasegawa, H.; Kitta, M.; Murakami, M.; Obayashi, S. Flow analysis and aerodynamic characteristics of a badminton shuttlecock with spin at high Reynolds number. Sports Eng. 2013, 16, 91–98. [Google Scholar] [CrossRef]
  5. Lin, C.S.H.; Chua, C.K.; Yeo, J.H. Aerodynamics of badminton shuttlecock: Characterization of flow around a conical skirt with gaps, behind a hemispherical dome. J. Wind Eng. Ind. Aerodyn. 2014, 127, 29–39. [Google Scholar] [CrossRef]
  6. Hart, J. Simulation and understanding of the aerodynamic characteristics of a badminton shuttle. Procedia Eng. 2014, 72, 768–773. [Google Scholar] [CrossRef]
  7. Verma, A.; Desai, A.; Mittal, S. Aerodynamics of badminton shuttlecocks. J. Fluids Struct. 2013, 41, 89–98. [Google Scholar] [CrossRef]
  8. Konishi, Y.; Matshushima, Y.; Misaka, T.; Okuizumi, H.; Tanaka, K.; Obayashi, S. Effect of camber on badminton shuttlecock. Procedia Eng. 2018, 2, 266. [Google Scholar] [CrossRef]
  9. Wilcox, D.A. Simulation of transition with a two-equation turbulence model. AIAA J. 1994, 32, 247–255. [Google Scholar] [CrossRef]
  10. Hunt, J.C.R.; Wray, A.A.; Moin, P. Eddies, streams, and convergence zones in turbulent flows. In Proceedings of Summer Program; Centre for Turbulence Research: Stanford, CA, USA, 1988. [Google Scholar]
Figure 1. (a) Modeled baseline shuttle geometry; (b) aft view of shuttle showing vane angle γ; (c) individual feather geometry, showing curve of feather and rachis cross-section.
Proceedings 49 00028 g001
Figure 2. (a) Measured drag coefficient vs Reynolds number; (b) Mean pressure coefficient Cp acting along shuttlecock, Re = 2.7 × 10⁵.
Proceedings 49 00028 g002
Figure 3. (a) Contours of mean Cp, Re = 2.7 × 10⁵; (b) contours of mean Cf, Re = 2.7 × 10⁵.
Proceedings 49 00028 g003
Figure 4. Visualization of centre plane mean velocity flow field, Re = 2.7 × 10⁵.
Proceedings 49 00028 g004
Figure 5. (a) Planar visualization of instantaneous vorticity in the applicate (z) direction, Re = 2.7 × 10⁵; (b) visualization of vortical structures using the Q-criterion [10] method, Re = 2.7 × 10⁵.
Proceedings 49 00028 g005
Figure 6. Visualization of vortical structures using the Q-criterion [10] method, Re = 2.7 × 10⁵.
Proceedings 49 00028 g006
Table 1. Boundary conditions.
ReU (m/s)Turbulence IntensityEddy Viscosity Ratioω (rpm)
9.0 × 104201%21146
1.8 × 105402569
2.7 × 105605013
Publisher’s Note: MDPI stays neutral with regard to jurisdictional claims in published maps and institutional affiliations.

