1. Introduction
There are between 1200 and 1500 new synthetic turf fields being installed every year in North America [
1]. With over 38 million youth playing organized sports in the U.S., many play on synthetic fields [
2]. The first generation synthetic turf did not have an infill, but in later generations, infill was added to enhance impact attenuation [
3]. Most third generation (3G) synthetic turf have fibers attached to a backing and a mixture of rubber crumb and sand infilled to a desired depth with a shock pad underneath [
3].
Several news reports in the U.S. have raised concerns over the safety of rubber crumb, seeing traditional rubber crumb as unacceptable based on the potential effects on human and environmental health [
4]. It is of note that several studies have been completed on rubber crumb finding that the carcinogens are within acceptable limits [
3]. This public concern over the potential danger of rubber crumb has increased interest in the use of alternative infills such as cork and coconut. Many of these alternative infills have been proven to help decrease surface temperature with varying levels of success [
5]. The potential for alternative infills to surpass standard is now becoming a possibility.
Research of alternative infills to rubber crumb has been limited to temperature. While temperature is an important aspect in overall performance of a synthetic system, information about how infills impact field performance is lacking. This study looks to explore the effects of different types of alternative infills on field performance. The objective of this study was to determine the effects of three alternative infills on athlete performance and safety in 3G synthetic fields. The authors’ hypothesis is finer particles with a better particle size distribution will improve athlete performance and field safety.
2. Materials and Methods
In the summer of 2017, a study was conducted at the University of Tennessee Center for Athletic Field Safety (Knoxville, TN, USA) to determine the impact of three alternative infills of various particle size on athlete performance and safety in synthetic turf. A split-plot randomized complete block design with three replications was used in this study. The whole plot was the synthetic turf system combination with a different infill. The sub-plot was the application of traffic at different rates.
All plots were constructed on a gravel base using a 1.47 kg per m
2, 3.8 cm pile height 3G turf with an extruded rubber shock pad. The three different infill treatments used in this study were: Thermoplastic elastomer (TPE), coconut and cork mixture, and recycled Nike shoe rubber (Nike Grind Nano Infill (Nano)). All infill treatments were applied to the same depth at installation (35 mm). The particle size analysis is described in
Table 1 for all infill treatments.
Whole plots were 4.5 by 9 meters with the sub-plot being 1.5 by 4.5 m. Each plot and subplot were replicated three times throughout the study. Traffic was applied using a CAFS traffic simulator at a rates of 1, 5 or 10 traffic events per week for 12 weeks [
6]. No synthetic turf maintenance was applied throughout the study.
Data was collected before traffic initiation and at the end of the study. Six different types of test were collected: surface hardness, head injury criterion (HIC), infill depth, energy restitution, force reduction, and rotational traction. Surface hardness was collected using the F355-A missile following ASTM standard at three locations per subplot [
7]. A F355-E testing device was used to quantify Head Injury Criterion [
8]. The HIC values were collected from 1.3 m height at nine locations per sub plot. The HIC critical threshold of 1000 was established as the critical limit for this study corresponding with the ASTM standard [
8]. The higher the drop height that 1000 HIC was reached, the safer the surface was for potential head injuries.
Infill depth was collected at nine locations per subplot using a digital handheld infill depth gauge with three prongs (Canadian Playground Advisory Digital Infill Depth Gauge, Canadian Playground Advisory, Inc, Cambridge, ON). Energy restitution and force reduction were collected using an advanced artificial athlete (Triple A Tester, Deltec, Duiven, The Nethernlands) in three locations per plot. Rotational traction was collected with rotational resistance tester (Deltec, Duiven, The Nethernlands) in 6 locations per plot. Analyses of variance were conducted in SAS (v. 9.3; SAS Institute Inc., Cary, NC, USA). Data from this study was analyzed as a split-plot randomized complete block design in SAS (v 9.4). Comparison of means and the interaction of means were considered significant at α = 0.05. Correlations were calculated in GraphPad Prism 6.
3. Results
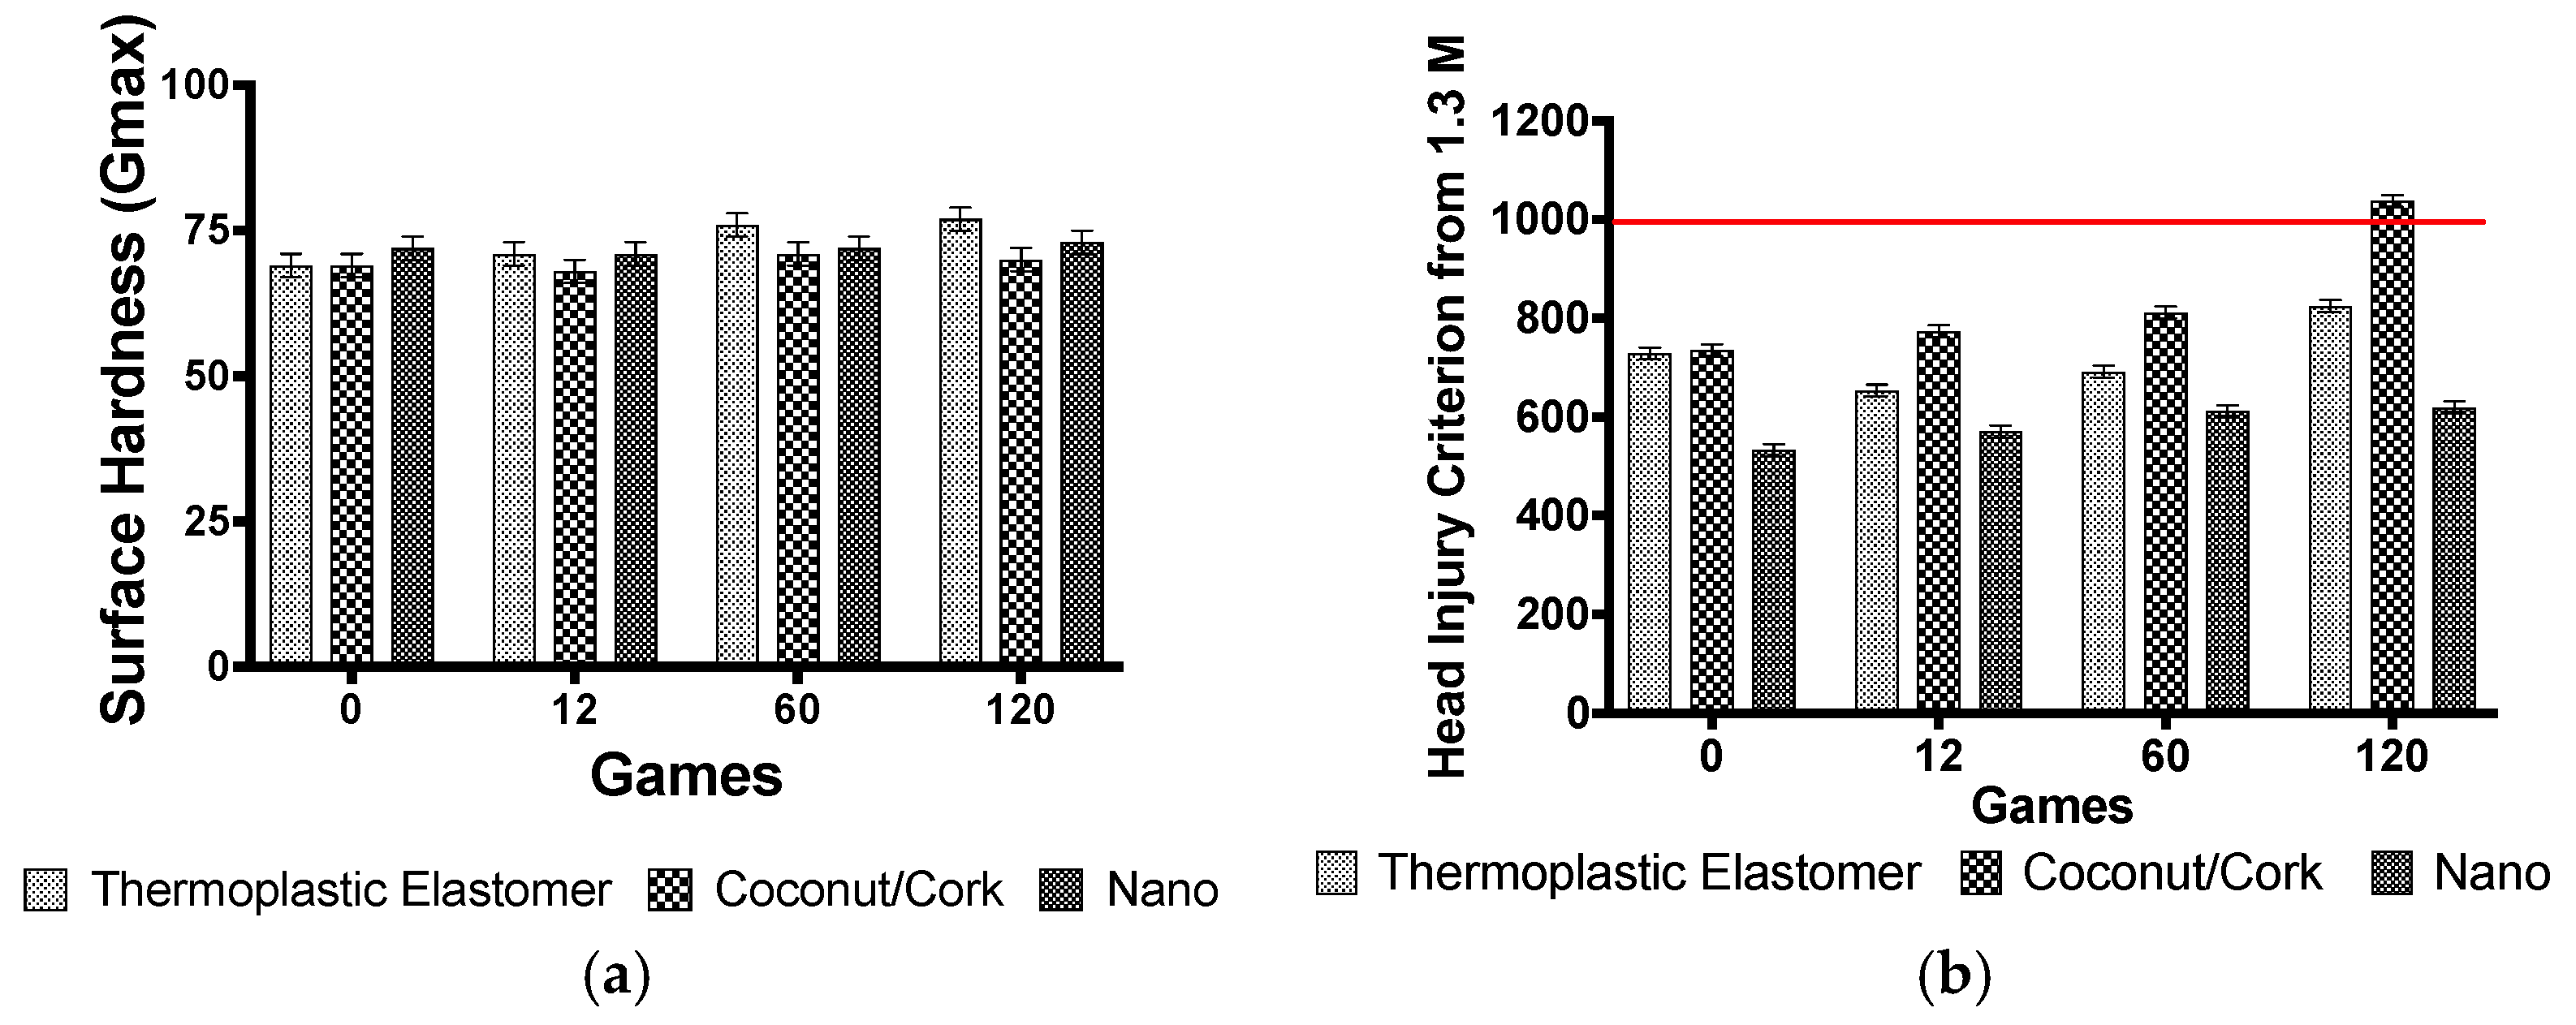
A surface hardness by traffic level effect was significant for surface hardness (
Table 2) (
Figure 1). Prior to study initiation, all plots had statistically different initial surface hardness values (
Figure 1).
As games increased the surface hardness increased for the TPE while coconut/cork and Nano remained stable. No differences were observed in coconut/cork and Nano throughout the study (
Figure 1). A negative inverse relationship was found between surface hardness and infill depth. While all plots were below the ASTM standard of 265 Gmax and acceptable for play, differences were detected within that range.
There was an infill by game interaction for HIC (
Table 2). The coconut/cork infill had the highest HIC reaching over 1000 HIC at the 120 games (
Figure 1). After game zero, the coconut/cork mixture had the highest HIC as number of games increased. The Nano infill throughout all games had the lowest HIC (
Figure 1). A greater variation was observed in TPE for HIC compared to the other infills as games were applied. The TPE was the only treatment to have HIC decrease then rise after traffic was applied (
Figure 1). Traffic significantly impacted infill and HIC results. No relationship was established with HIC and infill depth in this study, but there was a general negative trend and weak correlation.
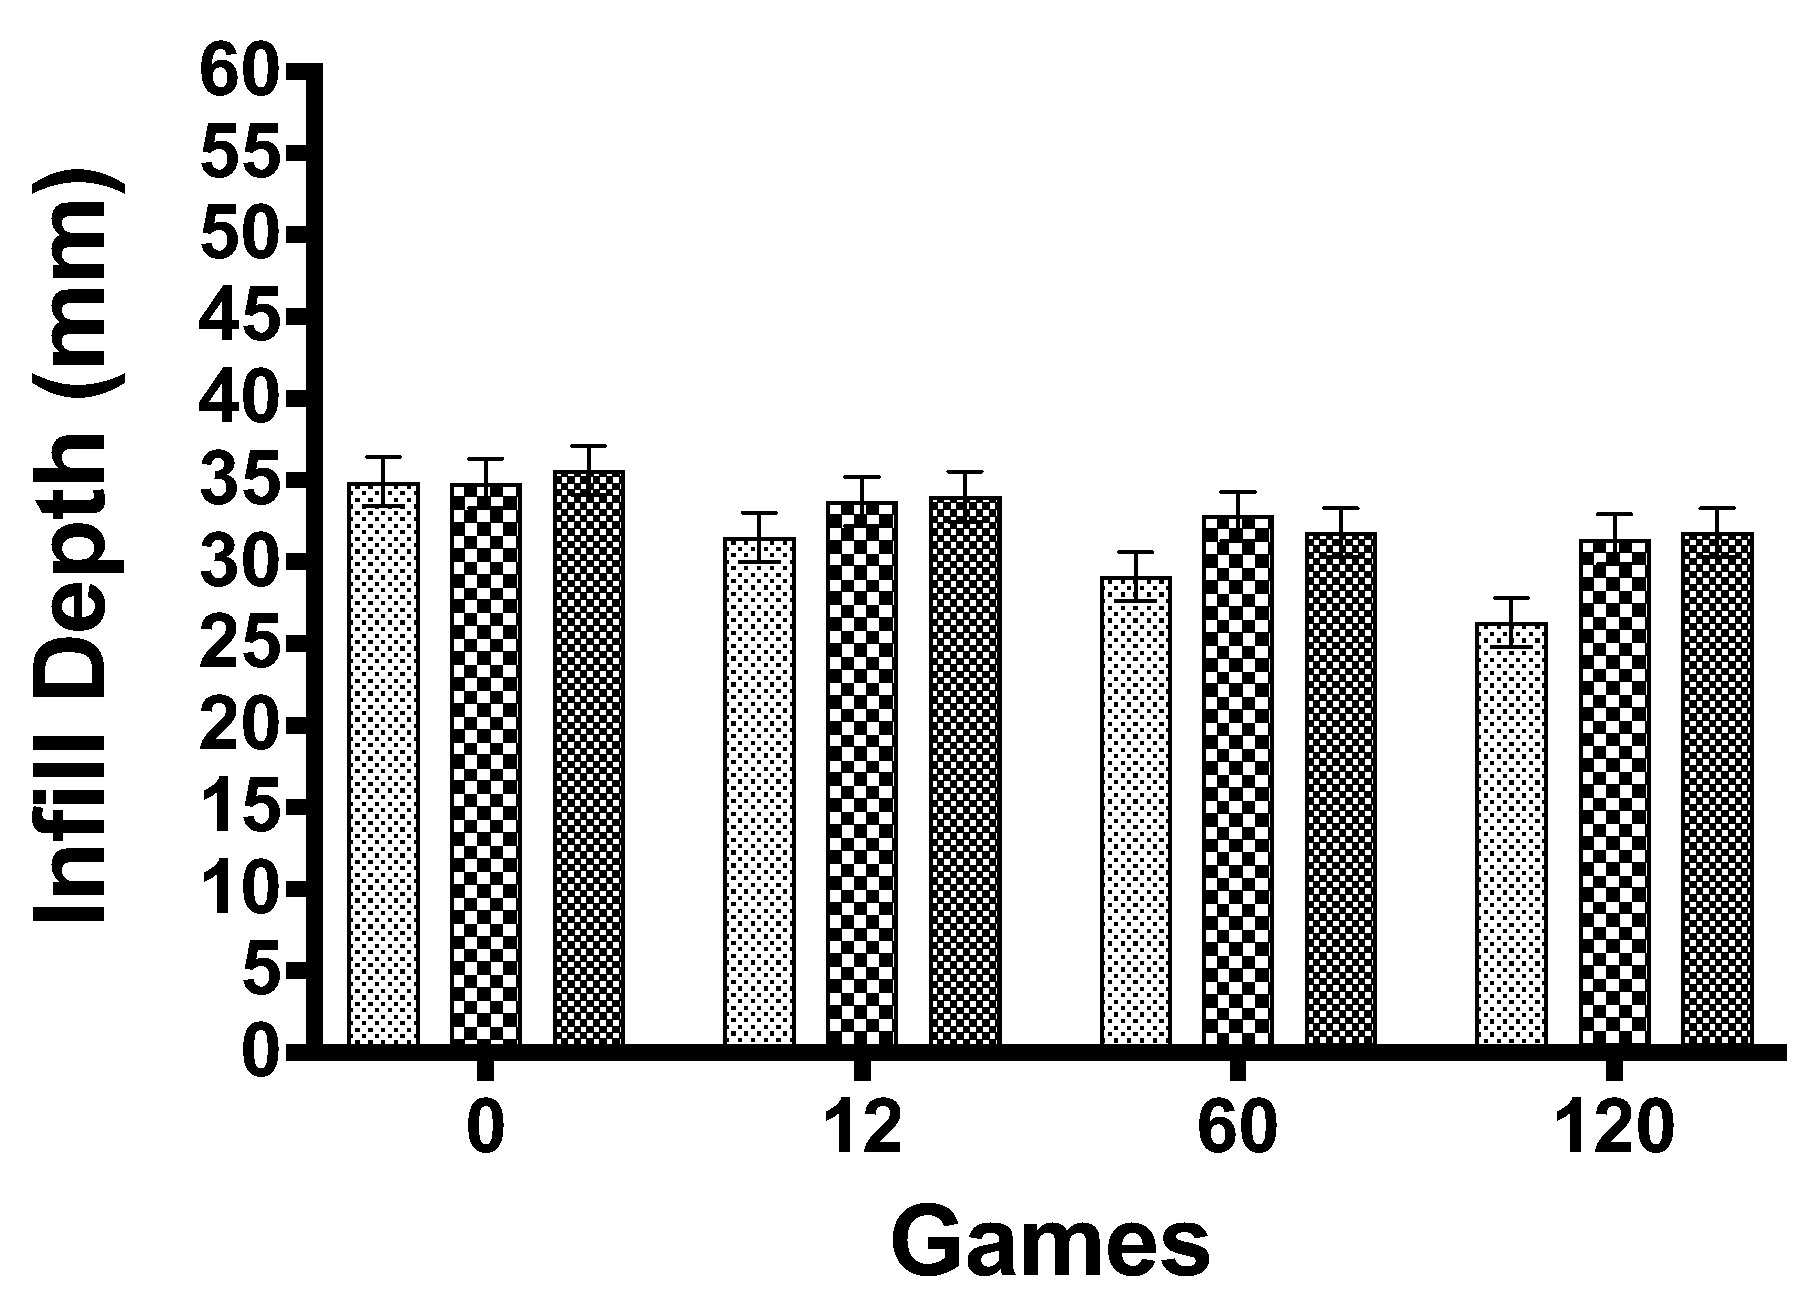
An infill by game interaction was found to be significant (
Table 2). There was a negative trend between infill depth and traffic as all infills decreased in depth as number of games increased (
Figure 2). The TPE lost the greatest amount of infill in the study (
Figure 2). The coconut/cork and Nano treatments lost infill but were not significantly different from each other. A decrease in infill depth of nine millimeters was found in the TPE, while coconut/cork and Nano lost three millimeters each from game 0 to 120.
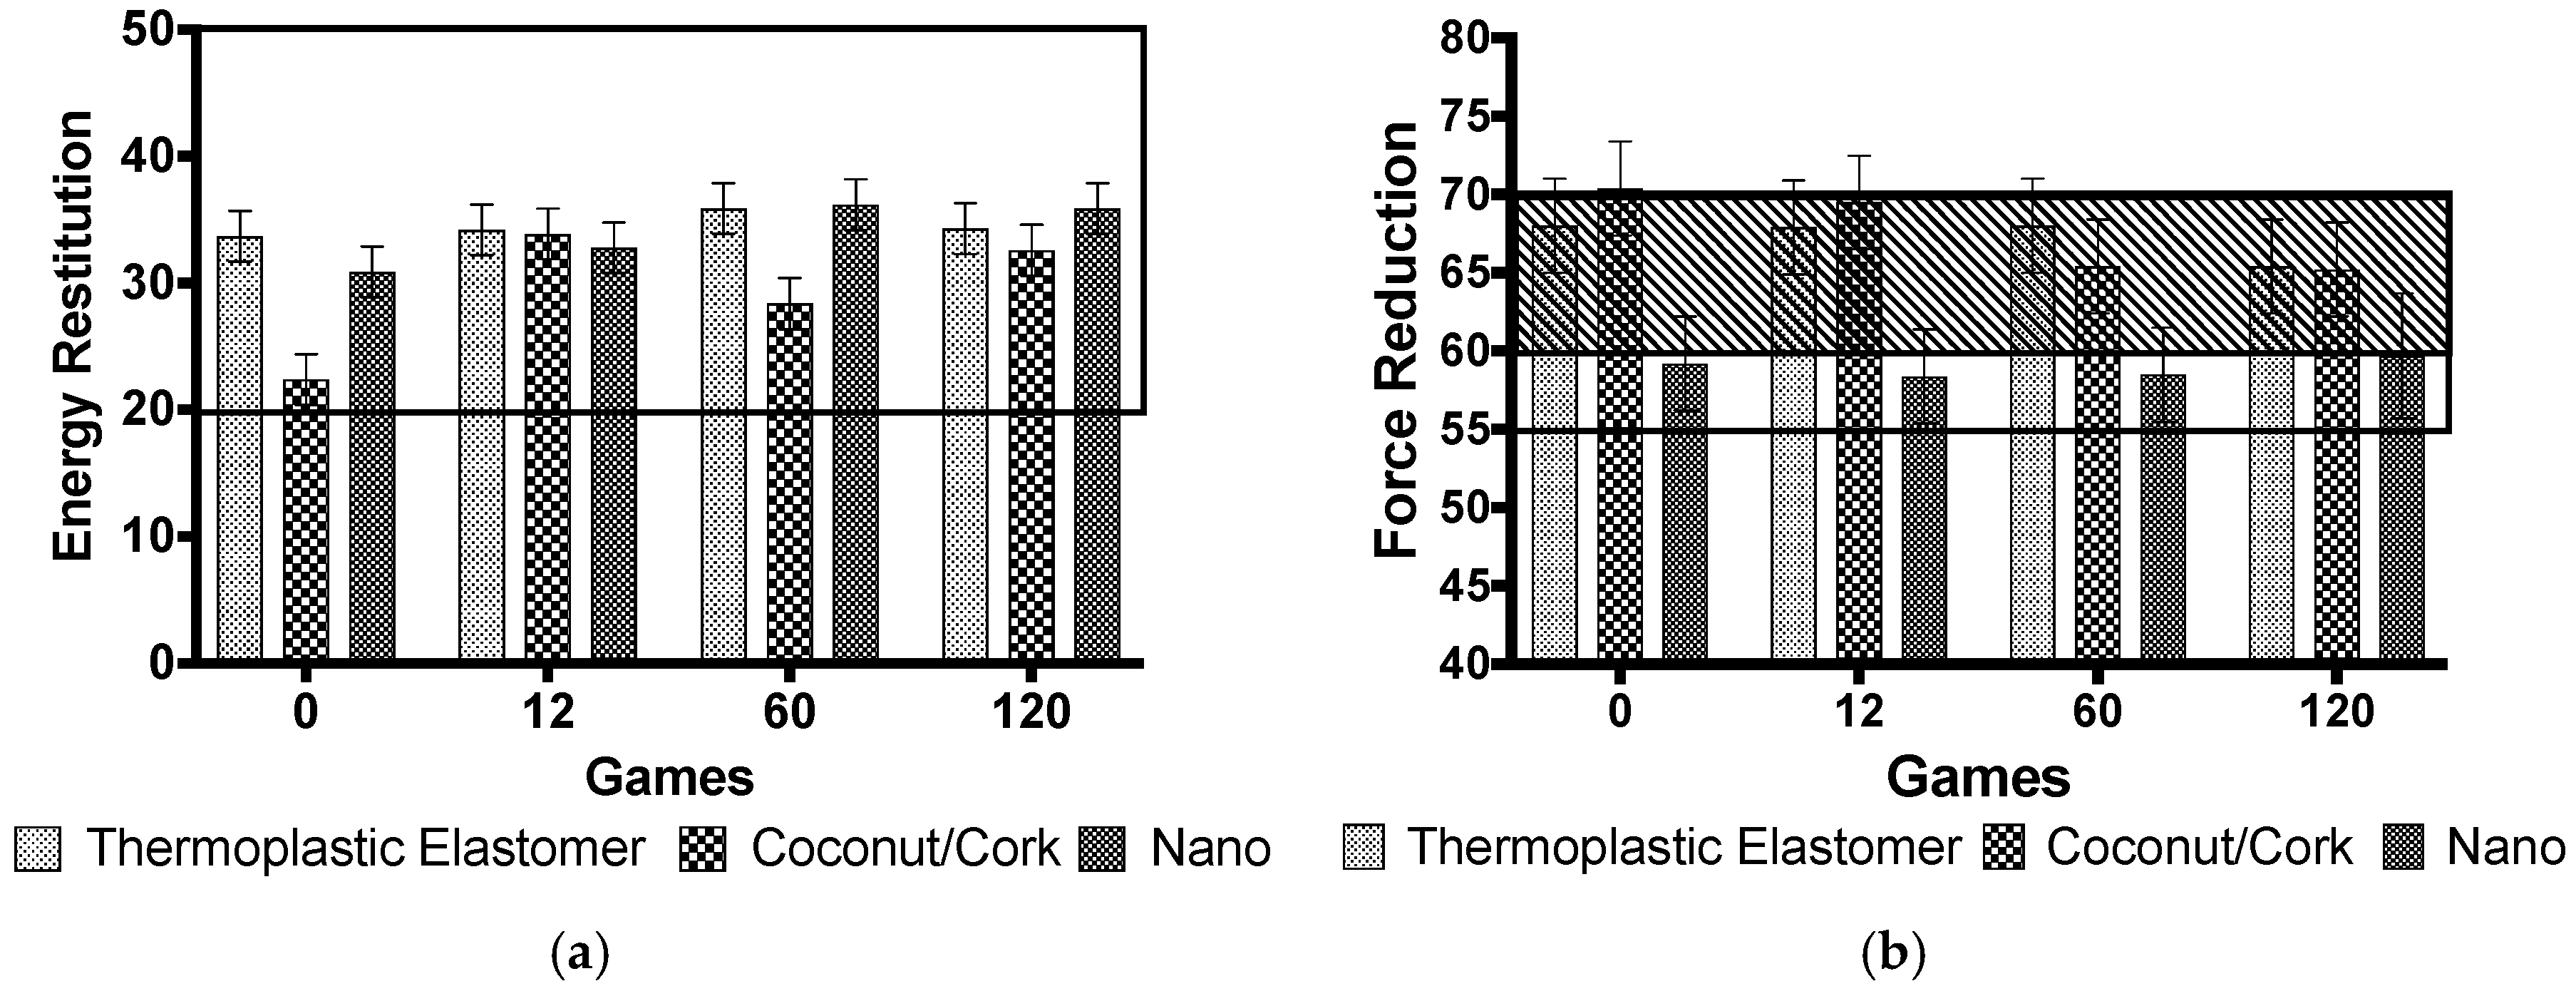
Energy restitution had a significant game by infill interaction. The coconut/cork infill had the lowest energy restitution before the start of traffic and after 60 games (
Figure 3). While differences were detected, all infills were within the FIFA 2 star requirements. Infill type was the only significant main effect for force reduction (
Table 2). The TPE and coconut/cork infills behaved the same and were not significantly different at any point throughout the study (
Figure 3). However, Nano was the lowest across all ranges of traffic (
Figure 3). No relationship was detected between force reduction and infill depth.
Rotational traction had a significant infill by game interaction (
Table 2). The Nano provided the highest rotational traction on all levels of traffic, and the coconut/cork treatment consistently had the lowest traction (
Figure 4). The rotational traction of all plots decreased as games increased, and a negative relationship between rotational traction and infill depth was established.
4. Discussion
Due to the inherent characteristics of each infill, differences in surface hardness were expected. While differences were found in this study, the range of the differences would have minimal impact on athletes since all data was found to be under the 200 Gmax range of the ASTM. The strong inverse relationship between infill depth and surface hardness shows the importance of infill maintenance.
When looking at HIC, with lower numbers representing a potentially safer surface for the head, Nano was the top performer. These results were attributed to the finer and more well-graded particles working into the surface and interlocking together. The coarser particles of the coconut/cork and TPE did not integrate into the surface as quickly and were not able to interlock as well as the Nano. The TPE had 98% of all its particles being within the 1.0–0.5 mm range, and all of the particles were spheres that bounced off each other easily. As traffic was applied, the TPE, from visual observations, bounced higher and easily moved compared to the Nano or coconut/cork.
Energy restitution again showed the variability of the properties of infills. While differences exist, limited differences would be noticed due to meeting the FIFA 2 star rating. Force reduction demonstrated a similar trend as energy restitution. While Nano was low overall, it was still within FIFA 2 star requirements. The Nano infill provided the greatest rotational traction among the treatments. The superior performance of Nano was attributed to the particle size distribution. Nano infill had the greatest particle size diversity, which translated to the greatest amount of rotational traction. The coconut/cork mixture had the lowest rotational traction suggesting the inherent properties had a large impact on the result and coarse particles did not do as well for this test.
The results of this study identified differences among infills which impacted athletic field performance characteristics. A field would behave differently with each of the three different infills tested, emphasizing that having the correct infill is key. The properties of the alternative infills will vary and impact the play of a surface. These results suggest that using a finer particle with a good particle size distribution will increase performance of an 3G athletic field. Potentially, traditional recycled car tires of a finer particle size could be as good as recycled shoes but at a lower cost.
This study has identified different performance characteristics of three synthetic turf infills in a 3G system; however, some areas were beyond the scope of the studies such as comparing all of these alternative systems to rubber crumb infill and rubber crumb of finer mesh. Also, this study did not determine any potential toxicity of these infills or the human health risk posed. Temperature was outside the scope of this study as well since previous work had been completed on the subject.
5. Conclusions
Selecting an infill material has been shown to be critical in the performance of a 3G synthetic turf system. This study found that alternative infills do impact the safety and performance of a field and showed a variation of performance properties among the alternative infills. The results of this study indicate that particle size and distribution of the infill play a key role the performance of a synthetic turf. The smaller particle and well graded infills provided the optimal performance in this study. This study suggests that the type of infill is just as important as the fiber and backing of synthetic turf.


